
Swedbank Economic Outlook - 2010, September 21
29
Swedbank Analyses the Swedish and Baltic Economies September 21, 2010 September 21, 2010 1 Swedbank Economic Outlook Calmer waters for now – but headwinds on the horizon Global development • The outlook for global GDP-growth has been revised up to 4.4% for 2010, mainly due to a stronger rebound than expected in April in Germany , Japan and emerging markets. • After the inventory-led bounce back, industrial countries will continue to muddle through as deleveraging in the private sector continues and scal consolidation is intensied. Thus, global GDP growth dampens to 3.6% in 2011, before improving slightly in 2012 to 3.8%. Sweden • The economy has rebounded strongly in 2010, mainly on account of export growth, inventory restocking and public spending. The election result, with a possible minority government, creates uncertainties in the short run. At the same time, the medium-term economic situation is stable, although policy implementation can become complicated. • We revise up our forecast for 2010 to 4.0%, after which the pace of expansion is set to slow in 2011 and 2012 as global demand weakens. The main risks are deteriorating external conditions, a domestic political crisis and increasing debt levels of Swedish households. Estonia • Stronger exports support economic growth, as well as increasingly also EU-funded infrastructure and machinery investments. Due to high unemployment and weak incomes, household spending will remain cautious. GDP-growth is expected at 2.2% this year, before increasing to 4.5% in both 2011 and 2012. • Estonia’s adoption of the euro is expected to lower risks and improve business activity in the medium term. The scal situation continues to be favourable, with a small and declining budget decit. Supply shortages on the labour market could add to ination pressures. Latvia • Economic growth in the rst half of 2010 was stronger than expected, supported by restocking, export growth, and stabilization in household consumption as employment and incomes started to recover in the second quarter. • We raise our outlook for GDP growth in 2010, but recovery is still uneven across sectors and growth fragile. Growth in 2011-2012 will depend on the structural reforms, which will take a clearer form after the parliamentary elections on October 2. Lithuania • After a weak rst quarter, the economy rebounded strongly in the second quarter of 2010 on the back of a rapid recovery of exports. Domestic demand, however, remained under pressure. • Given better-than-expected developments in the second quarter, we raise our forecast and expect GDP to grow by 0.5% this year. The economy is expected to expand by 3% in 2011, and 4.5 % in 2012, driven by net exports and a gradual recovery of domestic demand. Table of Content: Introduction: Economic recovery in place - high time to step up the reform process! 2 Global: ”It’s not over yet” 4 Sweden: Strong Rebound - economic and political challenges remain 6 Estonia: Structural change to continue 13 Latvia: Uneven and still fragile recovery 18 Lithuania: First steps on the long and winding road to recovery 23
-
Upload
swedbank-ab-publ -
Category
Documents
-
view
216 -
download
0
Transcript of Swedbank Economic Outlook - 2010, September 21

8/8/2019 Swedbank Economic Outlook - 2010, September 21
http://slidepdf.com/reader/full/swedbank-economic-outlook-2010-september-21 1/29
Swedbank Analyses the Swedish and Baltic Economies September 21, 2010
September 21, 2010 1
Swedbank Economic Outlook
Calmer waters for now – but headwinds on the horizonGlobal development
• The outlook for global GDP-growth has been revised up to 4.4% for 2010, mainly due to a stronger rebound than expected in April inGermany, Japan and emerging markets.
• After the inventory-led bounce back, industrial countries will continueto muddle through as deleveraging in the private sector continues andscal consolidation is intensied. Thus, global GDP growth dampens to
3.6% in 2011, before improving slightly in 2012 to 3.8%.
Sweden• The economy has rebounded strongly in 2010, mainly on account of
export growth, inventory restocking and public spending. The electionresult, with a possible minority government, creates uncertainties inthe short run. At the same time, the medium-term economic situation isstable, although policy implementation can become complicated.
• We revise up our forecast for 2010 to 4.0%, after which the pace of expansion is set to slow in 2011 and 2012 as global demand weakens.The main risks are deteriorating external conditions, a domesticpolitical crisis and increasing debt levels of Swedish households.
Estonia• Stronger exports support economic growth, as well as increasingly
also EU-funded infrastructure and machinery investments. Due to highunemployment and weak incomes, household spending will remaincautious. GDP-growth is expected at 2.2% this year, before increasingto 4.5% in both 2011 and 2012.
• Estonia’s adoption of the euro is expected to lower risks and improvebusiness activity in the medium term. The scal situation continuesto be favourable, with a small and declining budget decit. Supplyshortages on the labour market could add to ination pressures.
Latvia• Economic growth in the rst half of 2010 was stronger than expected,
supported by restocking, export growth, and stabilization in householdconsumption as employment and incomes started to recover in the
second quarter.
• We raise our outlook for GDP growth in 2010, but recovery is stilluneven across sectors and growth fragile. Growth in 2011-2012 willdepend on the structural reforms, which will take a clearer form after the parliamentary elections on October 2.
Lithuania• After a weak rst quarter, the economy rebounded strongly in the
second quarter of 2010 on the back of a rapid recovery of exports.Domestic demand, however, remained under pressure.
• Given better-than-expected developments in the second quarter, weraise our forecast and expect GDP to grow by 0.5% this year. Theeconomy is expected to expand by 3% in 2011, and 4.5 % in 2012,driven by net exports and a gradual recovery of domestic demand.
Table of Content:
Introduction: Economic
recovery in place - high time to
step up the reform process! 2
Global: ”It’s not over yet” 4
Sweden: Strong Rebound
- economic and political
challenges remain 6
Estonia: Structural change to
continue 13
Latvia: Uneven and still fragilerecovery 18
Lithuania: First steps on the
long and winding road to
recovery 23

8/8/2019 Swedbank Economic Outlook - 2010, September 21
http://slidepdf.com/reader/full/swedbank-economic-outlook-2010-september-21 2/29
2 September 21, 2010
Swedbank Economic Outlook
youth unemployment will stay high.
Therefore, the labour market remains
the main political challenge next
parliamentary term. This is made
more complicated by the lack of
majority in the Riksdag. Although we
do not expect a chaotic parliamentary
period, policy making will not be as
straight forward. A solid scal situation
makes further stimulus possible, but
we expect the policy mix to be less
tilted towards supply side measures.
Instead, there could be further stimulus
measures through increased spending,
but since all main parties agree on the
importance of sound budget policies,
the budget decit is likely to be kept in
check through revenue measures. As
the rebound effects fade and global
growth dampens somewhat, Swedish
exports will grow at a slower pace
during 2011 and 2012. We expect the
Riksbank to continue to raise the policy
interest rate, which will reach 3% at the
end of 2012. Thus, highly leveraged
households will become more cautiousas consumers. All in all, GDP growth
will dampen to 2.4% in 2011, and, as
export performance improves during
2012, the slower consumption growth
will be offset by better net exports, and
GDP will increase by 2.9% in calendar-
adjusted terms.
Estonia’s GDP growth in 2010 has
also been revised upwards, from
1.5% in the April forecast to 2.2%,
due to the stronger global demand,
improving export performance, andstrengthening recovery of the domestic
economy. GDP growth is projected
to increase to 4.5% in both 2011 and
2012. The main driving forces going
forward are exports and investments,
but households will also start to raise
consumption, although at a slow pace
as the labour market continues to
be weak. During the forecast period,
unemployment will fall substantially,
from just below 18% to about 12%,
but challenges remain as wagegrowth could pick up in some sectors
where there are supply shortages,
reinforcing the image of, on the one
hand, a “muddling-through” scenariofor the industrial countries, and,
on the other, emerging markets as
the real force of demand during the
forecast period, i.e., 2010 – 2012. The
combination of low growth and low
ination in the industrial countries – or
deation, as in Japan – makes central
banks reluctant to increase policy rates
as long as scal policy is made less
expansionary. In emerging markets,
there is still a risk of overheating and
high ination, but a soft landing is our main scenario, adding to the positive
view of a continuation of the global
recovery in 2011 and 2012, albeit at a
more moderate pace.
Sweden showed a strong rebound
in economic activity in the rst half
of 2010, driven by stronger exports
and by increased domestic demand,
including inventory restocking and
household consumption. GDP in
calendar-adjusted terms is expected
to grow by 4% this year, which is asubstantial upward revision from the
April forecast. The rebound can be
considered to be broad as investments
are also picking up, not least in the
residential sector. The labour market
has started to improve as employment
grows, and unemployment is set to
fall during the next couple of years;
however, the rate will not fall below 8%
until the end of the forecast period, and
The recovery of the Swedish and Baltic
economies is taking hold, as growthrates have been revised up for 2010
and are expected to remain positive
also in 2011 and 2012. The Nordic-
Baltic export-oriented economies are
highly dependent on global demand.
At the same time, this region sees
the need to achieve strong budget
discipline and competitiveness in order
to handle its increased vulnerability
– which was revealed not least by
how these countries were negatively
affected in different ways by theglobal nancial crisis and the “great”
recession.
Economic growth in Sweden and the
Baltic countries has been supported by
a strong rebound in their main export
markets so far during 2010. Because
global demand is now set to grow
somewhat more slowly during the rest
of the year, and beyond – as stimulus
effects fade and the restocking
process ends – export growth is falling
back, although remaining an importantgrowth impetus. In many parts of
Europe, the sovereign debt crisis will
weaken growth as austerity measures
are being introduced. Also in the US
and Japan, the private sectors have
had difculties in taking over as the
main growth engines when stimulus
measures have been withdrawn. In
order to sustain the recovery, new
measures are being introduced,
Introduction
Economic recovery in place – high time to step upthe reform process!
Macro economic indicators, 2009- 20122009 2010f 2011f 2012f
Real GDP growth, annual change in %Sweden (calender adjusted) -5.0 4.0 2.4 2.9Estonia -13.9 2.2 4.5 4.5Latvia -18.0 -1.5 3.0 4.2Lithuania -14.8 0.5 3.0 4.5
Unemployment rate, % of labour force
Sweden 8.3 8.5 8.4 8.2Estonia 13.9 17.8 15.5 12.5Latvia 16.9 19.5 17.5 15.5Lithuania 13.7 17.0 15.5 14.0
Consumer price index, annual change in %
Sweden -0.3 1.2 2.0 2.7Estonia -0.1 2.6 3.0 3.5Latvia 3.5 -1.2 1.5 2.5Lithuania 4.5 1.0 1.0 1.5
Current and capital account balance, % of GDP
Sweden (current account) 7.2 6.4 6.3 6.4Estonia 7.3 6.0 5.3 3.5Latvia 12.0 8.6 5.5 3.1Lithuania 7.2 4.2 3.0 2.8
Sources: National statistics authorities and Swedbank

8/8/2019 Swedbank Economic Outlook - 2010, September 21
http://slidepdf.com/reader/full/swedbank-economic-outlook-2010-september-21 3/29

8/8/2019 Swedbank Economic Outlook - 2010, September 21
http://slidepdf.com/reader/full/swedbank-economic-outlook-2010-september-21 4/29
4 September 21, 2010
Swedbank Economic OutlookGlobal
The global economy: “It’s not over yet”
The recovery in the world economy
continues as emerging markets drive
growth while advanced countries
muddle through. However, global
conditions give mixed signals.
Financial markets were somewhat
calmed by the results of the stresstests performed on European banks
in July, and by Germany’s positive
growth in the second quarter. At the
same time, interest spreads of the
PIIGS countries (Portugal, Ireland,
Italy, Greece, and Spain) have risen
to earlier high levels, and the US
economy has slowed as stimulus
effects fade and the bounceback due
to inventory building is over.
Global conditions have thus
improved from last year, but theglobal economic crisis is not yet over
as the challenges of private sector
deleveraging, budget consolidation,
and weak labour and housing markets
continue to disturb the recovery in
advanced economies. The major risks
going forward are the sovereign debt
crises in parts of Europe and their
linkages to the banking sector, as
well as the concerns about deation
not only in Japan, but also in the US
and Europe. If emerging markets are
not able to manage a soft landing in
the struggle against overheating, the
global growth outlook will be at risk,
as many export-oriented advanced
economies are supported by high
growth in Asia, Latin America, and the
Middle East. The adverse scenarios
include a new recession (a double
dip) and a Japanese-type scenariowith low growth and deation in
the advanced economies. These
scenarios are viewed as less likely to
materialize and are given probabilities
of 10% and 25%, respectively.
There is also a more positive growth
scenario, to which we have given
a probability of 15%, driven mainly
by higher investments in the private
sector. If condence increases, the
liquidity in companies and banks
would be put to use, stimulating
domestic demand and improving labor
markets. This scenario would also
see faster price increases, raising
concerns about ination in a medium-
term perspective.
Our main global scenario (with a 50%
probability) is a “muddling-through”scenario characterized by moderate
growth – somewhat slower during
2011 but with a slow pickup in 2012.
Fewer possibilities for new stimulus
packages and a more restrictive scal
policy will dampen growth. Global
GDP growth has been revised up
to 4.4% this year from 4% in the
spring forecast, as the bounceback of
growth after the recession has been
more pronounced than expected. In
2011, growth will slow to 3.6% but
GDP forecast 2010 - 2012 (annual percentage change) 1/
-10
-5
0
5
10
15
2006 2007 2008 2009 2010
Real GDP growth rates (annual in %)
Brazil China Eurozone India Japan USSources : National statisticalauth orites.
September April
2009 2010 2011 2012 2010 2011 2012US -2.6 2.8 2.2 2.5 2.8 2.2 2.5
EMU countries -4.1 1.4 1.1 1.6 0.9 1.3 1.9
Of which: Germany -4.7 3.0 1.4 1.7 1.3 1.5 2.0
France -2.6 1.3 1.5 1.7 1.5 1.8 2.2
Italy -5.0 0.5 0.9 1.3 0.6 1.0 1.5
Spain -3.7 -0.7 0.5 1.6 -0.5 0.7 1.7
UK -4.9 1.1 1.6 1.9 1.1 1.6 2.2
Japan -5.2 3.2 1.4 1.5 2.0 1.4 1.5
China 8.9 9.8 8.5 8.1 9.5 8.8 8.0
India 5.7 8.0 7.5 7.8 7.5 7.8 8.0
Brazil -0.2 7.2 5.0 5.0 4.7 4.5 5.7
Russia -7.9 4.3 4.5 5.0 4.3 4.5 5.0
Global GDP in PPP -0.7 4.4 3.6 3.8 4.0 3.7 3.9
Global GDP in US$ -2.0 3.5 2.8 3.1 3.1 2.9 3.2
Sources: National statistics authorities and Swedbank.
1/ Countries representing around 70 % of the global economy. The World Bank weights from 2009 (purchasing
power parity, PPP) have been used.

8/8/2019 Swedbank Economic Outlook - 2010, September 21
http://slidepdf.com/reader/full/swedbank-economic-outlook-2010-september-21 5/29
September 21, 2010 5
Swedbank Economic OutlookGlobal
will increase to 3.8% in 2012 – 0.1
percentage point lower in both years
than in the previous forecast.
Economic policymakers are now
struggling with large uncertainties
and fewer policy options. If low or
negative growth were to remain,
more stimulus measures would
be needed, and thus also a longer
wait before interest rates could be
raised. The amount of quantitative
easing would then also have to be
increased. Also, a restrictive scal
policy in larger economies such as
Germany, Japan, and the US would
have to be postponed. If the recovery
continues as expected and the risk
of a new recession and/or deation isreduced, monetary policy can slowly
become less expansionary as budget
consolidation is stepped up. In our
main scenario, we now expect the
US Federal Reserve and the Bank of
England to start raising policy interest
rates at the end of 2011, while the
European Central Bank waits until
2012 and Bank of Japan keeps policy
rates unchanged throughout the entire
forecast period. We expect that long-
term bond rates will remain low andonly slowly pick up as growth and
ination increase at a similar slow
pace.
We foresee a stronger US dollar
against the euro and the yen as the
US economy grows faster and policy
rates are raised earlier than in the
euro area and in Japan. The strong
yen will continue this year as central
banks and others diversify currency
portfolios; however, when condence
in the US dollar slowly increases, the
yen will weaken. Even though China’s
administration made the exchange
rate more exible in June, the yuandepreciated against the dollar during
August as the euro weakened;
nevertheless, we expect the yuan’s
appreciation against the US dollar
to continue slowly over the forecast
horizon.
With the global recovery in place, the
oil price will increase but not as fast
as during last year’s bounceback.
The average oil price during 2010 is
expected to be US$78.5 per barrel
(US$75 in the spring forecast), andUS$82 in 2011 and US$90 in 2012.
Also, metal prices will continue their
upward trend, albeit more slowly than
during 2009. Higher food prices are
expected, as wheat prices are affected
partly by shortages due to the res in
Russia. The stock situation, however,
is much better now than during the
supply shock of 2008.
The muddling-through scenario is a
positive outlook when the challenges
in the world economy are considered.The medium-term outlook for
advanced economies is not so bright,
however, as private deleveraging
and sovereign debt reduction will
weaken growth for many years to
come. In addition, demographics and
increasing welfare costs will cause
scal and economic risks. The debt
situation is better in many parts of
the emerging markets, including
Asia, Latin America, and eastern
and central Europe, which means
a faster convergence of advanced
and emerging economies in coming
years. For the advanced countries,especially in Europe, but also US and
Japan, structural reforms will be of the
utmost importance, as higher growth
will ease the deleveraging process.
The main policy focus must therefore
be on measures that can support the
increase in productivity growth and
participation on labour markets. For
the EU, the functioning of the single
market has room for improvement, not
least in the services sector. Enhancing
the incentives for innovation andentrepreneurship has never been
more important than now!
Cecilia Hermansson
Interest and exchange rate assumptions
Outcome Forecast20 Sep
201031 dec
201030 Jun
201131 Dec
201130 jun2010
31 Dec2012
Policy rates
Federal Reserve, USA 0.25 0.25 0.25 1.25 2.25 2.75
European Central Bank 1.00 1.00 1.00 1.25 1.75 2.75
Bank of England 0.50 0.50 0.75 1.25 2.25 2.75
Bank of Japan 0.10 0.10 0.10 0.10 0.10 0.25
Exchange rates
EUR/USD 1.31 1.30 1.26 1.23 1.18 1.15
RMB/USD 6.70 6.70 5.70 6.60 6.40 6.00
USD/JPY 86 87 90 92 95 100
Sources: Reuters Ecowin and Swedbank.

8/8/2019 Swedbank Economic Outlook - 2010, September 21
http://slidepdf.com/reader/full/swedbank-economic-outlook-2010-september-21 6/29
6 September 21, 2010
Swedbank Economic OutlookSweden
Sweden: Strong rebound - economic and politicalchallenges remain
A strong rebound in economic activity
in the rst half of 2010 suggests that
the recovery of the Swedish economy
is well underway; however, the election
result, with no clear majority in the
parliament, could complicate policy
implementation. The rebound follows
one of the crisis’ largest declines in
Western Europe, but due the good
fundamentals the Swedish economy
is well positioned to take advantage
of the turnaround in economic activity,
both domestically and abroad. After
a large decline in the manufacturing
sector, forward-looking sentiment
indicators are now strong, and theservices sector has remained stable
throughout the downturn. Indeed,
Sweden, along with other export-
oriented economies such as Germany,
has shown one of the strongest growth
rates in the rst half of 2010 among
industrial countries. The new political
situation, with the centre-right wing
coalition gaining in electoral support
but loosing its majority position due
the Sweden Democrat exceeding
the 4 % threshold for parliamentaryrepresentation, will create challenges
for economic policy in the coming
years. Fresh elections cannot be ruled
out. However, we expect the current
coalition to remain in government, but
the policy mix could change. Instead
of a focus on supply side reforms,
such as liberalisations, privatisations
and further lowering of labour taxes,
it is likely that demand side initiatives,
such as increased public sector
investments coupled with increases of
environmental taxes, will become more
prominent. However, we do not expect
any fundamental change to the overall
principals of economic policy, i.e.,
low scal decits and focus on lower
unemployment, to change. Thus, the
impact on medium-term growth and
ination will be limited.
The economy grew in the rst quarter
of 2010 by almost 4% in annual terms,albeit from the very depressed levels
during the same period in 2009. In
particular, inventory restocking and
public spending, but also a sharp
increase in exports, were the main
drivers. These factors are likely to
be temporary and will not sustain a
lasting momentum for growth. Thus,
we expect the rate of expansion to
weaken for the remainder of 2010 and
real economic growth for the year is
expected to reach 4.0% in calendar-
Key Economic Indicators, 2009 - 20121/
4.6 3.5
-0.7
-5.0
4.0
2.4 2.9
-8.0
-6.0
-4.0
-2.0
0.0
2.0
4.0
6.0
2006 2007 2008 2009 2010 2011 2012
Contribution to growth (Cal. Adj., %)
Private consumption Public consumption
Investments Inventories
Net exports GDPSources: Statistics Sweden and Swedbank
2009 2010f 2011f 2012f
Real GDP (calendar adjusted) -5.0 4.0 2.4 2.9
Industrial production -17.9 9.2 4.5 5.2
CPI index, average -0.3 1.2 2.0 2.7
CPI, end of period 0.9 1.6 2.2 2.6
CPIF, average 2/ 1.9 2.0 1.4 1.9
CPIF, end of period 2.7 1.5 1.6 1.7
Labour force (15-74) 0.2 1.3 0.6 0.5
Unemployment rate (15-74), % of labor force 8.3 8.5 8.4 8.2
Employment (15-74) -2.1 1.1 0.7 0.6
Nominal hourly wage whole economy, average 3.4 2.4 2.2 2.6
Nominal hourly wage industry, average 2.9 2.2 2.1 2.5
Savings ratio (households), % 12.5 11.6 11.0 10.9Real disposable income (households) 1.0 1.8 1.8 1.7
Current account balance, % of GDP 7.2 6.4 6.3 6.4
General government budget balance, % of GDP 3/ -1.0 -0.7 -0.5 -0.3
General government debt, % of GDP 4/ 41.6 40.5 39.3 37.9
Sources: Statistics Sweden and Swedbank.1/ Annual percentage growth, unless otherwise indicated.
2/ CPI with xed interest rates.
3/ As measured by general government net lending.
4/ According to the Maastricht critera.

8/8/2019 Swedbank Economic Outlook - 2010, September 21
http://slidepdf.com/reader/full/swedbank-economic-outlook-2010-september-21 7/29
September 21, 2010 7
Swedbank Economic OutlookSweden
Swedbank’s GDP Forecast – Sweden
some growing risks and challengesthat will have to be managed in a more
fragile parliamentary situation. Fiscal
balances are fairly solid, with a decit
of less than 1% of GDP in 2009 and
a better-than-expected performance
in early 2010. This provides room for
further stimulus should it be needed.
Household balances may prove weak.
A growing mortgage debt, coupled
with uncertainty about labour market
developments and increased interest
rates, could shift sentiments quickly.External developments are also highly
uncertain. The Swedish export industry
is in a strong position to gain market
share but, with renewed nancial
sector turbulence, demand could erode
rapidly.
Export increase on fragileground
The recovery in global trade
signicantly improved Swedish exports
in the second quarter of 2010. In
volume terms, exports increased by
13.5% at an annual rate, with thelargest growth in goods (17.6%), while
services had a more modest increase
(5%). The export performance was
stronger than we expected in our April
forecast but is still lacklustre compared
with pre-2009. To a large extent, the
rebound in exports was driven by the
rebuilding of inventories after a deep
contraction last year, when global
production fell sharply. The low levels
in inventories have led to a growing
need for intermediate and investmentgoods—a situation that has been
favourable for Sweden. Final domestic
demand (consumption and investment)
is, however, still weak in several OECD
countries.
The geographic diversication of
Swedish exports to fast-growing
emerging countries in Asia and Latin
America is contributing to the strong
export performance. The importance of
emerging markets has gradually grown
during 2000-2010, and we expect this
adjusted terms.
The external economic environment
is improving, but there are likely to be
some rough patches in the near future.
In particular, the economic recovery
is stronger than expected in the euro
area and emerging economies, and
we have revised up our projection for
global growth. This is contributing to
Swedish external demand. However,
looking forward, the rebound effect
will fade and the impact from
increasing scal retrenchment will
be felt throughout all economies. For
Sweden, we expect exports to grow at
a slower pace in 2011 and, thus, limit
the impact on overall growth.
Domestic demand -- and in particular
household spending -- is expected
to be the main component in the
economic recovery in the early part
of the 2011-2012 forecast period.
Consumer expenditure is expected
to grow by 2½-3% in real terms in
2010 and 2011 as households reduce
their high savings ratio. However, as
household debt levels have continued
to increase throughout the recession
and as market interest rates start
to normalize, we expect to see the
growth of consumption dampen
signicantly and fall below 2% in
2012. Capacity utilisation is still low
in the manufacturing sector, but as
production is recovering we expect
investments to gradually recover.
Although the macroeconomic
situation is relatively benign, the new
government will nevertheless face
-20
-15
-10
-5
0
5
10
15
20
300000
350000
400000
450000
500000
550000
08Q1 08Q3 09Q1 09Q3 10Q1 10Q3 11Q1 11Q3 12Q1 12Q3
Export developments
Change (%), right scale
Export volyme, left scaleSources : Statistics Sweden and Swedbank
Changes in volume, % 2009 2010f 1/ 2011f 1/ 2012f
Households' consumption expenditure -0.8 3.0 (2.4) 2.6 (2.8) 1.8
Government consumption expenditure 1.7 1.7 (1.6) 1.0 (0.6) 0.4
Gross xed capital formation -16.1 4.3 (-2.0) 5.5 (4.0) 6.7
private, excl. housing -19.0 4.3 (-4.4) 6.7 (3.4) 8.3
public 6.7 -3.6 (3.2) -1.3 (2.2) -0.4
housing -23.4 13.5 (1.2) 7.7 (8.7) 6.9
Change in inventories 2/ -1.5 1.8 (0.8) 0.0 (0.4) 0.0
Exports, goods and services -12.4 11.2 (3.8) 5.6 (4.8) 6.4
Imports, goods and services -13.1 13.5 (4.4) 6.7 (5.9) 6.4
GDP -5.2 4.3 (2.1) 2.4 (2.4) 2.6
GDP, calendar adjusted -5.0 4.0 (1.8) 2.4 (2.4) 2.9
Domestic demand 2/ -3.2 2.7 (1.3) 2.5 (2.2) 2.2
Net exports 2/ -0.6 -0.2 (0.1) -0.1 (-0.1) 0.4
Sources: Statistics Sweden and Swedbank.1/ The gures from our forecast in April 2010 are given in brackets.
2/ Contribution to GDP growth.

8/8/2019 Swedbank Economic Outlook - 2010, September 21
http://slidepdf.com/reader/full/swedbank-economic-outlook-2010-september-21 8/29
8 September 21, 2010
Swedbank Economic OutlookSweden
trend will continue. During this period,
Swedish exports to countries outside
the OECD have increased from 20%
of total exports to 30%. The largest
export rms have set a clear strategic
goal to increase their presence on theemerging markets, particularly in Asia.
For 2011, we foresee that the growth
rate in world trade will decelerate when
the global rebuilding in inventories
dampens and scal policy tightens. A
low utilisation rate in the private sector
and lingering high unemployment rates
in several OECD countries will have
a negative impact on nal domestic
demand. We expect the world market
for Swedish exporters to weaken in
2011, after a strong rebound in 2010.For 2012, we foresee an improvement,
when domestic demand in the OECD
is again strengthening.
Over the 2010-2012 period, export
growth in Sweden will be strongest
in 2010, partly due to base effects
and to temporary stockbuilding when
global production recovers. Despite
uncertainties about the strength of
the global economy, there are no
clear indications of deceleration in
export performance yet. According toSwedbank’s Purchasing Managers’
Index (PMI), new orders to the industry
are still increasing. We foresee a total
export increase of 11.2% in 2010,
driven mainly by a substantial increase
in goods, particularly in minerals and
vehicles.
The momentum in export performance
is expected to soften in 2011, when
world market growth decelerates and
the composition of demand will be
less favourable for Swedish rms. We
foresee a stronger krona and rising
unit labour costs, which will result in
a deteriorated competitiveness and
losses of market shares. Services
exports, which account for 30% of thetotal, will recover when the demand for
transportation and business services
increases. We expect export growth of
5.6% during 2011, followed by growth
of nearly 6.4% in 2012, when global
growth conditions strengthen.
The rebuilding of inventories and a
strong export performance explain to
a large extent the sharp rebound in
imports of goods. In volume terms,
total imports increased by 11% at
an annual rate during the rst half of 2010. This is a signicant change
from last year, when import volumes
fell by 13.5%. During 2011 and 2012,
we anticipate import growth will fall
when the stockbuilding process slows
and export performance weakens.
A relatively robust domestic demand
and a stronger currency mean that
the growth contribution to GDP from
net exports will be small or slightly
negative during 2011 and 2012.
Investment recovery from lowlevels
Business sector investments,
excluding housing, dropped sharply
in 2009 to a level that would be
unsustainable in the long run.
With the subsequent rapid rise in
business sector output, particularly in
manufacturing, capacity utilisation has
started to rise from very low levels. In
combination with strong expectations
for the future, more favourable
nancing terms, and rising prots,
this triggered an increase in business
sector investment during the rst half
of 2010. In the second quarter of 2010,
xed investment increased for the rst
time since the beginning of 2008, by6.9% annually. This was mainly driven
by housing and machinery, which had
fallen sharply in 2009. More activity in
the private business sector has also
led to an upward revision in investment
plans. Total investment is expected
to increase by 4.5% in 2010 and to
continue to gradually expand during
2011 and 2012.
With output continuing upwards in
the private business sector, although
at a slower rate, there will be agrowing need in 2011 and 2012 for
investment to expand capacity.
Uncertainties about the sustainability
of the global recovery, particularly for
next year, will have implications for
Swedish investment plans in 2011.
The momentum in investments is
expected to pick up in 2012, when the
utilisation rate in the business sector
will be higher and the need to increase
production capacity larger.
Housing investment will continue
to recover after plunging last year.
We expect the number of dwelling
starts in new construction to increase
strongly in 2011 (from 16,000 in
2010 to 25,000). Total investments
in housing will grow by double digits
and then gradually dampen in 2011
and 2012. The high growth rates
derive from a fundamental underlying
need for new houses during the
coming two years. Higher disposable
income and a stronger labour marketare creating a growing demand for
houses, particularly in regions with
large immigration. Factors that could
dampen this investment are higher
nominal interest rates and a more
restrictive lending policy. Supply
constraints, such as a lack of labour
and a postponement in land planning,
could also limit growth in real estate
investment.
Public investment growth, which
was faster than average in 2008and 2009, is to fall back during
2010-2012. This will mainly be
15
16
17
18
19
20
21
22
23
24
-20
-15
-10
-5
0
5
10
15
20
25
84 87 90 93 96 99 02 05 08
% o
f G D P
A n n u a l % c
h a n g e
Investments
Investment g rowth, left scale
Investment ratio, right scale Source: Statistics Sweden
8/8/2019 Swedbank Economic Outlook - 2010, September 21
http://slidepdf.com/reader/full/swedbank-economic-outlook-2010-september-21 9/29
September 21, 2010 9
Swedbank Economic OutlookSweden
due to more limited public sector
infrastructure investments. Local
government investment, on the other
hand, is expected to increase when
municipalities in Sweden conance
public-private partnership investmentin infrastructure.
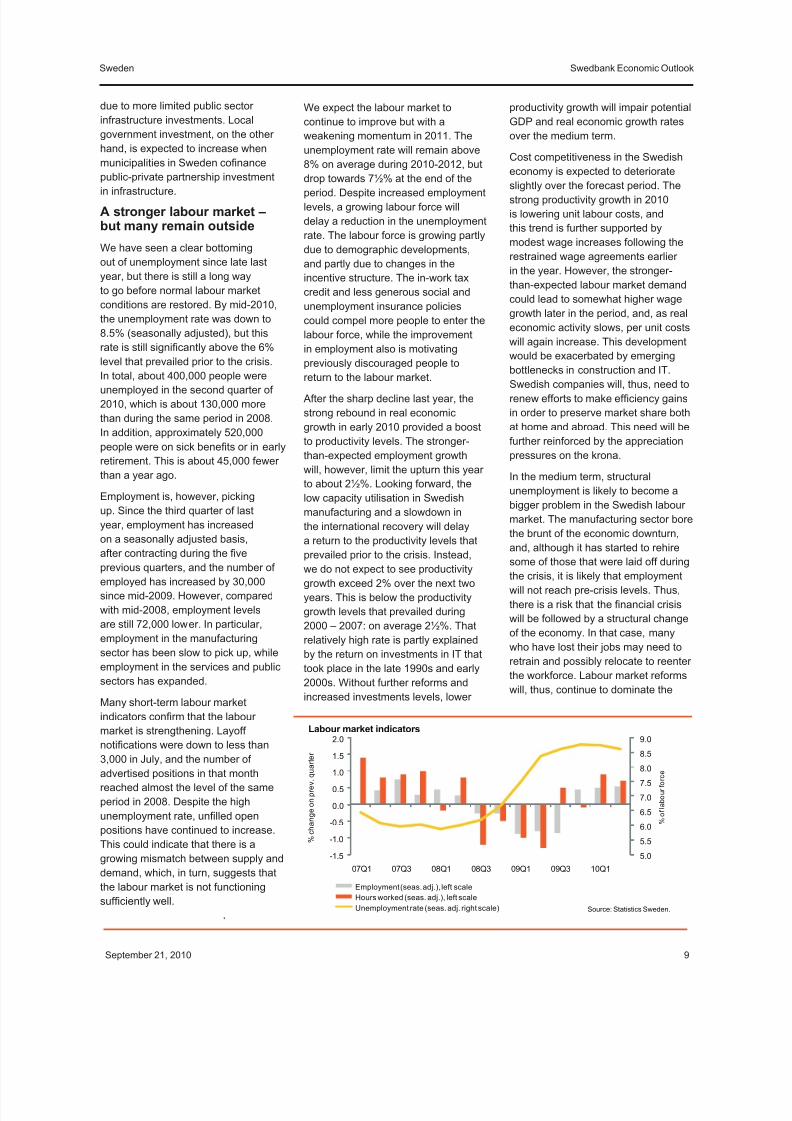
A stronger labour market –but many remain outside
We have seen a clear bottoming
out of unemployment since late last
year, but there is still a long way
to go before normal labour market
conditions are restored. By mid-2010,
the unemployment rate was down to
8.5% (seasonally adjusted), but this
rate is still signicantly above the 6%level that prevailed prior to the crisis.
In total, about 400,000 people were
unemployed in the second quarter of
2010, which is about 130,000 more
than during the same period in 2008.
In addition, approximately 520,000
people were on sick benets or in early
retirement. This is about 45,000 fewer
than a year ago.
Employment is, however, picking
up. Since the third quarter of last
year, employment has increasedon a seasonally adjusted basis,
after contracting during the ve
previous quarters, and the number of
employed has increased by 30,000
since mid-2009. However, compared
with mid-2008, employment levels
are still 72,000 lower. In particular,
employment in the manufacturing
sector has been slow to pick up, while
employment in the services and public
sectors has expanded.
Many short-term labour marketindicators conrm that the labour
market is strengthening. Layoff
notications were down to less than
3,000 in July, and the number of
advertised positions in that month
reached almost the level of the same
period in 2008. Despite the high
unemployment rate, unlled open
positions have continued to increase.
This could indicate that there is a
growing mismatch between supply and
demand, which, in turn, suggests that
the labour market is not functioning
sufciently well.
We expect the labour market to
continue to improve but with a
weakening momentum in 2011. The
unemployment rate will remain above
8% on average during 2010-2012, but
drop towards 7½% at the end of theperiod. Despite increased employment
levels, a growing labour force will
delay a reduction in the unemployment
rate. The labour force is growing partly
due to demographic developments,
and partly due to changes in the
incentive structure. The in-work tax
credit and less generous social and
unemployment insurance policies
could compel more people to enter the
labour force, while the improvement
in employment also is motivatingpreviously discouraged people to
return to the labour market.
After the sharp decline last year, the
strong rebound in real economic
growth in early 2010 provided a boost
to productivity levels. The stronger-
than-expected employment growth
will, however, limit the upturn this year
to about 2½%. Looking forward, the
low capacity utilisation in Swedish
manufacturing and a slowdown in
the international recovery will delaya return to the productivity levels that
prevailed prior to the crisis. Instead,
we do not expect to see productivity
growth exceed 2% over the next two
years. This is below the productivity
growth levels that prevailed during
2000 – 2007: on average 2½%. That
relatively high rate is partly explained
by the return on investments in IT that
took place in the late 1990s and early
2000s. Without further reforms and
increased investments levels, lower
productivity growth will impair potential
GDP and real economic growth rates
over the medium term.
Cost competitiveness in the Swedish
economy is expected to deteriorateslightly over the forecast period. The
strong productivity growth in 2010
is lowering unit labour costs, and
this trend is further supported by
modest wage increases following the
restrained wage agreements earlier
in the year. However, the stronger-
than-expected labour market demand
could lead to somewhat higher wage
growth later in the period, and, as real
economic activity slows, per unit costs
will again increase. This development
would be exacerbated by emerging
bottlenecks in construction and IT.
Swedish companies will, thus, need to
renew efforts to make efciency gains
in order to preserve market share both
at home and abroad. This need will be
further reinforced by the appreciation
pressures on the krona.
In the medium term, structural
unemployment is likely to become a
bigger problem in the Swedish labour
market. The manufacturing sector bore
the brunt of the economic downturn,
and, although it has started to rehire
some of those that were laid off during
the crisis, it is likely that employment
will not reach pre-crisis levels. Thus,
there is a risk that the nancial crisis
will be followed by a structural change
of the economy. In that case, many
who have lost their jobs may need to
retrain and possibly relocate to reenter
the workforce. Labour market reforms
will, thus, continue to dominate the
5.0
5.5
6.0
6.5
7.0
7.5
8.0
8.5
9.0
-1.5
-1.0
-0.5
0.0
0.5
1.0
1.5
2.0
07Q1 07Q3 08Q1 08Q3 09Q1 09Q3 10Q1
% o
f l a b o u r f o r c e
% c
h a n g e o n p r e v . q u a r t e r
Labour market indicators
Employment (seas. adj.), left scale
Hours worked (seas. adj.), left scale
Unemployment rate (seas. adj. right scale) Source: Statistics Sweden.

8/8/2019 Swedbank Economic Outlook - 2010, September 21
http://slidepdf.com/reader/full/swedbank-economic-outlook-2010-september-21 10/29
10 September 21, 2010
Swedbank Economic OutlookSweden
economic policy debate in Sweden for
this governmental term.
Consumption - the backboneof the recovery, but risksemerge
Household consumption resumed
growing at positive rates in the rst
two quarters of 2010 on the back of a
contraction of about 1 % cumulative
in 2008-2009. Lower interest costs--
particularly important as an increasing
share of mortgage loans runs at
exible interest rates-- lower taxes,
and an improving labour market
support the turnaround in household
spending. Many households
unaffected by unemployment hadnevertheless harboured concerns
about future income security. These
concerns are now dissipating.
Along with improved labour market
prospects and already high savings,
we expect household consumption
to provide the main impetus to real
growth over the next 2½ years. The
savings ratio (savings in relation to
disposable income) reached 12.5%
in 2009, and is still very solid. As
household condence is continuing tostrengthen and household income is
supported by low interest rates, private
consumption is set to expand by about
3% in 2010 (compared with our April
forecast of 2.4%).
Increased indebtedness among
households is, however, expected
to limit the growth of consumption
in 2012 and beyond. Consequently,
real economic activity will be
constrained. Lending to households
has continued to expand during the
economic downturn, while overall
nancial intermediation has stagnated.
Household borrowing grew annually
by almost 10% through 2009,
mainly for housing, while lending tobusiness plunged. As a result, the
household debt ratio is increasing and
household debt is set to reach 170% of
disposable income in 2010.
For 2011 and 2012, we thus expect
private consumption to continue to
grow but more slowly than during the
rebound in 2010. A slow improvement
of the labour market will limit growth
in disposable income. Pension
payments are expected to decline,
although this will be compensated for by a reduction of the tax rate. More
important, however, the rise in market
interest rates will increase households’
debt-service burden, and, as the
household debt ratio rises, projected
to about 180% in 2012, we expect
that consumption growth will fall back.
Therefore, the growth of real private
consumption is projected to weaken
to about 2½% and 1¾% in 2011 and
2012, respectively.
The Riksbank, as well as the FinancialSupervision Authorities (FSA), face
a growing challenge in balancing the
impact of their decisions on household
behaviour when formulating monetary
policy and nancial sector prudential
rules. As the share of exible mortgage
rates has increased, the feedthrough
from the policy rate to household
interest costs has amplied. This
development has mitigated the impact
on household consumption from last
year’s economic downturn, but could
at the same time impede the recovery.
We do not expect any signicant
movement in house prices. However,
the loan-to-value ratio on mortgage
lending imposed by the FSA (85%of assessed value), which will take
effect in October, could, together with
increasing interest rates, weaken the
housing market, in particular in and
around the big cities.
Monetary policy rates up –but not as fast as envisagedby the Riksbank
The Riksbank, as was widely
expected, raised the policy rate in
its September meeting from 0.5%to 0.75%. This move is seen as a
continuance of the normalisation of
the monetary policy stance, although
the speed of the process and top
rate to be reached during the cycle
is still debated. The policy rate path
was left unchanged from July, when
it was revised up in the short end,
but lowered for later in the period,
indicating that the Riksbank is
expecting a fairly rapid recovery of
economic activity that will then lessen.
Taking into account the recent pickupin real economic growth, we do not see
any reason to alter our expectation that
there will be an additional two-step rate
hike during 2010, and that the policy
rate will reach 1.25% at end-2010.
Ination has developed largely as
expected. In August, the annual
consumer price (CPI) ination ran
at 0.9%, while CPI-F (CPI with xed
interest rates) was 1.4%. Looking
forward, we see marginal changes to
our ination projections. Due to the
better-than-expected labour market
performance, it is expected that wage
demands will edge up, but the still
very low resource utilisation levels in
the Swedish economy will limit price
pressures in the short run. Later in the
forecast period, headline ination (CPI)
is expected to exceed the ination
target of 2% due to increasing interest
rates, while CPI-F, the core measure,
will hit 2% in mid-2012 before falling
back as policy rates are raised.
For 2011, we believe that, after
keeping rates at in the early part of
0%
50%
100%
150%
200%
83 85 87 89 91 93 95 97 99 01 03 05 07 09 11
Households' balancesheet
Net wealth ratio
Debt ratio
Net wealth ratio, excl. Insurance technical reserves and tenant ownership rights
Sources : Statistics Sweden and Swedbank.

8/8/2019 Swedbank Economic Outlook - 2010, September 21
http://slidepdf.com/reader/full/swedbank-economic-outlook-2010-september-21 11/29
September 21, 2010 11
Swedbank Economic OutlookSweden
the year due to the global slowdown,
the Riksbank will raise the policy
rate at a slightly faster pace than
we expected in April. The Swedish
economy has rebounded faster--and
the labour market is improving with
growing employment and somewhat
higher resource utilisation--than
we expected in April. However, the
external environment is looking
somewhat bleaker, which will lower
inationary pressures in Sweden.
Thus, we expect a policy rate of 2% at
end-2011, and thereafter an increase
of 1 percentage point to 3% at the end
of 2012. The policy rate path of the
Riksbank will be closer to 3½% at end-2012 as the Riksbank expects a faster
recovery than do we.
We expect the krona to strengthen
further against the euro, while
depreciating against the US dollar,
despite in the short term being
affected by the political turbulence.
The Swedish economy is recovering
faster than its main trading partners’
in the euro area, and the Riksbank is
normalising policy rates faster than
the ECB. On the other hand, a dollar strengthening against the euro is
also likely. As measured by the trade-
weighted exchange rate (TCW), the
krona will strengthen by approximately
3% over the forecast period, implying
that competitiveness due to exchange
rate movements of Swedish production
will deteriorate only marginally over the
period.
Election results could affectfscal policy composition
Fiscal performance in Swedencontinues to be strong. Following the
bounceback in consumption, but also
due to improvements in the labour
market, tax revenues are expected
to come in stronger than expected in
2010. Also, the expenditure side will
benet from lower spending on social
transfers, such as unemployment
insurance. We therefore are revising
our decit projection for 2010 from
-1.9% of GDP to -0.7% of GDP. The
upward revision of the nominal GDP
projection is also contributing to a
lower debt-to-GDP ratio, 41.2% of
GDP compared with 42.8 % of GDP in
April.
The centre-right government promised
in the run-up to the elections that
the budget cost of various reforms
proposed would amount to at least
to SEK 12.8 billion. The bulk of this,
SEK 10 billion, relates to increased
spending, such as additional transfers
to local governments of SEK 3 billion.
In addition, the government promised
a reduced tax rate on pensions,
estimated to cost about SEK 2.5
billion. The net effect would correspond
to about 0.4% of GDP.
A new parliamentary situation and
a persistently high unemployment
rate could lead to further scal policy
expansion in 2011. The government
indicated during the election campaign
that, provided the economic conditions
so permit, it would undertake further
stimulus measures. We expect that
these will be implemented in an
amount of about an extra SEK 15
billion in 2011, yielding a total of about
SEK 28 billion (or 0.8 % of GDP).
Instead of mainly taking the form of
reduced taxes, such as expanded
in-work tax credits, the election result
and the possible collaboration with
the Red-Green alliance could lead
to more expenditure increases. As
this is likely to be compensated by
revenue measures, we do not expect
the decit to be signicantly affected
by the electoral outcome. Nominal
GDP growth, which will be higher thanwas expected in April, will furthermore
reduce the impact on scal balances.
We project a budget decit of -0.5%
of GDP in 2011, and a narrowing to
-0.3% in 2012.
Positive debt dynamics will continue
to reduce public debt. Higher-than-
expected real growth and low nancing
costs are contributing to a falling debt-
to-GDP ratio, despite the scal decits.
For 2011, we expect a Maastricht
debt of 39.9% of GDP and, for 2012,38.4% of GDP. The public debt ratio
Interest rate and currency outlook
0.0
1.0
2.0
3.0
4.0
5.0
Q2-08 Q4-08 Q2-09 Q4-09 Q2-10 Q4-10 Q2-11 Q4-11 Q2-12 Q4-12
Inflation and policy rate (%)
Swedbank's CPI-F proj.
Swedbank's policy rate proj.
The Riksbank's policy rate path Sources : Statistics Sweden and Swedbank
Outcome Forecast
2010 2010 2011 2011 2012 2012
20 Sep 31 Dec 30 Jun 31 Dec 30 Jun 31 Dec
Interest rates (%)
Policy rate 0.75 1.25 1.25 2.00 2.50 3.00
10-yr. gvt bond 2.7 2.7 2.9 3.2 3.4 3.8
Exchange rates
EUR/SEK 9.1 9.1 9.0 8.9 8.9 8.9
USD/SEK 7.0 7.0 7.1 7.3 7.6 7.7
TCW (SEK)1/
126 125 124 123 124 124Sources: Reuters Ecowin and Swedbank.1/ Total Competitiveness Weights (TCW: i.e. trade-weighted exchange rate index for SEK).

8/8/2019 Swedbank Economic Outlook - 2010, September 21
http://slidepdf.com/reader/full/swedbank-economic-outlook-2010-september-21 12/29
12 September 21, 2010
Swedbank Economic OutlookSweden
in Sweden remains one of the lowest
in Europe. The government had
earlier indicated that it intended to sell
stakes in companies such as Nordea,
Telia Sonera, and Vattenfall if market
conditions improve. However, we do
not expect that it now will be politically
feasible to follow through with such a
policy given the current parliamentary
situation.
Due to the projected scal
expansion, we see some risk that the
predetermined scal rules will come
under threat. Spending so far during
2010 is lower than expected, and
there is room during the remainder
of the forecast period for making
further increases without breaching
the expenditure ceilings. However,
the prospects of reaching a 1% of
GDP surplus over the business cycle
will be more constrained. Should the
economy perform worse, the need
could arise for scal retrenchment
to meet the surplus target at the
end of the forecast period. Also,
the zero-balance condition on local
governments will be difcult to attain.
During this and the next scal year,
the central government will increase
transfers, which will aide in meeting
the target. Thereafter, however, there
is a risk that local governments will
need to reduce spending or increase
taxes, which could negatively impact
economic activity.
During the recent years of economic
turmoil, lowering taxes has beneted
economic activity, but as the economy
is turning the government may nd
that restoring scal balances will be
harder than expected. We reiterate
our concern that, while the economic
downturn is temporary, many of the
measures that stimulated the economy
are of a more permanent nature. Some
progress has been made in savings
in the social transfer system, but it
is likely that both central and localgovernments will face hard choices
between increasing taxes and lowering
expenditures in the years to come.
The elections resulted in increased
support for the centre-right coalition
government, while at the same time
removing the parliamentary base for
a majority government. We expect
that the coalition will be able to stay in
power, either as a minority government
seeking support on an ad hoc
basis, or through a more formalizedcollaboration with other parties. In any
case policy implementation will be
made more difcult, although the rules
surrounding the budget law makes it
possible to pass the budget law with
a minority unless there is a majority
supported alternative. However, other
much needed reforms are likely to
be postponed or watered down in
order to prevent a government crisis.
Thus, for example, a much needed
comprehensive tax reform will be more
difcult to initiate. In the medium term,
this could reduce the dynamics of the
Swedish economy and, thereby lower
real economic growth rates in the
future.
Magnus Alvesson
Jörgen Kennemar
0.0
5.0
10.0
15.0
20.0
25.0
30.0
2006 2007 2008 2009
% o
f G D
P
Government revenues and expenditures
Direct taxes Indirect taxesSocial security contributions ConsumptionTransfers Investments Source: Statisti cs Sweden .

8/8/2019 Swedbank Economic Outlook - 2010, September 21
http://slidepdf.com/reader/full/swedbank-economic-outlook-2010-september-21 13/29
September 21, 2010 13
Swedbank Economic Outlook
Estonia – Structural change to continue
After seven quarters of decline, the
Estonian economy began to grow
again in the fourth quarter of 2009, as
revised statistics show. The recovery is
based on exports, which are benetting
from revived global trade and the
regained competitiveness of local
producers. Consumption has remained
weak due to declining incomes;
however, it has shown a slight pickuplately, as consumers’ moods have
turned positive. After an intensive
period of destocking, inventories are
now growing again.
Estonia received an invitation to
become the 17th member of the
European Monetary Union (EMU), as
a reection of fullling the Maastricht
criteria, accomplished during height of
the global nancial crisis. Also, Estonia
signed a membership agreement with
the OECD in early June, and, after
the nal ratication in the Parliament
(planned for this year), Estonia will
become the 34th full member of the
organisation.
We have changed our forecast based
on the better growth and worse
employment pattern reported so
far in 2010, as well as the changed
global outlook. We expect the
Estonian economy to grow by 2.2%
in 2010, and by 4.5% in 2011 and
2012. We have raised our ination
expectations, as global price growth
has caused prices in Estonia to rise
more than we expected in the spring.
Due to very slow job creation in the
rst half of 2010 and a high activity
rate, we foresee that the average
unemployment rate will remain only
marginally below 18% this year. This
will keep household consumption low
and the savings level high, despite the
growing optimism.
Of the more signicant risks for our
scenario, the biggest is related to
global economic development. As
the Estonian economy is very open,
external conditions, whether improving
or deteriorating, will affect the
economy in Estonia through demand
and prices.
Looking at previous countries’
experiences, we see that euro
adoption has had strong positive
effects on their economies.Nevertheless, taking into account
the current global economic situation
and outlook, we have not included a
signicant positive impact on Estonia’s
economy stemming from the adoption
of the euro. Hence, it is possible that
foreign investments and production
growth will turn out to be higher than
we currently forecast. This, in turn,
would have a positive effect on the
labour market, consumption, andbudget revenues.
Regarding medium- and long-term
risks that might affect economic
developments in 2012, companies’
investment policies and labour
outows remain among the main risks
that could affect the current growth
outlook, either positively or negatively.
Economic growth based onexports and investments
In 2010, we foresee the Estonian
economy growing by 2.2%, supported
Key Economic Indicators, 2009 - 2012 1/
10.6% 6.9%
-5.1%
-13.9%
2.2%4.5% 4.5%
-30%
-20%
-10%
0%
10%
20%
2006 2007 2008 2009 2010f 2011f 2012f
Contributions to GDP Growth
Net exports InvestmentsGovernment HouseholdsGDP Sources: SE and Swedbank forecast.
2009 2010f 2011f 2012f
Economic growth, % -13.9 2.2 4.5 4.5GDP, bln euro 13.9 14.3 15.3 16.3
Average growth of consumer prices,% -0.1 2.6 3.0 3.5
Unemployment level, % 13.9 17.8 15.5 12.5
Real growth of gross monthly wage, % -4.9 -1.0 2.0 2.5
Exports of goods and services, % -19.9 18.0 8.5 9.0
Imports of goods and services, % -30.6 21.0 9.5 10.5
Trade and services balance, % of GDP 5.9 4.5 4.0 3.0
Current and capital account, % of GDP 7.3 6.0 5.3 3.5
FDI inow, % of GDP 8.7 6.0 9.5 10.0
Gross foreign debt, % of GDP 125.5 122.0 117.0 114.0
General government budget, % of GDP -1.7 -1.5 -1.5 -0.5
General government debt, % of GDP 7.2 7.5 8 8.5Sources: Statistics Estonia and Swedbank.
1/ Annual percentage change unless otherwise indicated.
8/8/2019 Swedbank Economic Outlook - 2010, September 21
http://slidepdf.com/reader/full/swedbank-economic-outlook-2010-september-21 14/29
14 September 21, 2010
Swedbank Economic OutlookEstonia
mostly by exports. However, a positive
effect on growth will come from stockbuilding as well. After approximately
1% growth this year, we expect
domestic demand to grow by 4%
in 2011 and close to 5% in 2012.
Investments will be the most dynamic
component of domestic demand in
the forecast period as both public and
private investments will grow. While
household investments in new housing
will grow modestly and the real
estate sector will still be feeling the
consequences of the crisis, companies
will increasingly invest in machinery
and equipment.
Household consumption will decline
this year by 3%, but grow by 3.5% in
the following two years. Government
consumption will decline in 2010, but
in 2011-2012 slight growth will be
seen, as the public sector will be able
to expand spending.
Export growth will slow next year due
not only to weaker growth in Estonia’s
main export markets, but also becausecapacities will be fully employed in the
rapidly growing export sectors already
in late 2010 and early 2011. The
investment process will require time,
and access to nancing will remain
somewhat limited at this early period of
economic recovery.
Imports have been gathering speed,
together with exports, as Estonian
export products include a substantial
share of imported inputs. Buoyed by
the growing optimism, companieshave started to invest and rebuild
inventories – hence, imports will grow
stronger than exports already this year.
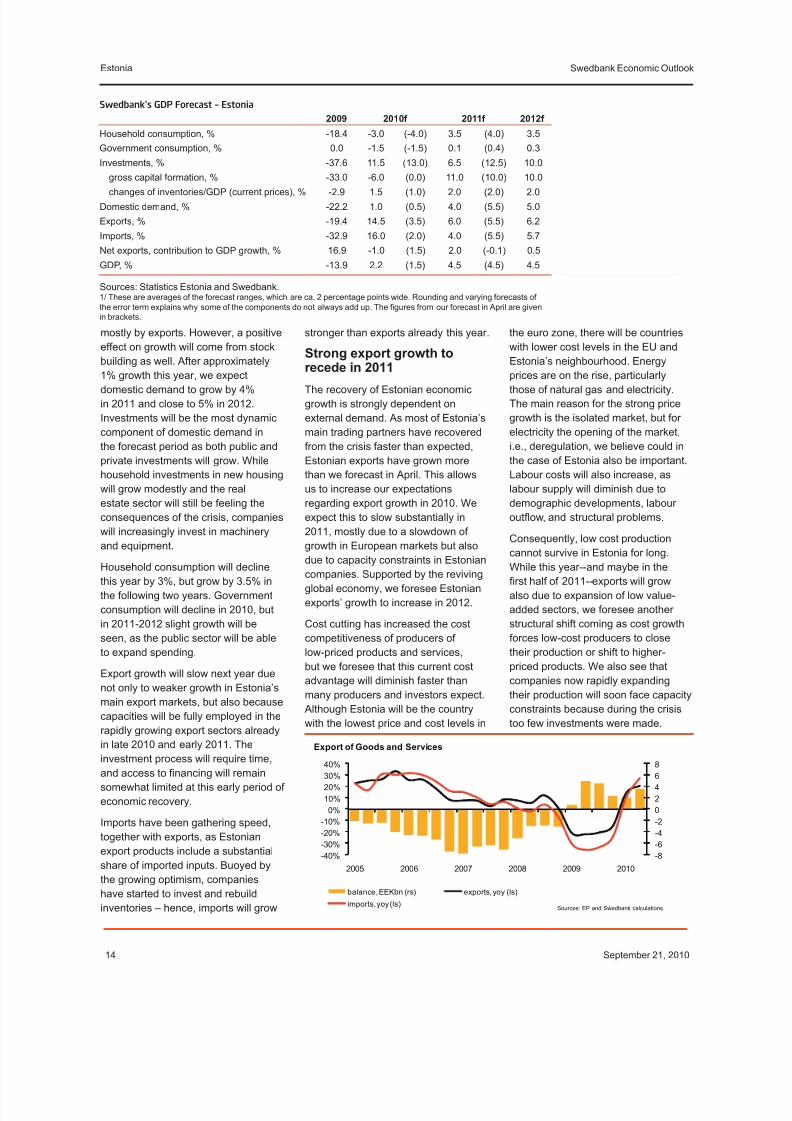
Strong export growth torecede in 2011
The recovery of Estonian economic
growth is strongly dependent on
external demand. As most of Estonia’s
main trading partners have recovered
from the crisis faster than expected,
Estonian exports have grown more
than we forecast in April. This allows
us to increase our expectations
regarding export growth in 2010. We
expect this to slow substantially in
2011, mostly due to a slowdown of
growth in European markets but also
due to capacity constraints in Estonian
companies. Supported by the reviving
global economy, we foresee Estonian
exports’ growth to increase in 2012.
Cost cutting has increased the cost
competitiveness of producers of
low-priced products and services,
but we foresee that this current cost
advantage will diminish faster than
many producers and investors expect.
Although Estonia will be the country
with the lowest price and cost levels in
the euro zone, there will be countries
with lower cost levels in the EU andEstonia’s neighbourhood. Energy
prices are on the rise, particularly
those of natural gas and electricity.
The main reason for the strong price
growth is the isolated market, but for
electricity the opening of the market,
i.e., deregulation, we believe could in
the case of Estonia also be important.
Labour costs will also increase, as
labour supply will diminish due to
demographic developments, labour
outow, and structural problems.
Consequently, low cost production
cannot survive in Estonia for long.
While this year--and maybe in the
rst half of 2011--exports will grow
also due to expansion of low value-
added sectors, we foresee another
structural shift coming as cost growth
forces low-cost producers to close
their production or shift to higher-
priced products. We also see that
companies now rapidly expanding
their production will soon face capacity
constraints because during the crisis
too few investments were made.
Swedbank’s GDP Forecast – Estonia
2009 2010f 2011f 2012f
Household consumption, % -18.4 -3.0 (-4.0) 3.5 (4.0) 3.5
Government consumption, % 0.0 -1.5 (-1.5) 0.1 (0.4) 0.3
Investments, % -37.6 11.5 (13.0) 6.5 (12.5) 10.0
gross capital formation, % -33.0 -6.0 (0.0) 11.0 (10.0) 10.0changes of inventories/GDP (current prices), % -2.9 1.5 (1.0) 2.0 (2.0) 2.0
Domestic demand, % -22.2 1.0 (0.5) 4.0 (5.5) 5.0
Exports, % -19.4 14.5 (3.5) 6.0 (5.5) 6.2
Imports, % -32.9 16.0 (2.0) 4.0 (5.5) 5.7
Net exports, contribution to GDP growth, % 16.9 -1.0 (1.5) 2.0 (-0.1) 0.5
GDP, % -13.9 2.2 (1.5) 4.5 (4.5) 4.5
Sources: Statistics Estonia and Swedbank.1/ These are averages of the forecast ranges, which are ca. 2 percentage points wide. Rounding and varying forecasts of
the error term explains why some of the components do not always add up. The gures from our forecast in April are given
in brackets.
-8
-6
-4
-2
0
2
4
6
8
-40%
-30%
-20%
-10%
0%
10%
20%
30%
40%
2005 2006 2007 2008 2009 2010
Export of Goods and Services
balance, EEKbn (rs) exports, yoy (ls)
imports, yoy (ls)Sources: EP and Swedbank calculations.

8/8/2019 Swedbank Economic Outlook - 2010, September 21
http://slidepdf.com/reader/full/swedbank-economic-outlook-2010-september-21 15/29
September 21, 2010 15
Swedbank Economic OutlookEstonia
These developments, together with
slowed growth in Estonia’s main
export markets, will slow Estonian
production and export growth rates
substantially in 2011. However, we
expect a recovery of growth ratesat the end of 2011, when external
demand is expected to pick up and
some of the capacity constraints
are alleviated through growing
investments.
Import growth will be stronger
than we expected in the spring.
Faster-growing exports also need
more imported inputs (energy, raw
materials, and details). Imports
are growing also because of rising
company investments, whichrequire more machinery and
equipment. Additionally, companies
are recovering their exhausted
inventories – the process has been
much more intensive this year than
we foresaw. Growing consumption
will increase demand for imported
goods in 2011-2012.
An important reason why we are
less optimistic regarding exports
and imports is related to services.
While, during the crisis, exports of Estonian services performed very
well, this seems to have changed
in the second quarter of 2010.
Hence, we lower our expectations
regarding the growth of services
exports and increase for services
imports. Although services are
partly substitutable, there are higher
barriers in place than for the goods
market, as in some cases the number
of services providers might be very
low or the situation very close tomonopolistic. Consequently, the
success or troubles of one company
may affect the macro picture and
how services are distributed between
exports and imports.
We still expect that Estonia’s current
and capital account will be in surplus
throughout the forecast period, but we
foresee it to diminish faster than we
did in the spring. Besides a smaller
trade and services surplus, we expect
the income account decit to be bigger
as company prots are growing much
faster than anticipated in our spring
forecast. We also foresee workers’
remittances as being somewhat
bigger, as more people are moving to
work abroad, and interest payments to
be smaller as interest rates will remainlow for a longer period than previously
expected.
Infrastructure and technologyinvestments to grow
We expect investments to grow
by approximately 11.5% this year
as stocks are rising after a sharp
correction in 2009. Gross xed capital
formation will continue to decline
this year, although annual growth
is expected to resume in the thirdquarter. Gross xed capital formation
will expand more than 11% next year,
with growth then slowing to 10% in
2012.
Gross xed capital formation will start
to grow as public sector investments
are rising, supported by EU nancing,
and companies are increasing their
investments in technology. Public
investments will increase as big
infrastructure investments are on the
rise. Companies are being forced toincrease investments in machinery and
equipment to tackle the issue of rising
costs and maintain competitiveness.
Although these types of investment
have been growing since the beginning
of this year, we expect this growth to
accelerate in the second half of 2010.
Construction of houses will remain
weak throughout the forecast period,
although slight growth will be seen
next year. Public sector investments in
this area will remain low due to budget
constraints, and households will not
be eager to buy new real estate.
We expect that some development
projects will start next winter or spring,
but we foresee that overall activity in
real estate development will remain
subdued for some time owing to weakdemand.
Public investments will mostly be
nanced from different EU funds.
Stronger companies will rely on own
funds, but we foresee that the use of
foreign private funding will increase as
well. Borrowing from parent companies
will be the most widespread, but we
expect that bigger companies will
borrow directly from abroad. Local
lending will remain relatively small,
and loan portfolios of local banks willcontinue to decline in 2010 and at
least into the rst half of 2011, due
to tightened credit terms and the
deleveraging process.
Wages growing despite highunemployment
The average unemployment rate in
2010 – approximately 17.8% - will
be higher than forecast in spring;
however, we expect it to decline to
12.5% by 2012. We have increasedour unemployment expectations
-15%
-10%
-5%
0%
5%
10%
15%
20%
2004 2005 2006 2007 2008 2009 2010
Labour Market Indicators
Unemployment rate Employment, yoy
Gross wage, real yoy GDP per worker, yoy Source: SE
-6%
-3%
0%
3%
6%
9%
12%
2005 2006 2007 2008 2009 2010
Major Price Indices, yoy
CPI Base inflation Manufacturing prices
Sources: SE and Swedbank calculations.

8/8/2019 Swedbank Economic Outlook - 2010, September 21
http://slidepdf.com/reader/full/swedbank-economic-outlook-2010-september-21 16/29

8/8/2019 Swedbank Economic Outlook - 2010, September 21
http://slidepdf.com/reader/full/swedbank-economic-outlook-2010-september-21 17/29
September 21, 2010 17
Swedbank Economic Outlook
towards higher spending levels has
taken place recently, as our analysis
shows. We are of the opinion that this
recovery will remain subdued, at leastuntil the middle of 2011.
Despite gradually rising incomes, the
household savings rate will remain
high. One reason is the deleveraging
process, and another is the shift in
household behaviour in 2008. We
are of the opinion that this behaviour
will not change in our forecast
period. Weak household demand will
suppress local small companies and
employment, while growing prices and
the relatively high price level of certaingoods (e.g., clothing and electronics)
will encourage Estonians to shop
abroad, thus worsening the situation
for local companies.
Euro adoption to have amodest short-term impact
Estonia will become the 17th member
of EMU at the beginning of 2011. The
preparation period will bring costs to
companies; however, it will also bring
benecial effects to some companies
through increased demand (e.g., IT
services). Also, the preparation period
will most likely slow a possible price
increases because price controls are
being put in place that, it is hoped,
will work effectively. These controls
are getting wide media coverage as
prices are the biggest public concern
regarding euro adoption.
The pre-introduction period also
includes the alignment of Estonian
monetary regulations with those of the euro zone. The biggest change is
that the reserve requirement will be
lowered from 15% to 2%. The rst cut
took place on September 1 (to 11%),
the next is scheduled for November
1 (to 7%), and the nal one takesplace on January 1, 2011. The central
bank estimates that approximately
EEK 40 billion (EUR 2.6 billion) of
additional liquidity could be injected
into the economy as a result. However,
it is highly probable that banks
will use a portion of these sums to
redeem loans and to keep additional
reserves. Hence, we do not expect
any substantial effect of this monetary
easing on banks’ lending policies.
Euro adoption will lower risks and bringa more stable economic environment.
We foresee increased capital inows
into the economy; however, we are
not projecting these to be at the levels
seen in Slovenia or Slovakia, as the
current global economic situation is
not very favourable for investments.
However, a better outcome is possible.
This would, in turn, increase not
only production, jobs, incomes, and
consumption, but also prices and
wages more than expected in our
current scenario; bigger tax revenues
would allow the government to reach
its balanced-budget target earlier than
currently projected.
Budget to remain in defcit
The likelihood of the government’s
policy changing is low, and we are
of the opinion that the government
will succeed with its ambition to
reach a balanced budget by 2014.
We foresee that the public sector
budget decit will gradually declinethroughout the forecast period. This
development, however, means that
the government will have to continue
with the consolidation of the public
services, as commitments taken in
spring 2009-- at a time of heavy cuts-
-will increase compulsory spendingfrom 2011 onwards signicantly. The
conservative budget planning, in which
lower revenue expectations - rather
than average or positive ones – are
taken as the base, makes it possible
to overshoot the budget revenue
plans not only in 2010, but most likely
in 2011 and 2012 as well (if global
economic developments remain in line
with expectations).
Signicant tax changes are unlikely to
take place during the forecast period.Excise rates on tobacco products
are scheduled to be raised in the
beginning of 2011 and 2012. Lowering
the unemployment insurance payment
rate from the current 4.3% is the
most likely change to take place, but
this has not yet been scheduled. It is
possible that some other changes in
the tax system will be enacted in 2012,
but this will depend on the coalition
that takes ofce after the general
elections in March 2011. As of now,the current government coalition has a
good chance to continue in ofce after
the elections because the economy
is on the rise. If it stays in power, the
shift from direct taxes toward indirect
taxation will continue.
The government’s structural
policies will include steps aimed at
improving the business environment,
encompassing mostly public
investments in infrastructure and
particularly the energy sector andtransportation. The reform of general
education started in September,
and we are of the opinion that the
government should now substantially
intensify its work on other important
structural issues related to education.
Because unemployment is becoming
more and more long term, decisive
steps to re-educate and retrain the
unemployed are required.
Maris Lauri
Annika Paabut
-4%
-2%
0%
2%
4%
6%
8%
10%
2005 2006 2007 2008 2009 2010f 2011f 2012f
General Government Finances, % of GDP
Debt Budget balance Sources : SE and Swedbank forecast.
Estonia

8/8/2019 Swedbank Economic Outlook - 2010, September 21
http://slidepdf.com/reader/full/swedbank-economic-outlook-2010-september-21 18/29
18 September 21, 2010
Swedbank Economic OutlookLatvia
Latvia: Uneven and still fragile recoveryKey Economic Indicators, 2009 - 2012 1/
The recession is over, and, although
the recovery is still uneven across
different economic sectors, the
turnaround is evident. In the
rst half of the year, the biggest
contributor to growth was the
rebuilding of inventories. Export
growth and stabilisation in householdconsumption, driven by stronger
household condence and rising
wage incomes, supported the overall
economic activity. Growth, however, is
still fragile, and the recent run of good
data (e.g., GDP up by 0.9% and 0.8%
quarter on quarter and seasonally
adjusted in the rst two quarters) is
encouraging but does not imply yet
that sustainable strong growth has
resumed.
Compared with our April report, theglobal growth outlook has improved
for 2010, but weakened for 2011-
2012 because of the upcoming scal
consolidation and the inventory cycle’s
running out of steam. This global
outlook has improved Latvian exports
for this year but will dampen next
years’ growth.
We now expect a smaller fall in Latvian
GDP for 2010 of about 1.5%, i.e.,
an underlying growth of about 2%
and a contraction due only to a largenegative carryover from 2009. In turn,
somewhat slower growth than earlier
expected is now forecast for 2011
(3%), with the expansion strengthening
to 4.2% in 2012. Because the labour
market recovery already commenced
in the second quarter, we are lowering
our average job-seekers’ rate forecast
to 19.5% this year (21.5% before). Webelieve that unemployment peaked
this spring and, after a temporary
rise in autumn as seasonal jobs fade
away, it will continue to retreat slowly
over the coming years. The deation
period has turned out to be shorter
and shallower than anticipated due
to stronger global price pressures
and improvements in household
condence. We now foresee about a
1.2% average consumer price deation
in 2010, and 1.5% and 2.5% inationin 2011-2012, respectively. However,
ination will be higher if the currently
discussed scal consolidation measure
to eliminate the reduced value-added-
tax (VAT) rates is implemented. With
import intensity somewhat stronger
than we anticipated, imports are rising
faster, which means smaller surpluses
in the trade account for 2010-2011 anda decit already in 2012.
Thus, we see the short-term prospects
as relatively upbeat, but over the
medium run we see certain risks to
the forecast. On the downside, we
point to two main risks. The rst is
weaker global demand. This would
hit Latvian exports and undermine
recovery, particularly if structural
reforms in public and private sector
lag, thus constraining improvements
in export competitiveness. Thesecond is a persistent labour market
2009 2010f 2011f 2012f Economic growth, % -18.0 -1.5 3.0 4.2
GDP, mln euro 18 067 17 194 17 733 18 922
Average growth of consumer prices, % 3.5 -1.2 1.5 2.5
Harmonised unemployment level, % 16.9 19.5 17.5 15.5
Real growth of average net monthly wage, % -5.9 -6.9 1.5 2.5
Growth of exports of goods and services, % -17.8 15.5 10.0 11.0
Growth of imports of goods and services, % -37.6 13.0 10.5 14.0
Balance of goods and services, % of GDP -0.3 0.5 0.3 -1.3
Current account balance, % of GDP 9.4 6.2 2.4 -0.6
Current and capital account balance, % of GDP 12.0 8.6 5.5 3.1
Net FDI, % of GDP 0.4 0.4 0.8 2.2
External gross debt, % of GDP 157 162 156 147General government budget (accrual basis), % of GDP -9.0 -8.5 -6.0 -3.0
General government debt, % of GDP 36.6 49.0 53.0 51.0
Sources: CSBL and Swedbank.
1/ Annual percentage change unless otherwise indicated.
-20
-10
0
10
20
30
40
50
-100
-80
-60
-40
-20
0
20
40
1Q 05 1Q 06 1Q 07 1Q 08 1Q 09 1Q 10
Annual GDP growth, %
GDP GDP s.a. qoq (rs) HouseholdsGovernment GFCF ExportsImports Source: CSBL.

8/8/2019 Swedbank Economic Outlook - 2010, September 21
http://slidepdf.com/reader/full/swedbank-economic-outlook-2010-september-21 19/29
September 21, 2010 19
Swedbank Economic OutlookLatvia
skills mismatch. If not adequately
addressed, this may lead to wage
growth in excess of that of productivity,
which thereafter spills over into
ination, putting at risk fullment of theMaastricht price stability criterion for
euro accession in 2014. While such
labour market developments may
initially produce faster GDP growth,
they would worsen competitiveness,
widen macroeconomic imbalances,
signicantly undercut future growth
and increase the risk of stagnation.
Of the upside risks, stronger global
demand would support exports and
strengthen recovery.
Spurt in export growth toslow down
We now expect stronger export volume
growth in 2010, but a somewhat
slower increase in 2011 compared with
our April forecast. The global outlook
for 2010 has improved, especially for
such countries as Germany and the
Nordics, which are among Latvia’s key
trade partners. We have raised our
forecast to about 9% for 2010. In turn,
the weaker global outlook for 2011
undermines export performance, andwe forecast real exports to grow by
about 6% annually in both 2011 and
2012.
We expect export growth to be
supported by the country and product
mix becoming more diversied: also
distribution networks are turning
increasingly diverse (e.g., optimizing
supply chains and targeting niche
segments). The dramatic fall in
demand during late 2008 and 2009
pushed manufacturers to search for new markets, and this process is set
to continue, especially to countries
outside the EU. For instance, the metal
industry has found demand in Algeria,
thereby growing its export share to
this country to 2.2% of total exports inthe rst half of 2010 (up from 0.2% in
2007). The wood industry has widened
its product mix by extending its supply
of higher-value-added items (e.g.,
the company Bau-How), as well as
by partially returning to lower-value-
added segments that appeared to
show more resilient demand in the
recession. Expansion into lower-value-
added products may come with more
sophisticated distribution networks that
help to extract more value indirectly
(e.g., the company Latvijas Finieris).
Rising global competition and
emerging local resource constraints
(e.g., timber supply for the wood
industry and rising labour costs for
the whole economy) will maintain the
pressure on exporters to shift towards
higher-value-added products. A shift
to such products will, of course,
be a challenge, as it will demand
investments and skills .
Stronger import growth in2010
Stronger exports and consumption
have boosted imports. However,
our estimates suggest that import
growth has been swifter than
exports and household consumption
would warrant. There are several
possible reasons for this: (i) import
substitution during the deation
period has turned out to be weaker
than initially estimated, (ii) we had
underestimated import sensitivity to
exports, and (iii) we had overestimated
inventory levels. Perhaps it is a mix
of all three possibilities, but the rst
one seems most likely. Discussionswith businesses do not support the
latter arguments and suggest neither
an increased need for imports for
exporting companies in addition to
that of larger production volumes, nor
an unforeseen rapid restocking by
manufacturers.
In this context, we are signicantly
raising the forecast for import growth
for 2010, but we believe that it will
slow in 2011 as the rebuilding of
inventories will be by and large over and export growth will slow. With
Swedbank’s GDP Forecast – Latvia
2009 2010f 1 2011f 1 2012f 1
GDP -18.0 -1.5 (-2.5) 3.0 (4.0) 4.2
Household consumption -24.0 -2.0 (-9.0) 3.0 (2.0) 4.5
General government consumption -9.2 -4.3 (-7.4) -1.1 (-3.0) 0.2
Gross xed capital formation -37.3 -27.0 (-27.0) 7.0 (7.0) 14.0
Exports of goods and services -15.5 9.0 (6.0) 6.0 (8.0) 6.0
Imports of goods and services -35.5 7.5 (-8.0) 5.0 (8.5) 9.0
Inventories contribution to GDP, pp -2.1 6.7 (4.8) -0.5 (1.8) 0.2
Net export contribution to GDP, pp 14.8 0.5 6.6 0.4 0.1 -1.7
Sources: CSBL and Swedbank.1/ These are averages of the forecast ranges, which are about 2 percentage points wide in each direction. Our April forecast is given in brackets.
-50
-25
0
25
50
60
80
100
120
140
Jan/06 Jan/07 Jan/08 Jan/09 Jan/10
Industry and exports
Manufacturing output (sa), 2005=100Manufacturing conf idence (sa), pts (rs)Nominal exports of goods and services (nsa), % yoy (rs)
Sources : Reuters EcoWin and CSBL.

8/8/2019 Swedbank Economic Outlook - 2010, September 21
http://slidepdf.com/reader/full/swedbank-economic-outlook-2010-september-21 20/29
20 September 21, 2010
Swedbank Economic OutlookLatvia
reviving domestic demand, import
growth is expected to accelerate again
in 2012. Higher imports imply smaller
trade account surpluses in 2010-2011,
and a small decit is anticipated in
2012. Consequently, current accountsurpluses are expected to vanish in
2012. Although gross external debt
might therefore start to rise in 2012,
the debt-to-GDP ratio, with economic
activity expanding, will continue to
decline.
Contraction in investments tobottom out in 2010
Our investment outlook has remained
largely unchanged from the April
report. We forecast investments tobottom out in the second half of this
year. The decline in gross xed capital
formation slowed in the rst half of
the year, and there are signs of a
turnaround. Many exporting companies
are running close to their capacity
constraints. Condence has improved,
asset prices remain attractive, and
interest rates have declined. Building
permits for export-related facilities
started to rise in the second quarter of
2010.
However, investment demand
remains weak. Companies still need
to deleverage before engaging in
new investment projects. For those
able to invest, assessment of projects
may have been delayed until after
the Parliament draws the next year’s
budget and changes in tax policy
become known. Appropriation of EU
funds lags – in the rst half of the year,
only 21% of the funds planned for
2010 were paid out. The government
is aiming to accelerate acquisition of
these funds, but results have yet to be
seen.
A condence boost to international
investors was provided by Fitch
ratings, which recently improved its
outlook for Latvia’s sovereign risk
rating to stable from negative. A
rating increase by Fitch, as well as
by Standard&Poors, from speculative
to investment level (Moody’s is the
only major rating agency to have kept
Latvia at investment grade) is likely
to follow after the 2011 budget has
been approved and its implementation
supported by external donors – i.e.,
perhaps in the rst quarter of 2011.
Structural challenges in thelabour market
The labour market has started to
improve earlier than expected.
Unemployment peaked in the rst
quarter and has been declining
since. The inow of new unemployed
has slowed considerably, whereas
emigration and active labour market
programs have cut the number of
those already unemployed. More
important, the second quarter witnessed the rst increase in the
number of employed via both seasonal
and new permanent job creation. The
number of vacancies has risen. While
we expect the unemployment rate to
rise again this autumn as seasonal
jobs disappear, it will not reach the
peak seen in March. Given the early
improvement in the labour market, we
have lowered our average job-seekers’
rate forecast for 2010 and the following
two years by 2 percentage points
annually.
By and large the wage cuts seem to
be over – average monthly wages
even grew marginally in the second
quarter compared with the rst,
owing to seasonal factors. Despite
marginally growing wages (and rising
consumer/producer prices), external
competitiveness was still improving
vis-à-vis Latvia’s main trade partners.
According to Bank of Latvia data,
by the rst quarter of 2010 the real
effective exchange rate deated by
unit labour costs in manufacturing had
corrected about 80% of its boom-time
appreciation. Unit labour costs also
continued to decline in the second
quarter of 2010.
Despite better-than-expected labour
market dynamics thus far, challenges
that may undermine the quality/
quantity of the medium-term labour
supply remain. For instance, the rising
duration of unemployment (currently
more than 40% of job seekers have
not worked for more than a year;
this proportion is growing) points to
deepening structural unemployment.
Especially vulnerable are youngsters
– the job-seekers’ rate for the15-24-year-old group is about twice
as high as the average for the entire
labour market. This age group is most
mobile and prone to emigrate, resulting
in a largely permanent labour loss.
Our forecast assumes slow wage
growth for 2011-2012, but shrinking
labour supply and severe skills
mismatch may kick off processes
that lead to imbalances akin to those
experienced a few years ago. Media
-40
-20
0
20
40
1Q 06 1Q 07 1Q 08 1Q 09 1Q 10
FTE* productivity, real gross wage and unit labour costs, %
Excess wage over FTE productivity growth
FTE* productivity, yoyUnit labour costs, yoySource: CSBL.* FTE - full-time equivalent
0
12
24
36
48
60
0
5
10
15
20
25
1Q 05 1Q 06 1Q 07 1Q 08 1Q 09 1Q 10
Job-seekers' rate, %
Job-seekers' rateJob-seekers' rate, 15-24 yrs old (rs)Job seekers for 1 year and more, % of total Source: CSBL.

8/8/2019 Swedbank Economic Outlook - 2010, September 21
http://slidepdf.com/reader/full/swedbank-economic-outlook-2010-september-21 21/29
September 21, 2010 21
Swedbank Economic OutlookLatvia
reports point to an increasing number
of cases in which employers face
difculties in nding a qualied worker
despite still high unemployment (e.g.
construction companies hire workers
from abroad – a sector that hasseen one of the largest job losses
during the recession). Such a skills
mismatch may push wage growth
above that of productivity – i.e., as the
economy expands, so does labour
demand, which cannot be matched by
supply as those unemployed lack the
required skills. This may again cause
competitiveness problems. Long-
term unemployment amplies social
problems such as income inequality
and pension system instabili ty, asliving incomes would rise for one
part of the population and stagnate/
decrease for the other.
The lesson to be learnt from the
past for the private sector is that
wage increases should be based
on productivity improvements. The
same applies also to the public sector,
where the remuneration policy should
be performance based and linked to
that in the private sector to improve
motivation. The migration policy shouldbe adjusted to address labour market
problems (e.g., an immigration policy
to attract well-educated labour to ease
undue wage pressures). Tax policy
that favours job creation is vital – e.g.,
lower social insurance payments
for targeted groups like long-term
unemployed or youth. And last but not
least, reform of higher education is
crucial to supply the labour market with
skills demanded by the employers.
Shallower and shorter deation period
Stronger-than-expected upward price
pressures from abroad (especially
of energy and food) has hastenedthe end of the deation period.
Consumers’ ination expectations have
risen, making it easier for businesses
to raise prices, an opportunity that they
seem to be quick to exploit. During
the rst eight months of the year,
monthly deation in the consumer
price index (CPI) was observed only
in May and August. The current trends
suggest that CPI will continue to rise
through the rest of the year and annual
ination is likely to resume already in
September.
Monthly core ination (i.e., CPI
excluding unprocessed food,
administratively regulated prices,
and fuel) has so far been negative,
but, if adjusted for seasonality, it
has been reporting positive monthly
increments since April (except in
August). The underlying pressures are
thus for prices to rise, and it seems
that household perception rather
than strength of the economy is the
key driver for it. Ination will add to
government tax revenues and ease
deleveraging for companies if they
can boost their margins, but it will
hit the purchasing power of poorer
households as (i) the prices of rst
necessities rise most, and (ii) due to
their lower skills, poorer households
have not seen their incomes rising
yet. It seems that the adjustment of
cost competitiveness through deation
will mostly be over by the end of this
year, and further gains will need to
come via productivity growth.
We forecast CPI to shrink by 1.2%
in 2010 (due to negative carryover
effects) and to grow by 1.5% and
2.5% in 2011 and 2012, respectively.
The currently discussed possibility of
eliminating the reduced VAT rate would
add an additional 1 percentage point
to annual CPI ination. This may lead
to weaker consumption in 2011, but
at the same time it may also put the
upward pressure on nominal wages
to compensate for ination (made
possible due to the skills mismatch
in the labour market). But a VAT rise
as such would not worsen external
competitiveness, as it affects imported
and locally produced goods equally,while exporters do not pay VAT at all.
There is a risk of higher ination than
our base scenario assumes if the
sustainable wage-productivity relations
outlined in the previous section are
not rmly established. This becomes
particularly important in the context
of the euro introduction aimed for in
2014, as it puts at risk the fullment of
the Maastricht price stability criterion,
especially if ination in the euro zone
remains low, as is currently expected.In addition, the timing and effect of
scal consolidation measures must be
carefully assessed – for instance, if
elimination of the reduced VAT rate is
unavoidable, this can be done only in
2011 and not in 2012, as it would raise
ination above the target.
Household consumption hasbottomed out
Household consumption started to
recover somewhat earlier than we
-10
-5
0
5
10
15
20
jan/06 jan/07 jan/08 jan/09 jan/10
Consumer and producer prices, %
Core CPI, yoy CPI, yoy
PPI, yoySource: CSBL.
-20
-15
-10
-5
0
5
10
-60
-45
-30
-15
0
15
30
jan/06 jan/07 jan/08 jan/09 jan/10
Retail trade and consumer confidence, %
Real turnover, mom %, (rs)Real turnover, yoy %Consumer conf idence, pts
Source: CSBL.
`

8/8/2019 Swedbank Economic Outlook - 2010, September 21
http://slidepdf.com/reader/full/swedbank-economic-outlook-2010-september-21 22/29
22 September 21, 2010
Swedbank Economic OutlookLatvia
anticipated, owing to higher consumer
condence and better overall situation
in the labour market. There are
indications that consumption may inch
down somewhat in autumn, however.The sharp increase in consumer
condence in the beginning of the
year has halted, and the upcoming
elections, along with the likely rise in
the unemployment rate in autumn, may
temporarily cut it back.
We now forecast a signicantly smaller
fall in 2010 household consumption,
owing to a better rst half of the year,
i.e. -2% and negative only due to the
base effect. Under the base scenario,
household consumption will grow by afurther 3% in 2011 and 4.5% in 2012. A
lesson from the crisis is that a “safety
cushion” is necessary, and households
will increase their precautionary
savings and reduce their leverage
through earlier repayment of their debt.
This is seen in the growth of deposits.
On the other hand, bank lending
is likely to gradually become more
forthcoming, adding to consumption.
2010 budget decit in line with the plan
The budget decit in 2010 is
expected to be just below the
8.5% of GDP cap, i.e., in line with
the agreements with the external
lenders. In the rst eight months
of 2010, tax revenues exceeded
the plan by about 2%, reecting
not only the improving economic
situation but also conservative budget
planning. Measured using cash-ow
methodology, the budget decit in
the rst seven months of the year
was only about 1.5% of the annual
estimated GDP. If the past is any
indicator for the future, expenditures
will rise towards the end of the year
and pick up most of the slack in the
decit. Fiscal discipline is still an issue – for instance, recently an additional
LVL 26 million was assigned for the
needs of hospitals (from emergency
funds). Implementation of a functioning
scal responsibility law (entailing, e.g.,
limitations to raise expenditures during
the scal year) is thus crucial.
The draft of the 2011 budget is still to
be seen. In the run-up to the general
elections held on October 2, parties
are avoiding speaking on specic
consolidation measures. The Ministryof Finance’s view is that LVL 350
million of consolidation is necessary
(about 2.8% of GDP) for 2011 to
cap the decit at 6% of GDP. Only a
general vision on tax policy changes
is available so far, but the dominating
view seems to be to shift the tax
burden from labour towards property
(e.g., residential real estate). It is also
expected that the regressive nature
of the tax system will be reduced by,
e.g., a higher tax-free allowance on
personal income. It is clear, however,
that the overall tax burden will increase
in 2011. Currently, we do not see a
high risk of exceeding the Maastricht
criteria on the budget decit and public
debt in 2012.
Structural reforms – waitinguntil after elections
It is impossible to speculate with a
reasonable degree of certainty on
the election results and thus specic
economic policy actions that may
follow after the elections – past
experience shows that opinion polls
are not a good indicator of election
outcomes. Although some of the
parties talk about Hungary-type radicalchanges to the IMF/EC-supported
program, we believe that the risk
of such moves is extremely slim if
not nonexistent. A radical change
would only raise uncertainty and
cost of funding; no alternative plan
to that currently pursued has been
presented even to discuss it. Certain
renegotiations are likely though; for
instance, Latvia is expected to borrow
less than initially planned.
With elections approaching, policymakers have become more reluctant
to make unpopular decisions, and
social concerns have tended to
overshadow the structural aspects
of economic policy. For instance, the
excise tax on natural gas was raised
in July 2010, but, just a moth later, its
implementation was then postponed
for a year, with the aim of easing the
nancial situation of households.
We believe that targeted transfers to
poorer households to compensate
for the higher cost of gas (and thus
heating) would have been more
efcient socially and cheaper for the
budget; meanwhile, the excise tax for
natural gas would have stimulated
the use of renewable resources
and potentially reduced import
dependency.
The Latvian economy has seen the
rst green shoots of recovery, but is
not yet on rm ground for a sustainable
and strong recovery. Less painful
temporary xes tend to be chosen over
sustainable solutions. We believe that
to a large degree this has been a pre-
election “cautiousness,” which is likely
to change when the October elections
pass. The next elections are for the
municipalities in 2013 – for decisive
politicians, this gives ample time to
implement unpopular but necessary
reforms and to reap their benets
before the 2013 elections.
Lija StrašunaMārtiņš Kazāks
Dainis Stikuts
-400
-200
0
200
400
600
800
-80
-40
0
40
80
120
160
jan/06 jan/07 jan/08 jan/09 jan/10
Tax revenues and budget deficit, LVL m
Budget deficit (rs) Value added tax Social insurance Personal incom e tax
Source: State Revenue Service.

8/8/2019 Swedbank Economic Outlook - 2010, September 21
http://slidepdf.com/reader/full/swedbank-economic-outlook-2010-september-21 23/29
September 21, 2010 23
Swedbank Economic OutlookLithuania
Lithuania: First steps on the long and winding road torecoveryKey Economic Indicators, 2009 - 2012 1/
Second-quarter GDP results
conrmed that the Lithuanian
economy was recovering: the
economy grew by 3.2 % (seasonally
and calendar-day adjusted),
while the annual GDP growth rate
reached 1.3%, thus moving intopositive territory for the rst time
since the third quarter of 2008.
Although a rebound was expected
after weak rst-quarter results,
the GDP growth recorded in the
second quarter nevertheless
exceeded our expectations. The
economy continued to be driven
out of the recession by the large,
export-oriented industrial sector,
the performance of which has been
gradually improving since autumn2009, owing to the sustained pickup
in demand in the EU economies.
Meanwhile, domestic demand has
remained under intense pressure.
Despite robust second-quarter
results, GDP over the rst half of the
year was nonetheless down by 0.7%
from the same period a year ago
due to the sharp 4% contraction on
a quarterly basis recorded in the rst
quarter.
We expect that the rate of expansionduring the third and fourth quarters
will weaken somewhat for three
reasons. First, even though exports
will remain the main driver of economic
growth, we do not anticipate a jump
in volumes compared with the rst
half of this year. Second, household
consumption and investments areunlikely to rebound swiftly. Despite
a gradually improving consumer
condence since last autumn, the
adverse labour market developments
have thus far prevented this
condence from translating into
an increase in spending. The only
signicant source of investments this
year remains the EU funds, which, due
to administrative and other hurdles,
are being absorbed more slowly than
was initially planned. For other private
sector investments to materialize, a
larger fall in the overall perception
of risk of the economic climate of
the country and/or a further decline
in asset prices are needed. Third,
the rapid rebuilding of stock levels is
nearly over. Stockbuilding is expectedto contribute positively to GDP growth
in the upcoming quarters, especially
during 2010, but also somewhat during
2011.
Instead of the 2% GDP contraction
projected in April, we foresee the
Lithuanian economy growing by
0.5% this year. Better-than-expected
second-quarter developments altered
our outlook for the economy, while the
stronger global growth expected this
year also contributed to the revision
9.8%
2.8%
-14.8%
0.5%3.0% 4.5%
-30%
-20%
-10%
0%
10%
20%
2007 2008 2009 2010F 2011F 2012F
Contributions to GDP Growth
Net export StockbuildingInvestment Government consumptionHousehold consumption GDP growth Sources: LDS and Swedbank calculations.
2009 2010f 2011f 2012f
Economic growth, % -14.8 0.5 3.0 4.5
GDP, m euros 26 650 26 970 28 057 29 760
Growth of consumer prices, % 4.5 1.0 1.0 1.5
Unemployment level, % 13.7 17.0 15.5 14.0
Growth of real net wage, % -7.2 -5.0 0.0 2.5
Growth of exports of goods and services, % -25.2 22.7 12.0 9.5
Growth of imports of goods and services, % -35.8 23.0 11.2 9.4
Balance of goods and services, % of GDP -0.7 -1.0 -0.5 -0.5
Current account, % of GDP 3.8 1.2 0.0 -0.2
Current and capital account, % of GDP 7.2 4.2 3.0 2.8
FDI inow, % of GDP 0.9 1.0 1.5 2.0Foreign gross debt, % of GDP 86.5 89.0 85.0 82.0
General government budget position, % of GDP -8.9 -8.0 -6.0 -3.0
General government debt, % of GDP 29.5 38.0 42.0 43.0
Sources: LCD and Swedbank.
1/ Annual percentage change, unless otherwise indicated.

8/8/2019 Swedbank Economic Outlook - 2010, September 21
http://slidepdf.com/reader/full/swedbank-economic-outlook-2010-september-21 24/29
24 September 21, 2010
Swedbank Economic OutlookLithuania
of our forecast. As in the rst half, the
recovery during the rest of the year will
be driven by exports and restocking,
while domestic demand will remainunder pressure and is forecast to
contract overall this year.
The economy should grow by 3%
next year, driven by the positive
contribution of net exports and the
slow recovery of domestic demand.
Stockbuilding will contribute positively
to GDP growth, although to a much
lesser extent than this year. Compared
with our April forecast, government
consumption in 2011 is now expected
to contract by less; meanwhile, therevival in investments will be slightly
slower next year than was forecast in
April. Despite the improved outlook for
export and import growth for this year,
the forecast for next year remains the
same as in April because of the recent
revision downwards of the global
outlook. Our main scenario sees the
economy expanding further by 4.5% in
2012 as household consumption and
investments become more signicant
drivers of economic growth; net
exports will continue to support GDP
growth as well.
In terms of both positive and negative
risks, global developments remain one
of the most crucial factors affecting
the economy in the forecast period.
In addition, a protracted recovery
in domestic demand, especially
household consumption, will pose a
signicant obstacle to the Lithuanian
economy over the forecast period.
Given the adverse labour market
developments, it is not surprising
thus that even those less affected by
the downturn have so far remained
overly cautious regarding spending.
Unemployment has continued to
rise this year, reaching 18.3% in the
second quarter, and, even thoughthe decline in wages seems to have
ceased, wages are still likely to face
downward pressures going forward –
even if an increase were to materialize,
it would not be signicant.
Export growth to slowsomewhat
Export volumes recovered faster than
anticipated during the rst half of the
year, owing to the sustained pickup in
demand from the EU. Based on this
stronger-than-expected performance,as well as the upward revision for this
year in the outlook for the main export
markets in the EU (Germany and the
Nordic countries in particular), export
recovery during 2010 is likely to be
much faster than was anticipated in
our April forecast. Exports are likely to
increase by 10.5% during 2010 in real
terms, instead of the 4.5% projected
in April.
During 2011, however, the stronger-
than-expected recovery in the EU
economies recorded this year is
projected to fade out. We thus expect
export growth to weaken next year,easing to 6.5% in real terms. Even
though the actual numbers projected
remain unchanged from our April
forecast, the reasoning behind the
forecast differs – the numbers now
reect a deceleration of export growth
in line with the more pessimistic
outlook foreseen for Lithuania’s main
trade partners. In our April forecast, we
underestimated how quickly the export
recovery would materialize this year.
If the April global outlook were still in
place, our forecasts for export andimport growth would have had to be
raised for next year as well.
The traditional large manufacturing,
lower- and medium-value-added
industries, such as chemicals and
plastics, as well as paper and wood,
have so far been leading the export
growth. The rebound of the transport
services sector is notable as well, even
considering the drastic contraction
in 2009 and thus the much smaller
Swedbank’s GDP Forecast – Lithuania
2009 2010F 2011F 2012F
GDP -14.8 0.5 (-2.0) 3.0 (3.0) 4.5
Household consumption -16.8 -5.0 (-5.0) 1.0 (1.0) 3.0
General government consumption -1.2 -3.0 (-4.5) -1.0 (-5.0) 1.0Gross xed capital formation -39.1 -9.0 (-3.5) 7.0 (8.0) 8.5
Export of goods and services -14.3 10.5 (4.5) 6.5 (6.5) 7.7
Import of goods and services -29.4 8.8 (2.2) 5.0 (5.0) 5.5
Net exports contribution to GDP growth 15.2 0.6 (1.2) 0.8 (0.8) 1.3
Stockbuiding contribution to GDP growth -6.5 6.4 (3.1) 0.6 (1.3) -0.6
Sources: LCD and Swedbank.1/ The gures are for illustrative purpose only. These are averages of the forecast ranges, which are as wide as ca 2
percentage points in each direction. The gures from our forecast in April are given in brackets.
-100
-80
-60
-40
-20
0
20
40
2007 2008 2009 2010
Confidence Indicators
Overall sentiment IndustryConstruction Retail tradeServices Consumer Source: LDS

8/8/2019 Swedbank Economic Outlook - 2010, September 21
http://slidepdf.com/reader/full/swedbank-economic-outlook-2010-september-21 25/29
September 21, 2010 25
Swedbank Economic OutlookLithuania
comparative base. The sector appears
to be surprisingly resilient despite
some adverse factors, including cost
increases at the beginning of this year.
Given the still-short recovery period,neither a more notable diversication
in products and export markets
nor a move to higher-value-added
production has yet taken place.
Some signs that these are beginning
to happen are, however, visible:
Lithuanian export companies, e.g.,
have begun discovering new export
markets in Southeast Asia and Africa.
Because emerging economies are
expected to drive global economic
growth, at least in the near future,
they certainly cannot be ignored.
Diversication of products and,
especially, moving up the global value
chain require, however, more time
– we expect signs of such structural
changes in the economy to become
visible only in a few years. The
government has stepped up efforts
to attract the “right” investments to
higher-value-added sectors, especially
in the IT services sector, and aims
to foster university and company
collaboration in R&D, which couldaccelerate the process.
Imports this year have been primarily
driven by export growth. We have thus
also raised our import growth forecast
and expect these to increase by 8.8%
in 2012 in real terms, instead of the
5% projected in April. During 2011,
import growth will slow to 5%. Imports
next year are anticipated to continue to
be driven by export growth; however,
household consumption will slowly
start to be a contributing factor as well.
The net export contribution to GDP
growth is to remain positive both this
year and next.
We expect the Lithuanian currentaccount to reach a surplus of 1% of
GDP this year and to be balanced
in 2011, as import growth should
be largely driven by the growth in
exports. A small decit in 2012 is likely,
given that investments will rebound
somewhat from their complete
absence of them during the economic
downturn, as well as because of the
recovery in household consumption.
Investments to remain weak
The results of the improved risk
assessments of the country’s
economic climate following the
successful stabilization in public
nances have yet to materialize. In
our previous outlook, we anticipated
that cheaper and larger capital
inows and an improvement in credit
conditions would occur towards
the end of the year – this forecast
remains unchanged, and we expect
genuine improvement in investments
to commence at the end of 2010or beginning of 2011. Even though
investments (excluding inventories)
increased in the second quarter from
the rst, the seemingly large rebound
is mainly due to the smaller base of
the rst quarter; the absolute volumes
of investments (excluding inventories)
remain below those of any quarter in
2009.
The projected slow rate of recovery is
mainly due to the fact that companies
are still trying to reduce their debt and
are tending to abstain from borrowing
additional funds for expansion given
still-low capacity-utilisation rates and
the uncertain recovery both in globaland domestic demand. In addition,
although asset prices have fallen
considerably, they are still viewed as
high by investors, especially foreign
companies. We anticipate gross xed
capital formation to decline by 9% this
year instead of the 3.5% foreseen in
April. We also expect investments
to rebound somewhat more slowly
during 2011 --by 7%, instead of the 8%
anticipated in our previous outlook.
The implementation of EU structuralfunds, which are the main source of
investments this year and a lifeboat
for some companies, especially small
and medium-sized enterprises (SMEs),
is lagging behind. Approximately
only one-third of the planned funds
have been allocated to companies
so far. An even smaller percentage
of the planned funds were allocated
through government institutions, such
as for roads and other infrastructure
developments. The effect of theeconomic stimulus plan on economic
growth thus far remains highly
ambiguous, and is likely to be rather
minuscule this year. The renovation of
old apartment blocks has also come
to a complete halt – the government
is even considering starting the
renovations without the consent of
all the owners of the buildings, and/
or imposing sanctions on the owners’
associations that are refusing to start
the renovations.
Stockbuilding continued to grow rapidly
during the rst two quarters of the year
as companies were quickly rebuilding
their inventory levels depleted during
the downturn. Inventory restocking
thus made an enormous positive
contribution to GDP growth during the
rst half of the year, accounting for
about 8 percentage points of annual
growth. This factor should continue to
support growth going forward, although
to a much lesser degree.-50%
-40%
-30%
-20%
-10%
0%
10%
20%
30%
40%
50%
2007 2008 2009 2010
Growth of export and import of goods and services in currentprices, yoy %
Exports Imports Source: LDS
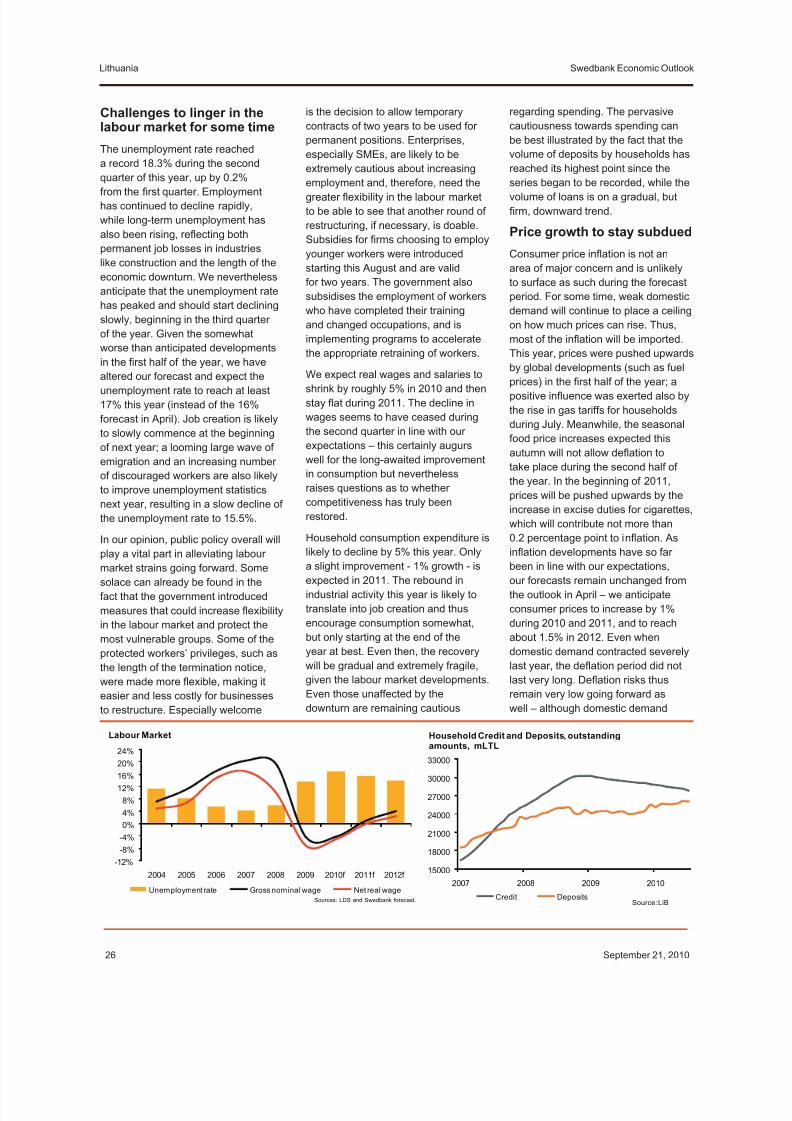
8/8/2019 Swedbank Economic Outlook - 2010, September 21
http://slidepdf.com/reader/full/swedbank-economic-outlook-2010-september-21 26/29
26 September 21, 2010
Swedbank Economic OutlookLithuania
Challenges to linger in thelabour market for some time
The unemployment rate reached
a record 18.3% during the second
quarter of this year, up by 0.2%from the rst quarter. Employment
has continued to decline rapidly,
while long-term unemployment has
also been rising, reecting both
permanent job losses in industries
like construction and the length of the
economic downturn. We nevertheless
anticipate that the unemployment rate
has peaked and should start declining
slowly, beginning in the third quarter
of the year. Given the somewhat
worse than anticipated developmentsin the rst half of the year, we have
altered our forecast and expect the
unemployment rate to reach at least
17% this year (instead of the 16%
forecast in April). Job creation is likely
to slowly commence at the beginning
of next year; a looming large wave of
emigration and an increasing number
of discouraged workers are also likely
to improve unemployment statistics
next year, resulting in a slow decline of
the unemployment rate to 15.5%.
In our opinion, public policy overall will
play a vital part in alleviating labour
market strains going forward. Some
solace can already be found in the
fact that the government introduced
measures that could increase exibility
in the labour market and protect the
most vulnerable groups. Some of the
protected workers’ privileges, such as
the length of the termination notice,
were made more exible, making it
easier and less costly for businesses
to restructure. Especially welcome
is the decision to allow temporary
contracts of two years to be used for
permanent positions. Enterprises,
especially SMEs, are likely to be
extremely cautious about increasing
employment and, therefore, need the
greater exibility in the labour market
to be able to see that another round of
restructuring, if necessary, is doable.
Subsidies for rms choosing to employ
younger workers were introduced
starting this August and are valid
for two years. The government also
subsidises the employment of workers
who have completed their training
and changed occupations, and is
implementing programs to accelerate
the appropriate retraining of workers.
We expect real wages and salaries to
shrink by roughly 5% in 2010 and then
stay at during 2011. The decline in
wages seems to have ceased during
the second quarter in line with our
expectations – this certainly augurs
well for the long-awaited improvement
in consumption but nevertheless
raises questions as to whether
competitiveness has truly been
restored.
Household consumption expenditure is
likely to decline by 5% this year. Only
a slight improvement - 1% growth - is
expected in 2011. The rebound in
industrial activity this year is likely to
translate into job creation and thus
encourage consumption somewhat,
but only starting at the end of the
year at best. Even then, the recovery
will be gradual and extremely fragile,
given the labour market developments.
Even those unaffected by the
downturn are remaining cautious
regarding spending. The pervasive
cautiousness towards spending can
be best illustrated by the fact that the
volume of deposits by households has
reached its highest point since the
series began to be recorded, while the
volume of loans is on a gradual, but
rm, downward trend.
Price growth to stay subdued
Consumer price ination is not an
area of major concern and is unlikely
to surface as such during the forecast
period. For some time, weak domestic
demand will continue to place a ceiling
on how much prices can rise. Thus,
most of the ination will be imported.
This year, prices were pushed upwardsby global developments (such as fuel
prices) in the rst half of the year; a
positive inuence was exerted also by
the rise in gas tariffs for households
during July. Meanwhile, the seasonal
food price increases expected this
autumn will not allow deation to
take place during the second half of
the year. In the beginning of 2011,
prices will be pushed upwards by the
increase in excise duties for cigarettes,
which will contribute not more than0.2 percentage point to ination. As
ination developments have so far
been in line with our expectations,
our forecasts remain unchanged from
the outlook in April – we anticipate
consumer prices to increase by 1%
during 2010 and 2011, and to reach
about 1.5% in 2012. Even when
domestic demand contracted severely
last year, the deation period did not
last very long. Deation risks thus
remain very low going forward as
well – although domestic demand
15000
18000
21000
24000
27000
30000
33000
2007 2008 2009 2010
Household Credit and Deposits, outstandingamounts, mLTL
Credit DepositsSource: LiB
-12%
-8%
-4%
0%
4%
8%
12%
16%
20%
24%
2004 2005 2006 2007 2008 2009 2010f 2011f 2012f
Labour Market
Unemployment rate Gross nominal wage Net real wageSources: LDS and Swedbank forecast.

8/8/2019 Swedbank Economic Outlook - 2010, September 21
http://slidepdf.com/reader/full/swedbank-economic-outlook-2010-september-21 27/29
September 21, 2010 27
Swedbank Economic OutlookLithuania
will remain weak, it is about to start
a gradual recovery, with downward
pressures abating.
Fiscal policy to stay prudent
We have not altered our forecast and
expect the budget decit for 2010
to reach 8% of GDP. Mostly due to
conservative budget planning, tax
revenues have so far exceeded the
plan. On the one hand, this raises the
risk that government spending could
be increased more than necessary
next year – something that should be
avoided, especially considering that, in
terms of absolute numbers, revenues
have still been falling. On the other
hand, the government appears to bermly set to adopt yet another austerity
budget in 2011, with some small
changes in the tax policy.
The exact plans for the 2011 budget,
however, remain unclear at the time
of writing. It is certain that excise
taxes for cigarettes and diesel are
to be raised to comply with the EU
requirements; the income tax or value-
added tax (VAT) rates are unlikely to
be altered. There is a possibility that
a real estate tax will be introduced;this is under discussion. Further
signicant cuts in spending are also
unlikely – that is, public sector wages
and benets are unlikely to decrease
further, which will boost the condence
and expendable income of the
affected consumer groups. Similarly,
businesses that supply the government
can also expect fewer problems with
public purchasing volumes next year.
There is some risk that scal austerity
will be maintained less stringently
than desired due to the upcoming
2012 elections. However, even thoughsome relaxing of the tight scal policy
of the last few years is possible, the
current government since the start of
its term has been a vocal advocate for
austerity measures and has praised
itself for stabilizing the economy
by implementing such a policy. We
foresee that the 3 % budget decit
target (consistent with the Maastricht
criterion) will be met; however, there
are risks as scal challenges will
remain.As expected, the government has
continued borrowing on the open
market this year; the yield has been
decreasing gradually, given the
successful implementation of scal
policy since the beginning of the
year and the general decline in the
risk assessments of the sovereign
debt. At end-June 2010, central
government debt amounted to EUR
9,146 million, accounting for 33.7% of
the GDP projected for 2010. The debtdevelopments have so far been in
line with our expectations, and, given
the generally adhered to rhetoric on
budget discipline, we maintain our
forecast on general government debt
and do not expect it to overshoot 42%
of GDP by the end of 2012.
The government has recently
introduced a plan to restructure the
government-owned enterprises in all
sectors, including energy, wood, and
transport, which are currently claimed
to be inefciently run and frequently
require large subsidies from the budget
to be kept aoat. The restructuring
began with an in-depth assessment
earlier this year of the value of the
assets, which are estimated to stand
at approximately EUR 5 billion, as
well as the establishment of an
institution that would coordinate
the process. The restructuring of
government enterprises by, among
other proposed measures, streamlining
their operations and establishing
a board independent from political
inuences should increase their efciency substantially, and some
companies will be privatized. The
increase in efciency in turn would
bring, according to the government,
an estimated EUR 400 million
(approximately EUR 220 per year
to each citizen) per year to the
government budget in the form of
dividends. We rmly approve of this
initiative and its goals – not only will
the restructuring be a signicant boost
to the public nances, the listing of thecompanies on the stock exchange will
increase the liquidity in the Lithuanian
capital market, thus making it more
attractive for foreign investors and
more accessible for local companies
that seek to raise capital.
Lina Vrubliauskienė
Ieva Vyšniauskaitė
-1.0%
-0.5%
0.0%
0.5%
1.0%
1.5%
2.0%
2.5%
3.0%
3.5%
-4%
-2%
0%
2%
4%
6%
8%
10%
12%
14%
2007 2008 2009 2010
Consumer Prices
CPI, mom (r.s.) CPI, yoy (l.s.) Source: LDS
0%
10%
20%
30%
40%
50%
-10%
-8%
-6%
-4%
-2%
0%
2006 2007 2008 2009 2010f 2011f 2012f
General Government Finances, % of GDP
Debt (rs) Budget position (ls)
Source:s Lithuanian MoF, and Swedbank calculations.

8/8/2019 Swedbank Economic Outlook - 2010, September 21
http://slidepdf.com/reader/full/swedbank-economic-outlook-2010-september-21 28/29
28 September 21, 2010
Swedbank Economic Outlook
Economic Research Department
Sweden
Cecilia Hermansson +46 8 5859 7720 [email protected] Chief EconomistChief Economist, SwedenMagnus Alvesson +46 8 5859 3341 [email protected] EconomistJörgen Kennemar +46 8 5859 7730 [email protected] EconomistHelena Karlsson +46 8 5859 7740 [email protected]
EstoniaMaris Lauri +372 6 131 202 [email protected] Economist, Estonia
Elina Allikalt +372 6 131 989 [email protected] EconomistAnnika Paabut +372 6 135 440 [email protected] Economist
LatviaMārtiņš Kazāks +371 67 445 859 [email protected] Group Chief EconomistChief Economist, LatviaDainis Stikuts +371 67 445 844 [email protected] EconomistLija Strašuna +371 67 445 875 [email protected] Economist
LithuaniaLina Vrubliauskienė +370 5 268 4275 [email protected] Economist, LithuaniaIeva Vyšniauskaitė +370 5 268 4156 [email protected] Economist

8/8/2019 Swedbank Economic Outlook - 2010, September 21
http://slidepdf.com/reader/full/swedbank-economic-outlook-2010-september-21 29/29
Swedbank Economic Outlook
Disclaimer
This research report has been prepared by economists of Swedbank’s Economic Research Department. The EconomicResearch Department consists of research units in Estonia, Latvia, Lithuania and Sweden, is independent of other departments of Swedbank AB (publ) (“Swedbank”) and responsible for preparing reports on global and home marketeconomic developments. The activities of this research department differ from the activities of other departments of
Swedbank and therefore the opinions expressed in the reports are independent from interests and opinions that might beexpressed by other employees of Swedbank.
This report is based on information available to the public, which is deemed to be reliable, and reects the economists’personal and professional opinions of such information. It reects the economists’ best understanding of the information atthe moment the research was prepared and due to change of circumstances such understanding might change accordingly.
This report has been prepared pursuant to the best skills of the economists and with respect to their best knowledge thisreport is correct and accurate, however neither Swedbank or any enterprise belonging to Swedbank or Swedbanks directors,ofcers or other employees or afliates shall be liable for any loss or damage, direct or indirect, based on any aws or faultswithin this report.Enterprises belonging to Swedbank might have holdings in the enterprises mentioned in this report and provide nancialservices (issue loans, among others) to them. Aforementioned circumstances might inuence the economic activities of suchcompanies and the prices of securities issued by them.
The research presented to you is of informative nature. This report should in no way be interpreted as a promise or conrmation of Swedbank or any of its directors, ofcers or employees that the events described in the report shall take placeor that the forecasts turn out to be accurate. This report is not a recommendation to invest into securities or in any other wayenter into any nancial transactions based on the report. Swedbank and its directors, ofcers or employees shall not be liablefor any loss that you may suffer as a result of relying on this report.
We stress that forecasting the developments of the economic environment is somewhat speculative of nature and the realsituation might turn out different from what this report presumes.
IF YOU DECIDE TO OPERATE ON THE BASIS OF THIS REPORT THEN YOU ACT SOLELY ON YOUR OWN RISK ANDARE OBLIGED TO VERIFY AND ESTIMATE THE ECONOMIC REASONABILITY AND THE RISKS OF SUCH ACTIONINDEPENDENTLY.