Sustainability Issues in Water Distribution Systems · Water • WaterGEMS • WaterCAD • HAMMER...
47
Sustainability Issues in Water Distribution Systems Tom Walski, Ph.D., P.E., D. WRE Senior Product Manager
Transcript of Sustainability Issues in Water Distribution Systems · Water • WaterGEMS • WaterCAD • HAMMER...

Sustainability Issues inWater Distribution Systems
Tom Walski, Ph.D., P.E., D. WRESenior Product Manager
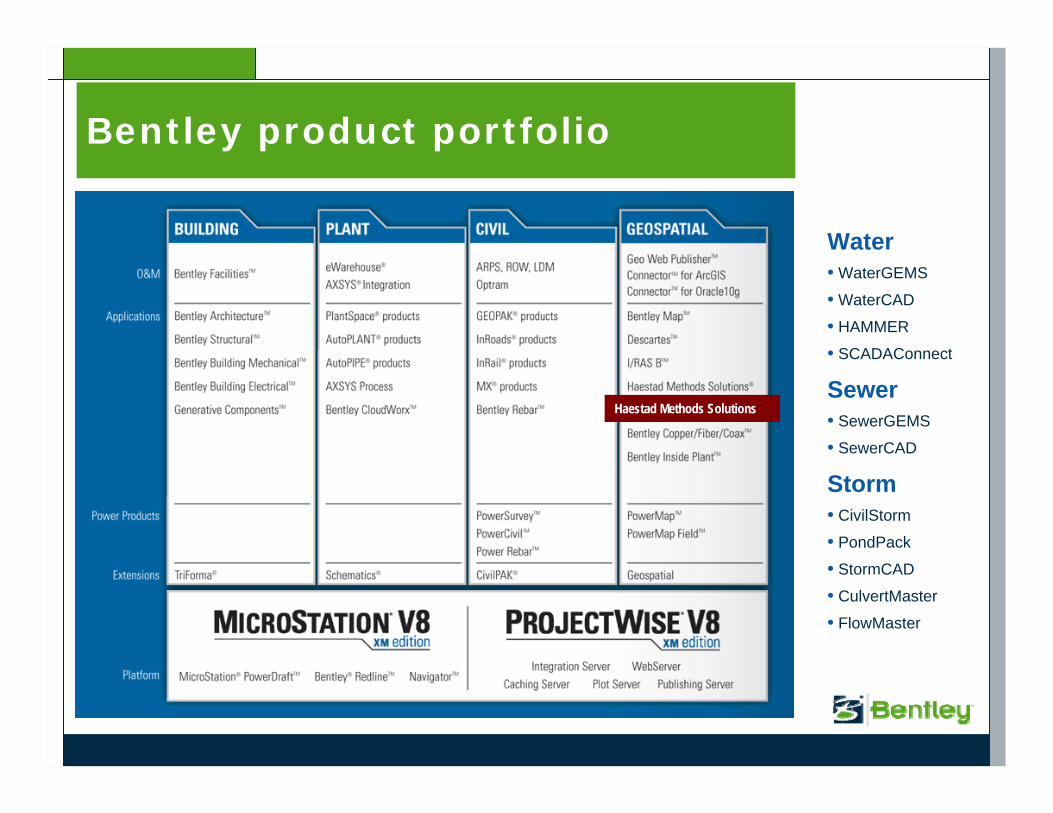
Water• WaterGEMS
• WaterCAD
• HAMMER
• SCADAConnect
Sewer• SewerGEMS
• SewerCAD
Storm• CivilStorm
• PondPack
• StormCAD
• CulvertMaster
• FlowMaster
Haestad Methods Solutions
Bentley product portfolio

Sustainability – Water Distribution
• Decaying Infrastructure–Breaks–Leaks
• Energy Use–Excessive Head Loss–Pump Stations
3 | WWW.BENTLEY.COM
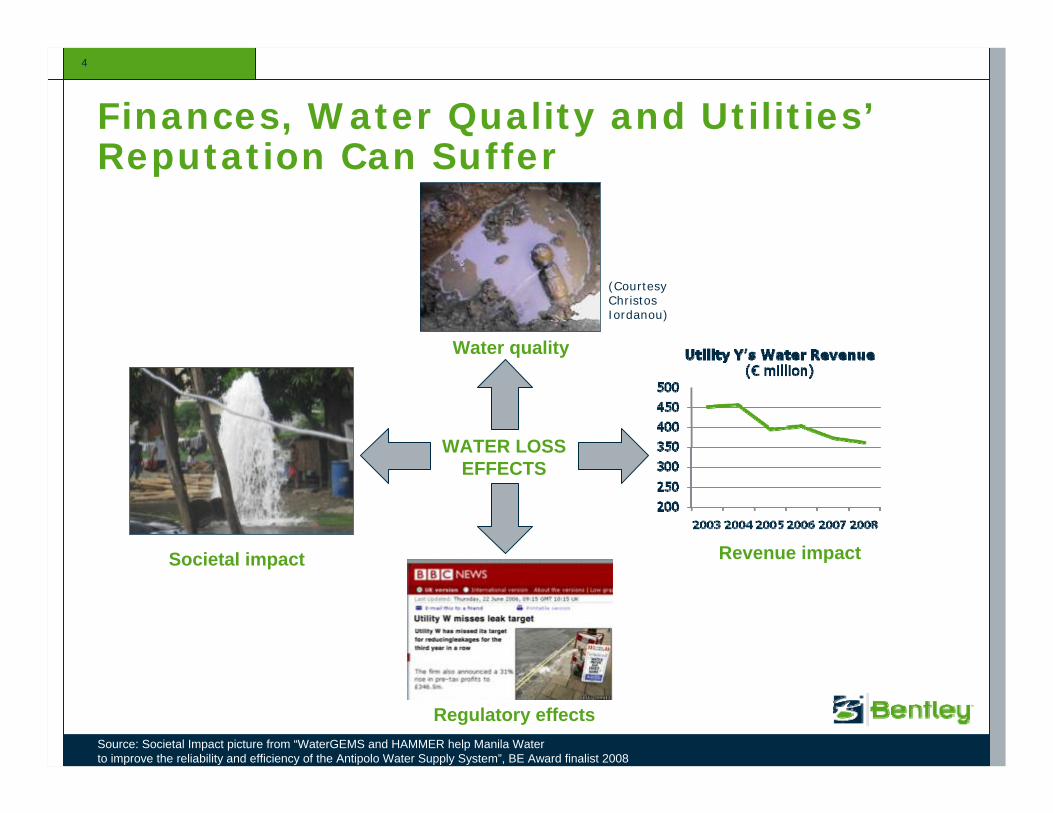
Finances, Water Quality and Utilities’Reputation Can Suffer
WATER LOSS EFFECTS
Revenue impactSocietal impact
Water quality
(Courtesy Christos Iordanou)
Regulatory effectsSource: Societal Impact picture from “WaterGEMS and HAMMER help Manila Water to improve the reliability and efficiency of the Antipolo Water Supply System”, BE Award finalist 2008
4
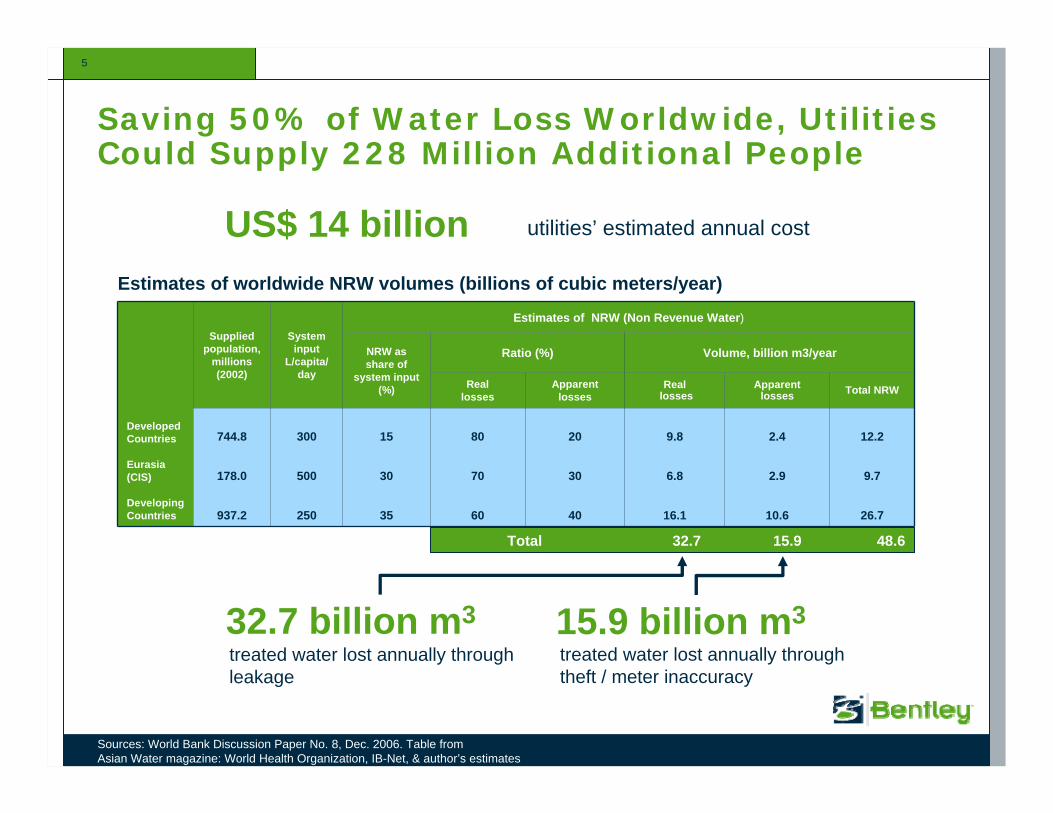
Saving 50% of Water Loss Worldwide, Utilities Could Supply 228 Million Additional People
32.7 billion m3treated water lost annually through leakage
15.9 billion m3treated water lost annually throughtheft / meter inaccuracy
US$ 14 billion
Sources: World Bank Discussion Paper No. 8, Dec. 2006. Table fromAsian Water magazine: World Health Organization, IB-Net, & author’s estimates
5
Developed Countries
Eurasia (CIS)
Developing Countries
Supplied population,
millions (2002)
System input
L/capita/day
Estimates of NRW (Non Revenue Water)
NRW as share of
system input (%)
Ratio (%) Volume, billion m3/year
Reallosses
Apparentlosses
Reallosses
Apparentlosses Total NRW
744.8
178.0
937.2
300
500
250
15
30
35
80
70
60
20
30
40
9.8
6.8
16.1
2.4
2.9
10.6
12.2
9.7
26.7
Estimates of worldwide NRW volumes (billions of cubic meters/year)
Total 32.7 15.9 48.6
utilities’ estimated annual cost

Leak Reduction
• Find and fix leaks
• Leak tracking – Understand causes– Map– Asset management
• Pressure management
• Hydraulic analysis
• District metered areas (DMA)
• Impact of breaks (criticality)
6 | WWW.BENTLEY.COM

Leak Records
• Most utilities keep leak records
• Many forms– Paper records– Databases– Spreadsheets– Shapefiles– Work orders
• Import to GIS
• Need x-y coordinates – (georeference)
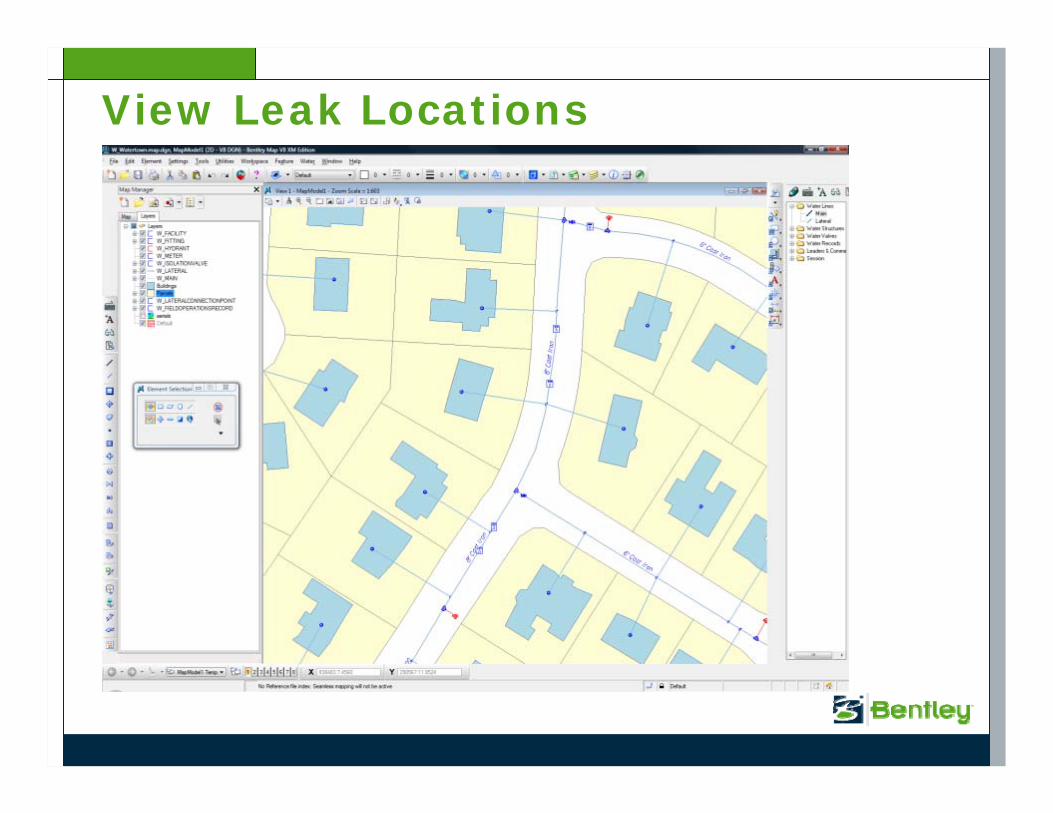
View Leak Locations
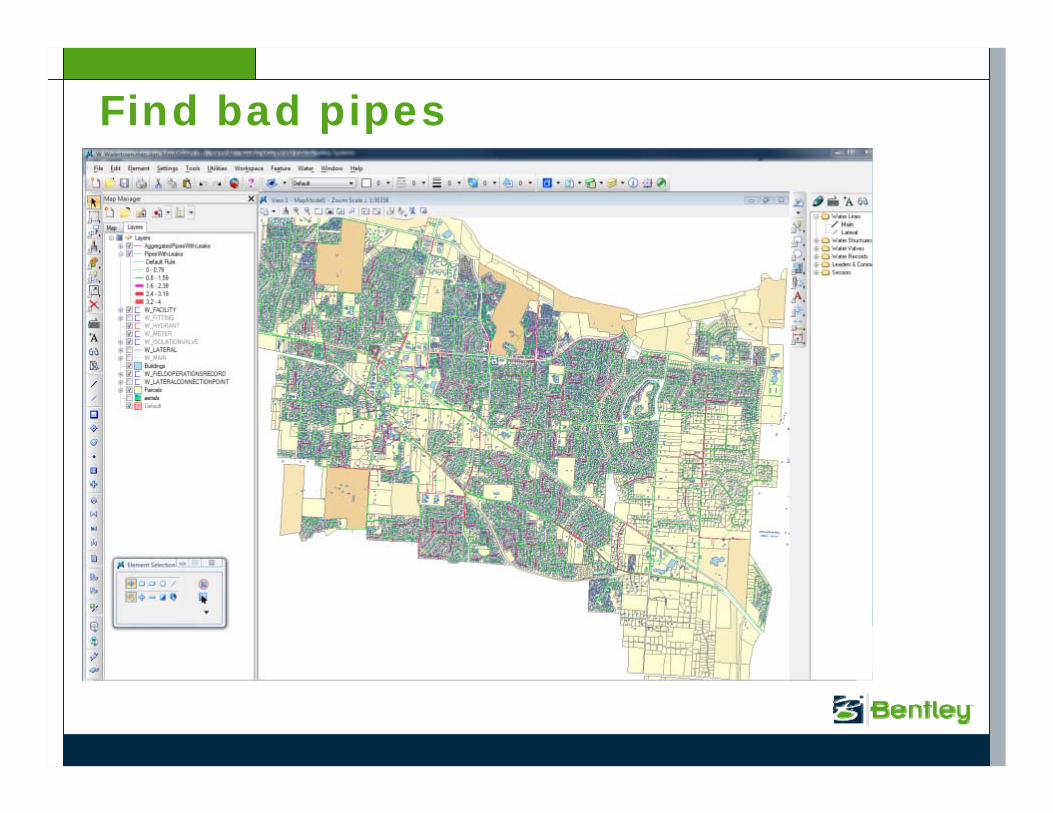
Find bad pipes
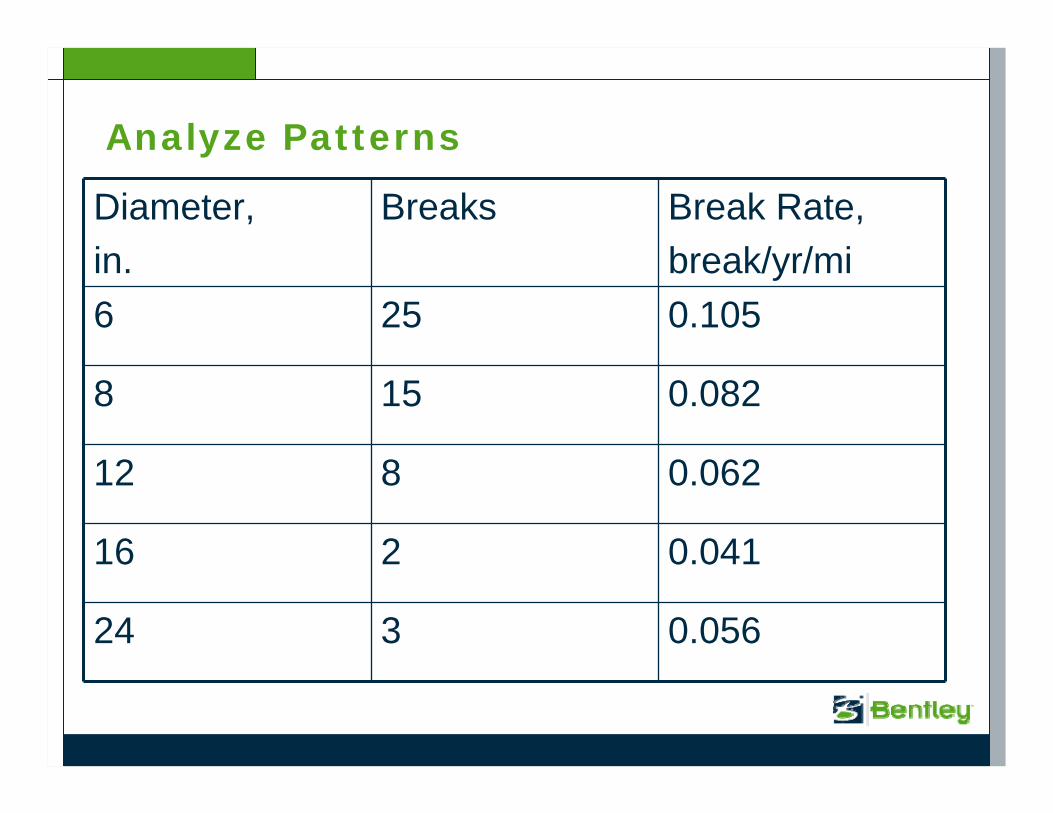
Analyze Patterns
Diameter,in.
Breaks Break Rate,break/yr/mi
6 25 0.105
8 15 0.082
12 8 0.062
16 2 0.041
24 3 0.056
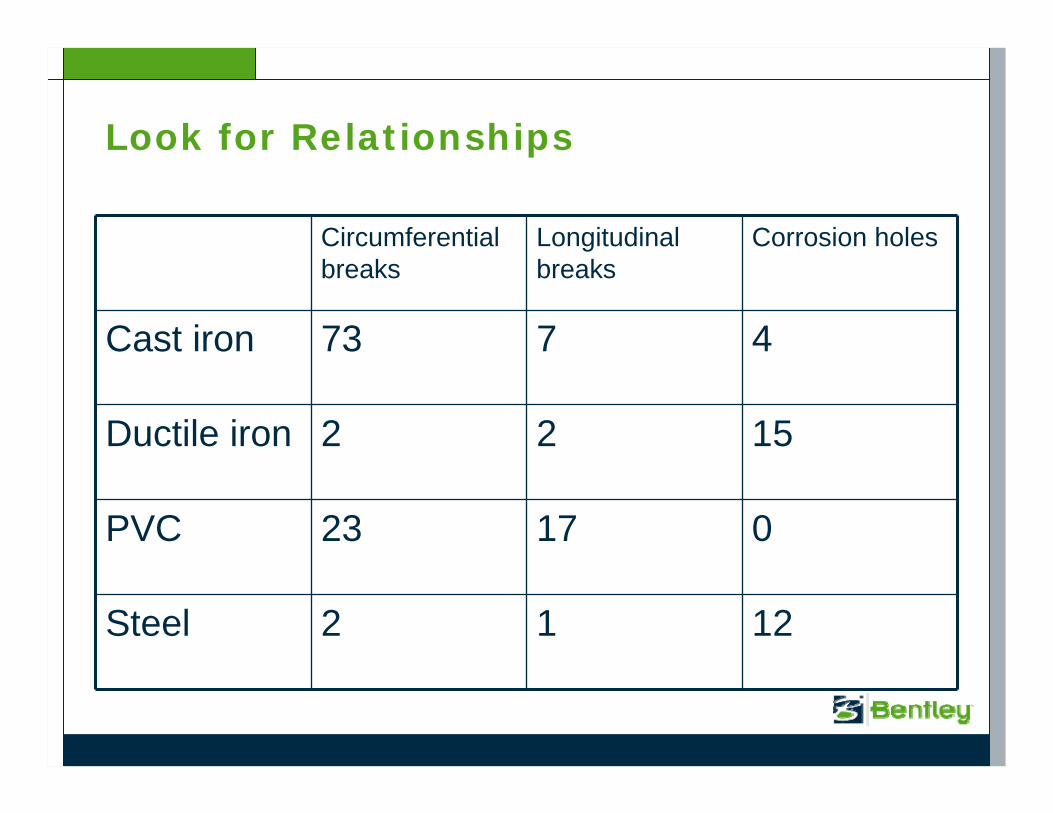
Look for Relationships
Circumferential breaks
Longitudinal breaks
Corrosion holes
Cast iron 73 7 4
Ductile iron 2 2 15
PVC 23 17 0
Steel 2 1 12

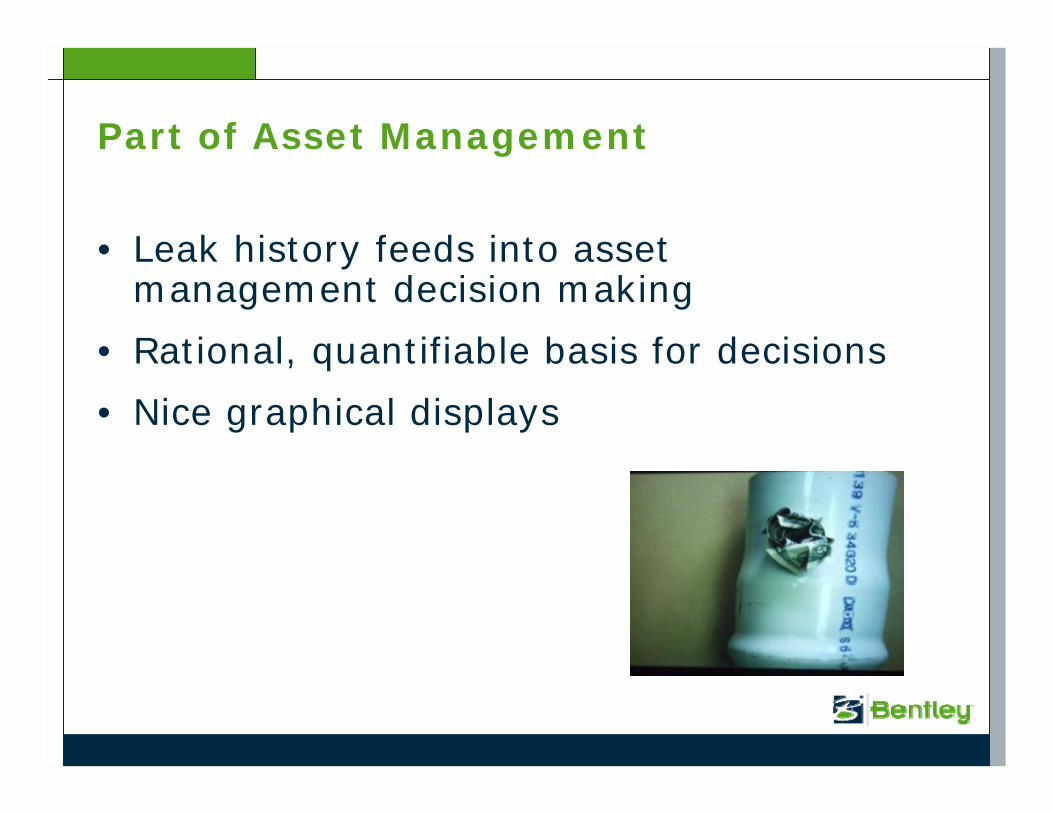
Part of Asset Management
• Leak history feeds into asset management decision making
• Rational, quantifiable basis for decisions
• Nice graphical displays
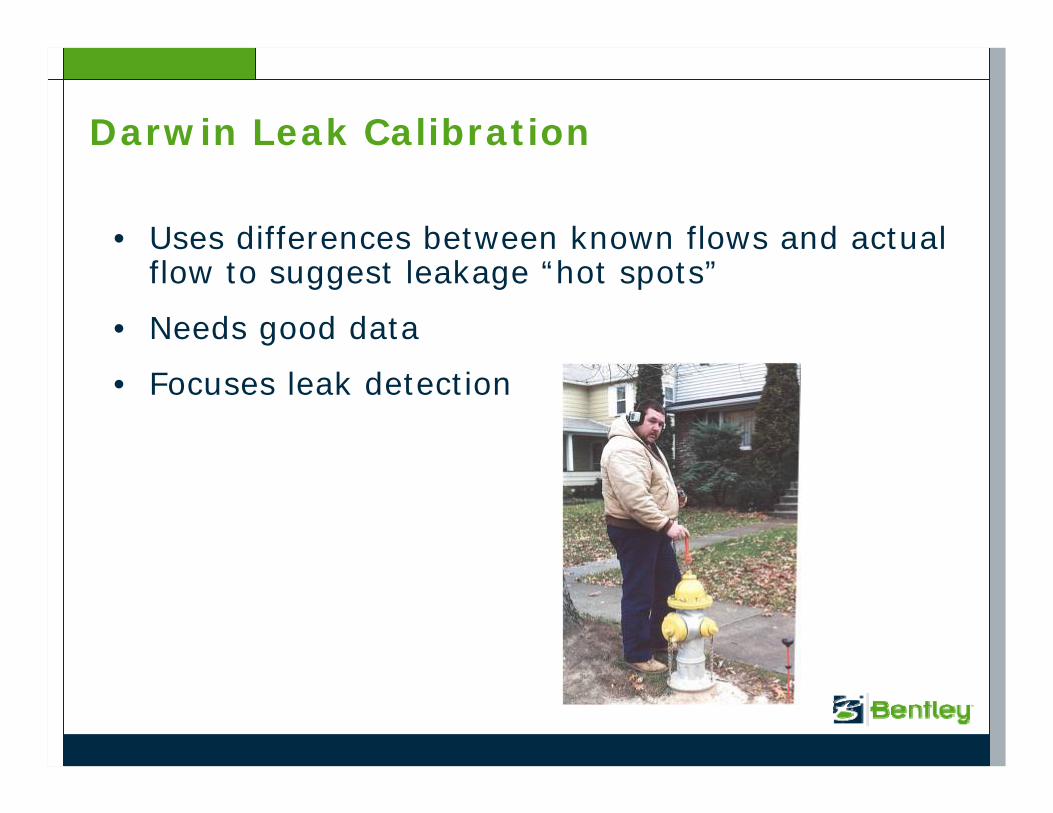
Darwin Leak Calibration
• Uses differences between known flows and actual flow to suggest leakage “hot spots”
• Needs good data
• Focuses leak detection

AuthorizedDemand
SystemInflow Loss/Theft
Where is the Loss?
DarwinLeak

Leak Test Case
• United Utilities, UK
• Significant leakage was known to be present
• Wanted more than sonic leak detection
• Small demand management areas (DMA) with good flow and pressure data
• Darwin successfully found leak “hot spots”

Lessons Learned
• Need plenty of good data– System flow – Multiple pressure points– Good metered demand estimate
• Best to use nighttime data – Less impact of uncertainty in roughness
• May need additional data collection
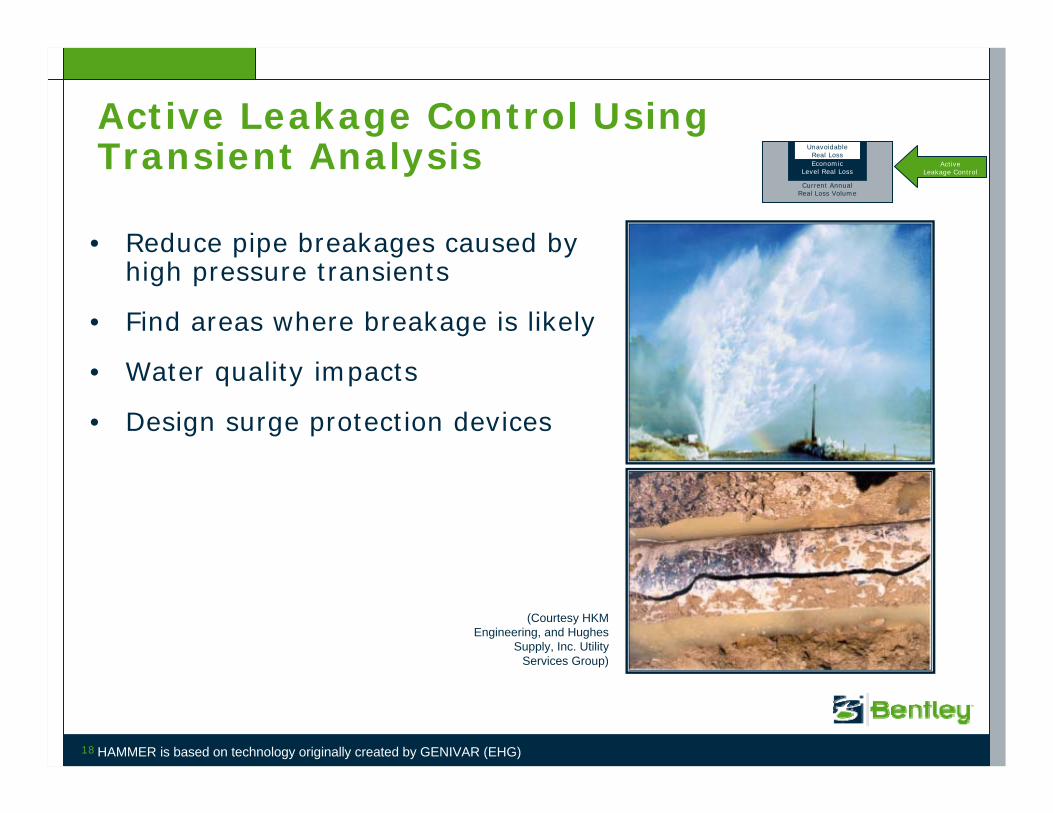
Active Leakage Control Using Transient Analysis
• Reduce pipe breakages caused by high pressure transients
• Find areas where breakage is likely
• Water quality impacts
• Design surge protection devices
18
(Courtesy HKM Engineering, and Hughes
Supply, Inc. Utility Services Group)
HAMMER is based on technology originally created by GENIVAR (EHG)
Current AnnualReal Loss Volume
Economic Level Real Loss
UnavoidableReal Loss
ActiveLeakage Control

Pressure Management Using Hydraulic Model
• Reduce real water losses through planned pressure reduction
• Used for leaks that can’t be found or fixed in the near future
19
Pres
sure
Man
agem
ent
Current AnnualReal Loss Volume
Economic Level Real Loss
UnavoidableReal Loss
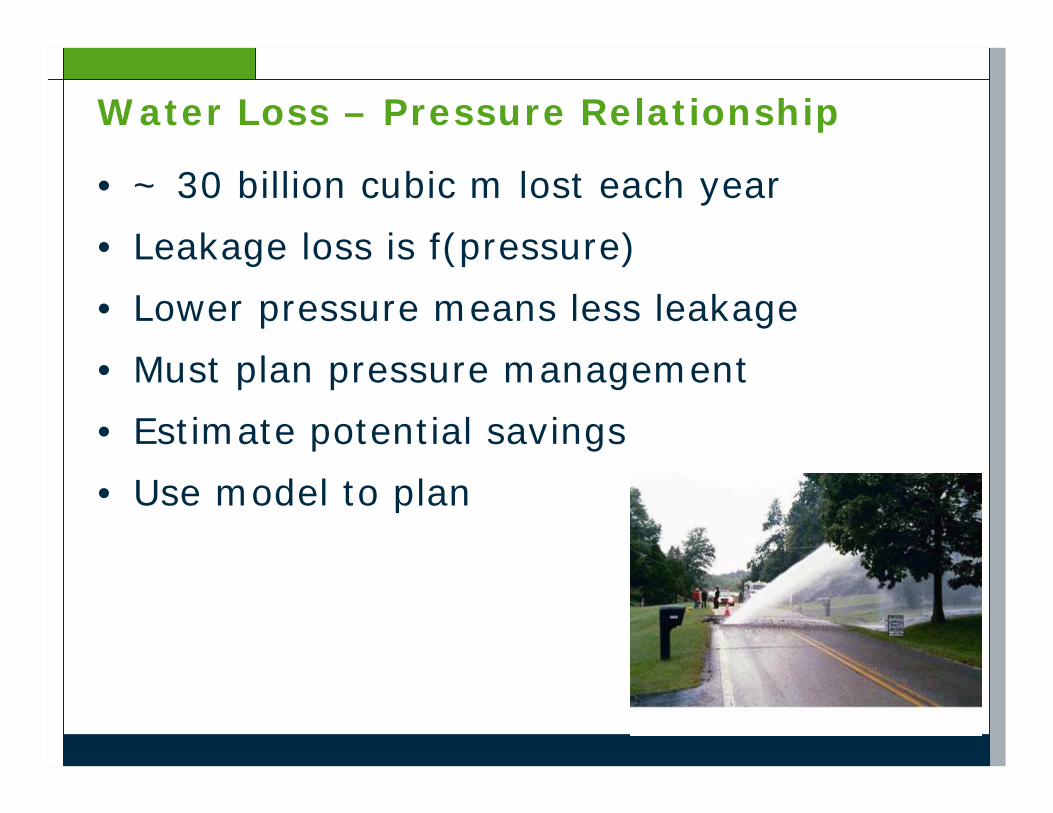
Water Loss – Pressure Relationship
• ~ 30 billion cubic m lost each year
• Leakage loss is f(pressure)
• Lower pressure means less leakage
• Must plan pressure management
• Estimate potential savings
• Use model to plan
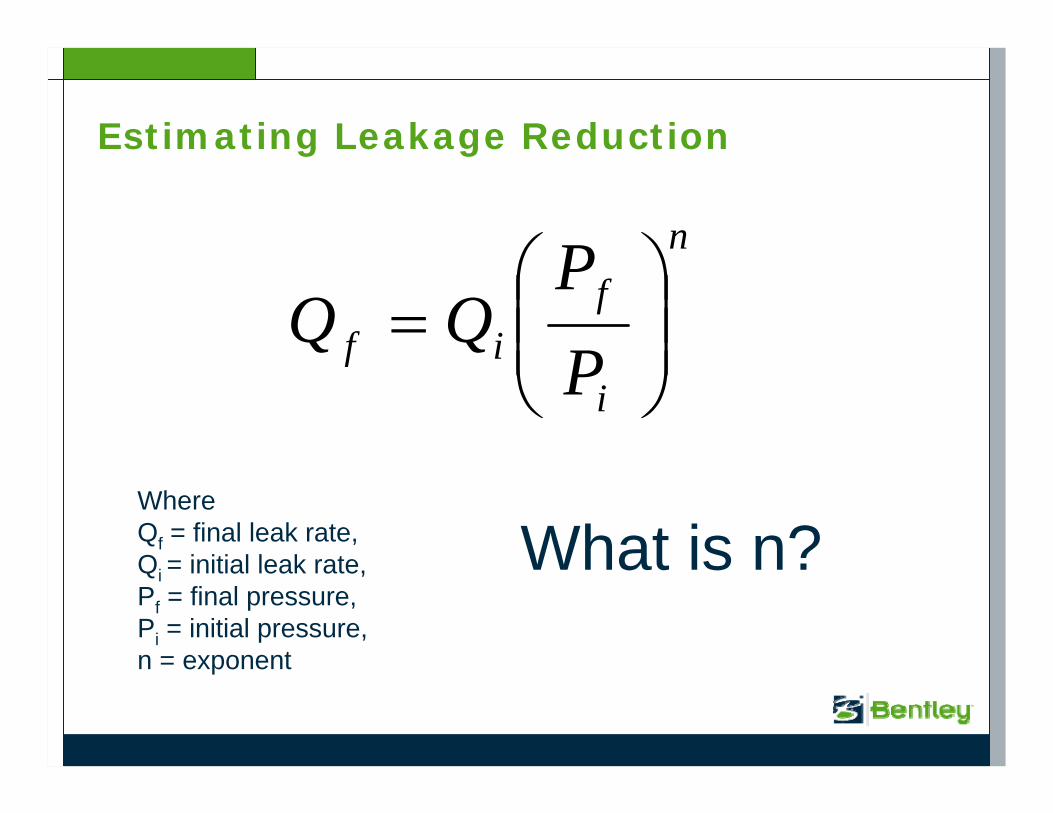
Estimating Leakage Reduction
n
i
fif P
PQQ ⎟⎟
⎠
⎞⎜⎜⎝
⎛=
Where Qf = final leak rate, Qi = initial leak rate, Pf = final pressure, Pi = initial pressure, n = exponent
What is n?
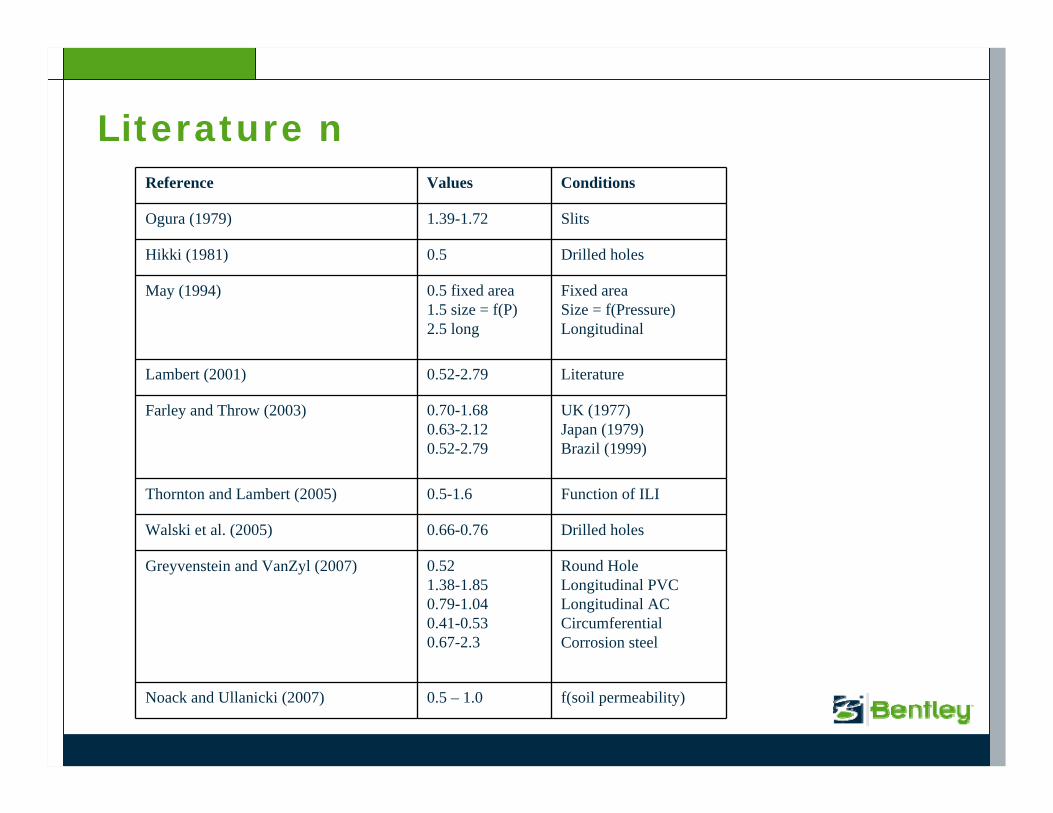
Literature nReference Values Conditions
Ogura (1979) 1.39-1.72 Slits
Hikki (1981) 0.5 Drilled holes
May (1994) 0.5 fixed area1.5 size = f(P)2.5 long
Fixed areaSize = f(Pressure)Longitudinal
Lambert (2001) 0.52-2.79 Literature
Farley and Throw (2003) 0.70-1.680.63-2.120.52-2.79
UK (1977)Japan (1979)Brazil (1999)
Thornton and Lambert (2005) 0.5-1.6 Function of ILI
Walski et al. (2005) 0.66-0.76 Drilled holes
Greyvenstein and VanZyl (2007) 0.521.38-1.850.79-1.040.41-0.530.67-2.3
Round HoleLongitudinal PVCLongitudinal ACCircumferentialCorrosion steel
Noack and Ullanicki (2007) 0.5 – 1.0 f(soil permeability)


Actual Leaks
Simulated leaks
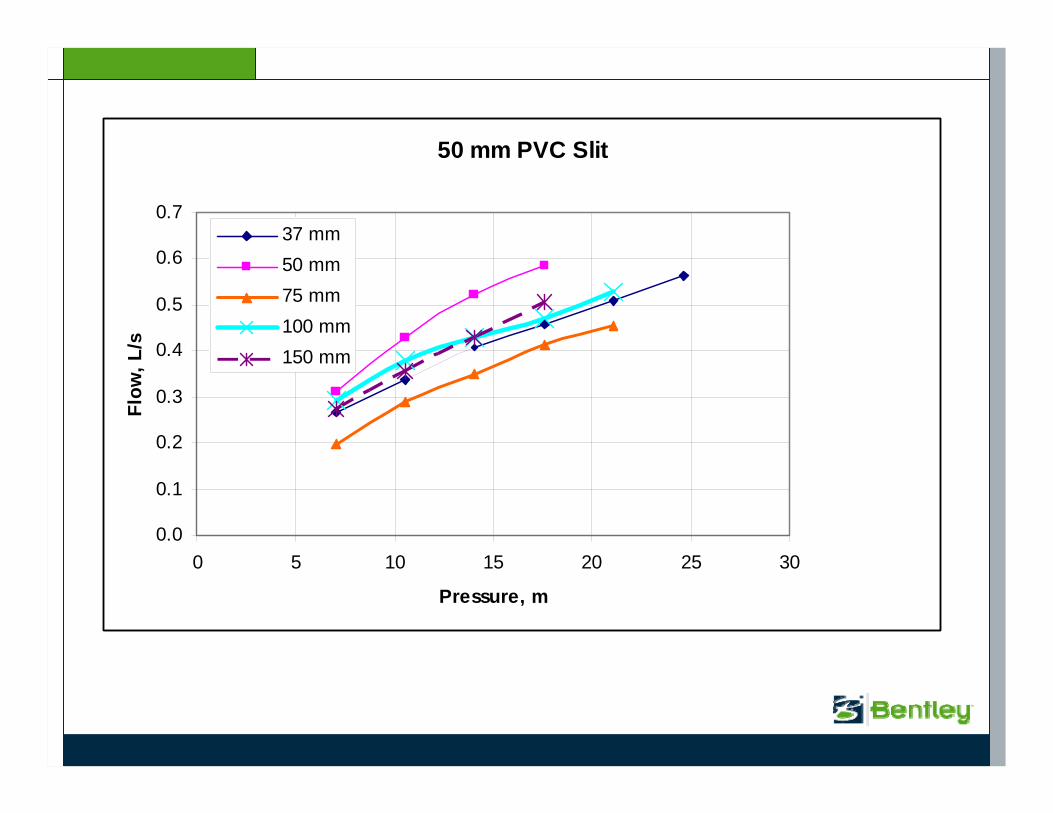
50 mm PVC Slit
0.0
0.1
0.2
0.3
0.4
0.5
0.6
0.7
0 5 10 15 20 25 30
Pressure, m
Flow
, L/s
37 mm50 mm75 mm100 mm150 mm

Pressure Control Works When
• Zone fed by PRV, variable speed pumps or multiple different pumps
• There are no tanks floating on system
• Leakage is large
• Area is flat
• May only be able to control at night

Reliability Example
16”
12”
12”6”
X 6”
= Valve

Distribution Segments
• Smallest portion of system isolated by valves
• May be – Part of a pipe– One or more pipes plus junctions
• Not consistent with model topology
J-1 P-1 J-2
S-101 S-102S-103
V-21 V-22

Analysis Steps
• Existing model
• Place isolating valves
• Identify distribution segments
• Identify outage segments
• Assess criticality of segments– Connectivity– Hydraulics
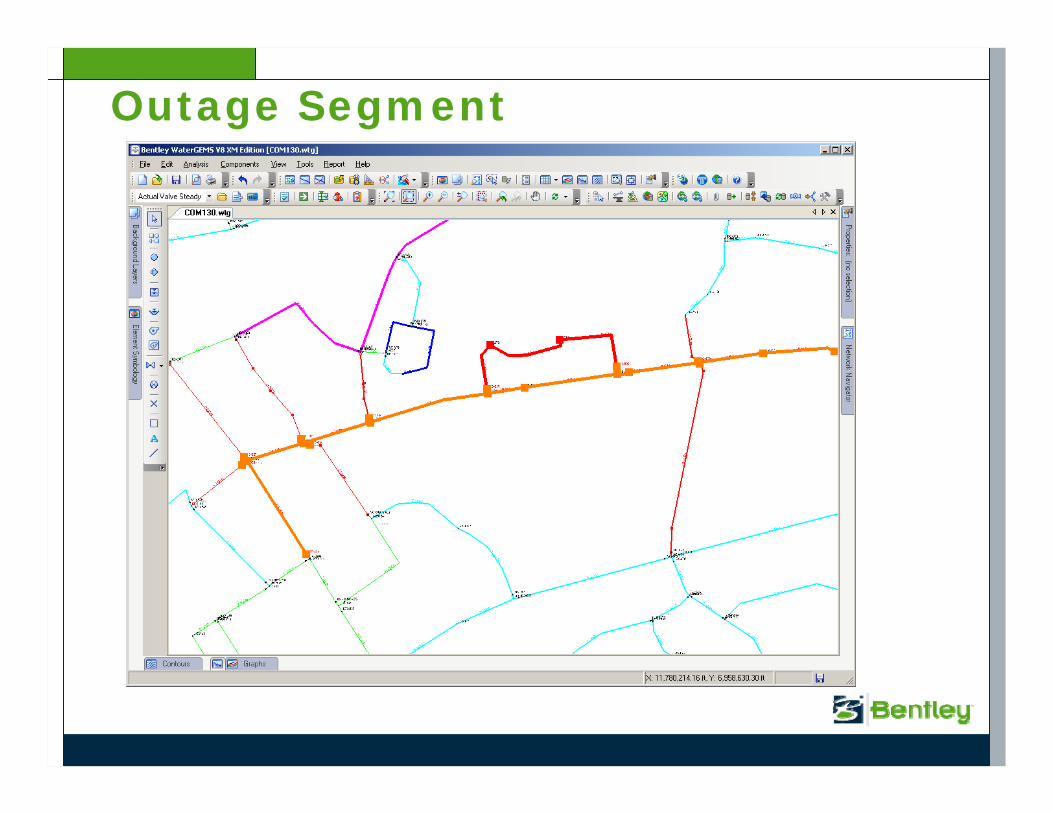
Outage Segment

How can you tell your pumps are stealing from you?
• Pumps don’t call out that they are robbing you
• Power company is happy to bill you
• Must look for inefficiency
• Calculating expected energy costs is tedious
• Models can help
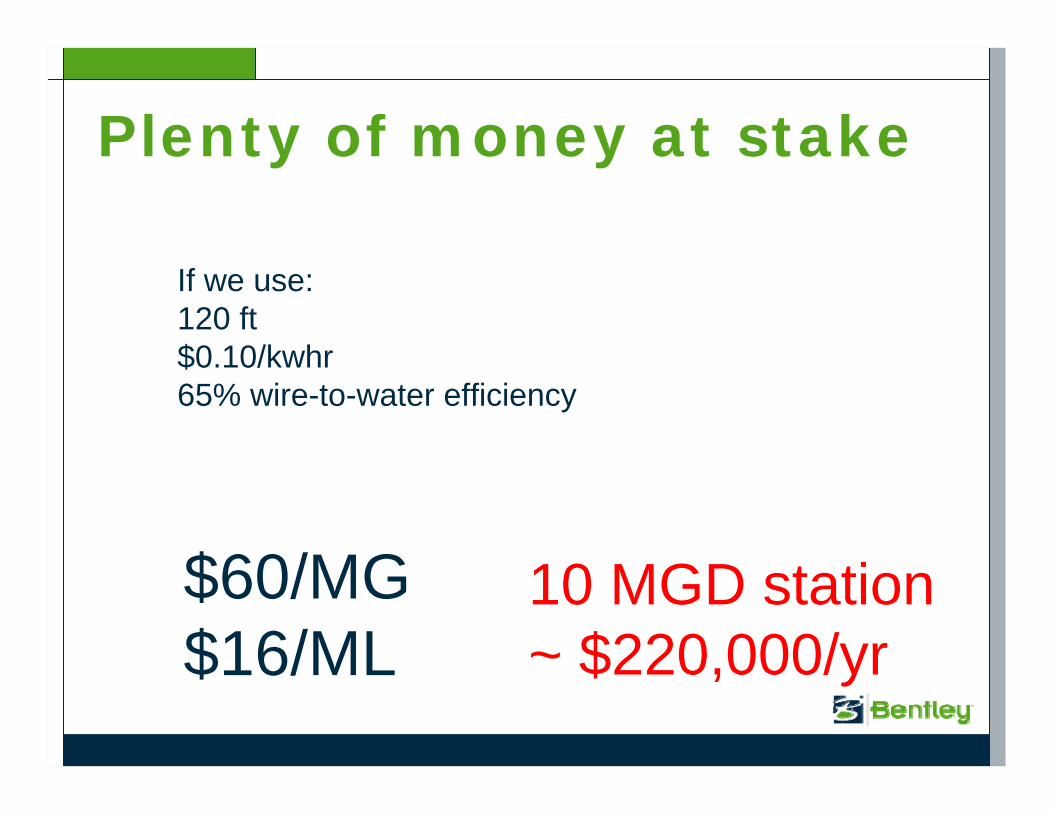
Plenty of money at stake
If we use:120 ft$0.10/kwhr65% wire-to-water efficiency
$60/MG$16/ML
10 MGD station~ $220,000/yr

Energy Cost
dteee
kQhpCT
dmp∫=0
γ
dmp eeehpQTkC )(
=
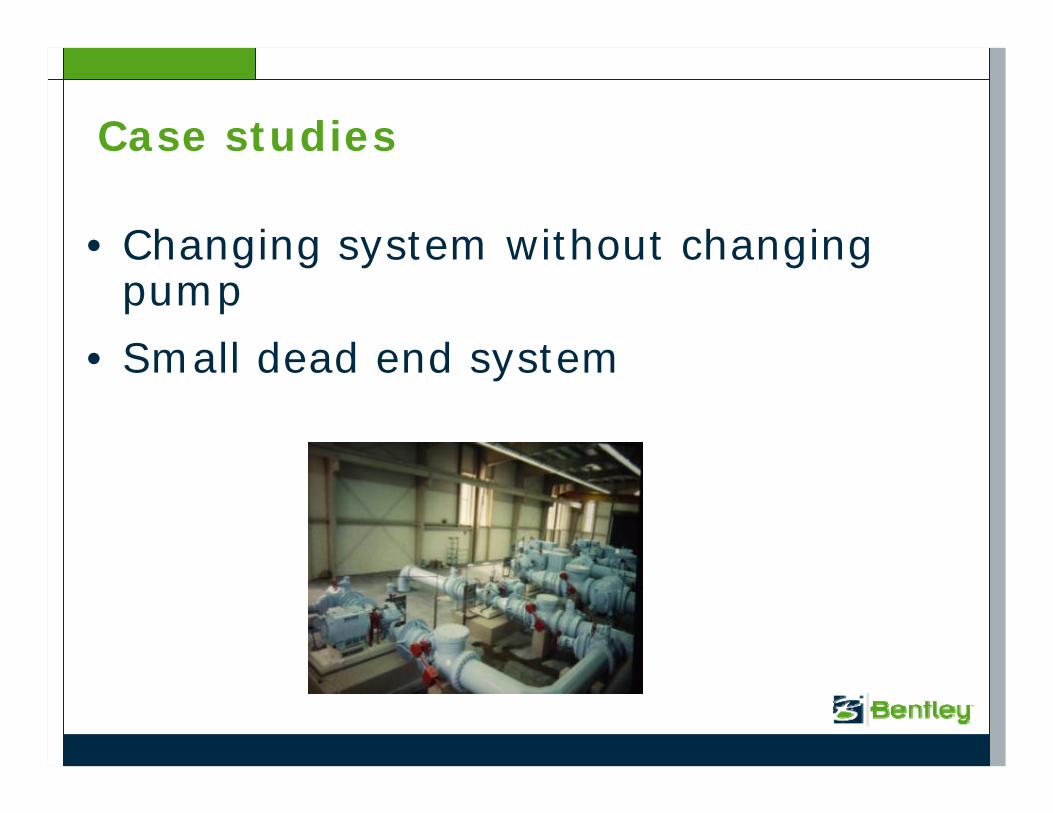
Case studies
• Changing system without changing pump
• Small dead end system
Changing System
• Abandoned old large, uncovered tank
• Installed new tank 20 ft lower• Installed some new (larger) piping• Kept the old pumps• System head curve changed

System Head Curves
Original Improved
3 Cases
• Original pumps – original system
• Original pumps – upgraded system
• New pumps – upgraded system
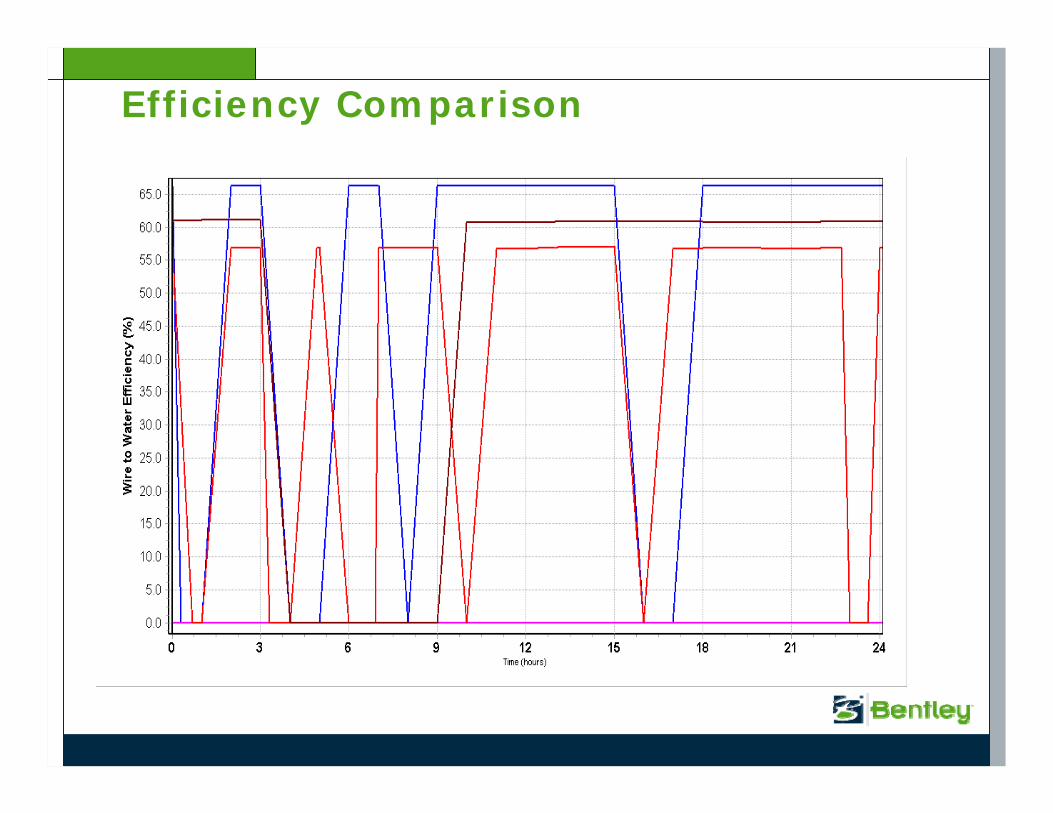
Efficiency Comparison

Cost Summary
$/MG $/yr
Old System-Original Pump 144 31,147
Upgrade System-Original Pump 138 29,808
Upgrade System-New Pump 118 25,660
dmp eeehpQTkC )(
=

Small Dead End Systems
• Pump sized for peak• Operate below BEP• Is variable speed pump
justified?


Low Flow Comparison

Constant vs. Variable
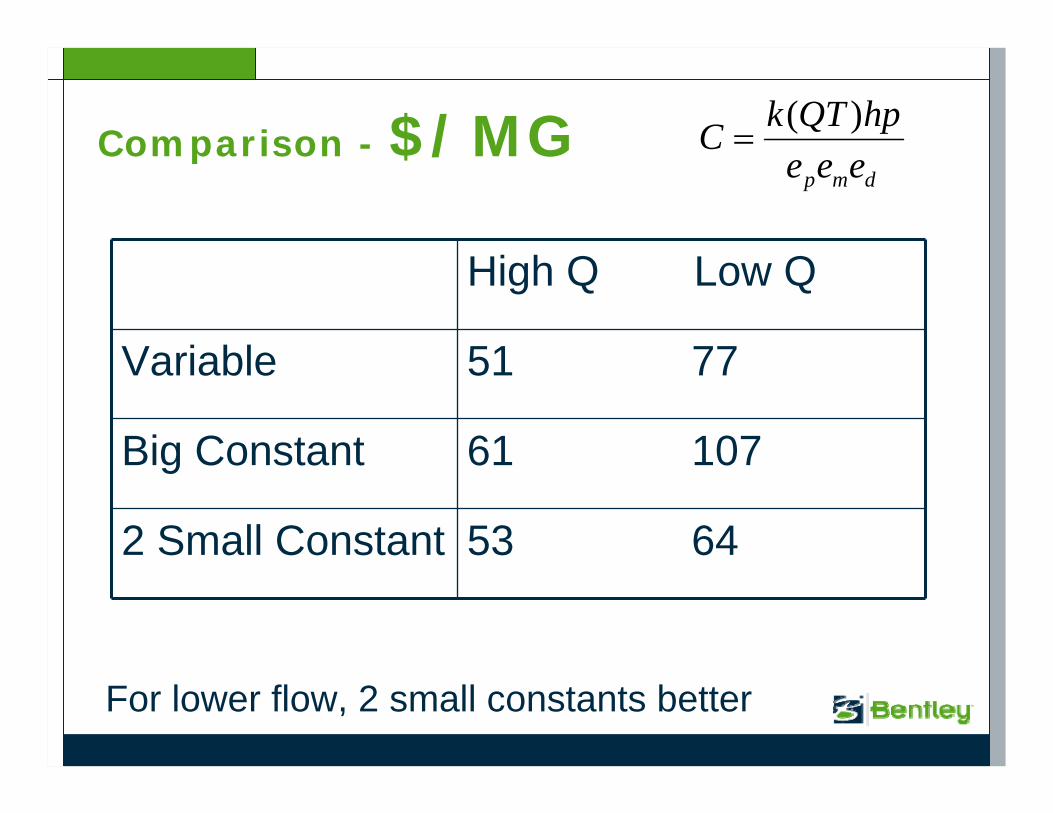
Comparison - $/MG
High Q Low Q
Variable 51 77
Big Constant 61 107
2 Small Constant 53 64
For lower flow, 2 small constants better
dmp eeehpQTkC )(
=

Thank you
45 | WWW.BENTLEY.COM

Strategy: A Long-term Approach with Immediate [Near-term] BenefitsImplement IWA best practices
46
Current AnnualReal Loss Volume
Economic Level Real Loss
UnavoidableReal Loss
Replacing pipes with least impact on
customers
Speed and Qualityof Repairs
Detecting and fixing leaksReplacing/installing meters (DMAs)
ActiveLeakage Control
Pres
sure
Man
agem
ent
Managing assets for maximum return In
fras
truc
ture
Man
agem
ent
Source: The “4 Component” diagram promoted by IWA’s Water Losses Task Force (Thornton and Lambert, 2005)

Background: Water Loss Related Terms
System input volume
Authorized consumption
Billed authorized consumption
Billed water exported
Revenue waterBilled metered consumption
Billed unmetered consumption
Unbilled authorized consumption
Unbilled meter consumption
Non revenue water
Unbilled unmetered consumption
Water losses
Apparent lossesUnauthorized consumption
Customer meter inaccuracies
Real losses
Leakage on transmission and distribution mains
Leakage and overflows at storage tanks
Leakage on service connections up to point of
customer meter
Source: IWA “best practice” standard water balance
47