Suspended particulates and air pollution in Bicol’s cities, Philippines€¦ · Suspended...
12
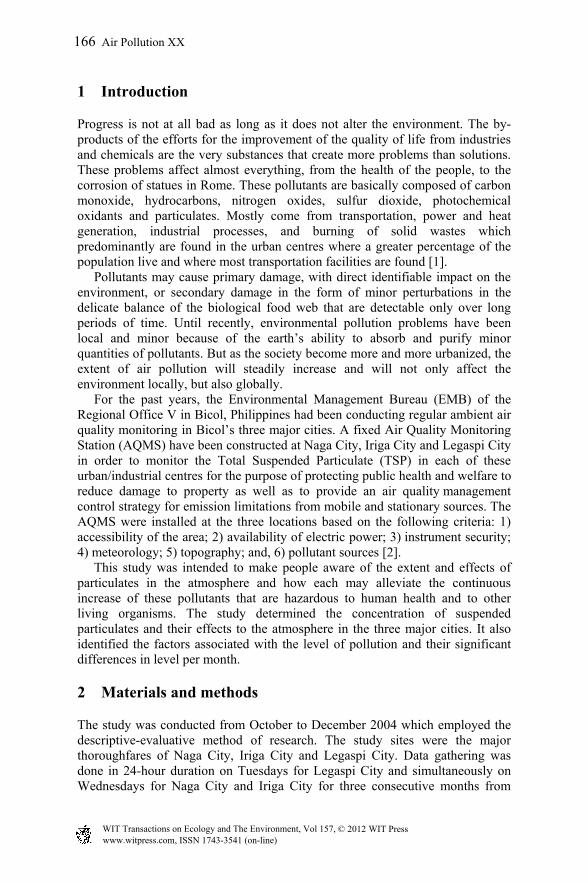
Suspended particulates and air pollution in Bicol’s cities, Philippines A. B. Gonzales Bicol University College of Engineering, Legazpi City, Philippines Abstract Association between air pollution and a multitude of health effects are now well established. Given ubiquitous exposure to some level of air pollution, the attributed health burden can be high, particularly for susceptible populations. In order to perform air quality measurements that are representative of a larger domain or a certain degree of pollution, a study on the air quality condition of the three main cities in the Bicol Region, namely; Legaspi, Naga and Iriga was conducted. The study focused on the parameters in determining air quality conditions. It also sought after the air condition in terms of Total Suspended Particulates (TSP) in the study areas and identified the main sources of the pollutants in the monitoring stations or observatories. The method used the comparative ex-post facto approach to compare and measure the total suspended particulate content in the three cities. The study revealed that the results are within the criteria, which means that the air is not yet dangerous to the health of the residents. Based on the emission inventory conducted by EMB Office from 2005, cars and utility vehicles were identified as the significant contributor of TSP. Burning of wood and dried leaves were primary sources of incomplete combustion in the stations. Carbon monoxide from vehicle exhausts is also a source of pollutant. In the light of the findings of the study, it is recommended that the residents in the subject cities must be aware of the Clean Air Act Program to comply with what they are expected to do, and be able to perform their duty on how to have a clean air and environment. A continuous implementation of the anti-smoke belching campaign as well as an intensified information and education advocacy will definitely help in the attainment of a better air quality in each city. Keywords: air quality condition, Bicol’s cities, suspended particulates, pollution. Air Pollution XX 165 doi:10.2495/AIR120151 www.witpress.com, ISSN 1743-3541 (on-line) WIT Transactions on Ecology and The Environment, Vol 1 , © 2012 WIT Press 57
-
Upload
phungduong -
Category
Documents
-
view
220 -
download
0
Transcript of Suspended particulates and air pollution in Bicol’s cities, Philippines€¦ · Suspended...
Suspended particulates and air pollution in Bicol’s cities, Philippines
A. B. Gonzales Bicol University College of Engineering, Legazpi City, Philippines
Abstract
Association between air pollution and a multitude of health effects are now well established. Given ubiquitous exposure to some level of air pollution, the attributed health burden can be high, particularly for susceptible populations. In order to perform air quality measurements that are representative of a larger domain or a certain degree of pollution, a study on the air quality condition of the three main cities in the Bicol Region, namely; Legaspi, Naga and Iriga was conducted. The study focused on the parameters in determining air quality conditions. It also sought after the air condition in terms of Total Suspended Particulates (TSP) in the study areas and identified the main sources of the pollutants in the monitoring stations or observatories. The method used the comparative ex-post facto approach to compare and measure the total suspended particulate content in the three cities. The study revealed that the results are within the criteria, which means that the air is not yet dangerous to the health of the residents. Based on the emission inventory conducted by EMB Office from 2005, cars and utility vehicles were identified as the significant contributor of TSP. Burning of wood and dried leaves were primary sources of incomplete combustion in the stations. Carbon monoxide from vehicle exhausts is also a source of pollutant. In the light of the findings of the study, it is recommended that the residents in the subject cities must be aware of the Clean Air Act Program to comply with what they are expected to do, and be able to perform their duty on how to have a clean air and environment. A continuous implementation of the anti-smoke belching campaign as well as an intensified information and education advocacy will definitely help in the attainment of a better air quality in each city. Keywords: air quality condition, Bicol’s cities, suspended particulates, pollution.
Air Pollution XX 165
doi:10.2495/AIR120151
www.witpress.com, ISSN 1743-3541 (on-line) WIT Transactions on Ecology and The Environment, Vol 1 , © 2012 WIT Press57
1 Introduction
Progress is not at all bad as long as it does not alter the environment. The by-products of the efforts for the improvement of the quality of life from industries and chemicals are the very substances that create more problems than solutions. These problems affect almost everything, from the health of the people, to the corrosion of statues in Rome. These pollutants are basically composed of carbon monoxide, hydrocarbons, nitrogen oxides, sulfur dioxide, photochemical oxidants and particulates. Mostly come from transportation, power and heat generation, industrial processes, and burning of solid wastes which predominantly are found in the urban centres where a greater percentage of the population live and where most transportation facilities are found [1]. Pollutants may cause primary damage, with direct identifiable impact on the environment, or secondary damage in the form of minor perturbations in the delicate balance of the biological food web that are detectable only over long periods of time. Until recently, environmental pollution problems have been local and minor because of the earth’s ability to absorb and purify minor quantities of pollutants. But as the society become more and more urbanized, the extent of air pollution will steadily increase and will not only affect the environment locally, but also globally. For the past years, the Environmental Management Bureau (EMB) of the Regional Office V in Bicol, Philippines had been conducting regular ambient air quality monitoring in Bicol’s three major cities. A fixed Air Quality Monitoring Station (AQMS) have been constructed at Naga City, Iriga City and Legaspi City in order to monitor the Total Suspended Particulate (TSP) in each of these urban/industrial centres for the purpose of protecting public health and welfare to reduce damage to property as well as to provide an air quality management control strategy for emission limitations from mobile and stationary sources. The AQMS were installed at the three locations based on the following criteria: 1) accessibility of the area; 2) availability of electric power; 3) instrument security; 4) meteorology; 5) topography; and, 6) pollutant sources [2]. This study was intended to make people aware of the extent and effects of particulates in the atmosphere and how each may alleviate the continuous increase of these pollutants that are hazardous to human health and to other living organisms. The study determined the concentration of suspended particulates and their effects to the atmosphere in the three major cities. It also identified the factors associated with the level of pollution and their significant differences in level per month.
2 Materials and methods
The study was conducted from October to December 2004 which employed the descriptive-evaluative method of research. The study sites were the major thoroughfares of Naga City, Iriga City and Legaspi City. Data gathering was done in 24-hour duration on Tuesdays for Legaspi City and simultaneously on Wednesdays for Naga City and Iriga City for three consecutive months from
166 Air Pollution XX
www.witpress.com, ISSN 1743-3541 (on-line) WIT Transactions on Ecology and The Environment, Vol 1 , © 2012 WIT Press57
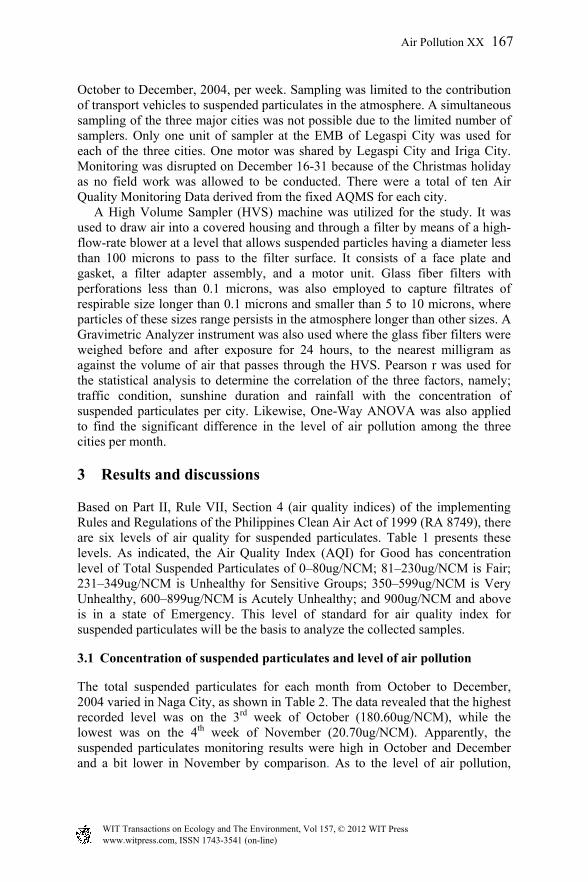
October to December, 2004, per week. Sampling was limited to the contribution of transport vehicles to suspended particulates in the atmosphere. A simultaneous sampling of the three major cities was not possible due to the limited number of samplers. Only one unit of sampler at the EMB of Legaspi City was used for each of the three cities. One motor was shared by Legaspi City and Iriga City. Monitoring was disrupted on December 16-31 because of the Christmas holiday as no field work was allowed to be conducted. There were a total of ten Air Quality Monitoring Data derived from the fixed AQMS for each city. A High Volume Sampler (HVS) machine was utilized for the study. It was used to draw air into a covered housing and through a filter by means of a high-flow-rate blower at a level that allows suspended particles having a diameter less than 100 microns to pass to the filter surface. It consists of a face plate and gasket, a filter adapter assembly, and a motor unit. Glass fiber filters with perforations less than 0.1 microns, was also employed to capture filtrates of respirable size longer than 0.1 microns and smaller than 5 to 10 microns, where particles of these sizes range persists in the atmosphere longer than other sizes. A Gravimetric Analyzer instrument was also used where the glass fiber filters were weighed before and after exposure for 24 hours, to the nearest milligram as against the volume of air that passes through the HVS. Pearson r was used for the statistical analysis to determine the correlation of the three factors, namely; traffic condition, sunshine duration and rainfall with the concentration of suspended particulates per city. Likewise, One-Way ANOVA was also applied to find the significant difference in the level of air pollution among the three cities per month.
3 Results and discussions
Based on Part II, Rule VII, Section 4 (air quality indices) of the implementing Rules and Regulations of the Philippines Clean Air Act of 1999 (RA 8749), there are six levels of air quality for suspended particulates. Table 1 presents these levels. As indicated, the Air Quality Index (AQI) for Good has concentration level of Total Suspended Particulates of 0–80ug/NCM; 81–230ug/NCM is Fair; 231–349ug/NCM is Unhealthy for Sensitive Groups; 350–599ug/NCM is Very Unhealthy, 600–899ug/NCM is Acutely Unhealthy; and 900ug/NCM and above is in a state of Emergency. This level of standard for air quality index for suspended particulates will be the basis to analyze the collected samples.
3.1 Concentration of suspended particulates and level of air pollution
The total suspended particulates for each month from October to December, 2004 varied in Naga City, as shown in Table 2. The data revealed that the highest recorded level was on the 3rd week of October (180.60ug/NCM), while the lowest was on the 4th week of November (20.70ug/NCM). Apparently, the suspended particulates monitoring results were high in October and December and a bit lower in November by comparison. As to the level of air pollution,
Air Pollution XX 167
www.witpress.com, ISSN 1743-3541 (on-line) WIT Transactions on Ecology and The Environment, Vol 1 , © 2012 WIT Press57
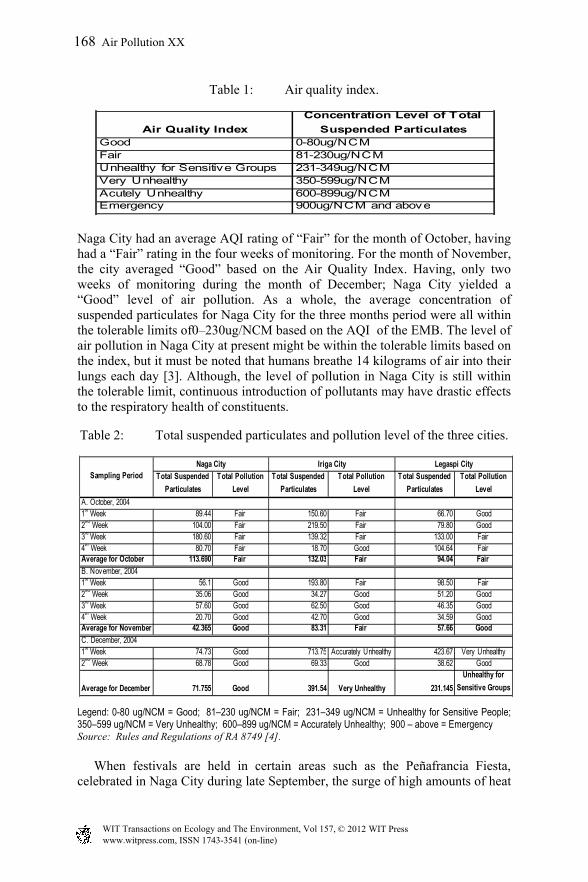
Table 1: Air quality index.
Naga City had an average AQI rating of “Fair” for the month of October, having had a “Fair” rating in the four weeks of monitoring. For the month of November, the city averaged “Good” based on the Air Quality Index. Having, only two weeks of monitoring during the month of December; Naga City yielded a “Good” level of air pollution. As a whole, the average concentration of suspended particulates for Naga City for the three months period were all within the tolerable limits of0–230ug/NCM based on the AQI of the EMB. The level of air pollution in Naga City at present might be within the tolerable limits based on the index, but it must be noted that humans breathe 14 kilograms of air into their lungs each day [3]. Although, the level of pollution in Naga City is still within the tolerable limit, continuous introduction of pollutants may have drastic effects to the respiratory health of constituents.
Table 2: Total suspended particulates and pollution level of the three cities.
Legend: 0-80 ug/NCM = Good; 81–230 ug/NCM = Fair; 231–349 ug/NCM = Unhealthy for Sensitive People; 350–599 ug/NCM = Very Unhealthy; 600–899 ug/NCM = Accurately Unhealthy; 900 – above = Emergency Source: Rules and Regulations of RA 8749 [4].
When festivals are held in certain areas such as the Peñafrancia Fiesta, celebrated in Naga City during late September, the surge of high amounts of heat
Air Quality Index
Concentration Level of Total
Suspended ParticulatesGood 0-80ug/NCMFair 81-230ug/NCMUnhealthy for Sensitive Groups 231-349ug/NCMVery Unhealthy 350-599ug/NCMAcutely Unhealthy 600-899ug/NCMEmergency 900ug/NCM and above
Total Suspended
Particulates
Total Pollution
Level
Total Suspended
Particulates
Total Pollution
Level
Total Suspended
Particulates
Total Pollution
Level
1st Week 89.44 Fair 150.60 Fair 66.70 Good
2nd
Week 104.00 Fair 219.50 Fair 79.80 Good3
rd Week 180.60 Fair 139.32 Fair 133.00 Fair
4th
Week 80.70 Fair 18.70 Good 104.64 Fair Average for October 113.690 Fair 132.03 Fair 94.04 Fair
1st Week 56.1 Good 193.80 Fair 98.50 Fair
2nd
Week 35.06 Good 34.27 Good 51.20 Good3
rd Week 57.60 Good 62.50 Good 46.35 Good
4th
Week 20.70 Good 42.70 Good 34.59 GoodAverage for November 42.365 Good 83.31 Fair 57.66 Good
1st Week 74.73 Good 713.75 Accurately Unhealthy 423.67 Very Unhealthy
2nd
Week 68.78 Good 69.33 Good 38.62 Good
Average for December 71.755 Good 391.54 Very Unhealthy 231.145
Unhealthy for
Sensitive Groups
Sampling PeriodNaga City Iriga City Legaspi City
A. October, 2004
B. November, 2004
C. December, 2004
168 Air Pollution XX
www.witpress.com, ISSN 1743-3541 (on-line) WIT Transactions on Ecology and The Environment, Vol 1 , © 2012 WIT Press57
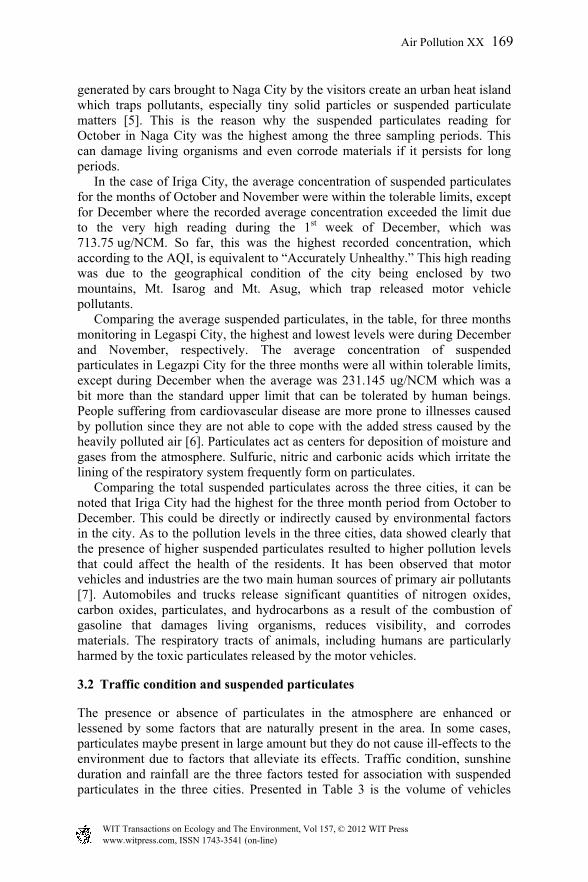
generated by cars brought to Naga City by the visitors create an urban heat island which traps pollutants, especially tiny solid particles or suspended particulate matters [5]. This is the reason why the suspended particulates reading for October in Naga City was the highest among the three sampling periods. This can damage living organisms and even corrode materials if it persists for long periods. In the case of Iriga City, the average concentration of suspended particulates for the months of October and November were within the tolerable limits, except for December where the recorded average concentration exceeded the limit due to the very high reading during the 1st week of December, which was 713.75 ug/NCM. So far, this was the highest recorded concentration, which according to the AQI, is equivalent to “Accurately Unhealthy.” This high reading was due to the geographical condition of the city being enclosed by two mountains, Mt. Isarog and Mt. Asug, which trap released motor vehicle pollutants. Comparing the average suspended particulates, in the table, for three months monitoring in Legaspi City, the highest and lowest levels were during December and November, respectively. The average concentration of suspended particulates in Legazpi City for the three months were all within tolerable limits, except during December when the average was 231.145 ug/NCM which was a bit more than the standard upper limit that can be tolerated by human beings. People suffering from cardiovascular disease are more prone to illnesses caused by pollution since they are not able to cope with the added stress caused by the heavily polluted air [6]. Particulates act as centers for deposition of moisture and gases from the atmosphere. Sulfuric, nitric and carbonic acids which irritate the lining of the respiratory system frequently form on particulates. Comparing the total suspended particulates across the three cities, it can be noted that Iriga City had the highest for the three month period from October to December. This could be directly or indirectly caused by environmental factors in the city. As to the pollution levels in the three cities, data showed clearly that the presence of higher suspended particulates resulted to higher pollution levels that could affect the health of the residents. It has been observed that motor vehicles and industries are the two main human sources of primary air pollutants [7]. Automobiles and trucks release significant quantities of nitrogen oxides, carbon oxides, particulates, and hydrocarbons as a result of the combustion of gasoline that damages living organisms, reduces visibility, and corrodes materials. The respiratory tracts of animals, including humans are particularly harmed by the toxic particulates released by the motor vehicles.
3.2 Traffic condition and suspended particulates
The presence or absence of particulates in the atmosphere are enhanced or lessened by some factors that are naturally present in the area. In some cases, particulates maybe present in large amount but they do not cause ill-effects to the environment due to factors that alleviate its effects. Traffic condition, sunshine duration and rainfall are the three factors tested for association with suspended particulates in the three cities. Presented in Table 3 is the volume of vehicles
Air Pollution XX 169
www.witpress.com, ISSN 1743-3541 (on-line) WIT Transactions on Ecology and The Environment, Vol 1 , © 2012 WIT Press57
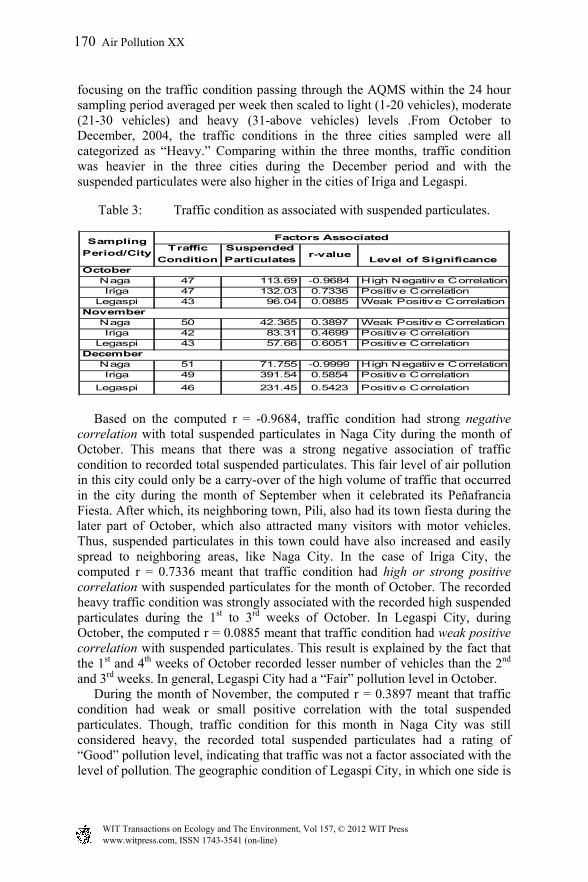
focusing on the traffic condition passing through the AQMS within the 24 hour sampling period averaged per week then scaled to light (1-20 vehicles), moderate (21-30 vehicles) and heavy (31-above vehicles) levels .From October to December, 2004, the traffic conditions in the three cities sampled were all categorized as “Heavy.” Comparing within the three months, traffic condition was heavier in the three cities during the December period and with the suspended particulates were also higher in the cities of Iriga and Legaspi.
Table 3: Traffic condition as associated with suspended particulates.
Based on the computed r = -0.9684, traffic condition had strong negative correlation with total suspended particulates in Naga City during the month of October. This means that there was a strong negative association of traffic condition to recorded total suspended particulates. This fair level of air pollution in this city could only be a carry-over of the high volume of traffic that occurred in the city during the month of September when it celebrated its Peñafrancia Fiesta. After which, its neighboring town, Pili, also had its town fiesta during the later part of October, which also attracted many visitors with motor vehicles. Thus, suspended particulates in this town could have also increased and easily spread to neighboring areas, like Naga City. In the case of Iriga City, the computed r = 0.7336 meant that traffic condition had high or strong positive correlation with suspended particulates for the month of October. The recorded heavy traffic condition was strongly associated with the recorded high suspended particulates during the 1st to 3rd weeks of October. In Legaspi City, during October, the computed r = 0.0885 meant that traffic condition had weak positive correlation with suspended particulates. This result is explained by the fact that the 1st and 4th weeks of October recorded lesser number of vehicles than the 2nd and 3rd weeks. In general, Legaspi City had a “Fair” pollution level in October. During the month of November, the computed r = 0.3897 meant that traffic condition had weak or small positive correlation with the total suspended particulates. Though, traffic condition for this month in Naga City was still considered heavy, the recorded total suspended particulates had a rating of “Good” pollution level, indicating that traffic was not a factor associated with the level of pollution. The geographic condition of Legaspi City, in which one side is
Traffic
Condition
Suspended
Particulatesr-value
Level of Significance
Naga 47 113.69 -0.9684 High Negatiive CorrelationIriga 47 132.03 0.7336 Positive Correlation
Legaspi 43 96.04 0.0885 Weak Positive Correlation
Naga 50 42.365 0.3897 Weak Positive Correlation Iriga 42 83.31 0.4699 Positive Correlation
Legaspi 43 57.66 0.6051 Positive Correlation
Naga 51 71.755 -0.9999 High Negatiive CorrelationIriga 49 391.54 0.5854 Positive Correlation
Legaspi 46 231.45 0.5423 Positive Correlation
Factors AssociatedSampling
Period/City
October
November
December
170 Air Pollution XX
www.witpress.com, ISSN 1743-3541 (on-line) WIT Transactions on Ecology and The Environment, Vol 1 , © 2012 WIT Press57
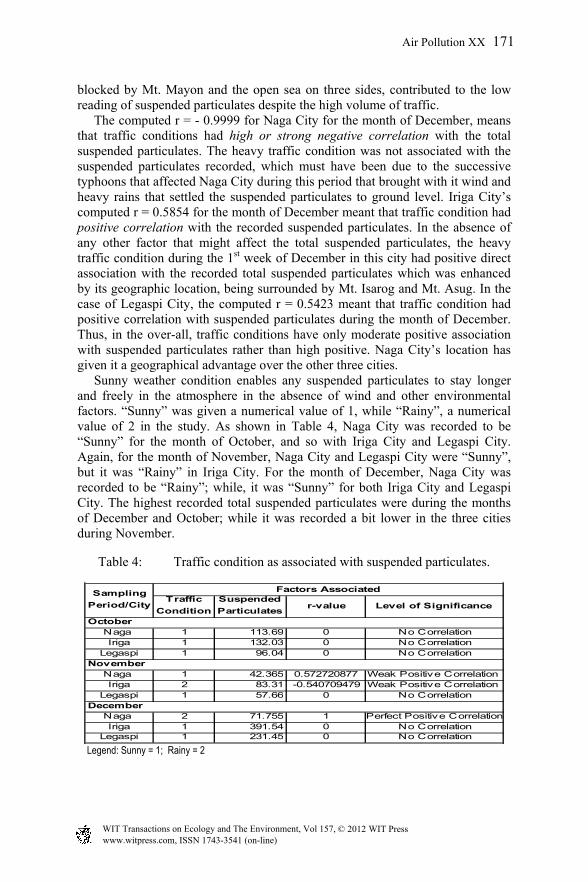
blocked by Mt. Mayon and the open sea on three sides, contributed to the low reading of suspended particulates despite the high volume of traffic. The computed r = - 0.9999 for Naga City for the month of December, means that traffic conditions had high or strong negative correlation with the total suspended particulates. The heavy traffic condition was not associated with the suspended particulates recorded, which must have been due to the successive typhoons that affected Naga City during this period that brought with it wind and heavy rains that settled the suspended particulates to ground level. Iriga City’s computed r = 0.5854 for the month of December meant that traffic condition had positive correlation with the recorded suspended particulates. In the absence of any other factor that might affect the total suspended particulates, the heavy traffic condition during the 1st week of December in this city had positive direct association with the recorded total suspended particulates which was enhanced by its geographic location, being surrounded by Mt. Isarog and Mt. Asug. In the case of Legaspi City, the computed r = 0.5423 meant that traffic condition had positive correlation with suspended particulates during the month of December. Thus, in the over-all, traffic conditions have only moderate positive association with suspended particulates rather than high positive. Naga City’s location has given it a geographical advantage over the other three cities. Sunny weather condition enables any suspended particulates to stay longer and freely in the atmosphere in the absence of wind and other environmental factors. “Sunny” was given a numerical value of 1, while “Rainy”, a numerical value of 2 in the study. As shown in Table 4, Naga City was recorded to be “Sunny” for the month of October, and so with Iriga City and Legaspi City. Again, for the month of November, Naga City and Legaspi City were “Sunny”, but it was “Rainy” in Iriga City. For the month of December, Naga City was recorded to be “Rainy”; while, it was “Sunny” for both Iriga City and Legaspi City. The highest recorded total suspended particulates were during the months of December and October; while it was recorded a bit lower in the three cities during November.
Table 4: Traffic condition as associated with suspended particulates.
Legend: Sunny = 1; Rainy = 2
Traffic
Condition
Suspended
Particulatesr-value Level of Significance
Naga 1 113.69 0 No CorrelationIriga 1 132.03 0 No Correlation
Legaspi 1 96.04 0 No Correlation
Naga 1 42.365 0.572720877 Weak Positive Correlation Iriga 2 83.31 -0.540709479 Weak Positive Correlation
Legaspi 1 57.66 0 No Correlation
Naga 2 71.755 1 Perfect Positive CorrelationIriga 1 391.54 0 No Correlation
Legaspi 1 231.45 0 No Correlation
Sampling
Period/City
Factors Associated
October
November
December
Air Pollution XX 171
www.witpress.com, ISSN 1743-3541 (on-line) WIT Transactions on Ecology and The Environment, Vol 1 , © 2012 WIT Press57
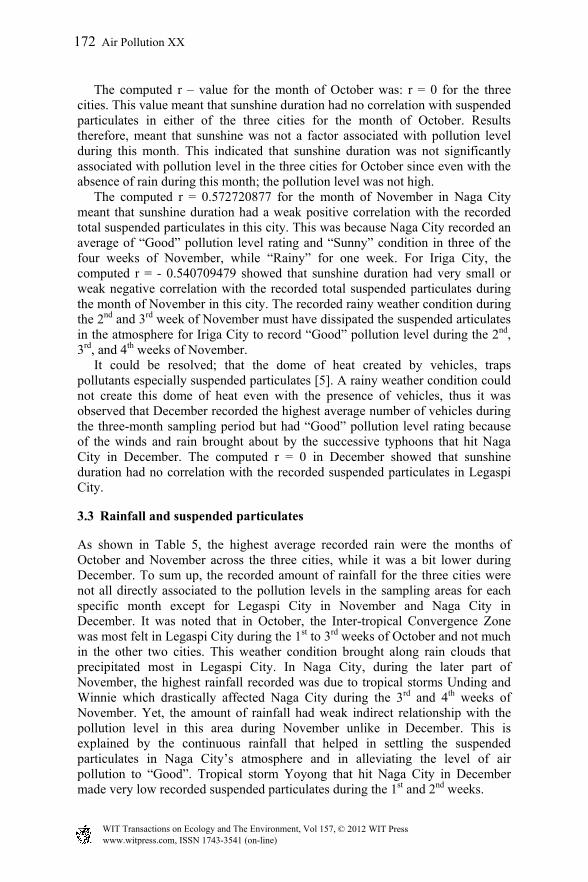
The computed r – value for the month of October was: r = 0 for the three cities. This value meant that sunshine duration had no correlation with suspended particulates in either of the three cities for the month of October. Results therefore, meant that sunshine was not a factor associated with pollution level during this month. This indicated that sunshine duration was not significantly associated with pollution level in the three cities for October since even with the absence of rain during this month; the pollution level was not high. The computed r = 0.572720877 for the month of November in Naga City meant that sunshine duration had a weak positive correlation with the recorded total suspended particulates in this city. This was because Naga City recorded an average of “Good” pollution level rating and “Sunny” condition in three of the four weeks of November, while “Rainy” for one week. For Iriga City, the computed r = - 0.540709479 showed that sunshine duration had very small or weak negative correlation with the recorded total suspended particulates during the month of November in this city. The recorded rainy weather condition during the 2nd and 3rd week of November must have dissipated the suspended articulates in the atmosphere for Iriga City to record “Good” pollution level during the 2nd, 3rd, and 4th weeks of November. It could be resolved; that the dome of heat created by vehicles, traps pollutants especially suspended particulates [5]. A rainy weather condition could not create this dome of heat even with the presence of vehicles, thus it was observed that December recorded the highest average number of vehicles during the three-month sampling period but had “Good” pollution level rating because of the winds and rain brought about by the successive typhoons that hit Naga City in December. The computed r = 0 in December showed that sunshine duration had no correlation with the recorded suspended particulates in Legaspi City.
3.3 Rainfall and suspended particulates
As shown in Table 5, the highest average recorded rain were the months of October and November across the three cities, while it was a bit lower during December. To sum up, the recorded amount of rainfall for the three cities were not all directly associated to the pollution levels in the sampling areas for each specific month except for Legaspi City in November and Naga City in December. It was noted that in October, the Inter-tropical Convergence Zone was most felt in Legaspi City during the 1st to 3rd weeks of October and not much in the other two cities. This weather condition brought along rain clouds that precipitated most in Legaspi City. In Naga City, during the later part of November, the highest rainfall recorded was due to tropical storms Unding and Winnie which drastically affected Naga City during the 3rd and 4th weeks of November. Yet, the amount of rainfall had weak indirect relationship with the pollution level in this area during November unlike in December. This is explained by the continuous rainfall that helped in settling the suspended particulates in Naga City’s atmosphere and in alleviating the level of air pollution to “Good”. Tropical storm Yoyong that hit Naga City in December made very low recorded suspended particulates during the 1st and 2nd weeks.
172 Air Pollution XX
www.witpress.com, ISSN 1743-3541 (on-line) WIT Transactions on Ecology and The Environment, Vol 1 , © 2012 WIT Press57
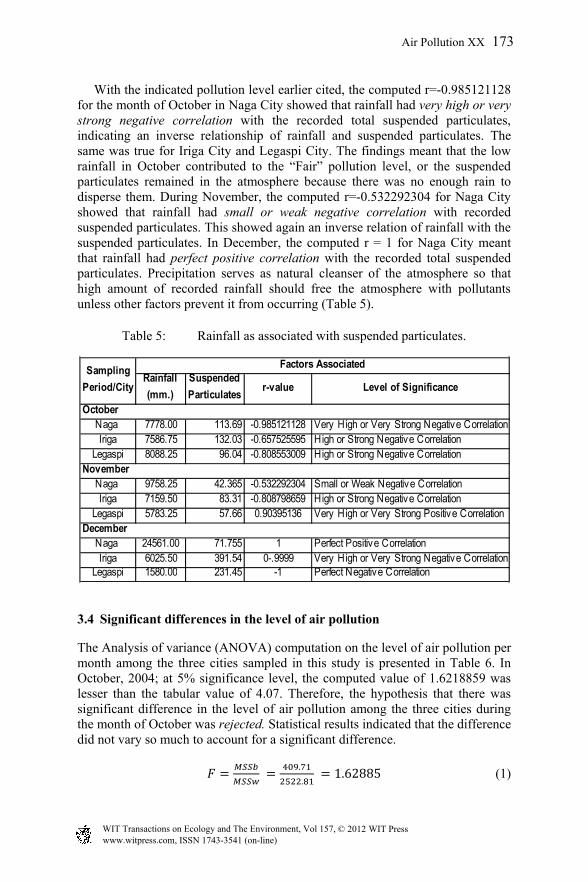
With the indicated pollution level earlier cited, the computed r=-0.985121128 for the month of October in Naga City showed that rainfall had very high or very strong negative correlation with the recorded total suspended particulates, indicating an inverse relationship of rainfall and suspended particulates. The same was true for Iriga City and Legaspi City. The findings meant that the low rainfall in October contributed to the “Fair” pollution level, or the suspended particulates remained in the atmosphere because there was no enough rain to disperse them. During November, the computed r=-0.532292304 for Naga City showed that rainfall had small or weak negative correlation with recorded suspended particulates. This showed again an inverse relation of rainfall with the suspended particulates. In December, the computed r = 1 for Naga City meant that rainfall had perfect positive correlation with the recorded total suspended particulates. Precipitation serves as natural cleanser of the atmosphere so that high amount of recorded rainfall should free the atmosphere with pollutants unless other factors prevent it from occurring (Table 5).
Table 5: Rainfall as associated with suspended particulates.
3.4 Significant differences in the level of air pollution
The Analysis of variance (ANOVA) computation on the level of air pollution per month among the three cities sampled in this study is presented in Table 6. In October, 2004; at 5% significance level, the computed value of 1.6218859 was lesser than the tabular value of 4.07. Therefore, the hypothesis that there was significant difference in the level of air pollution among the three cities during the month of October was rejected. Statistical results indicated that the difference did not vary so much to account for a significant difference.
.
. 1.62885 (1)
Rainfall
(mm.)
Suspended
Particulatesr-value Level of Significance
Naga 7778.00 113.69 -0.985121128 Very High or Very Strong Negative CorrelationIriga 7586.75 132.03 -0.657525595 High or Strong Negative Correlation
Legaspi 8088.25 96.04 -0.808553009 High or Strong Negative Correlation
Naga 9758.25 42.365 -0.532292304 Small or Weak Negative Correlation Iriga 7159.50 83.31 -0.808798659 High or Strong Negative Correlation
Legaspi 5783.25 57.66 0.90395136 Very High or Very Strong Positive Correlation
Naga 24561.00 71.755 1 Perfect Positive CorrelationIriga 6025.50 391.54 0-.9999 Very High or Very Strong Negative Correlation
Legaspi 1580.00 231.45 -1 Perfect Negative Correlation
Sampling
Period/City
Factors Associated
October
November
December
Air Pollution XX 173
www.witpress.com, ISSN 1743-3541 (on-line) WIT Transactions on Ecology and The Environment, Vol 1 , © 2012 WIT Press57
Tabular value at 5%= 4.07 (2)
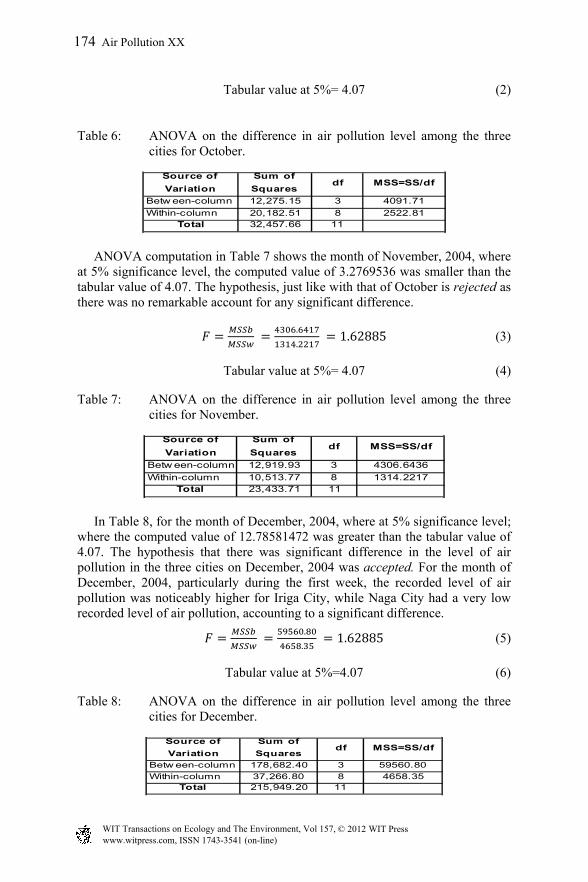
Table 6: ANOVA on the difference in air pollution level among the three cities for October.
ANOVA computation in Table 7 shows the month of November, 2004, where at 5% significance level, the computed value of 3.2769536 was smaller than the tabular value of 4.07. The hypothesis, just like with that of October is rejected as there was no remarkable account for any significant difference.
.
. 1.62885 (3)
Tabular value at 5%= 4.07 (4)
Table 7: ANOVA on the difference in air pollution level among the three cities for November.
In Table 8, for the month of December, 2004, where at 5% significance level; where the computed value of 12.78581472 was greater than the tabular value of 4.07. The hypothesis that there was significant difference in the level of air pollution in the three cities on December, 2004 was accepted. For the month of December, 2004, particularly during the first week, the recorded level of air pollution was noticeably higher for Iriga City, while Naga City had a very low recorded level of air pollution, accounting to a significant difference.
.
. 1.62885 (5)
Tabular value at 5%=4.07 (6)
Table 8: ANOVA on the difference in air pollution level among the three cities for December.
Source of
Variation
Sum of
Squaresdf MSS=SS/df
Betw een-column 12,275.15 3 4091.71
Within-column 20,182.51 8 2522.81Total 32,457.66 11
Source of
Variation
Sum of
Squaresdf MSS=SS/df
Betw een-column 12,919.93 3 4306.6436
Within-column 10,513.77 8 1314.2217Total 23,433.71 11
Source of
Variation
Sum of
Squaresdf MSS=SS/df
Betw een-column 178,682.40 3 59560.80
Within-column 37,266.80 8 4658.35Total 215,949.20 11
174 Air Pollution XX
www.witpress.com, ISSN 1743-3541 (on-line) WIT Transactions on Ecology and The Environment, Vol 1 , © 2012 WIT Press57
4 Conclusions
It was observed that Naga City recorded the least suspended particulates during the month of November while the highest was during October though its pollution level was still rated “Fair”. In the case of Iriga City, it also recorded the least suspended particulates on November but its highest recorded was during December, which had a pollution level rating of “Very Unhealthy”. The City of Legaspi also recorded the least suspended particulates on November while its highest recorded suspended particulates was during the month of December that reached a pollution level rating of “Unhealthy for Sensitive Groups”. The traffic conditions were associated with suspended particulates in Naga City only in November, while for Iriga City and Legaspi City, it was for three months. Sunshine was associated with suspended particulates in Naga City only, for the months of November and December, while rainfall was associated with suspended particulates in Naga City for December; no association in Iriga City; and in Legaspi City, it was for November only. October’s recorded total suspended particulates for the three cities, though differing per week, had very minimal differences when averaged. November’s recorded total suspended particulates for the three cities, just like its October reading, were different on a weekly basis but not when averaged. It was during December’s recorded total suspended particulates for the three cities that differed significantly at 5% level of significance.
5 Recommendations
The City Governments of Naga, Iriga and Legaspimust conduct further studies on suspended particulates during December and the summer months, to learn more on its effects especially to children and other sensitive members of the community. Since the Naga City was recorded to have the highest number of vehicles in its main thoroughfares, especially during the Peñafrancia Fiesta, it should encourage the planting of more trees by its constituents to reduce the TSP level. Since Iriga City was among the three samples sites that had a high level of pollution, it must strive to attain a “Good’ AQI by diverting the volume of vehicles in the city proper. The city government must also formulate policies that will control the surge of vehicles in the center of the city. There is also a need to reforest the mountains surrounding this city to off-set the high suspended particulates recorded that were not dissipated easily due to its geographical location. Legaspi City must control the burning of rice hull because this contributes to the increase in air pollution. It is better for the city to continue its program of re-routing for vehicles to minimize the number of traffic surging inside the city proper. Likewise, the sunshine duration should be measured daily to really determine its association with suspended particulates in future studies. A range for rainfall should be determined with corresponding equivalent to correlate with the amounts measured. The Local Government Units (LGUs) in each of the three cities must introduce environmental programs; like random checking of the exhaust of vehicles, and tree planting activities to contribute to a
Air Pollution XX 175
www.witpress.com, ISSN 1743-3541 (on-line) WIT Transactions on Ecology and The Environment, Vol 1 , © 2012 WIT Press57
consistent “Good” Air Quality Index and make communities free from air pollution-caused ailments.
References
[1] National Geographic. www.nationalgeographic.com. 2003. [2] EMB, 2004. Ambient Air Quality Monitoring in Urban/ Industrial Centers,
Annual Report CY 2004. [3] Nebel, Bernard J. and Richard T. Wright. Environmental Science, 6th ed.,
Prentice Hall, New Jersey. 1998. [4] Philippines, RA 8749, The Philippine Clean Air Act of 1999 and Its
Implementing Rules and Regulations, DENR, 2002. [5] Miller, Tyler G., Jr. Environmental Science: Working with the Earth, 5th ed.,
Wadsworth Publishing Company, Belmont, California. 1995. [6] Chiras, Daniel D. Environmental Science: Action for a sustainable Future,
4th ed., The Benjamin/Cummings Publishing Company, Inc., California. 1996.
[7] Raven, Peter H. et al. Environment, Saunders College Publishing, New York. 1995.
176 Air Pollution XX
www.witpress.com, ISSN 1743-3541 (on-line) WIT Transactions on Ecology and The Environment, Vol 1 , © 2012 WIT Press57