Mechanical fluid analysis for particulates via FTIR microscopy
Chapter 7
Measurement of Particulates
Part OneIntermittent PM2.5, PM10, PMc Monitoring
Part TwoTotal Suspended Particulate Monitoring for Metals
Part ThreeContinuous Particulate PM2.5, PM10, PMc Monitoring
Part FourPM2.5 Chemical Speciation Monitoring
Part FiveContinuous PM2.5 Chemical Speciation Monitoring

Chapter 7 Part One – Intermittent PM2.5, PM10 and PMc Monitoring
Table of Contents
Page
1.0 Introduction ........................................................................................................................ 11.1 Sampling Overview....................................................................................................... 3
2.0 Facility Requirements........................................................................................................ 62.1 Filter Conditioning and Weighing Area........................................................................ 62.2 Calibration and Maintenance Area................................................................................ 62.3 Sampling Sites............................................................................................................... 6
3.0 Filter Preparation and Analysis ....................................................................................... 73.1 Conditioning/Equilibration............................................................................................ 73.3 Sample Weighing .......................................................................................................... 73.4 Environmental Control Requirements......................................................................... 103.5 Permissible Holding Times ......................................................................................... 10
4.0 Sampler Operation........................................................................................................... 114.1 Siting Requirements .................................................................................................... 114.2 Sampler Installation..................................................................................................... 124.3 Sampling Operations ................................................................................................... 12
4.3.1 Sampling Procedures ......................................................................................... 13
5.0 Calibration Procedures ................................................................................................... 135.1 Calibration Procedure.................................................................................................. 14
6.0 Performance Audit Procedures ...................................................................................... 166.1 Partisol Plus Verification and Audit Procedure .......................................................... 166.2 Verification and Audit Data Reporting ....................................................................... 216.3 Audit Frequency .......................................................................................................... 216.4 Systems Audits ............................................................................................................ 21
7.0 Precision and Accuracy Assessment............................................................................... 227.1 Precision ...................................................................................................................... 227.2 Collocated Sampler Requirements .............................................................................. 227.3 Accuracy...................................................................................................................... 24
8.0 Maintenance ..................................................................................................................... 279.0 Forms ................................................................................................................................ 30
TABLES1 Filter Preparation and Analysis Checks.................................................................................. 92 Temperature Requirements.................................................................................................... 103 Holding Times ....................................................................................................................... 114 Inspection of Field Items ....................................................................................................... 285 Sample Set-up, Run, and Recovery Example Schedule ........................................................ 29
FIGURES1 Sample Inlet ............................................................................................................................. 32 (PM2.5 Very Sharp Cut Cyclone (VSCC)).................................................................................43 (PM2.5, PM10 Inlet, Downtube & VSCC)...................................................................................5
PHOTO1 Filter Weighing ......................................................................................................................... 8
FORMS1 PM2.5 Calibration Sheet.......................................................................................................... 302 PM2.5 Audit Sheet................................................................................................................... 323 PM2.5 Audit Form (Single Filter PM2.5 Data Sheet) .............................................................. 33
Chapter 7 Part 1Revision No. 12
December 31, 2017Page 1 of 34
Part One – Intermittent PM2.5, PM10 and PMc Monitoring
1.0 Introduction
Between the years 1900 and 1970, the emission of six principal ambient air pollutants increased significantly. The principal pollutants, also called criteria pollutants, are: particulate matter (PM10 & PM2.5), sulfur dioxide (SO2), carbon monoxide (CO), nitrogen dioxide (NO2), ozone (O3), and lead (Pb). In 1970 the Clean Air Act (CAA) was signed into law. The CAA and its amendments provide the framework for all pertinent organizations to protect air quality. This framework provides for the monitoring of these criteria pollutants by State and local organizations through the Ambient Air Quality Monitoring Program.
The criteria pollutant defined as particulate matter is a general term used to describe a broad class of substances that exist as liquid or solid particles over a wide range of sizes. As part of its Ambient Air Quality Monitoring Program, the Indiana Department of Environmental Management, Office of Air Quality (IDEM, OAQ) will measure two particle size fractions; those less than or equal to 10 micrometers (PM10), and those less than or equal to 2.5 micrometers (PM2.5). Part One of Chapter 7 focuses on the activities associated with intermittent PM2.5 and PM10 sampling using the Partisol-Plus.
The background and rationale for the implementation of Indiana’s PM2.5 and PM10 ambient air monitoring network are found in the Federal Register. In general, some of the findings are listed below.
The characteristics, sources, and potential health effects of larger or "coarse" particles (from 2.5 to 10 micrometers in diameter) and smaller or “fine" particles (smaller than 2.5 micrometers in diameter) are very different.
Coarse particles come from sources such as windblown dust from agricultural fields and dust kicked up on unpaved roads from vehicle traffic.
Fine particles are generally emitted from activities such as industrial and residential combustion and from vehicle exhaust. Fine particles are also formed in the atmosphere from gases such as sulfur dioxide, nitrogen oxides, and volatile organic compounds that are emitted from combustion activities and then become particles as a result of chemical transformations in the air.
Coarse particles can deposit in the respiratory system and contribute to health effects such as aggravation of asthma. The United States Environmental Protection Agency (USEPA) OAQPS staff paper titled Review of the National Ambient Air Quality Standards for Particulate Matter – Policy Assessment of Scientific and Technical Information concludes that fine particles, which also deposit deeply in the lungs, are more likely than coarse particles to contribute to the health effects (i.e., premature mortality and hospital admissions) found in a number of recently published community epidemiological studies.
Chapter 7 Part 1Revision No. 12
December 31, 2017Page 2 of 34
These community studies find that adverse public health effects are associated with exposure to particles at levels well below the current standards for both short-term (i.e., less than 1 day to up to 5 days) and long-term (generally a year to several years) periods.
Health effects include premature death and increased hospital admissions and emergency room visits (primarily among the elderly and individuals with cardiopulmonary disease); increased respiratory symptoms and disease (among children and individuals with cardiopulmonary disease such as asthma); decreased lung function (particularly in children and individuals with asthma); and alterations in lung tissue and structure and in respiratory tract defense mechanisms.
Air quality samples are generally collected for one or more of the following purposes:
1. To judge compliance with and/or progress made towards meeting the NAAQS.
2. To develop, modify or activate control strategies that prevent or alleviate air pollution episodes.
3. To observe pollution trends throughout the region, including non-urban areas.
4. To provide a data base for research and evaluation of effects.
With the end use of the air quality samples as a prime consideration, various networks can be designed to meet one of six basic monitoring objectives listed below:
Determine the highest concentration limits to occur in the area covered by the network.Determine representative concentrations in areas of high population density.Determine the impact on ambient pollution levels of significant source or source categories.Determine general background concentration levels.Determine the extent of regional pollutant transport among populated areas, and in support of secondary standards.Determine the welfare related impacts in rural and remote areas.
The reference method for sampling PM2.5 is found in 40 CFR Part 50, Appendix L, while PM10is covered in CFR Part 50, Appendix J. Both are referenced in 40 CFR part 53, Subpart E, In summary, the sampling involves drawing a measured quantity of ambient air at a constant volumetric flow rate through a specially designed particulate size selective inlet. PM2.5 particles are those with an aerodynamic diameter of less than or equal to 2.5 microns ( m). Particles are collected on a 46.2-millimeter (mm) polytetrafluoreoethylene filter during the specified 23 to 25-hour sampling period. Each filter is weighed before and after sampling. From these measurements, the mass of the collected PM2.5/10 sample is calculated.
The total volume of air sampled is determined from the measured volumetric flow rate and the
Chapter 7 Part 1Revision No. 12
December 31, 2017Page 3 of 34
sampling time. The concentration of PM2.5/10 in the ambient air is computed as the total mass of collected particles in the PM2.5 size range divided by the total volume of air sampled and measured under the ambient (actual) conditions of temperature and pressure. The PM2.5 and PM10 concentrations are expressed as micrograms per cubic meter ( g/m3) of air.
1.1 Sampling Overview
Indiana uses Thermo Scientific Partisol-Plus Model 2025 Sequential Air Samplers to meet the measurement goals of the PM 2.5 and PM10 Ambient Air Quality Monitoring Program. Most monitoring stations sample either a one in three day or a one in six day schedule with a few PM2.5 sites conducting daily (one in one day) sampling.
All PM2.5 and PM10 filters used in state agency operated Ambient Air Quality Monitoring Program are conditioned, weighed, and loaded into filter cassette assemblies (storage magazines) in the Office of Air Quality’s PM2.5 and PM10 Clean Rooms in Indianapolis prior to distribution into the field. Exposed filters are returned to the Office of Air Quality’s Clean Rooms for post sampling conditioning and analysis. This process is documented to ensure data integrity and to prevent data lost due to inadequate or improper handling of the sampling media.
Additional information regarding permissible sample holding times is specified in 40 CFR Part 50, Appendices J and L, Section 8 of the USEPA QA Handbook, the IDEM OAQ’s related SOPson filter transport (2025 Filter Shipping S-028-OAQ-M-AM-14-S-R1, 2025 Filter Receiving and Processing Procedures S-139-OAQ-AMB-AM-16-T-R0) and Table 16 of this document.
Figure 1 Sample Inlet
Chapter 7 Part 1Revision No. 12
December 31, 2017Page 4 of 34
Figure 2PM2.5 Very Sharp Cut Cyclone (VSCC)
Chapter 7 Part 1Revision No. 12
December 31, 2017Page 5 of 34
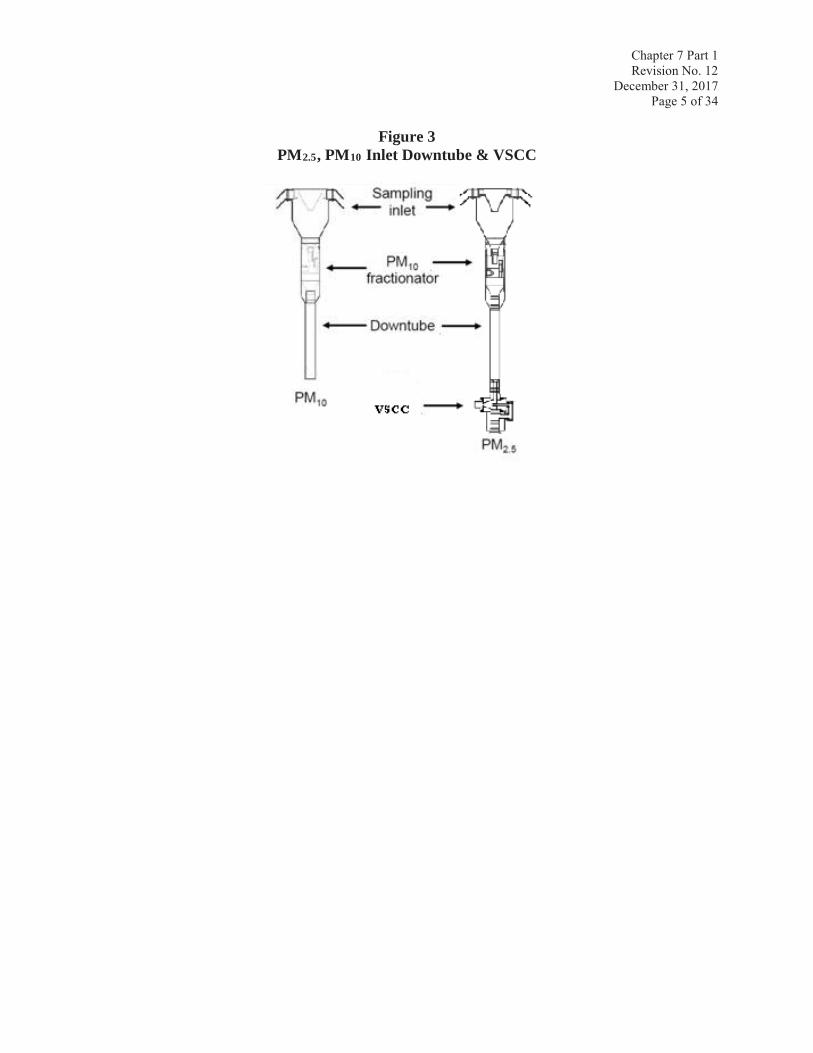
Figure 3PM2.5, PM10 Inlet Downtube & VSCC
Chapter 7 Part 1Revision No. 12
December 31, 2017Page 6 of 34
2.0 Facility Requirements
Facility requirements for PM2.5 and PM10 sampling include a central laboratory that includes a filter conditioning and weighing area (Clean Room), a calibration and maintenance area, and individual field sampling stations.
2.1 Filter Conditioning and Weighing Area
The Indiana Department of Environmental Management, Office of Air Quality specifically designed a room or “clean room” for the conditioning and weighing of the filters. This clean room is a restricted access area that meets the criteria in CFR Part 50, Appendix L and USEPA’s “Quality Assurance Guidance Document 2.12” of the Quality Assurance Handbook for Air Pollution Measurements Systems. These criteria include:
mean temperature of 20-23 °C
temperature controlled within ±2 °C standard deviation over 24 hours
mean humidity maintained at 30-40%
humidity control ±5% standard deviation relative humidity over 24 hours
temperature and relative humidity is continuously monitored with 5-minute averages, collected by a data logger and information saved to a computer hard drive
In addition, certified relative humidity and temperature measurement instruments must be maintained.
2.2 Calibration and Maintenance Area
A sufficiently large area should be designated as the calibration and maintenance test area. It should be equipped with the tools required for routine sampler maintenance and ancillary equipment maintenance and repair.
2.3 Sampling Sites
As with any type of air monitoring study in which the sample data are used to draw conclusions about a geographic area, the validity of those conclusions depends on the representativeness of the sampling data. Therefore, an initial goal of the Indiana’s monitoring project is to select a site where the PM2.5 and/or PM10 measurements are representative of the monitoring area.
Spatial and temporal scale considerations are important in PM2.5/10 sampler siting. Spatial scales may range from a small (0.1 - to 0.5 km2) area to large regional areas exceeding tens of hundreds of square kilometers. Whether the potential impact of particulate pollution is generated by a local or general source category will affect the decision on the size of the spacial monitoring scale. In addition, the siting of the samplers within the monitoring network should reflect whether the
Chapter 7 Part 1Revision No. 12
December 31, 2017Page 7 of 34
expected impact is limited to a small area (a few city blocks) or will extend to larger areas (metropolitan and rural). With regard to the temporal scale, interest focuses on either the annual or the geometric mean concentration or a 24-hour average concentration. Because siting of a PM2.5/10 sampler requires considering the prevailing wind direction, a sampler sited for monitoring trends in air quality over a period of a year will not necessarily be ideal for measuring 24-hour concentrations. Thus, the choice of temporal aspects of the network design and optimum exposure are more completely explained in 40 CFR Part 50, Appendix L and Part 58, Appendix D and in the siting guidelines outlined in Chapter 1 Section 4.0, of the Indiana Department of Environmental Management, Office of Air Quality’s Quality Assurance Manual.
3.0 Filter Preparation and Analysis
Upon delivery of approved 46.2 mm teflon filters for use in the IDEM network, the receipt is documented and the filters are stored in the conditioning/weighing room/laboratory “clean room”. Storing filters in the laboratory makes it easier to maximize the amount of time available for conditioning. Upon receipt, cases of filters are labeled with the date, opened one at a time, and used completely before opening another case. IMPORTANT: Utilize a lot of filters before opening a new case lot of filters. When more than one case is available for use, the “First In -First Out” rule applies.
Filters are retreived from the case when space becomes available for them in the pre-sampling weighing section of the clean room. Filters are inspected according to the Federal Reference Method (FRM) criteria to determine compliance. Filters are then stored in the clean room in labeled petri dishes.
3.1 Conditioning/Equilibration
A room or “clean room” specifically designed for the conditioning and weighing of the filters has been constructed at the Indiana Department of Environmental Management, Office of Air Quality. See section 2.1 for specifics.
3.3 Sample Weighing
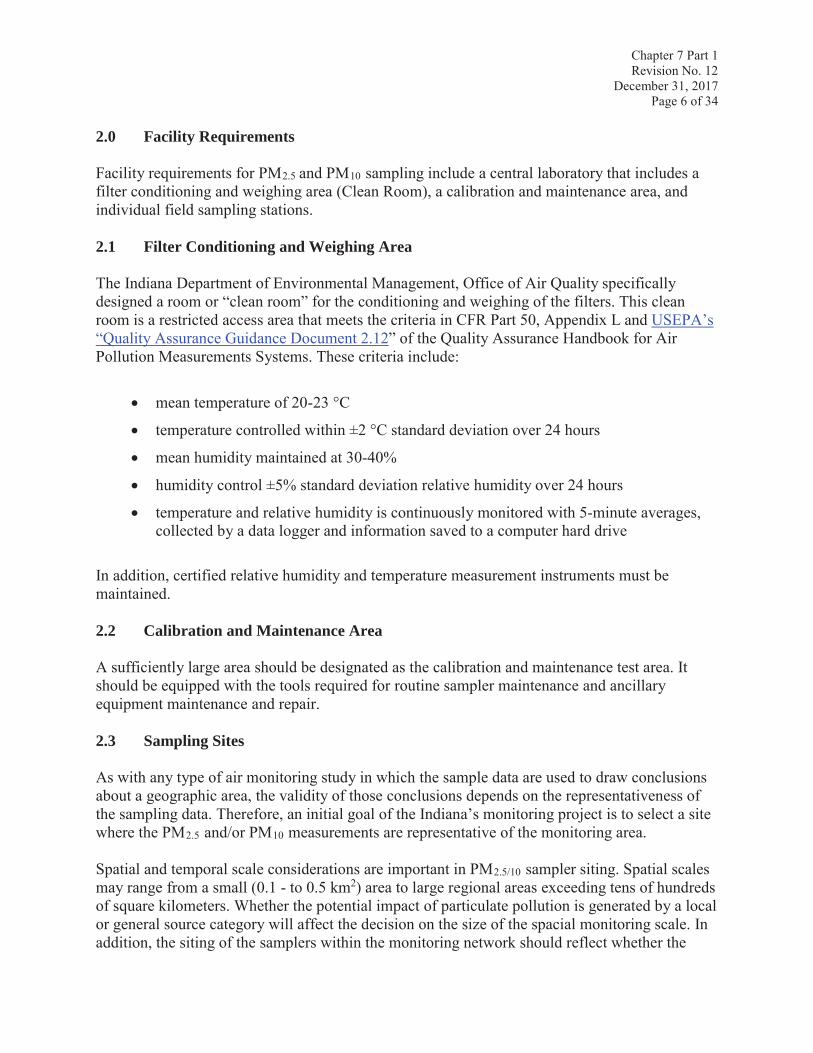
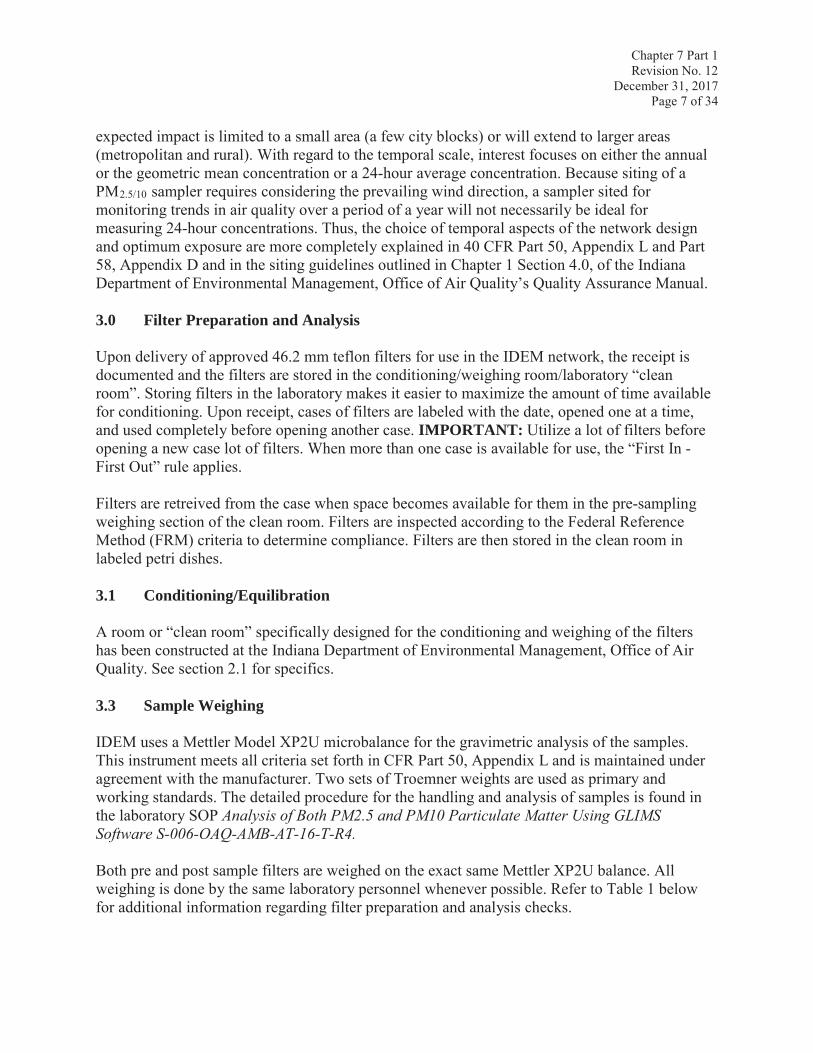
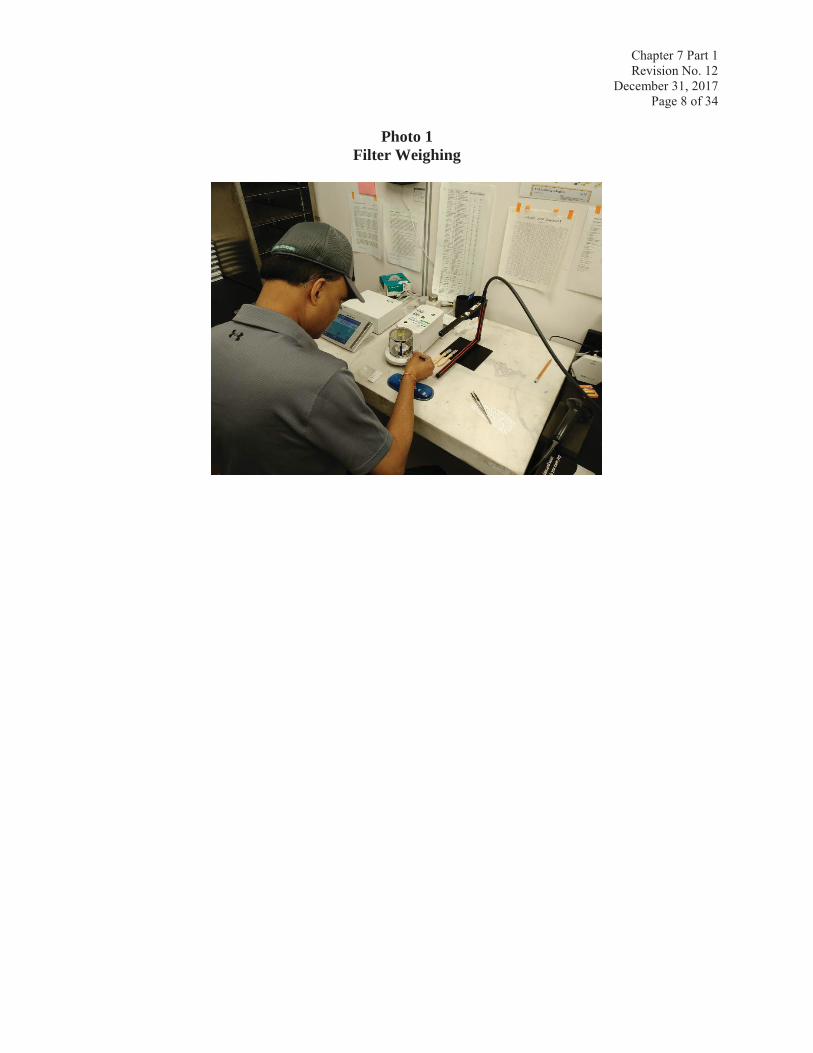
IDEM uses a Mettler Model XP2U microbalance for the gravimetric analysis of the samples. This instrument meets all criteria set forth in CFR Part 50, Appendix L and is maintained under agreement with the manufacturer. Two sets of Troemner weights are used as primary and working standards. The detailed procedure for the handling and analysis of samples is found in the laboratory SOP Analysis of Both PM2.5 and PM10 Particulate Matter Using GLIMS Software S-006-OAQ-AMB-AT-16-T-R4.
Both pre and post sample filters are weighed on the exact same Mettler XP2U balance. Allweighing is done by the same laboratory personnel whenever possible. Refer to Table 1 below for additional information regarding filter preparation and analysis checks.
Chapter 7 Part 1Revision No. 12
December 31, 2017Page 8 of 34
Photo 1 Filter Weighing
Chapter 7 Part 1Revision No. 12
December 31, 2017Page 9 of 34
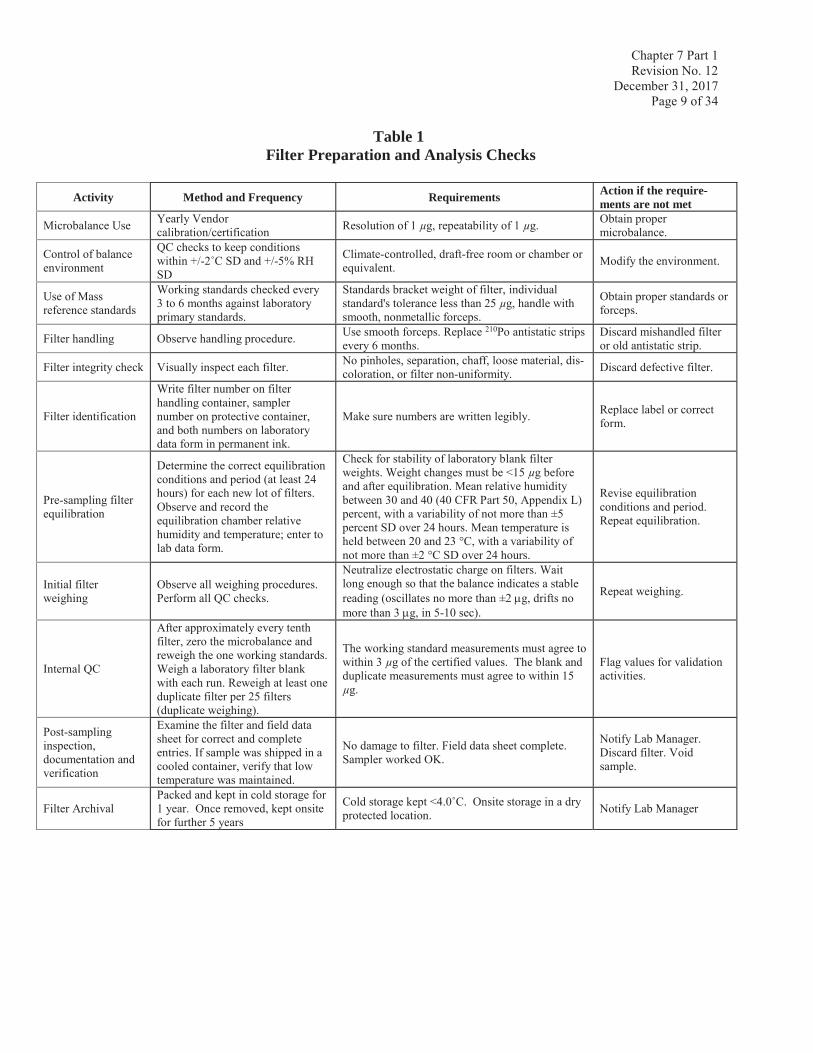
Table 1Filter Preparation and Analysis Checks
Activity Method and Frequency Requirements Action if the require-ments are not met
Microbalance Use Yearly Vendor calibration/certification Resolution of 1 μg, repeatability of 1 μg. Obtain proper
microbalance.
Control of balanceenvironment
QC checks to keep conditions within +/- SD and +/-5% RHSD
Climate-controlled, draft-free room or chamber or equivalent. Modify the environment.
Use of Mass reference standards
Working standards checked every 3 to 6 months against laboratory primary standards.
Standards bracket weight of filter, individual standard's tolerance less than 25 μg, handle with smooth, nonmetallic forceps.
Obtain proper standards or forceps.
Filter handling Observe handling procedure. Use smooth forceps. Replace 210Po antistatic strips every 6 months.
Discard mishandled filter or old antistatic strip.
Filter integrity check Visually inspect each filter. No pinholes, separation, chaff, loose material, dis-coloration, or filter non-uniformity. Discard defective filter.
Filter identification
Write filter number on filter handling container, sampler number on protective container, and both numbers on laboratory data form in permanent ink.
Make sure numbers are written legibly. Replace label or correct form.
Pre-sampling filter equilibration
Determine the correct equilibration conditions and period (at least 24 hours) for each new lot of filters. Observe and record the equilibration chamber relative humidity and temperature; enter to lab data form.
Check for stability of laboratory blank filter weights. Weight changes must be <15 μg before and after equilibration. Mean relative humidity between 30 and 40 (40 CFR Part 50, Appendix L) percent, with a variability of not more than ±5 percent SD over 24 hours. Mean temperature is held between 20 and 23 °C, with a variability of not more than ±2 °C SD over 24 hours.
Revise equilibration conditions and period. Repeat equilibration.
Initial filter weighing
Observe all weighing procedures. Perform all QC checks.
Neutralize electrostatic charge on filters. Wait long enough so that the balance indicates a stable reading (oscillates no more than ±2 g, drifts no more than 3 g, in 5-10 sec).
Repeat weighing.
Internal QC
After approximately every tenth filter, zero the microbalance and reweigh the one working standards. Weigh a laboratory filter blankwith each run. Reweigh at least one duplicate filter per 25 filters(duplicate weighing).
The working standard measurements must agree to within 3 μg of the certified values. The blank and duplicate measurements must agree to within 15μg.
Flag values for validation activities.
Post-sampling inspection, documentation and verification
Examine the filter and field data sheet for correct and complete entries. If sample was shipped in a cooled container, verify that low temperature was maintained.
No damage to filter. Field data sheet complete. Sampler worked OK.
Notify Lab Manager. Discard filter. Void sample.
Filter ArchivalPacked and kept in cold storage for 1 year. Once removed, kept onsite for further 5 years
Cold storage kept <4.protected location. Notify Lab Manager
Chapter 7 Part 1Revision No. 12
December 31, 2017Page 10 of 34
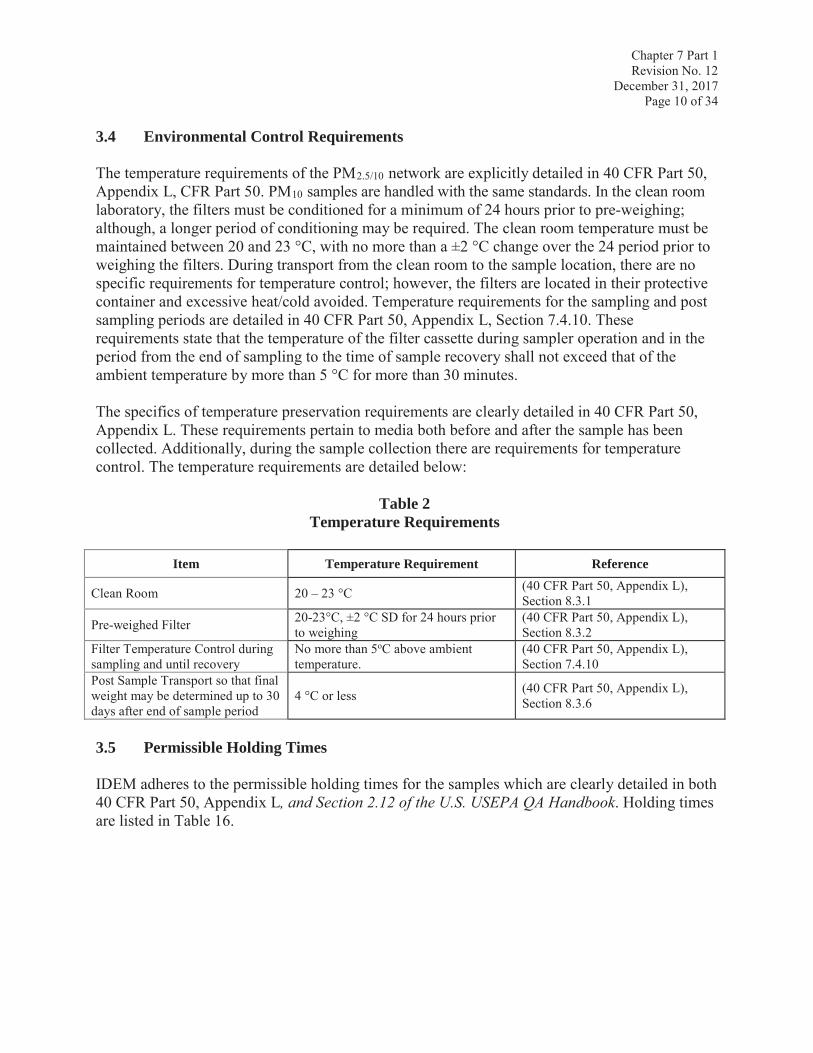
3.4 Environmental Control Requirements
The temperature requirements of the PM2.5/10 network are explicitly detailed in 40 CFR Part 50, Appendix L, CFR Part 50. PM10 samples are handled with the same standards. In the clean room laboratory, the filters must be conditioned for a minimum of 24 hours prior to pre-weighing; although, a longer period of conditioning may be required. The clean room temperature must be maintained between 20 and 23 °C, with no more than a ±2 °C change over the 24 period prior to weighing the filters. During transport from the clean room to the sample location, there are no specific requirements for temperature control; however, the filters are located in their protective container and excessive heat/cold avoided. Temperature requirements for the sampling and post sampling periods are detailed in 40 CFR Part 50, Appendix L, Section 7.4.10. These requirements state that the temperature of the filter cassette during sampler operation and in the period from the end of sampling to the time of sample recovery shall not exceed that of the ambient temperature by more than 5 °C for more than 30 minutes.
The specifics of temperature preservation requirements are clearly detailed in 40 CFR Part 50, Appendix L. These requirements pertain to media both before and after the sample has been collected. Additionally, during the sample collection there are requirements for temperature control. The temperature requirements are detailed below:
Table 2Temperature Requirements
Item Temperature Requirement Reference
Clean Room 20 – 23 °C (40 CFR Part 50, Appendix L), Section 8.3.1
Pre-weighed Filter 20-23°C, ±2 °C SD for 24 hours prior to weighing
(40 CFR Part 50, Appendix L), Section 8.3.2
Filter Temperature Control during sampling and until recovery
No more than 5oC above ambient temperature.
(40 CFR Part 50, Appendix L), Section 7.4.10
Post Sample Transport so that final weight may be determined up to 30 days after end of sample period
4 °C or less (40 CFR Part 50, Appendix L), Section 8.3.6
3.5 Permissible Holding Times
IDEM adheres to the permissible holding times for the samples which are clearly detailed in both 40 CFR Part 50, Appendix L, and Section 2.12 of the U.S. USEPA QA Handbook. Holding times are listed in Table 16.
Chapter 7 Part 1Revision No. 12
December 31, 2017Page 11 of 34
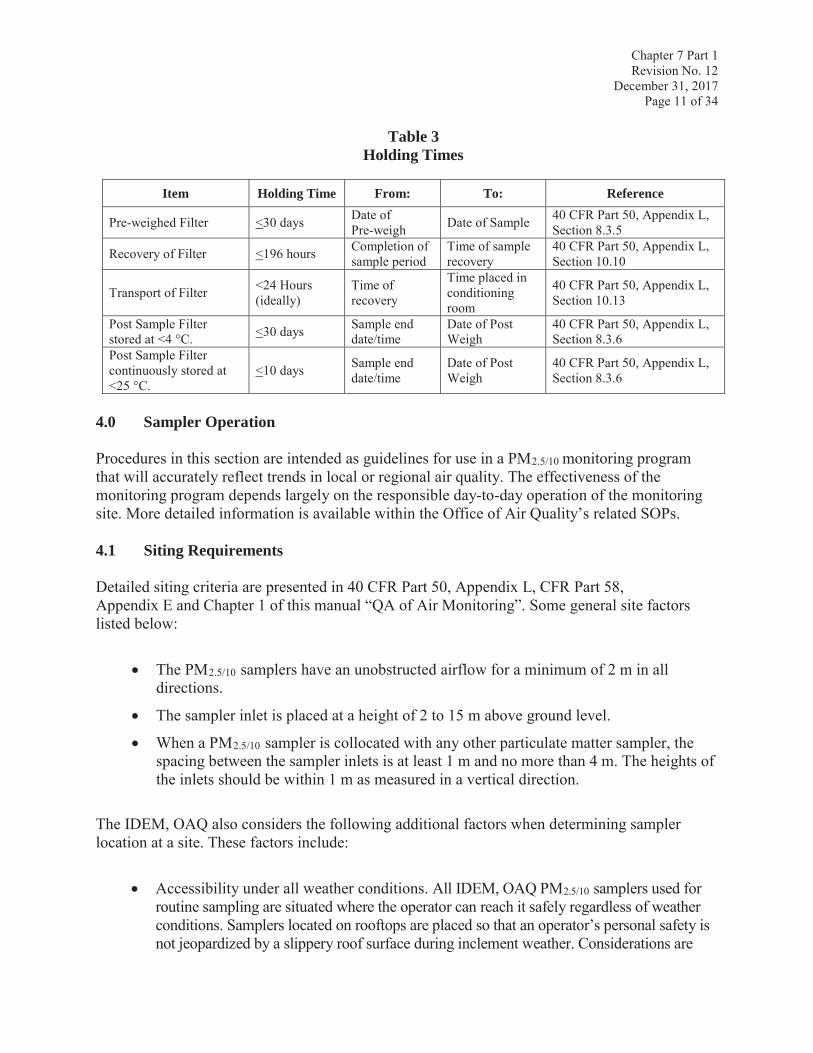
Table 3Holding Times
Item Holding Time From: To: Reference
Pre-weighed Filter <30 days Date of Pre-weigh Date of Sample 40 CFR Part 50, Appendix L,
Section 8.3.5
Recovery of Filter <196 hours Completion of sample period
Time of sample recovery
40 CFR Part 50, Appendix L, Section 10.10
Transport of Filter <24 Hours (ideally)
Time of recovery
Time placed in conditioning room
40 CFR Part 50, Appendix L, Section 10.13
Post Sample Filter stored at <4 °C. <30 days Sample end
date/timeDate of Post Weigh
40 CFR Part 50, Appendix L, Section 8.3.6
Post Sample Filter continuously stored at <25 °C.
<10 days Sample end date/time
Date of Post Weigh
40 CFR Part 50, Appendix L, Section 8.3.6
4.0 Sampler Operation
Procedures in this section are intended as guidelines for use in a PM2.5/10 monitoring program that will accurately reflect trends in local or regional air quality. The effectiveness of the monitoring program depends largely on the responsible day-to-day operation of the monitoring site. More detailed information is available within the Office of Air Quality’s related SOPs.
4.1 Siting Requirements
Detailed siting criteria are presented in 40 CFR Part 50, Appendix L, CFR Part 58, Appendix E and Chapter 1 of this manual “QA of Air Monitoring”. Some general site factors listed below:
The PM2.5/10 samplers have an unobstructed airflow for a minimum of 2 m in all directions.
The sampler inlet is placed at a height of 2 to 15 m above ground level.
When a PM2.5/10 sampler is collocated with any other particulate matter sampler, the spacing between the sampler inlets is at least 1 m and no more than 4 m. The heights of the inlets should be within 1 m as measured in a vertical direction.
The IDEM, OAQ also considers the following additional factors when determining sampler location at a site. These factors include:
Accessibility under all weather conditions. All IDEM, OAQ PM2.5/10 samplers used for routine sampling are situated where the operator can reach it safely regardless of weather conditions. Samplers located on rooftops are placed so that an operator’s personal safety is not jeopardized by a slippery roof surface during inclement weather. Considerations are
Chapter 7 Part 1Revision No. 12
December 31, 2017Page 12 of 34
also given to the fact that routine operations (i.e., calibrations, sampler filter installation and recovery, flow verifications and audits) involve transporting equipment and supplies to and from the monitoring site.
Availability of adequate electricity. 40 CFR Part 50, Appendix L, specifies that aPM2.5/10 sampler is required to operate at 105-125 volts, AC and at a frequency of 59-61 Hz. The sampler may pull a higher current when the pump starts, possibly necessitating a slow-blow fuse. Although PM2.5/10 samplers are required to indicate power interruptions, every effort is made to provide a stable source for the monitoring site.
Security of monitoring personnel and equipment. The security of personal and the sampler itself depends largely on location. The IDEM OAQ utilizes rooftop sites with locked access and ground level sites with fences whenever possible.
4.2 Sampler Installation
Secure the sampler onto a platform.
Plug the power cord into the voltage outlet and energize the sampler. Electrical connections should be waterproofed to ensure operator safety and to avoid short-circuit and/or power interruptions. All electrical connections must be installed so as not to become submerged in water during periods of inclement weather.
Perform calibrations of the temperature and pressure sensors.
Perform flow calibrations according to the manufacturer’s instructions.
Install a VSCC (PM2.5) or downtube (PM10) in the sampler.
Program sample frequency, start date.
Load sampler with filter magazines.
The sampler is now ready for routine sample collection.
4.3 Sampling Operations
All filters are kept in protective cassette cartridges/magazines until installation in the sampler. Filter cassette magazines may be installed or exchanged in any of the sampler’s operating modes.
The Partisol-Plus Sampler allows magazines for filter cassette supply and storage. Any scheduled maintenance (i.e. .impactor replacement, pressure and temperature checks etc.) is performed prior to the installation of a new filter storage magazine. The only holding time that affects sample set-up is the 30 day window from the time a filter is pre-weighed to the time it is installed in the monitor. At collocated sites the second monitor is set up to run at a sample frequency of 1 in 6 days; sample set-up takes place on the same day as the primary (reporting)
Chapter 7 Part 1Revision No. 12
December 31, 2017Page 13 of 34
sampler. Detailed sample set-up procedures are available in the IDEM PM2.5 2025 Filter Pickup and Setup S-016-OAQ-M-AM-13-T-R1 standard operating procedure.
4.3.1 Sampling Procedures
Upon arrival at a monitoring site (initial sample setup, no previous sample):
1. Annotate the following on a Single Filter PM Data Sheet attachment Form 3:
Date and time of the sampler set-up visit
Site designation and location
Sampler model, ID number, and filter ID number
Sample start date and time
Unusual conditions that may affect the samples (e.g. construction activity, weather)
Set-up operator’s signature or initials
Note: Each data sheet is individually labeled with a bar code sticker printed with a site name, site code number and sample run month/day/year.
2. Open the sampler enclosure.
3. Ensure proper placement of the filter magazines. Supply magazine is on the left side and the storage magazine is on the right side.
4. Ensure that the air connection fitting of the cassette magazine is facing toward the operator and attach the magazine using the mounting studs on the sampler.
5. Lock the magazine into place.
6. Remove and cap the filter storage magazine (right) and replace it with an empty storage magazine.
7. Prepare the storage filter magazine for transport back to the laboratory facility
5.0 Calibration Procedures
Calibration is defined as the relationship between an instrument’s output and the output of a known reference standard. For samplers that are already in the field collecting data, a verification must be performed prior to a calibration.
The following equipment is necessary for proper calibration of the Partisol Plus sampler:
Chapter 7 Part 1Revision No. 12
December 31, 2017Page 14 of 34
NIST-certified traceable thermometer or temperature probe capable of measuring ambient air over the expected climate conditions with a resolution of 0.1 °C, with an accuracy of ±0.5 °C.
Aneroid or digital barometer capable of measuring barometric pressure over the range of 500 to 800 millimeters of mercury (mmHg) to the nearest millimeter of Hg and referenced at least annually to a standard of known accuracy within ±5 mmHg.
Certified Flow Transfer Standard (FTS).
Digital, water, or oil manometer with a range of at least 0 to 12 inches and 0.1 inch resolution.
Standard time piece of known accuracy within ±2 min/24hr.
Filter cartridge(s) and magazine(s).
PM2.5/PM10 Calibration Shee.t
Flow rate determination as described in this section is made using a Chinook Flow Transfer Standard (FTS) that has been certified according to the procedure presented in Section 2.2.2 of the USEPA’s “Quality Assurance Guidance Document 2.12” and Chapter 6 of this manual“Certification Methods of Transfer Standards”.
Consistency of temperature and barometric pressure units is required and will be expressed in Kelvin (°C + 273) and millimeters of mercury (mmHg).
5.1 Calibration Procedure
1. Record calibration date and time, sampler serial number, and calibration equipment serial numbers and certification information on the calibration sheet.
2. Ensure that the 2025 is in STOP mode. If found in mode other than STOP, press the RUN/STOP button until STOP is displayed.
3. Place a magazine of audit cassettes on the supply side of the sampler. Remove the inlet on the down tube.
4. Press the “MENU” key to enter the Master Menu
5. Arrow down to Service Mode, and press ENTER to enter Service Mode. Hit the F4 “Yes” soft key when prompted “Are You Sure?”
6. Arrow down to Calibration/Audit and press ENTER. This will bring up the Analog I/O calibration.
7. Press F1 to begin the I/O calibration. This is an automated process that lasts several minutes. Once complete, record the Input, User, and Output values for the offset and span on the calibration worksheet.
8. Next perform the ambient temperature and barometric pressure calibration by hitting
Chapter 7 Part 1Revision No. 12
December 31, 2017Page 15 of 34
F3 “SensCal”. Place the reference thermometer/temperature probe into/under the ambient temperature shield.
9. Enter the reference values from a certified thermometer/temperature probe and barometer into the 2025 by using the arrows and keypad. Record the values along with the offset on the calibration form.
10. Press the F4 “FiltCal” button to calibrate the internal temperature sensors. The Filt Comp sensor reads the temperature within the 2025, while the Filter 1 sensor monitors temperature within the sampling line where the filter cartridge sits during sampling.
11. Open the top of the sampler by releasing the two latches located on the upper right side and remove the VSCC (PM2.5) or Pass Through Adapter Tube (PM10). Place a thermometer/temperature probe into the sample cartridge space.
12. Enter the reference values into the 2025 by using the arrows and keypad. Record the values along with the offset on the calibration form.
13. Hit the ESC button to return to the Service Menu. Press the F1 “Audit” button to enter the Audit screen. Press the F4 “FiltAdv” to advance an audit cassette into the sampling position.
14. Return the VSCC or Through Bypass Tube into place and lock the lid. Press ESC to return to the Service Menu.
15. Press the F2 “LeakChk” button to begin the leak check process.
16. Press the F2 “Start” button followed by the F1 “External”. Ensure that a filter is in place and press F1 “Yes.”
17. Install and close a flow audit adapter onto the downtube. Once in place, press any key to start the leak check. Once the process is complete, record the leak value, in mmHg/min, on the calibration form. Slowly open and remove the flow audit adapter.If the value is <25.0 mmHg then it passes. The sampler will indicate if it passed or failed. If it fails or close to failing, clean or replace the V-seals, try using another cassette, or perform any other maintenance recommended by consulting the instrument manual and repeat the leak check.
18. Return to the Calibration/Audit screen by hitting ESC and arrowing down to Calibration/Audit.
19. Press the F5 “FlowCal” button to calibrate the instrument’s flow.
20. Arrow down to “Const m” and enter the slope and intercept as found on the FTS’s certification sticker. Repeat the process for “Const b.”
21. Press the F5 “More” button followed by F4 “Start.” Enter the reference values for 3 points (15.0, 16.7, and 18.4 lpm) into the 2025. Allow the flow to equilibrate at each point. Record flow on calibration form.
22. Perform a post calibration flow verification. This verification should be <±2.1%. For detailed audit instructions, see section 6.1 of this document.
Chapter 7 Part 1Revision No. 12
December 31, 2017Page 16 of 34
23. Remove the audit cassette(s) and magazine. Return the inlet to the down-tube. Once finished, exit service mode to return the sampler to its normal operating status by pressing the ESC button until back to the Service Menu. Arrow down to “Exit Service Mode” and hit ENTER
24. Confirm the time is within +1 minute and the date is correct.
25. Press the RUN/STOP button until the sampler is in OK/WAIT.
26. Note calibration results in the sampler’s logbook and if available an electronic log.
6.0 Verification and Audit Procedures
The primary goal of a verification and auditing program is to identify problems that may result in suspect or invalid data. The verification checks are performed by the operating agency, who also performs the calibrations. Audits must be performed by another group independent of performing the calibrations. Verifications and audits should be conducted under the following guidelines:
Audits must be performed without special preparation or adjustments made to the system.
The individual performing the audit must be someone other than the routine operator and have a thorough knowledge of all instruments or processes being evaluated.
All aspects of the verification and audit must be completely documented including the types of instruments and transfer standards, model and serial numbers, calibration information, etc.
The Partisol-Plus samplers in the State of Indiana’s Ambient Monitoring Network have verifications performed monthly by the Ambient Monitoring Sections, and audits performed quarterly by the Quality Assurance Section
6.1 Partisol Plus Verification and Audit Procedure
The following equipment is necessary for proper verification and audit of the Partisol Plus sampler (NOTE: Audit equipment cannot be used for calibrations or verifications but the equipment for the verifications can be the same that is used to calibrate the sampler):
NIST-certified traceable thermometer or temperature probe capable of measuring ambient air over the expected climate conditions with a resolution of 0.1 °C, with an accuracy of ±0.5 °C.
Aneroid or digital barometer capable of measuring barometric pressure over the range of 500 to 800 mmHg to the nearest millimeter of Hg and referenced at least annually to a standard of known accuracy with ±5 mmHg.
Certified Flow Transfer Standard (FTS)
Chapter 7 Part 1Revision No. 12
December 31, 2017Page 17 of 34
Digital, water, or oil manometer with a range of at least 0 to 12 inches and 0.1 inch resolution.
Standard time piece of known accuracy within ±2 min/24hr.
Filter cartridge(s) and magazine(s)
PM2.5/PM10 Verification/Audit FormFlow rate determination as described in this section is made using a Chinook Flow Transfer Standard (FTS) that has been certified according to the procedure presented in Section 2.2.2 of the USEPA’s “Quality Assurance Guidance Document 2.12” and Chapter 6 “Certification Methods of Transfer Standards” of this manual.
Consistency of temperature and barometric pressure units is required and will be expressed in Kelvin (°C + 273) and millimeters of mercury (mmHg).
Below are the procedures for the Verification:
1. Place a certified thermometer or temperature probe into/under the ambient temperature sensor shield.
2. Replace the supply and storage magazines within the Partisol-Plus with the corresponding Ambient magazine.
3. Record verification date and time, sampler serial number, and certification equipment serial numbers and certification information on the verification form. The sampler time must be within ±5 minutes of the local standard time. If >5 minutes adjust the time and make note of this. Confirm the date is correct and if needed, adjust the date and make note of this. If the time is off by more than 60 minutes or the date is incorrect than some determination on when this occurred must be determined since some filters could be invalid.
4. Enter the Audit screen by pressing RUN/STOP twice, MENU twice, then ENTER
5. Record the reference and observed ambient temperature and pressure on the verification form. Temperature and pressure limits are <±2.1ºC and <±10.1mm Hg respectively.
6. Press the F4 “FiltAdv” to advance the first ambient cassette into the sampling position.
7. Open the top of the sampler by releasing the two latches located on the upper right side and remove the VSCC (PM2.5) or Through Adapter Tube (PM10). Place a thermometer/temperature probe into the sample cartridge space.
8. Record the filter reference and observed temperatures. Temperature limit is <±2.1ºC.Replace the VSCC (PM2.5) or Through Bypass Tube (PM10) and close the top of the sampler.
9. Press F5 “LeakChk” to begin the leak check procedure.
Chapter 7 Part 1Revision No. 12
December 31, 2017Page 18 of 34
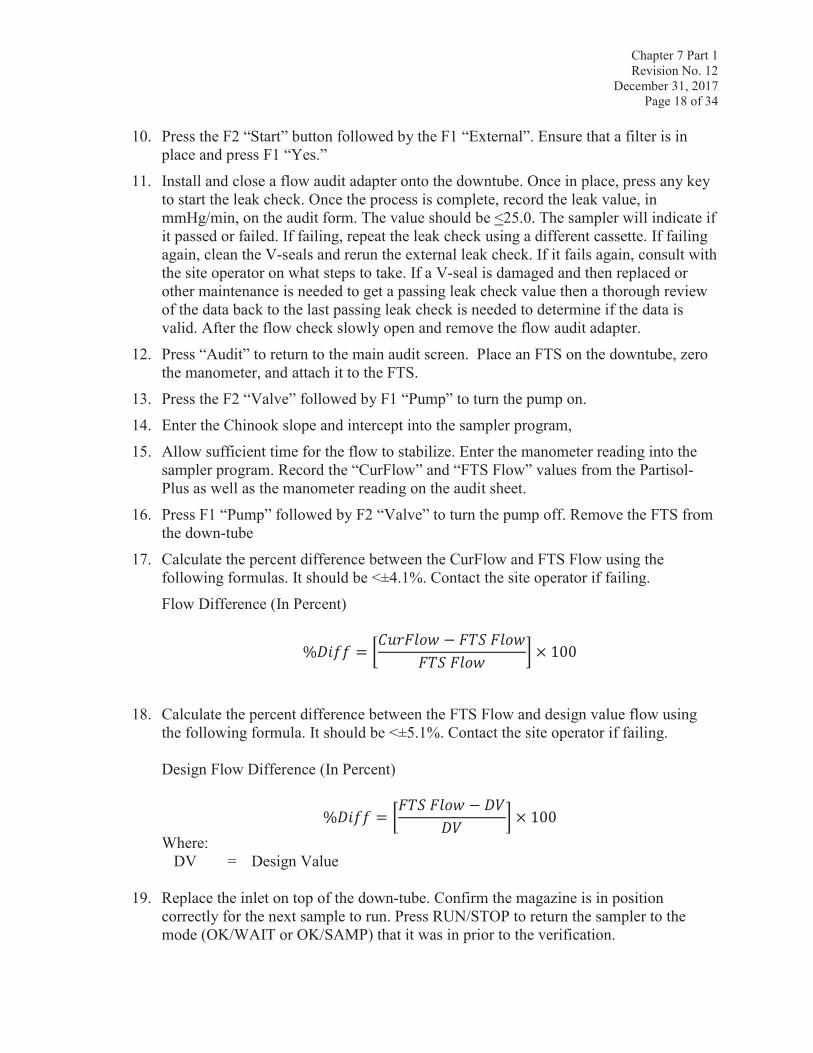
10. Press the F2 “Start” button followed by the F1 “External”. Ensure that a filter is in place and press F1 “Yes.”
11. Install and close a flow audit adapter onto the downtube. Once in place, press any key to start the leak check. Once the process is complete, record the leak value, in mmHg/min, on the audit form. The value should be <25.0. The sampler will indicate if it passed or failed. If failing, repeat the leak check using a different cassette. If failing again, clean the V-seals and rerun the external leak check. If it fails again, consult with the site operator on what steps to take. If a V-seal is damaged and then replaced or other maintenance is needed to get a passing leak check value then a thorough review of the data back to the last passing leak check is needed to determine if the data is valid. After the flow check slowly open and remove the flow audit adapter.
12. Press “Audit” to return to the main audit screen. Place an FTS on the downtube, zero the manometer, and attach it to the FTS.
13. Press the F2 “Valve” followed by F1 “Pump” to turn the pump on.
14. Enter the Chinook slope and intercept into the sampler program,
15. Allow sufficient time for the flow to stabilize. Enter the manometer reading into the sampler program. Record the “CurFlow” and “FTS Flow” values from the Partisol-Plus as well as the manometer reading on the audit sheet.
16. Press F1 “Pump” followed by F2 “Valve” to turn the pump off. Remove the FTS from the down-tube
17. Calculate the percent difference between the CurFlow and FTS Flow using the following formulas. It should be <±4.1%. Contact the site operator if failing.
Flow Difference (In Percent)
% = × 10018. Calculate the percent difference between the FTS Flow and design value flow using
the following formula. It should be <±5.1%. Contact the site operator if failing.
Design Flow Difference (In Percent)
% = × 100Where:
DV = Design Value
19. Replace the inlet on top of the down-tube. Confirm the magazine is in position correctly for the next sample to run. Press RUN/STOP to return the sampler to the mode (OK/WAIT or OK/SAMP) that it was in prior to the verification.
Chapter 7 Part 1Revision No. 12
December 31, 2017Page 19 of 34
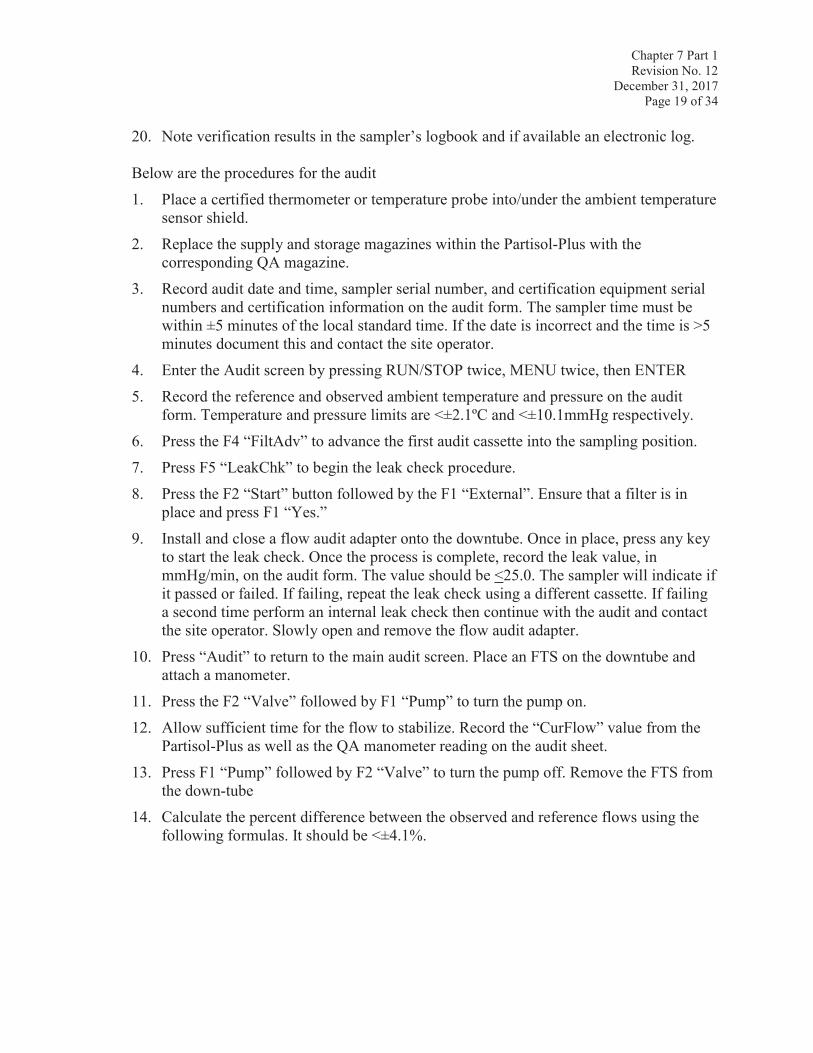
20. Note verification results in the sampler’s logbook and if available an electronic log.
Below are the procedures for the audit
1. Place a certified thermometer or temperature probe into/under the ambient temperature sensor shield.
2. Replace the supply and storage magazines within the Partisol-Plus with the corresponding QA magazine.
3. Record audit date and time, sampler serial number, and certification equipment serial numbers and certification information on the audit form. The sampler time must bewithin ±5 minutes of the local standard time. If the date is incorrect and the time is >5 minutes document this and contact the site operator.
4. Enter the Audit screen by pressing RUN/STOP twice, MENU twice, then ENTER
5. Record the reference and observed ambient temperature and pressure on the audit form. Temperature and pressure limits are <±2.1ºC and <±10.1mmHg respectively.
6. Press the F4 “FiltAdv” to advance the first audit cassette into the sampling position.
7. Press F5 “LeakChk” to begin the leak check procedure.
8. Press the F2 “Start” button followed by the F1 “External”. Ensure that a filter is in place and press F1 “Yes.”
9. Install and close a flow audit adapter onto the downtube. Once in place, press any key to start the leak check. Once the process is complete, record the leak value, in mmHg/min, on the audit form. The value should be <25.0. The sampler will indicate if it passed or failed. If failing, repeat the leak check using a different cassette. If failing a second time perform an internal leak check then continue with the audit and contactthe site operator. Slowly open and remove the flow audit adapter.
10. Press “Audit” to return to the main audit screen. Place an FTS on the downtube and attach a manometer.
11. Press the F2 “Valve” followed by F1 “Pump” to turn the pump on.
12. Allow sufficient time for the flow to stabilize. Record the “CurFlow” value from the Partisol-Plus as well as the QA manometer reading on the audit sheet.
13. Press F1 “Pump” followed by F2 “Valve” to turn the pump off. Remove the FTS from the down-tube
14. Calculate the percent difference between the observed and reference flows using the following formulas. It should be <±4.1%.
Chapter 7 Part 1Revision No. 12
December 31, 2017Page 20 of 34
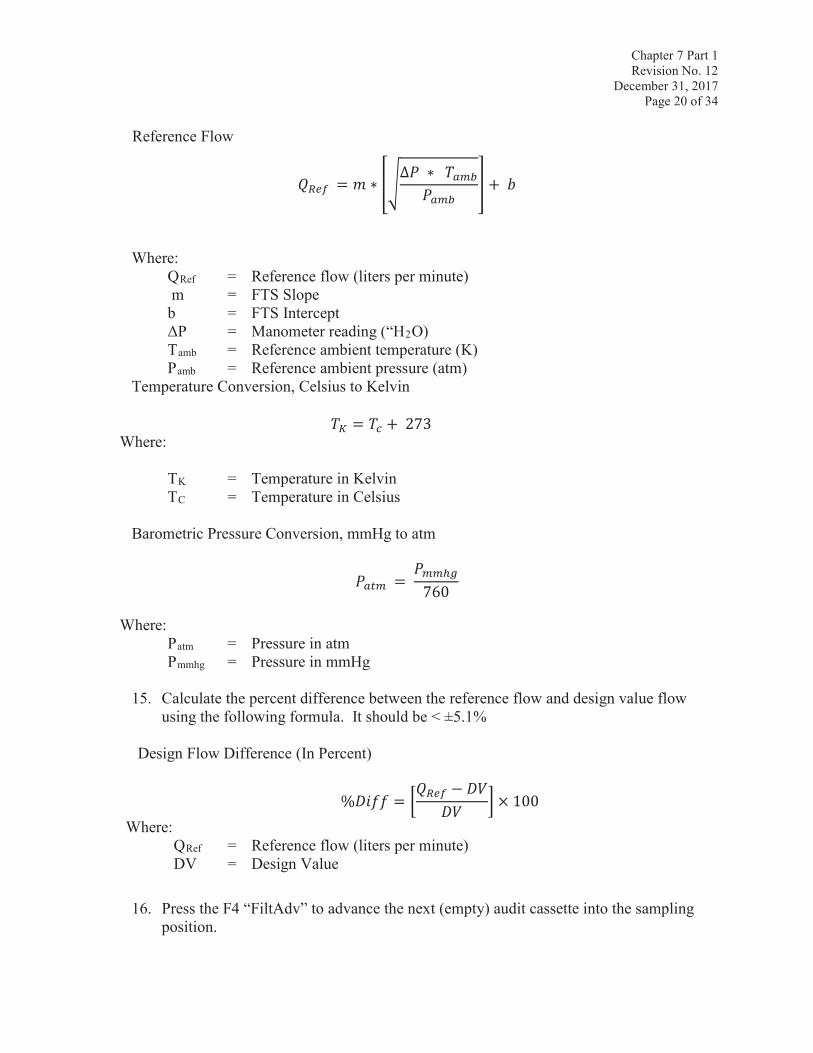
Reference Flow
= + Where:
QRef = Reference flow (liters per minute)m = FTS Slopeb = FTS Intercept
= Manometer reading (“H2O)Tamb = Reference ambient temperature (K)Pamb = Reference ambient pressure (atm)
Temperature Conversion, Celsius to Kelvin= + 273 Where:
TK = Temperature in KelvinTC = Temperature in Celsius
Barometric Pressure Conversion, mmHg to atm
= 760Where:
Patm = Pressure in atmPmmhg = Pressure in mmHg
15. Calculate the percent difference between the reference flow and design value flow using the following formula. It should be < ±5.1%
Design Flow Difference (In Percent)
% = × 100Where:
QRef = Reference flow (liters per minute)DV = Design Value
16. Press the F4 “FiltAdv” to advance the next (empty) audit cassette into the sampling position.

Chapter 7 Part 1Revision No. 12
December 31, 2017Page 21 of 34
17. Open the top of the sampler by releasing the two latches located on the upper right side and remove the VSCC (PM2.5) or Through Adapter Tube (PM10). Place a thermometer/temperature probe into the sample cartridge space.
18. Record the filter reference and observed temperatures. The temperature limit is<±2.1ºC. Replace the VSCC (PM2.5) or Through Bypass Tube (PM10) and close the top of the sampler.
19. Press the F4 “FiltAdv” to advance the next audit cassette into the sampling position.
20. Press F5 “LeakChk” to begin the leak check procedure.
21. Press the F2 “Start” button followed by the F1 “External”. Ensure that a filter is in place and press F1 “Yes.”
22. Install and close a flow audit adapter onto the downtube. Once in place, press any key to start the leak check. Once the process is complete, record the leak value, in mmHg/min, on the audit form. The value should be <25. The sampler will indicate if it passed or failed. If failing, repeat the leak check using a different cassette. Contact the site operator if it fails. Slowly open and remove the flow audit adapter.
23. Replace the inlet on top of the down-tube. Remove the QA audit cassettes and replace the supply/storage magazines. Press RUN/STOP to return the sampler to the mode (OK/WAIT or OK/SAMP) that it was in prior to the audit.
24. Note audit results in the sampler’s logbook and if available an electronic log.
6.2 Verification and Audit Data Reporting
Verification and audit results should be reported to appropriate personnel as soon as possible after completion. A paper copy may be forwarded to the operator or personnel may view the results in the database. If the audit produces poor results (>±4.1 percent flow difference, >±2.1ºC ambient or filter temperature difference, >±10.1 mmHg ambient pressure difference, as left leak check >25.0 mmHg), the auditor should promptly inform the operator verbally and in written form (memo or e-mail).
6.3 Audit Frequency
The USEPA requires that SLAMS monitoring networks audit at least 25 percent of the samplers each quarter thereby auditing each sampler in the network once per year.
The Indiana Department of Environmental Management conducts audits of all PM2.5 and PM10samplers in its monitoring network at least once each quarter to ensure minimal data loss.
6.4 Systems Audits
System audits are an on-site inspection and review of the total monitoring process from initial filter preparation and sampling to final analysis and data reporting. System reviews are generally
Chapter 7 Part 1Revision No. 12
December 31, 2017Page 22 of 34
done at the initial setup of a network then on an annual or on an as needed basis. The specific guidelines and procedures for this type of audit are found in Chapter 15 of this manual, System Audit Criteria and Procedures for Evaluating Ambient Air Monitoring Networks.
7.0 Precision and Accuracy Assessment
7.1 Precision
Precision is the measure of mutual agreement among individual measurements of the same property, usually under prescribed similar conditions. Precision is estimated by the use of a duplicate or collocated sampler at a selected monitoring location in a measurement network. One sampler is designated as the reporting sampler and one sampler is designated as the collocated sampler. The collocated sampler must be maintained, operated, calibrated, and audited in the same manner as the reporting sampler. Precision is calculated from the difference in the concentrations from the reporting and collocated samplers over a calendar quarter. All collocated samplers operate on a 1 in 6 day (1/6) frequency. This allows for approximately 15 data pairs (reporting & collocated concentrations) over each quarter for each site with collocated samplers. Estimates of network precision are made from three years of data.
Data is reported to the USEPA AQS database for both the reporting and collocated sampler, regardless of concentration. However, CV is calculated only from data pairs (reporting and collocated concentrations) when both values are greater than 3 micrograms per cubic meter
3).
7.2 Collocated Sampler Requirements
The duplicated sampler’s inlet must be within 1 to 4 meters from the inlet of the reporting sampler’s inlet and must be at least 2 meters from the inlet of any other sampler inlets such as high volume (TSP or older style PM10) samples. Five IDEM PM2.5 and two PM10 sites have collocated samplers. These numbers meet the Federal Register/USEPA requirement.
Two types of precision estimates are used in the program.
1. Collocated monitoring
2. Filter duplicates
The following formulas are used to calculate precision from reporting and collocated data pairs. These formulas are also stated in 40 CFR Part 50, Appendix L and 40 CFR Part 58 Appendix A.
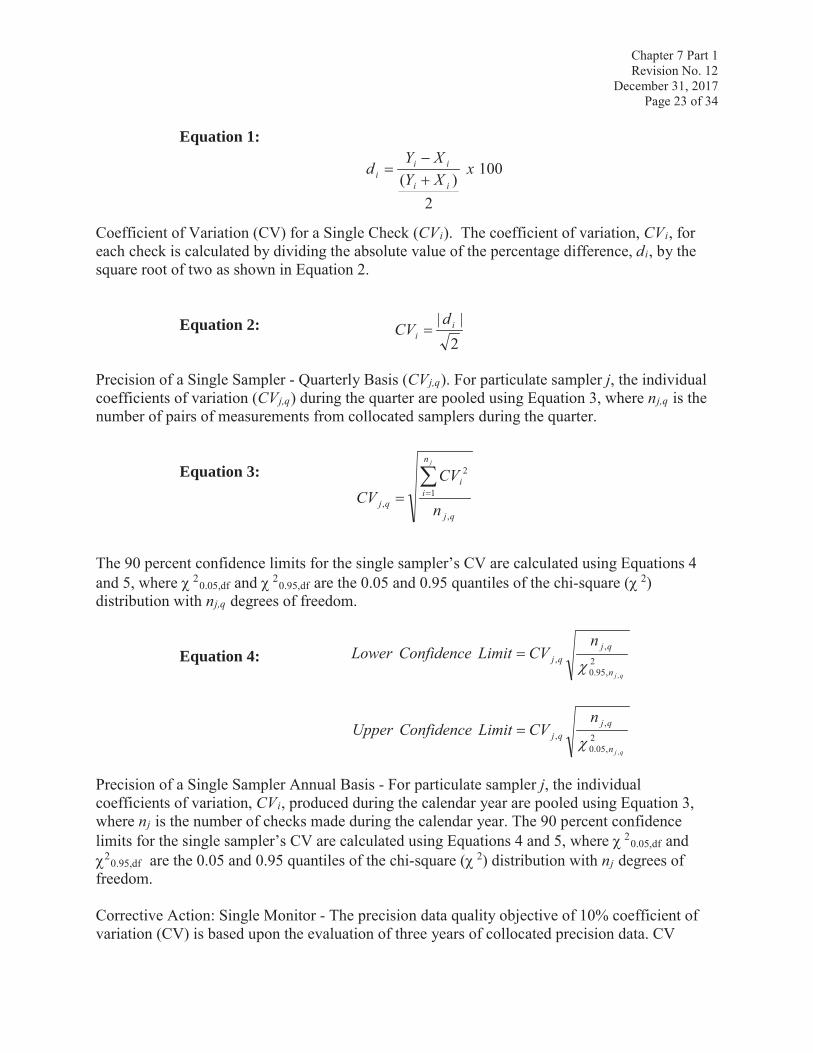
Percent Difference for a Single Check (di). The percentage difference, di, for each check is calculated by using Equation 1, where Xi represents the concentration produced from the primary sampler and Yi represents the concentration reported for the duplicate sampler.
Chapter 7 Part 1Revision No. 12
December 31, 2017Page 23 of 34
Equation 1:
Coefficient of Variation (CV) for a Single Check (CVi). The coefficient of variation, CVi, for each check is calculated by dividing the absolute value of the percentage difference, di, by the square root of two as shown in Equation 2.
Equation 2:
Precision of a Single Sampler - Quarterly Basis (CVj,q). For particulate sampler j, the individual coefficients of variation (CVj,q) during the quarter are pooled using Equation 3, where nj,q is thenumber of pairs of measurements from collocated samplers during the quarter.
Equation 3:
The 90 percent confidence limits for the single sampler’s CV are calculated using Equations 4 and 5, where 2
0.05,df and 20.95,df are the 0.05 and 0.95 quantiles of the chi-square ( 2)
distribution with nj,q degrees of freedom.
Equation 4:
Precision of a Single Sampler Annual Basis - For particulate sampler j, the individual coefficients of variation, CVi, produced during the calendar year are pooled using Equation 3, where nj is the number of checks made during the calendar year. The 90 percent confidence limits for the single sampler’s CV are calculated using Equations 4 and 5, where 2
0.05,df and 2
0.95,df are the 0.05 and 0.95 quantiles of the chi-square ( 2) distribution with nj degrees of freedom.
Corrective Action: Single Monitor - The precision data quality objective of 10% coefficient of variation (CV) is based upon the evaluation of three years of collocated precision data. CV
100
2)(
xXYXY
dii
iii
2|| i
id
CV
qj
n
ii
qj n
CVCV
j
,
1
2
,
2,95.0
,,
,qjn
qjqj
nCVLimitConfidenceLower
2,05.0
,,
,qjn
qjqj
nCVLimitConfidenceUpper
Chapter 7 Part 1Revision No. 12
December 31, 2017Page 24 of 34
values of greater than 10% may occur within that three year period. Single collocated pairs with values greater than 10% are flagged (FCS) and filters are re-weighed. If the CV remains between 10-20% the field technician is alerted to the problem and other operation solutions are investigated. If the CV is greater than 20% for both the initial and reweigh, all the primary sampler data is invalidated from the last precision check and corrective action is initiated. Paired CVs and percent differences are control charted to determine trends (Section 14.2).
Corrective Action: Quarter - Corrective action is usually initiated and imprecision rectified before a calendar quarter of data fails to meet the 10% CV limit. However, in the case where a quarter’s CV is greater than 20% data for that monitor for that quarter is invalid. The USEPA Regional Office is alerted of the issue and may be asked to help find a common solution.
Duplicate Laboratory Measurements - During laboratory pre-weighing and post-weighing sessions, a filter from a batch is selected for a second weighing. The acceptable limit for the difference between the first post-weight and the second post-weight is 15 μg for clean filters and 30 μg for exposed filters. Failure may be due to transcription errors, microbalance malfunction, or the samples have not reached equilibrium. Other QC checks (balance standards and lab blanks) will eliminate microbalance malfunction. If the duplicate does not meet the criterion, a second sample is selected and re-weighed as a second duplicate check. If this second check fails the acceptance criterion and the possibility of balance malfunction and transcription errors have been eliminated, all samples in the batch are equilibrated for an additional 24 hours and re-weighed. Corrective actions continue until duplicate weights for the batch meet acceptance criteria.
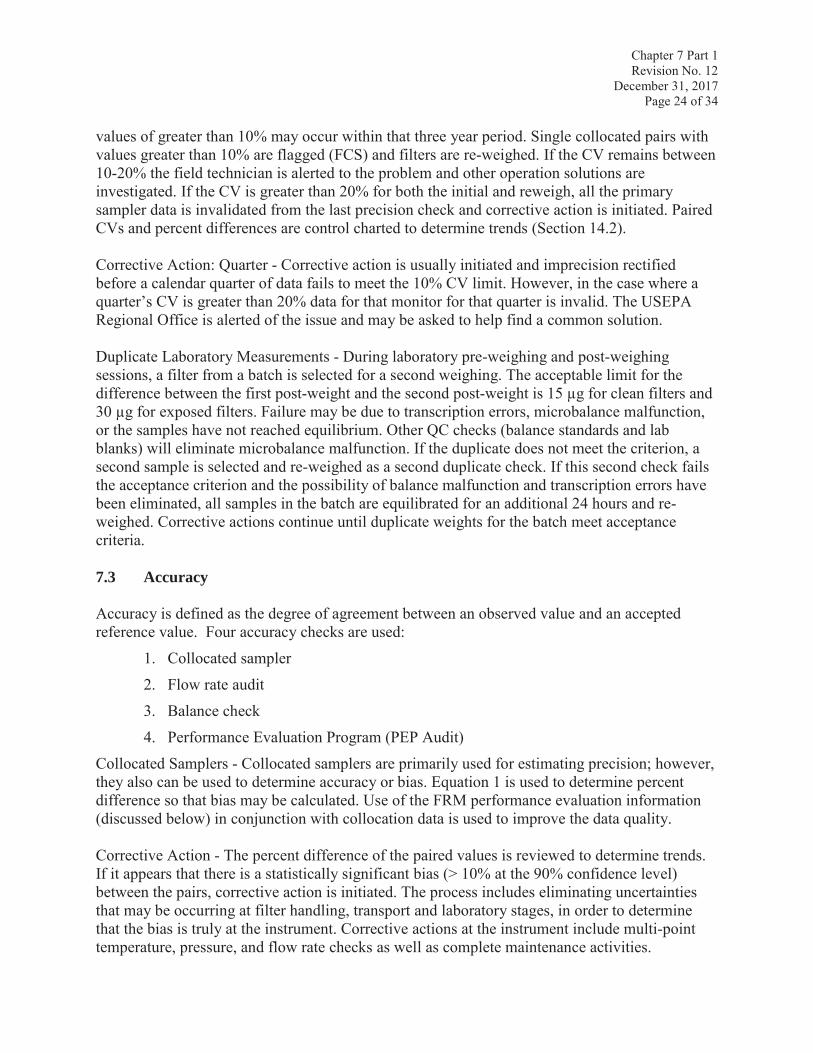
7.3 Accuracy
Accuracy is defined as the degree of agreement between an observed value and an accepted reference value. Four accuracy checks are used:
1. Collocated sampler
2. Flow rate audit
3. Balance check
4. Performance Evaluation Program (PEP Audit)
Collocated Samplers - Collocated samplers are primarily used for estimating precision; however, they also can be used to determine accuracy or bias. Equation 1 is used to determine percent difference so that bias may be calculated. Use of the FRM performance evaluation information (discussed below) in conjunction with collocation data is used to improve the data quality.
Corrective Action - The percent difference of the paired values is reviewed to determine trends. If it appears that there is a statistically significant bias (> 10% at the 90% confidence level) between the pairs, corrective action is initiated. The process includes eliminating uncertainties that may be occurring at filter handling, transport and laboratory stages, in order to determine that the bias is truly at the instrument. Corrective actions at the instrument include multi-point temperature, pressure, and flow rate checks as well as complete maintenance activities.
Chapter 7 Part 1Revision No. 12
December 31, 2017Page 25 of 34
Additional corrective action includes a request for vendor repairs or a request to Region 5 for a FRM performance evaluation.
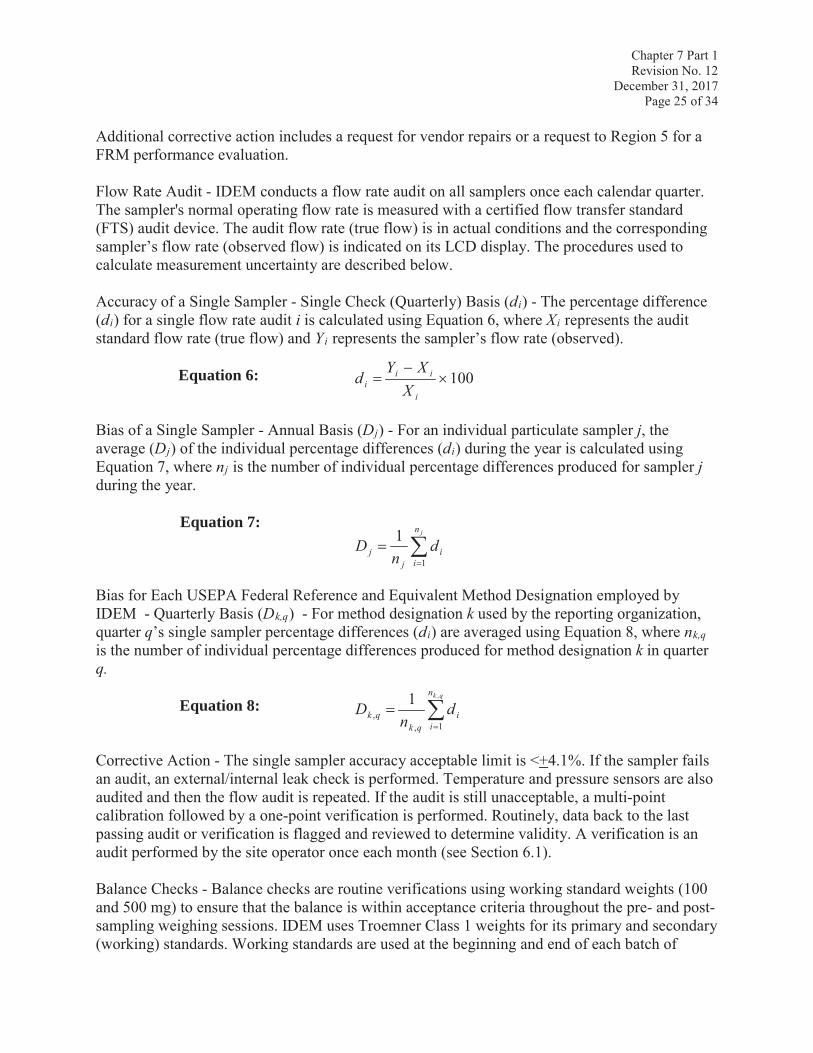
Flow Rate Audit - IDEM conducts a flow rate audit on all samplers once each calendar quarter. The sampler's normal operating flow rate is measured with a certified flow transfer standard (FTS) audit device. The audit flow rate (true flow) is in actual conditions and the corresponding sampler’s flow rate (observed flow) is indicated on its LCD display. The procedures used to calculate measurement uncertainty are described below.
Accuracy of a Single Sampler - Single Check (Quarterly) Basis (di) - The percentage difference (di) for a single flow rate audit i is calculated using Equation 6, where Xi represents the audit standard flow rate (true flow) and Yi represents the sampler’s flow rate (observed).
Equation 6:
Bias of a Single Sampler - Annual Basis (Dj) - For an individual particulate sampler j, the average (Dj) of the individual percentage differences (di) during the year is calculated usingEquation 7, where nj is the number of individual percentage differences produced for sampler jduring the year.
Equation 7:
Bias for Each USEPA Federal Reference and Equivalent Method Designation employed by IDEM - Quarterly Basis (Dk,q) - For method designation k used by the reporting organization, quarter q’s single sampler percentage differences (di) are averaged using Equation 8, where nk,qis the number of individual percentage differences produced for method designation k in quarter q.
Equation 8:
Corrective Action - The single sampler accuracy acceptable limit is <+4.1%. If the sampler fails an audit, an external/internal leak check is performed. Temperature and pressure sensors are also audited and then the flow audit is repeated. If the audit is still unacceptable, a multi-point calibration followed by a one-point verification is performed. Routinely, data back to the last passing audit or verification is flagged and reviewed to determine validity. A verification is an audit performed by the site operator once each month (see Section 6.1).
Balance Checks - Balance checks are routine verifications using working standard weights (100 and 500 mg) to ensure that the balance is within acceptance criteria throughout the pre- and post-sampling weighing sessions. IDEM uses Troemner Class 1 weights for its primary and secondary (working) standards. Working standards are used at the beginning and end of each batch of
100i
iii X
XYd
jn
ii
jj d
nD
1
1
qkn
ii
qkqk d
nD
,
1,,
1
Chapter 7 Part 1Revision No. 12
December 31, 2017Page 26 of 34
weighed samples. In addition, one standard is selected for a check comparison after every 10filters.
Balance Check Evaluation - The following formula is used to evaluate the balance checks.
Difference for a single check (dy) - The difference, dy, for each check is calculated using Equation 9, where X represents the certified mass weight and Y represents the reported weight.
Equation 9:
Corrective Action - The difference between the reported weight and the certified weight must g. Since this is the first check before any pre- or post-sampling weighings, if the
acceptance criterion is not met, corrective action is initiated. Corrective action may be as simple as allowing the balance to perform internal calibrations or to sufficiently warm-up, which may require checking the balance weights a number of times. If the acceptance criteria are still not met, the laboratory technician is required to verify the working standards against the primary standards.
Finally, if it is established that the balance does not meet acceptance criteria for both the working and primary standards, and other trouble shooting techniques fail, a Mettler service technician is called to perform corrective action.
If the balance check fails acceptance criteria during a run, the 10 filters weighed prior to the failure are re-weighed. If the balance check continues to fail, troubleshooting procedures are initiated. The values of the 10 sample filters weighed prior to the failure are recorded but will remain with the un-weighed samples in the batch to be re-weighed when the balance meets the acceptance criteria.
Performance Evaluation Program (PEP) - The Federal Reference Method (FRM) Performance Evaluation Program is a national quality assurance activity that is used to evaluate measurement system bias of all monitoring networks. The strategy is to collocate a portable FRM PEP sampling instrument with an established air monitoring site, operate both monitors in the same manner, and then compare the concentrations of the PEP sampler with the established network sampler. The USEPA Region V office oversees this program for Indiana’s samplers. They contract with a third party to operate the PEP sampler. The contractor informs IDEM when an evaluation is scheduled, sets up one or more samplers at one or more sites, then collects sample(s) on the normal sampling schedule. PEP sampler filters are sent to a national laboratory in Region 10 for gravimetric analysis. USEPA evaluates this data by using the IDEM concentrations reported to the AQS database and the data from the Region 10 analysis. This performance evaluation is an estimate of the uncertainty of the agency’s measurement system but may also be used to compare different models and brands of samplers. Biases may be attributed to sample handling, transportation and laboratory activities as well as to the instrument.
Corrective Action - USEPA notifies IDEM of the evaluation results. The bias acceptance limit for the data comparison is ±10%. If it appears that there is a bias, corrective action is initiated.
XYd y
Chapter 7 Part 1Revision No. 12
December 31, 2017Page 27 of 34
Corrective actions usually begin with evaluating the data collection procedures and then the laboratory procedures. USEPA Region V may conduct additional PEP audits to provide additional data to troubleshoot the process.
8.0 Maintenance
1. Filter cassettes - Inspect filter cassettes for contamination after every use. Wash and wipe with a clean cloth as required.
2. VSCC - clean or change the VSCC after every 30 days or generally once a month. It is the policy of the Indiana Department of Environmental Management to perform maintenance in a separate controlled environment (laboratory, field office etc.) whenever possible. Refer to the Air Monitoring Very Sharp Cut Cyclone Cleaning,
3. S-028-OAQ-M-AM-13-T-R1, SOP for detailed instructions on impactor maintenance.
4. Internal Leak Check - Perform an internal leak check according to the Ambient SOP after every three sampling episodes or as indicated by sampler diagnostics.
5. External Leak Check - Perform an external leak check according to the Ambient SOP(2025 Sequential Air Sampler External Leak Check S-014-OAQ-M-AM-14-T-R1) after every five sampling episodes or as indicated by sampler diagnostics.
6. 1st Stage Inlet - Monthly, disassemble the Partisol-Plus Air Sampler sample inlet and clean with a soft brush or cloth.
7. In-line Filter - Annually replace the in-line filter according to the Partisol-Plus Air Sampler operating manual or IDEM SOPs.
8. V Seals - Check V seals once each year and replace if necessary.
9. Air Screens - Clean the samplers air screen (located under the sampler rain hoods) monthly.
10. Battery Voltage - Check the voltage of the batteries on the main computer board in the electronics compartment annually.
Chapter 7 Part 1Revision No. 12
December 31, 2017Page 28 of 34
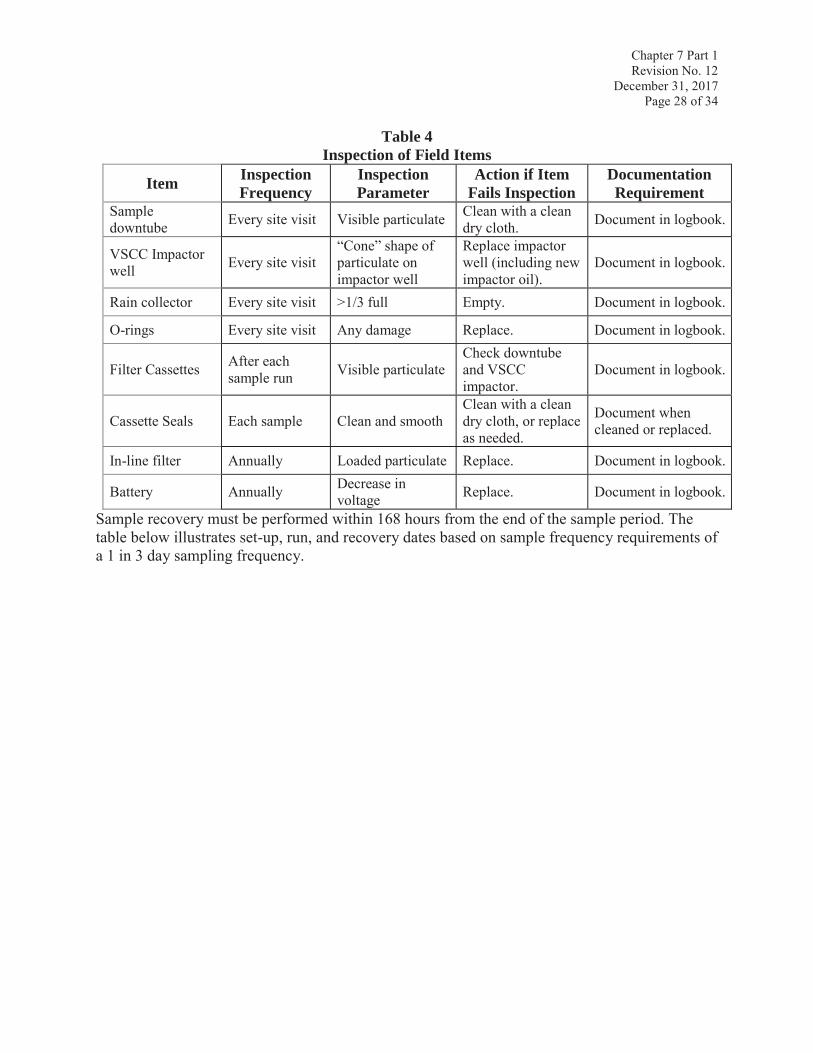
Table 4Inspection of Field Items
Item Inspection Frequency
Inspection Parameter
Action if Item Fails Inspection
DocumentationRequirement
Sample downtube Every site visit Visible particulate Clean with a clean
dry cloth. Document in logbook.
VSCC Impactor well Every site visit
“Cone” shape of particulate on impactor well
Replace impactor well (including new impactor oil).
Document in logbook.
Rain collector Every site visit >1/3 full Empty. Document in logbook.
O-rings Every site visit Any damage Replace. Document in logbook.
Filter Cassettes After each sample run Visible particulate
Check downtube and VSCC impactor.
Document in logbook.
Cassette Seals Each sample Clean and smoothClean with a clean dry cloth, or replace as needed.
Document whencleaned or replaced.
In-line filter Annually Loaded particulate Replace. Document in logbook.
Battery Annually Decrease in voltage Replace. Document in logbook.
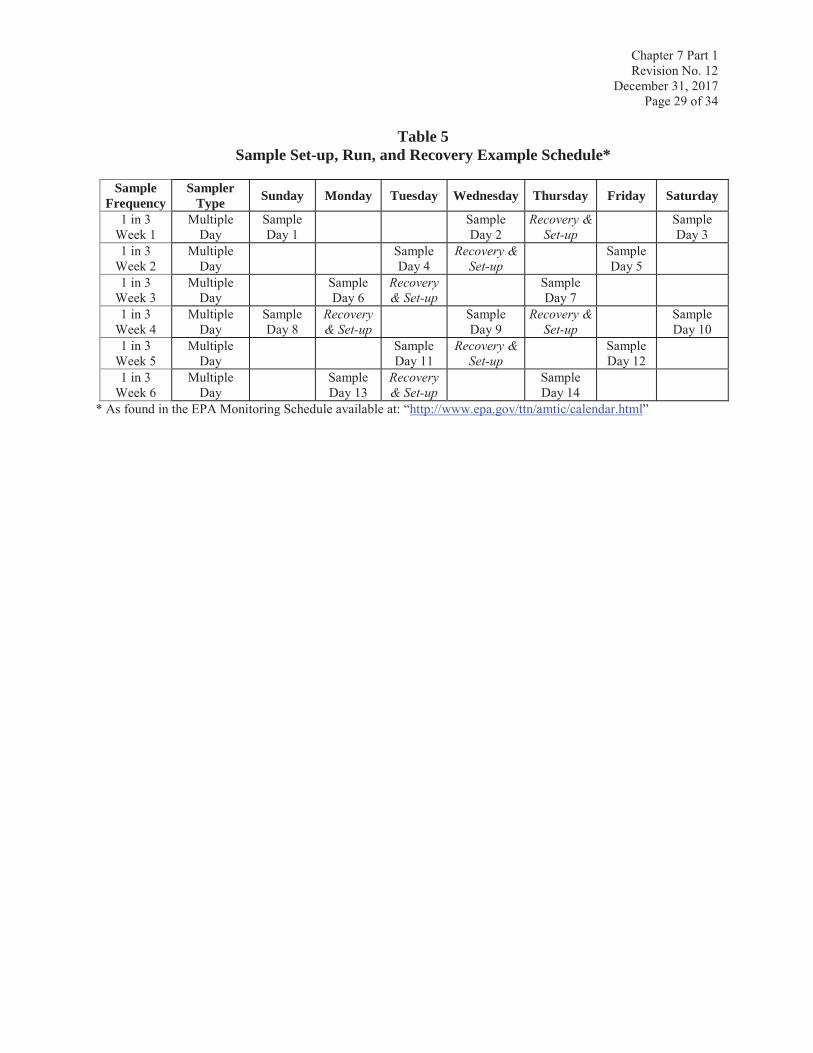
Sample recovery must be performed within 168 hours from the end of the sample period. The table below illustrates set-up, run, and recovery dates based on sample frequency requirements of a 1 in 3 day sampling frequency.
Chapter 7 Part 1Revision No. 12
December 31, 2017Page 29 of 34
Table 5Sample Set-up, Run, and Recovery Example Schedule*
SampleFrequency
SamplerType Sunday Monday Tuesday Wednesday Thursday Friday Saturday
1 in 3Week 1
Multiple Day
SampleDay 1
SampleDay 2
Recovery & Set-up
SampleDay 3
1 in 3Week 2
Multiple Day
SampleDay 4
Recovery & Set-up
SampleDay 5
1 in 3Week 3
Multiple Day
SampleDay 6
Recovery & Set-up
SampleDay 7
1 in 3Week 4
Multiple Day
SampleDay 8
Recovery & Set-up
SampleDay 9
Recovery & Set-up
SampleDay 10
1 in 3Week 5
Multiple Day
SampleDay 11
Recovery & Set-up
SampleDay 12
1 in 3Week 6
Multiple Day
SampleDay 13
Recovery & Set-up
SampleDay 14
* As found in the EPA Monitoring Schedule available at: “http://www.epa.gov/ttn/amtic/calendar.html”
Chapter 7 Part 1Revision No. 12
December 31, 2017Page 30 of 34
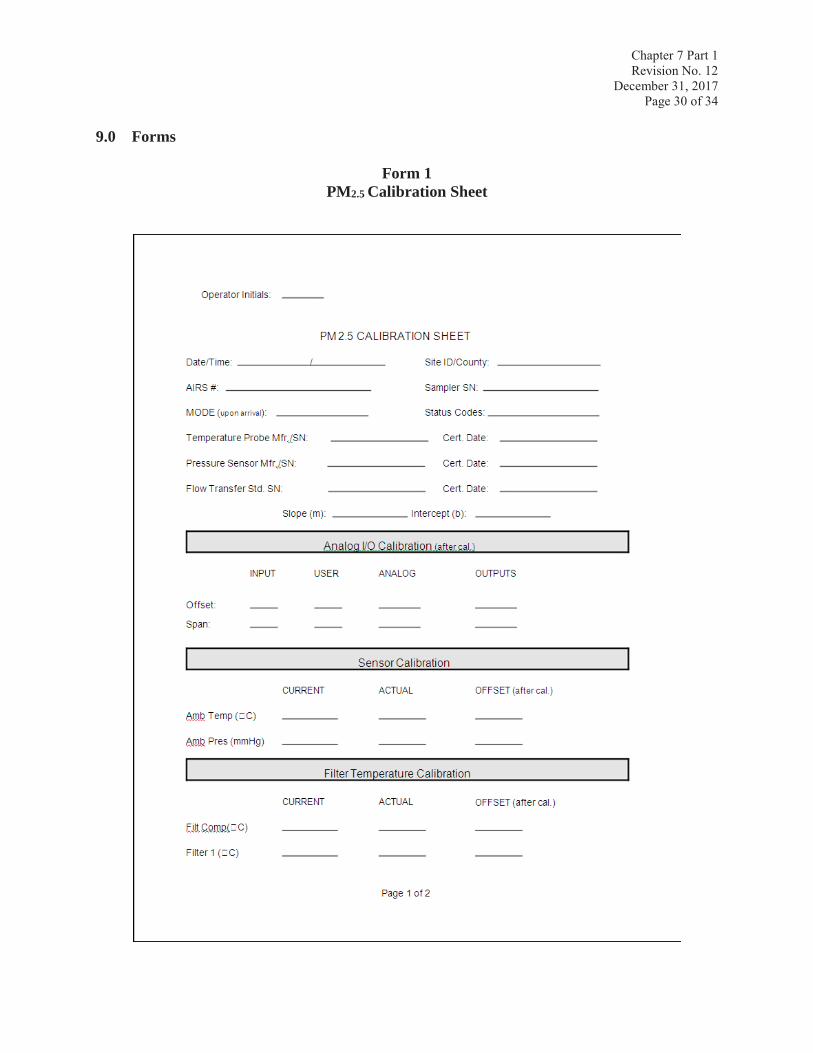
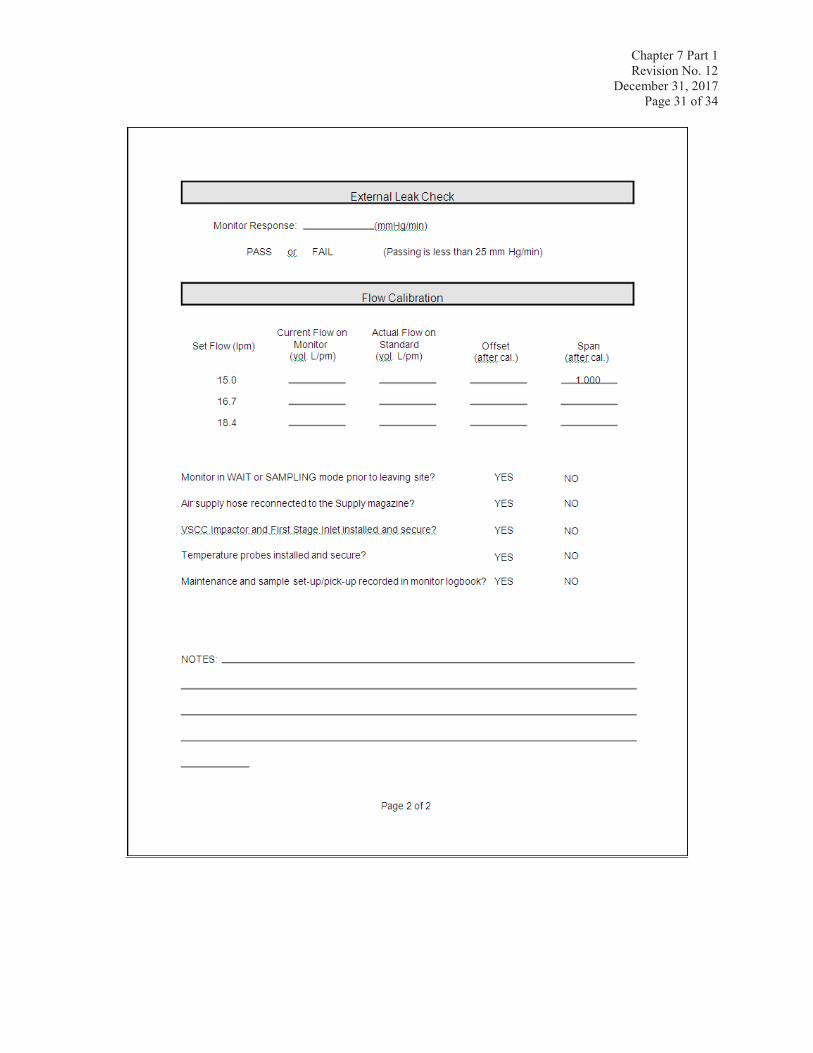
9.0 Forms
Form 1PM2.5 Calibration Sheet
Chapter 7 Part 1Revision No. 12
December 31, 2017Page 31 of 34
Chapter 7 Part 1Revision No. 12
December 31, 2017Page 32 of 34
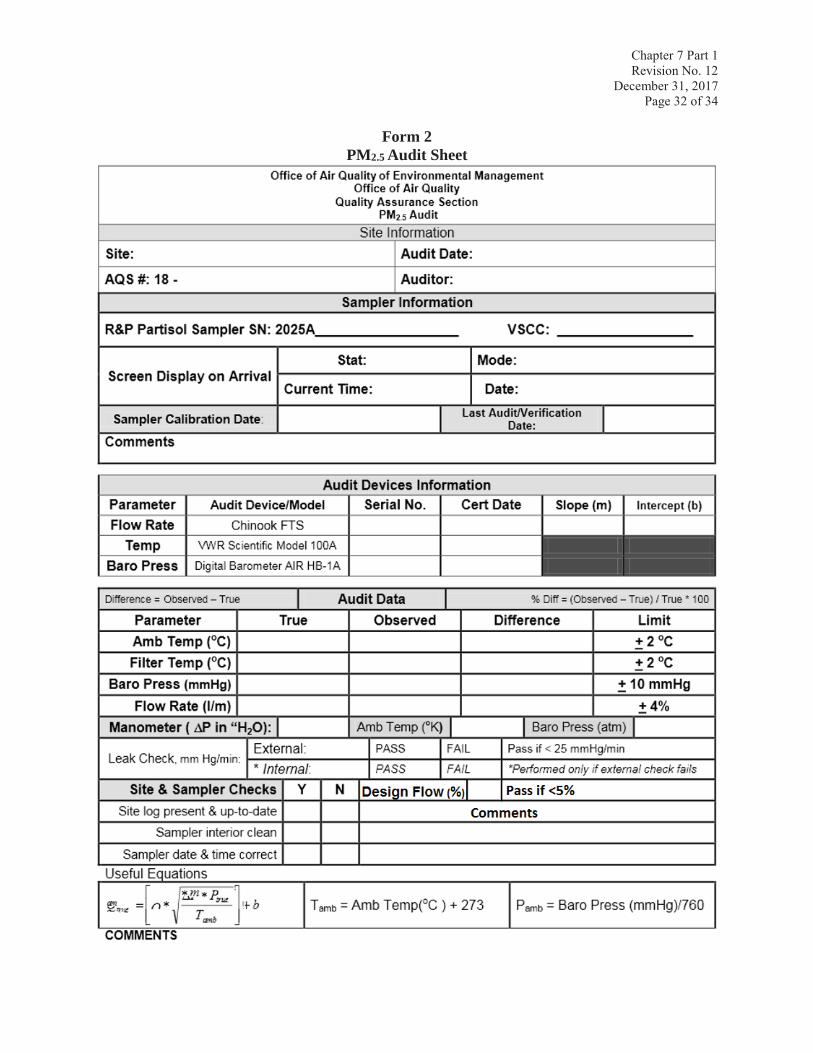
Form 2PM2.5 Audit Sheet
Chapter 7 Part 1Revision No. 12
December 31, 2017Page 33 of 34
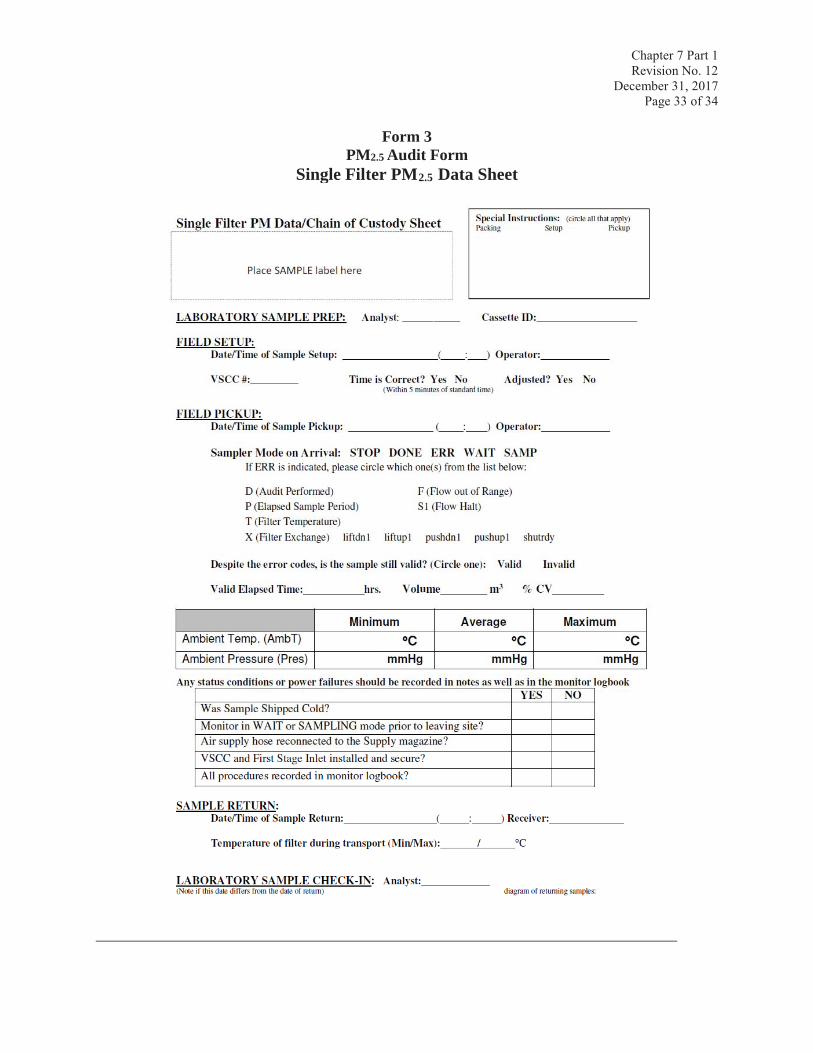
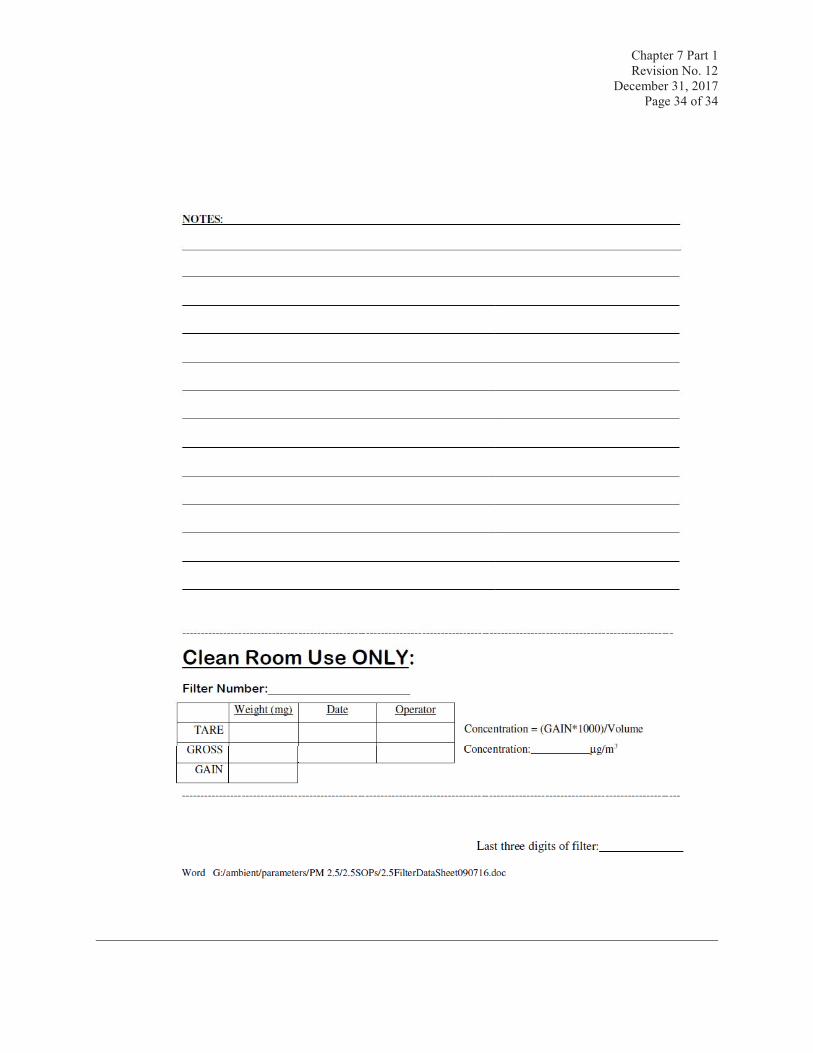
Form 3PM2.5 Audit Form
Single Filter PM2.5 Data Sheet
Chapter 7 Part 1Revision No. 12
December 31, 2017Page 34 of 34