![Supporting Online Material forscience.sciencemag.org/highwire/filestream/590781/field_highwire...Verde [Guanacaste] Biological Stations, 2006; Corcovado National Park [Puntarenas],](https://static.fdocuments.in/doc/165x107/5e215cb3bf01800aa4125a36/supporting-online-material-guanacaste-biological-stations-2006-corcovado-national.jpg)
Supporting Online Material for -...
21
www.sciencemag.org/cgi/content/full/334/6052/72/DC1 Supporting Online Material for Dispersible Exfoliated Zeolite Nanosheets and Their Application as a Selective Membrane Kumar Varoon, Xueyi Zhang, Bahman Elyassi, Damien D. Brewer, Melissa Gettel, Sandeep Kumar, J. Alex Lee, Sudeep Maheshwari, Anudha Mittal, Chun-Yi Sung, Matteo Cococcioni, Lorraine F. Francis, Alon V. McCormick, K. Andre Mkhoyan, Michael Tsapatsis* *To whom correspondence should be addressed. E-mail: [email protected] Published 7 October 2011, Science 334, 72 (2011) DOI: 10.1126/science.1208891 This PDF file includes: Materials and Methods SOM Text Figs. S1 to S12 References (35–44)
Transcript of Supporting Online Material for -...

www.sciencemag.org/cgi/content/full/334/6052/72/DC1
Supporting Online Material for
Dispersible Exfoliated Zeolite Nanosheets and Their Application as a Selective Membrane
Kumar Varoon, Xueyi Zhang, Bahman Elyassi, Damien D. Brewer, Melissa Gettel, Sandeep Kumar, J. Alex Lee, Sudeep Maheshwari, Anudha Mittal, Chun-Yi Sung, Matteo
Cococcioni, Lorraine F. Francis, Alon V. McCormick, K. Andre Mkhoyan, Michael Tsapatsis*
*To whom correspondence should be addressed. E-mail: [email protected]
Published 7 October 2011, Science 334, 72 (2011)
DOI: 10.1126/science.1208891
This PDF file includes:
Materials and Methods SOM Text Figs. S1 to S12 References (35–44)
2
Materials and Methods
Synthesis of ITQ-1
ITQ-1 was synthesized following the protocols reported by Camblor et al. (35) using
N,N,N-trimethyl-1-adamantammonium hydroxide (TMAdaOH). TMAdaOH was
obtained by alkylation of 1-adamantylamine (Aldrich) with excess of methyl iodide
(Aldrich) at room temperature followed by ion exchange of the iodide salt. For the
synthesis of ITQ-1, fumed silica (Cab-O-Sil M5, Cabot Corp.) was mixed with
TMAdaOH, hexamethyleneimine (HMI) (Aldrich), NaCl (Aldrich) and distilled water to
obtain a gel composition of SiO2 : 0.25 TMAdaOH : 0.31 HMI : 0.20 NaCl : 44 H2O.
After stirring for 5 hours at room temperature, the resultant gel was transferred to a
rotating Teflon-lined steel autoclave at 150 ⁰C. Crystallization was stopped after 5 days
and the product was obtained by centrifugation. The cake was washed with distilled water
to reduce the pH to 9 and dried in a vacuum oven at 130 ⁰C.
Swelling of ITQ-1
ITQ-1 was swollen with cetyltrimethylammonium bromide (CTAB) at room
temperature using the swelling protocol of MCM-22(P) as reported by Maheshwari et al.
(18). Typically, 1.8 g of ITQ-1 powder was mixed with 35.0 g of an aqueous solution of
29 wt% CTAB (Sigma-Aldrich) and 11.0 g of an aqueous solution of
tetrapropylammonium hydroxide (TPAOH) (40% (w/w), Alfa Aesar). The mixture was
stirred at room temperature for 16 hours, after which the swollen ITQ-1 was recovered by
centrifugation. Excess CTAB and TPAOH were removed by washing the obtained cake
with 9 liters of water. The resultant cake was dried in a vacuum oven at 130 ⁰C.
Synthesis of multilamellar silicalite-1
Multilamellar silicalite-1 was synthesized using the diquaternary ammonium
surfactant [C22H45-N+(CH3)2-C6H12-N
+(CH3)2-C6H13](OH)2 or C22-6-6(OH)2 as reported
by Choi et al. (3). C22-6-6Br2 was synthesized by alkylation of N,N,N’,N’-tetramethyl-1,6-
hexanediamine with 1-bromodocosane at 70 ⁰C followed by alkylation of the resultant
product by 1-bromohexane at 85 ⁰C. C22-6-6(OH)2 was obtained by ion exchange of the
bromide salt. For the synthesis of multilamellar silicalite-1, tetraethyl orthosilicate
(TEOS) (Aldrich) was hydrolyzed in the presence of C22-6-6(OH)2 and distilled water to
obtain a gel composition of 100 SiO2 : 15 C22-6-6(OH)2: 4000 H2O: 400 EtOH. After
hydrolysis for 24 hours at room temperature, the resultant gel was transferred to a
rotating Teflon-lined steel autoclave at 150 ⁰C. Crystallization was stopped after 5 days
and the product was obtained by centrifugation. The cake was washed with distilled water
to reduce the pH to 9 and dried in a vacuum oven at 130 ⁰C.
Exfoliation of CTAB swollen ITQ-1 and multilamellar silicalite-1 to obtain MWW- and
MFI-nanosheet nanocomposite, respectively
Both layered zeolites were exfoliated by melt compounding to obtain polymer-
zeolite nanocomposite as reported by Maheshwari (19). In a typical exfoliation process,
3.84 g of polystyrene (Mw = 45000 g/mol) and 0.16 g of the dried zeolite (CTAB swollen
ITQ-1 or multilamellar silicalite-1) were manually mixed and loaded in a vertical, co-
rotating twin screw extruder with a recirculation channel (DACA mini compounder). The

3
mixture was blended sequentially at 120 ⁰C for 20 min, 170 ⁰C for 25 min, 150 ⁰C for 30
min and 200 ⁰C for 20 min under a nitrogen environment and at a screw speed of 300
rpm. The MWW- and MFI-nanosheet nanocomposites were then extruded out at 150 ⁰C.
Preparation of coating suspensions of MWW- and MFI-nanosheets
Coating suspensions were created by dissolution of the exfoliated zeolite-polymer
nanocomposite in toluene followed by dispersion and purification. Typically, 0.10 g of
the nanocomposite was dissolved in 8.00 g toluene to make a suspension containing
1.25% polymer (w/w) and 0.05% zeolite (w/w). The suspension was sonicated for 1 hour
in a Branson 5510R-DTH ultrasonic cleaner at room temperature to disperse the
exfoliated zeolite nanosheets in toluene. The resultant dispersions for MFI- and MWW-
nanosheets were centrifuged (12000 and 13250 relative centrifugal force (RCF) for 10
and 15 min, respectively) to settle down the larger un-exfoliated particles. The solution
containing the exfoliated nanosheets was then pipetted out from the centrifuge tube and
used as coating suspension.
Coating of nanosheets on Anopore and α-alumina disk
The anodized alumina membrane (Anopore, pore size 200 nm, diameter 13 mm,
PCG Scientifics) was coated by 1.5 g of the coating suspension by vacuum filtration
using a Millipore Swinnex filter holder (13 mm). Similarly, homemade α-alumina disks
(36) were coated by 4.00 g of MWW-nanosheet suspension or 3.00 g of MFI-nanosheet
suspensions. The coated nanosheets of MFI on the Anopore and the α-alumina disks were
calcined at 540 ⁰C for 6 hours and MWW coating was calcined at 580 ⁰C for 4 hours to
remove residual polymer and structure-directing agents.
Secondary growth of films on the α-alumina disk
The MFI-nanosheet coating on the α-alumina disk was hydrothermally grown to
reduce inter-particle gaps. In a typical secondary growth, TEOS (Aldrich) was
hydrolyzed for 4 hours at room temperature in the presence of TPAOH (1.0 M, Aldrich)
and distilled water to obtain a synthesis sol with a composition of 60 SiO2 : 9 TPAOH :
8100 H2O : 240 EtOH. The synthesis sol was aged at 90 ⁰C for 6 hours in a Teflon-lined
autoclave. Then, the MFI-nanosheet coating was placed vertically in this aged sol, and
heated at 90 ⁰C for 4.5 hours in a Teflon-lined autoclave. The membrane was then
calcined at 480 ⁰C for 4 hours with temperature ramp rate of 0.5⁰C/minute to remove the
TPAOH from the framework.
MWW-nanosheet coating was also secondary grown to fill the inter-particle gaps.
Typically, a mixture of 0.28 g fumed silica (Cab-O-Sil M5, Cabot Corp.), 9.82 g of
TMAdaOH (0.38 molar), 10.20 g distilled water, 0.17 g NaCl (Aldrich) and 0.46 g HMI
(Aldrich) was stirred overnight at room temperature. Alumina disks coated with MWW
nanosheets were placed (coated side faced-down) in the mixture and autoclaved at 150 ⁰C
for 21 h. The membrane was then dried overnight at room temperature and calcined at
540 ⁰C for 4 hours.
Characterization
A FEI Tecnai T12 transmission electron microscope (TEM) operated at 120 kV and
a FEI Tecnai G2 F30 TEM operated at 300 kV were used for TEM studies. All images

4
were recorded using CCD cameras. 50 nm thin sections of the nanocomposites were
prepared by a Leica EM UC6 Ultramicrotome equipped with a diamond knife. The
sections were then mounted on a TEM grid (400 mesh Cu, PELCO). For examining
morphology of the nanosheets and high-resolution TEM, a drop of nanosheets suspension
in toluene was deposited on a TEM grid (ultrathin carbon film on holey carbon support
film, 400 mesh Cu, Ted Pella) and was air-dried.
For AFM, muscovite mica was etched in 50% HF for 4 hours to generate the 2.0 and
1.0 nm steps (20), which were used as a standard in determining the nanosheet thickness.
Nanosheet specimens for AFM were prepared by placing a drop of their suspension on
freshly cleaved muscovite mica followed by calcination in air at 540⁰C for 6 hours. A
Molecular Imaging PicoPlus scanning probe microscope (since renamed Agilent 5500
AFM/SPM system) was used for imaging. AFM tips were used as obtained from
AppNano (Fort-10, Si, N type, uncoated). AFM was done in tapping mode in the
repulsive regime. The image analysis was performed with the Gwiddion 2.22 software.
X-ray diffraction (XRD) patterns were collected using a Bruker-AXS (Siemens)
D5005 diffractometer using CuKα radiation. Small angle XRD measurements were done
on a homemade pinhole diffractometer using CuKα radition. Scanning electron
microscopy (SEM) was done using a Hitachi S-900 instrument after the samples were
coated with 3 nm of platinum. Cross section of the supported films for SEM and TEM
were prepared using a focused ion beam (FIB) SEM instrument (Quanta 3D DualBeam).
N2 adsorption-desorption isotherms were collected at 77 K on an Autosorb iQ-Chemi
system (Quantachrome Instruments). Micropore volume was extracted by conventional t-
plot method (thickness 3.7-5Å) and BET surface area was calculated in the relative
pressure range of 0.05-0.3. 29
Si MAS NMR spectrum was obtained from a Bruker DSX-
500 solid state NMR spectrometer.
Xylene isomer vapor permeation measurements were made in the Wicke-Kallenbach
mode (stainless steel permeation cell fitted inside a Thermolyne 48000 furnace) using
180 ml/min of Helium carrier containing equimolar feed of p-xylene (0.5 KPa) and o-
xylene (0.5 KPa) (36). The separation factor is defined as the molar ratio of isomers in
the permeate over the molar ratio in the feed.
For single gas permeation measurements, membranes were placed into a custom-
made stainless steel permeation cell and sealed with Silicone O-rings. The cell was then
placed in a temperature controlled oven. The outlet of the permeate side is connected to a
section with a calibrated volume connected to a sensitive pressure transducer. It is
subsequently connected to a vacuum pump. Initially, the permeate side is at vacuum and
the feed side is at 1 atm. Typical feed side flow rates were 250 cc/min. The permeate side
is then isolated from vacuum and the rate of change in pressure was measured with the
pressure transducer connected to a computer. The flow rate through the membrane is
calculated from the recorded change in pressure with time and use of the calibrated
volume. All measurements were taken in the range of 0-20 torr and 1 atm at feed and
permeate sides, respectively. Several runs were made with increasing and decreasing
temperature sequences for each gas to check for stability and consistency.

5
SOM Text
Structure construction and optimization
The zeolite nanosheet structures were optimized using damped-dynamics
simulations by the Car-Parrinello molecular dynamics (CPMD) code in the Quantum
ESPRESSO package (21). All periodic calculations were performed using the Perdew-
Burke-Ernzerhof (PBE) generalized gradient approximation (GGA) (37) of the exchange-
correlation functional. To describe the interaction of valence electrons with ionic cores,
we employed ultrasoft pseudopotentials. The calculation required kinetic energy cutoffs,
of 40 Ry and 320 Ry for wave functions and charge density, respectively. The Brillouin
zone sampling was restricted to the Γ-point.
The definition of MWW unit cell and atomic coordinates used to generate the ITQ-1
nanosheet structure were from Camblor et al. (35) The structure of ITQ-1 nanosheets was
proposed as one unit cell-thick (fig. S6A), as by Corma et al. (38). A thin fragment of the
nanosheet highlighted with purple in fig. S6A was used to represent the part of the
nanosheet that will undergo structural change upon optimization. The dangling bonds on
both exterior and interior sides of the fragment were terminated with hydroxyl groups
(with terminal O-H bond length initially set to 98 pm, and Si-O-H bond angle set to its
corresponding Si-O-Si bond angle in the original unit cell), resulting in 63 atoms in the
cluster. The terminal hydroxyl groups on the interior side were kept fixed, and the other
atoms were allowed to relax. Periodic boundary conditions were applied in three
dimensions: the cluster is bonded with adjacent unit cells perpendicular to c direction, but
is separated with a vacuum layer along the c direction (the thickness of the vacuum layer
is chosen as 21.6 Å, 5 times the thickness of the cluster). In the structural optimization,
the lattice parameters were kept constant, and the convergence criteria for ionic position
optimization were chosen as 10-4
a.u. for total energy, and 10-6
a.u. for electron kinetic
energy.
The definition of MFI unit cell and atomic coordinates are from van Koningsveld et
al. (39). The structure of the silicalite-1 nanosheets was chosen as three (010) pentasil
layers along the b direction (1.5 unit cell thick, as in fig. S6B). For structure optimization,
one (010) pentasil layer at the surface was chosen as a cluster. Similar to MWW cluster,
the dangling bonds on both exterior and interior sides were terminated with hydroxyl
groups with terminal O-H bond lengths and Si-O-H bond angles treated in the same
manner, resulting in a cluster with 168 atoms. The interior terminal hydroxyl groups were
kept fixed, and the other atoms were allowed to relax. Periodic boundary conditions were
applied in three dimensions, where the pentasil layer clusters were separated with a
vacuum layer of thickness 59.6 Å, 5 times the thickness of the cluster. In the structural
optimization, the lattice parameters were kept constant, and the convergence criteria for
ionic position optimization were chosen as 10-4
a.u. for total energy, and 1.5x10⁻⁵
a.u. for
electron kinetic energy.
Alternatively, a structure that is 1 unit cell thick (contains one complete and two
incomplete (010) pentasil layers) was also chosen for comparison (Fig. S6C). The
structure optimization was performed similarly to the 1.5 unit cell thick structure, except
that the incomplete pentasil layer was chosen as the cluster for structure optimization,
which results in a cluster with 108 atoms. Periodic boundary conditions were applied in
three dimensions, where the clusters were separated with a vacuum layer of thickness
29.8 Å, 5 times the thickness of the cluster. In the structural optimization, the lattice

6
parameters were kept constant, and the convergence criteria for ionic position
optimization were chosen as 10-4
a.u. for total energy, and 10-6
a.u. for electron kinetic
energy.
The optimized surface structures were adopted into the initial structures to generate
nanosheets of various thicknesses.
XRD pattern simulation
XRD patterns were simulated using powder power theorem (25) implemented with
UDSKIP (26, 40). In the simulation, MWW nanosheets were modeled as 50 50 n (n =
1, 2, and 3) unit cells with relaxed surface structure, and MFI nanosheets were modeled
as 50 n 50 (n = 1, 1.5, 2.5, and 3.5) unit cells with relaxed surface structure.
Simulations for wide-angle X-ray diffraction were carried out with step size (2) =
0.01° (Cu K1 radiation, = 1.5418 Å).
Simulation of TEM image and electron diffraction pattern
Simulation of electron diffraction (ED) patterns and TEM images was performed
using Multislice method (23, 24, 41) with the code developed by Kirkland (42).
For simulation, an orthorhombic MWW unit cell is reconstructed from the hexagonal
MWW unit cell: ao = 3 ah, bo = ah, co = ch, where ao, bo, and co are the lattice parameters
for the orthorhombic MWW unit cell, and ah and ch are the lattice parameters for the
hexagonal MWW unit cell. The nanosheet size is chosen as 24.6 nm (ao) x 24.2 nm (bo)
with desired thicknesses. A vacuum layer was placed around the crystal to extend the
crystal to a supercell with 34.4 nm x 34.4 nm, and periodic boundary conditions were
applied in two dimensions (perpendicular to beam) to the super cell. A grid of 11700
11700 pixels was used in these simulations. In order to generate the projected atomic
potentials, the crystal was automatically sliced along the c direction to 1 Å slices with
autoslic module provided with the code.
For MFI, the nanosheet size is chosen as a = 10.8 nm and c = 13.4 nm with desired
thicknesses. A vacuum layer was placed around the crystal to extend the crystal to a
supercell with a = c = 18.8 nm, and periodic boundary conditions were applied in two
dimensions (perpendicular to beam). A grid of 6724 6724 pixels was used in these
simulations. In order to generate the projected atomic potentials, the crystal was
automatically sliced along the b direction to 1 Å slices with autoslic module provided
with the code.
Acceleration voltage (300 kV) and spherical aberration coefficient (Cs = 1.2 mm)
were used as microscope parameters for simulation of electron diffraction patterns. The
temperature of the simulation was set to 300 K, where thermal vibration was introduced
in the simulation by randomly displacing the atoms according to their Debye-Waller
factors (43).
The simulated MWW and MFI electron diffraction patterns were convolved with a
normalized Gaussian function with a FWHM of 0.003 Å-1
and 0.01 Å-1
, respectively, as
an approximate approach to account for the convergence of the electron beams at actual
operating conditions.

7
Fig. S1. XRD patterns at small (left) and wide (right) angles from a polystyrene/layered
MFI nanocomposite before (upper trace) and after (lower trace) melt blending. The 1st
and the 3rd order reflections of the layered structure disappear after melt blending
indicating exfoliation, while the higher angle peaks remain unchanged indicating
structure preservation during exfoliation. The absence of the 2nd
order reflection of the
layered structure has been addressed before in reference (44). The broad underlying peaks are due to polystyrene.

8
Fig. S2. TEM images of thinly sectioned (microtomed) nanosheet-polystyrene
nanocomposites prepared by melt compounding. (A) MWW-nanosheets and (B) MFI-
nanosheets in polystyrene matrix. The scale bars indicate 200 nm.

9
Fig. S3. HRTEM images of nanosheets and corresponding fast Fourier transform (FFT).
(A) HRTEM image of an MWW-nanosheet. (B) HRTEM image of an MFI-nanosheet.
(C) FFT of A. (D) FFT of B. The scale bars in (A) and (B) indicate 20 nm.
10
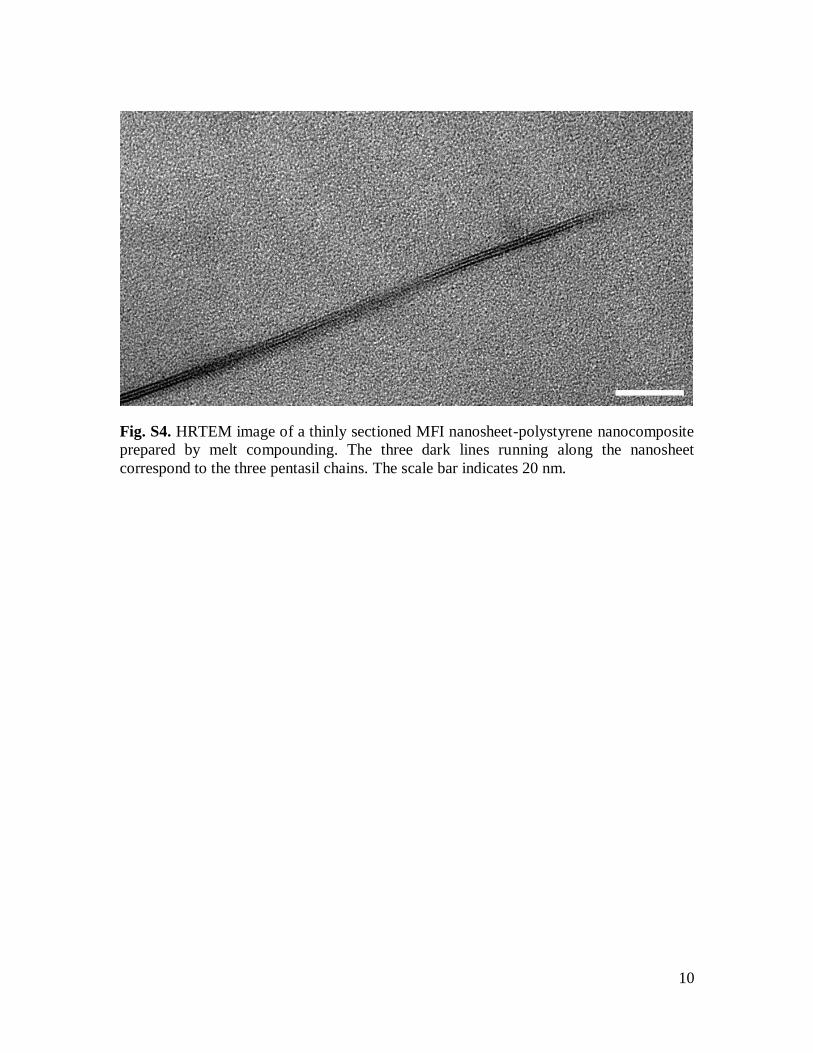
Fig. S4. HRTEM image of a thinly sectioned MFI nanosheet-polystyrene nanocomposite
prepared by melt compounding. The three dark lines running along the nanosheet
correspond to the three pentasil chains. The scale bar indicates 20 nm.

11
Fig. S5. 29
Si MAS NMR of exfoliated MFI. The Q3/(Q
3+Q
4) ratios for MFI layer
structure with its thickness in the range of 1-2.5 unit cell is listed in the inset. The
calculated Q3/(Q
3+Q
4) ratio from
29Si MAS NMR indicates that the exfoliated MFI layers
are 1.5 unit cell thick.

12
Fig. S6. Side-views of relaxed structures of the MWW- and MFI-nanosheets obtained by
structure optimization of nanosheets with Car-Parrinello molecular dynamics. (A) 1 unit
cell thick MWW-nanosheet with relaxed surface structure viewed along a-axis; 1.5 unit
cell thick silicalite-1 nanosheet with relaxed surface structure, viewed along c-axis (B),
and a-axis (C); 1 unit cell thick silicalite-1 nanosheet with relaxed surface structure,
viewed along c-axis (D), and a-axis (E). The cluster of atoms that were allowed to relax
is shown in purple. The rest of the Si, O, and H atoms are colored in yellow, red and
white, respectively.

13
Fig. S7. Comparison between experimental and simulated powder X-ray diffraction
patterns of the nanosheets, where bottom trace is the experimental pattern, and top traces
are simulated patterns. (A) Comparison for the MWW-nanosheet; trace (i) is the
experimental powder XRD pattern, and traces (ii), (iii) and (iv) are the simulated patterns
for 1, 2 and 3 unit cell thick MWW-nanosheets, respectively. The comparison indicates
that the simulated pattern of 1 unit cell thick nanosheets agrees with the experimental
pattern. (B) Comparison for the MFI-nanosheets; trace (i) is the experimental powder
XRD pattern, and traces (ii), (iii), (iv) and (v) are the simulated patterns for 1, 1.5, 2.5
and 3.5 unit cell thick MFI-nanosheets, respectively. The comparison indicates that the
simulated pattern of 1.5 unit cell thick nanosheets agrees with the experimental pattern.
Both (A) and (B) indicate that the peaks at low angles are sensitive to nanosheet
thickness.

14
Fig. S8. TEM images of agglomerated and curled MWW-nanosheets (A) and MFI-
nanosheets (B) obtained after calcination of the polymer nanocomposite at 540 °C. SEM
images (top- (C) and side-views (D)) of MWW-nanosheet coating formed from an
aqueous dispersion of nanosheets obtained after calcination of the polymer
nanocomposite at 540 °C. The nanosheet orientation in the coated film is not uniform due
to their curling and bending. The scale bars indicate 200 nm for (A), 50 nm for (B) and 1
micron for (C) and (D).
15
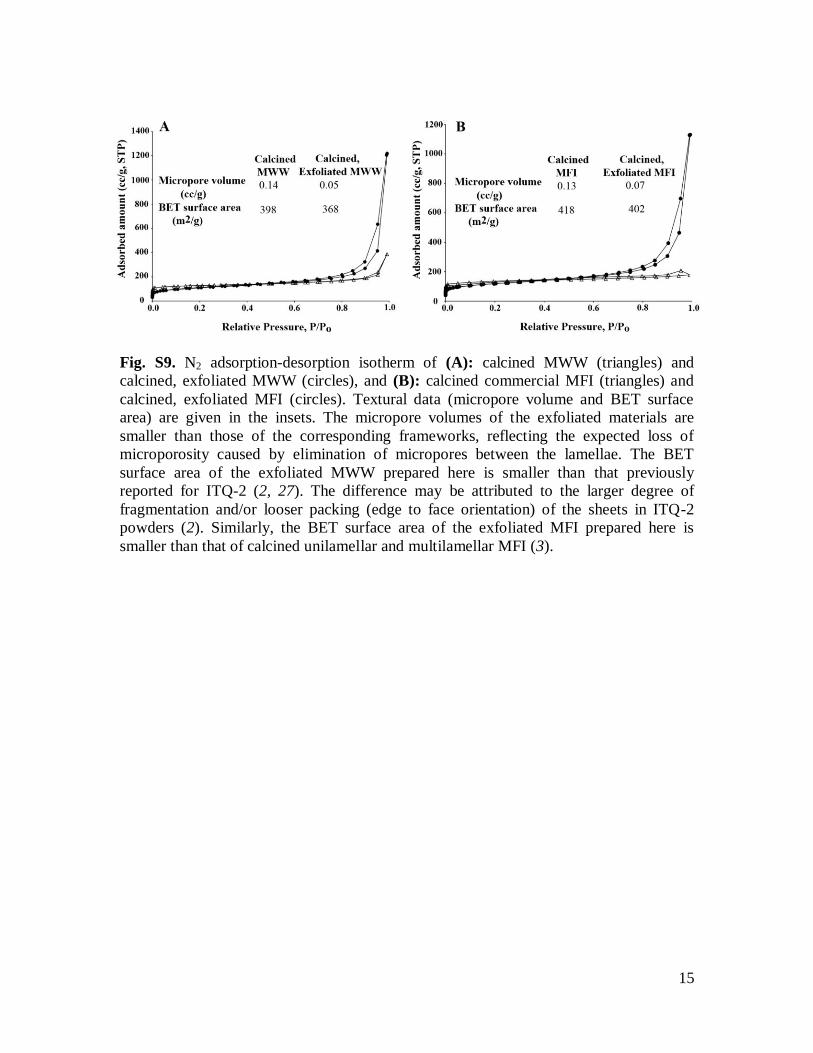
Fig. S9. N2 adsorption-desorption isotherm of (A): calcined MWW (triangles) and
calcined, exfoliated MWW (circles), and (B): calcined commercial MFI (triangles) and
calcined, exfoliated MFI (circles). Textural data (micropore volume and BET surface
area) are given in the insets. The micropore volumes of the exfoliated materials are
smaller than those of the corresponding frameworks, reflecting the expected loss of
microporosity caused by elimination of micropores between the lamellae. The BET
surface area of the exfoliated MWW prepared here is smaller than that previously
reported for ITQ-2 (2, 27). The difference may be attributed to the larger degree of
fragmentation and/or looser packing (edge to face orientation) of the sheets in ITQ-2
powders (2). Similarly, the BET surface area of the exfoliated MFI prepared here is
smaller than that of calcined unilamellar and multilamellar MFI (3).

16
Fig. S10. Images of the MFI film on a homemade porous α-alumina support after the
secondary growth of MFI-nanosheet coating. Secondary growth was done at 90 ⁰C for 4.5
hours in a synthesis sol with a composition of 60SiO2 : 9TPAOH : 8100 H2O : 240EtOH
(aged at 90 ⁰C for 6 hours before being used for secondary growth). (A) SEM image (top-
view) of the film. (B) AFM topographical image of the film revealing surface roughness
due to ca. 25 nm steps formed on the smooth surfaces of the nanosheets. (C) FIB image
of the cross section of the film. The image is taken by a gallium ion source (30 KV) at a
tilt angle of 52⁰ . The film is sandwiched between FIB deposited platinum (to protect the
coating from milling) and the alumina support. (D) TEM image of the cross section of
film. The dark layer on top of the coating is FIB deposited platinum. (E) HRTEM image
of the coating cross section. The scale bars indicate 200 nm in (A) to (D) and 20 nm in
(E).

17
Fig. S11. p-xylene and o-xylene permeances and p-/o- xylene separation factors versus
temperature for one of the five membranes tested. p-xylene permeance through a bare
support is given for comparison. Permeation measurements after applying 4 atm trans-
membrane pressures gave identical results.

18
Fig. S12. (A) SEM image (top-view) of the coating of MWW-nanosheets on a homemade
porous α-alumina support. (B) SEM image (top-view) of the MWW film after the
secondary growth of the coating in (A). The image in (B) indicates misoriented growth
on top of the seed layers of nanosheets. He, H2 and N2 permeances vs. temperature (C)
and corresponding ideal selectivities of He/N2 and He/H2 (D). Horizontal lines in (D)
represent the expected ideal selectivities of He/N2 (2.6) and He/H2 (0.7) for Knudsen
diffusion. Permeation measurements after applying 4 atm trans-membrane pressure gave
identical results. The scale bars indicate 200 nm for (A) and 2.0 micron for (B).
1
References and Notes 1. M. E. Leonowicz, J. A. Lawton, S. L. Lawton, M. K. Rubin, MCM-22: A molecular sieve with
two independent multidimensional channel systems. Science 264, 1910 (1994). doi:10.1126/science.264.5167.1910 Medline
2. A. Corma, V. Fornes, S. B. Pergher, T. L. M. Maesen, J. G. Buglass, Delaminated zeolite precursors as selective acidic catalysts. Nature 396, 353 (1998). doi:10.1038/24592
3. M. Choi et al., Stable single-unit-cell nanosheets of zeolite MFI as active and long-lived catalysts. Nature 461, 246 (2009). doi:10.1038/nature08288 Medline
4. M. A. Snyder, M. Tsapatsis, Hierarchical nanomanufacturing: From shaped zeolite nanoparticles to high-performance separation membranes. Angew. Chem. Int. Ed. 46, 7560 (2007). doi:10.1002/anie.200604910
5. M. E. Davis, Ordered porous materials for emerging applications. Nature 417, 813 (2002). doi:10.1038/nature00785 Medline
6. C. M. Lew, R. Cai, Y. S. Yan, Zeolite thin films: From computer chips to space stations. Acc. Chem. Res. 43, 210 (2010). doi:10.1021/ar900146w Medline
7. V. V. Narkhede, H. Gies, Crystal structure of MCM-22 (MWW) and its delaminated zeolite itq-2 from high-resolution powder x-ray diffraction data: An analysis using rietveld technique and atomic pair distribution function. Chem. Mater. 21, 4339 (2009). doi:10.1021/cm901883e
8. N. Takahashi, H. Hata, K. Kuroda, Exfoliation of layered silicates through immobilization of imidazolium groups. Chem. Mater. 23, 266 (2011). doi:10.1021/cm102942s
9. J. H. Yu, R. R. Xu, Rich structure chemistry in the aluminophosphate family. Acc. Chem. Res. 36, 481 (2003). doi:10.1021/ar0201557 Medline
10. Q. M. Gao et al., Nonaqueous synthesis and characterization of a new 2-dimensional layered aluminophosphate [Al3P4O16]3−· 3[CH3CH2NH3]+. J. Solid State Chem. 129, 37 (1997). doi:10.1006/jssc.1996.7211
11. H. M. Yuan et al., Dual function of racemic isopropanolamine as solvent and as template for the synthesis of a new layered aluminophosphate: [NH3CH2CH(OH)CH3]3·Al3P4O16. J. Solid State Chem. 151, 145 (2000). doi:10.1006/jssc.2000.8637
12. Z. Li, B. Marler, H. Gies, A new layered silicate with structural motives of silicate zeolites: Synthesis, crystals structure, and properties. Chem. Mater. 20, 1896 (2008). doi:10.1021/cm702880p
13. G. G. Juttu, R. F. Lobo, Characterization and catalytic properties of MCM-56 and MCM-22 zeolites. Microporous Mesoporous Mater. 40, 9 (2000). doi:10.1016/S1387-1811(00)00233-X
14. I. Ogino et al., Delamination of layered zeolite precursors under mild conditions: Synthesis of UCB-1 via fluoride/chloride anion-promoted exfoliation. J. Am. Chem. Soc. 133, 3288 (2011). doi:10.1021/ja111147z Medline

2
15. L. Liu et al., New crystalline layered zinc phosphate with 10-membered-ring channels perpendicular to layers. Inorg. Chem. 48, 4598 (2009). doi:10.1021/ic900107p Medline
16. C. Rubio et al., Exfoliated titanosilicate material UZAR-S1 obtained from JDF-L1. Eur. J. Inorg. Chem. 2010, 159 (2010).
17. W. J. Roth, C. T. Kresge, Intercalation chemistry of NU-6(1), the layered precursor to zeolite NSI, leading to the pillared zeolite MCM-39(Si). Microporous Mesoporous Mater. 144, 158 (2011). doi:10.1016/j.micromeso.2011.04.006
18. S. Maheshwari et al., Layer structure preservation during swelling, pillaring, and exfoliation of a zeolite precursor. J. Am. Chem. Soc. 130, 1507 (2008). doi:10.1021/ja077711i Medline
19. S. Maheshwari, thesis, University of Minnesota, Minneapolis, MN (2009).
20. L. A. Nagahara, K. Hashimoto, A. Fujishima, D. Snowdenlfft, P. B. Price, Mica etch pits as a height calibration source for atomic force microscopy. J. Vac. Sci. Technol. B 12, 1694 (1994). doi:10.1116/1.587265
21. P. Giannozzi et al., Quantum ESPRESSO: A modular and open-source software project for quantum simulations of materials. J. Phys. Condens. Matter 21, 395502 (2009).
22. See SOM on Science Online.
23. J. M. Cowley, A. F. Moodie, The scattering of electrons by atoms and crystals. I. A new theoretical approach. Acta Crystallogr. 10, 609 (1957). doi:10.1107/S0365110X57002194
24. E. J. Kirkland, R. F. Loane, J. Silcox, Simulation of annular dark field stem images using a modified multislice method. Ultramicroscopy 23, 77 (1987). doi:10.1016/0304-3991(87)90229-4
25. J. L. Schlenker, B. K. Peterson, Computed x-ray powder diffraction patterns for ultrasmall zeolite crystals. J. Appl. Cryst. 29, 178 (1996). doi:10.1107/S0021889895014191
26. The UDSKIP algorithm to calculate theoretical powder XRD patterns of ultra-small zeolite crystals is available at www.che.udel.edu/research_groups/nanomodeling/resources.html.
27. P. Wu et al., Delamination of Ti-MWW and high efficiency in epoxidation of alkenes with various molecular sizes. J. Phys. Chem. B 108, 19126 (2004). doi:10.1021/jp037459a
28. S. Srivastava, N. A. Kotov, Composite layer-by-layer (LBL) assembly with inorganic nanoparticles and nanowires. Acc. Chem. Res. 41, 1831 (2008). doi:10.1021/ar8001377 Medline
29. M. Osada, T. Sasaki, Exfoliated oxide nanosheets: New solution to nanoelectronics. J. Mater. Chem. 19, 2503 (2009). doi:10.1039/b820160a
30. J. Hedlund, F. Jareman, A. J. Bons, M. Anthonis, A masking technique for high quality MFI membranes. J. Membr. Sci. 222, 163 (2003). doi:10.1016/S0376-7388(03)00285-0
31. P. S. Lee et al., Sub-40 nm zeolite suspensions via disassembly of three-dimensionally ordered mesoporous-imprinted silicalite-1. J. Am. Chem. Soc. 133, 493 (2011). doi:10.1021/ja107942n

3
32. Z. P. Lai et al., Microstructural optimization of a zeolite membrane for organic vapor separation. Science 300, 456 (2003). Medline
33. J. Caro, M. Noack, Zeolite membranes—Recent developments and progress. Microporous Mesoporous Mater. 115, 215 (2008). doi:10.1016/j.micromeso.2008.03.008
34. J. Choi et al., Grain boundary defect elimination in a zeolite membrane by rapid thermal processing. Science 325, 590 (2009). doi:10.1126/science.1176095 Medline
35. M. A. Camblor, A. Corma, M. J. Diaz-Cabanas, C. Baerlocher, Synthesis and structural characterization of MWW type zeolite ITQ-1, the pure silica analog of MCM-22 and SSZ-25. J. Phys. Chem. B 102, 44 (1998). doi:10.1021/jp972319k
36. J. Choi, S. Ghosh, L. King, M. Tsapatsis, MFI zeolite membranes from a- and randomly oriented monolayers. Adsorption 12, 339 (2006). doi:10.1007/s10450-006-0564-y
37. J. P. Perdew, K. Burke, M. Ernzerhof, Generalized gradient approximation made simple. Phys. Rev. Lett. 77, 3865 (1996). doi:10.1103/PhysRevLett.77.3865 Medline
38. A. Corma et al., Preparation, characterisation and catalytic activity of ITQ-2, a delaminated zeolite. Microporous Mesoporous Mater. 38, 301 (2000). doi:10.1016/S1387-1811(00)00149-9
39. H. van Koningsveld, J. C. Jansen, H. van Bekkum, The monoclinic framework structure of zeolite H-ZSM-5. Comparison with the orthorhombic framework of as-synthesized ZSM-5. Zeolites 10, 235 (1990). doi:10.1016/0144-2449(94)90134-1
40. D. D. Kragten et al., Structure of the silica phase extracted from silica/(TPA)OH solutions containing nanoparticles. J. Phys. Chem. B 107, 10006 (2003). doi:10.1021/jp035110h
41. R. F. Loane, P. R. Xu, J. Silcox, Thermal vibrations in convergent-beam electron diffraction. Acta Crystallogr. A 47, 267 (1991). doi:10.1107/S0108767391000375
42. E. J. Kirkland, Advanced Computing in Electron Microscopy (Springer, New York, ed. 2, 2010).
43. N. M. Butt, J. Bashir, B. T. M. Willis, G. Heger, Compilation of temperature factors of cubic elements. Acta Crystallogr. A 44, 396 (1988). doi:10.1107/S0108767387011929
44. K. Na et al., Pillared MFI zeolite nanosheets of a single-unit-cell thickness. J. Am. Chem. Soc. 132, 4169 (2010). doi:10.1021/ja908382n Medline