Supporting Online Material for -...
16
www.sciencemag.org/cgi/content/full/1170198/DC1 Supporting Online Material for The Disappearance of the Progenitors of Supernovae 1993J and 2003gd Justyn R. Maund* and Stephen J. Smartt *To whom correspondence should be addressed. E-mail: [email protected] Published 19 March 2009 on Science Express DOI: 10.1126/science.1170198 This PDF file includes: SOM Text Figs. S1 to S4 Tables S1 to S9 References
Transcript of Supporting Online Material for -...
www.sciencemag.org/cgi/content/full/1170198/DC1
Supporting Online Material for
The Disappearance of the Progenitors of Supernovae 1993J and 2003gd
Justyn R. Maund* and Stephen J. Smartt
*To whom correspondence should be addressed. E-mail: [email protected]
Published 19 March 2009 on Science Express
DOI: 10.1126/science.1170198
This PDF file includes:
SOM Text Figs. S1 to S4 Tables S1 to S9 References

Supporting Online Material: The Disappearance of theProgenitors of Supernovae 1993J and 2003gd
Justyn R. Maund,∗,1,2,3 Stephen J. Smartt,4
1 Dark Cosmology Centre, Niels Bohr Institute, University of Copenhagen
Juliane Maries Vej 30, 2100 Copenhagen Ø, Denmark2 Department of Astronomy & Astrophysics, University of California, Santa Cruz, 95064, U.S.A.
3 Sophie & Tycho Brahe Fellow4 Astrophysics Research Centre, School of Mathematics and Physics,
Queens’ University Belfast, Belfast, BT7 1NN, United Kingdom
∗To whom correspondence should be addressed;E-mail: [email protected].
1 Observations
The observations used in this study are listed in Tables S1, S2 for SN 1993J and Tables S3,S4, S5 and S6 for SN 2003gd. Due to space constraints, in the main body of the paper onlythe most appropriate observations were explicitly discussed. All the observations presented inthese tables were also reduced, analysed and considered as part of the broader context of thestudy, and corroborated the results presented here.
The HST data were retrieved from the Space Telescope Science Institute Archive 1. Thesedata were processed by the on-the-fly-recalibration pipeline, being processed with the most up-to-date calibration frames available for the WFPC2, ACS/HRC and ACS/WFC instruments, andwere retrieved in a form on which analysis could be directly conducted.The Gemini-North GMOS data were retrieved from the Gemini Science Archive2, and werereduced with master bias and flatfield calibration frames acquired at the same epochs. The indi-vidual observations were combined using the IRAF3 gemini package imcoadd task to produce
1http://archive.stsci.edu/hst2http://archive.gemini.edu/3IRAF is distributed by the National Optical Astronomy Observatory, which is operated by the Association of
Universities for Research in Astronomy (AURA) under cooperative agreement with the National Science Founda-
1

Table S1: Late-time HST ACS observations of the site of SN 1993J.Date Dataset Filter Exp Time(JD +2 450 000) (secs)2002 May 281 J8DT07010 F250W 2100 HRC(2422.81) J8DT07020 F330W 1200 HRC
J8DT07030 F435W 1000 HRCJ8DT07040 F555W 1120 HRC
2004 Jul 152 J8ZO02010 F330W 2400 HRC(3203.40) J8ZO02040 F435W 1548 HRC
J8ZO02020 F555W 1200 HRCJ8ZO02030 F625W 1200 HRCJ8ZO02050 F814W 1739 HRC
2004 Sep 153 J90L08010 F814W 1650 WFC(3262.82)
2005 Jan 112 J8ZO03010 F625W 1200 HRC(3382.38) J8ZO03020 F814W 1404 HRC
2006 Sep 084 J9EL14010 F435W 1200 WFC(3987.42) J9EL14020 F606W 1200 WFC
2006 Nov 15 J9NW02010 F555W 480 HRC(4040.78) J9NW02020 F814W 720 HRC
2006 Nov 35 J9NW01010 F435W 840 HRC(4042.77) J9NW01020 F625W 360 HRC
1 Program 9353 (P.I. S.J. Smartt)2 Program 10204 (P.I. B.E. Sugerman)3 Program 10250 (P.I. J. Huchra)4 Program 10584 (P.I. A. Zezas)5 Program 10877 (P.I. W. Li)
2
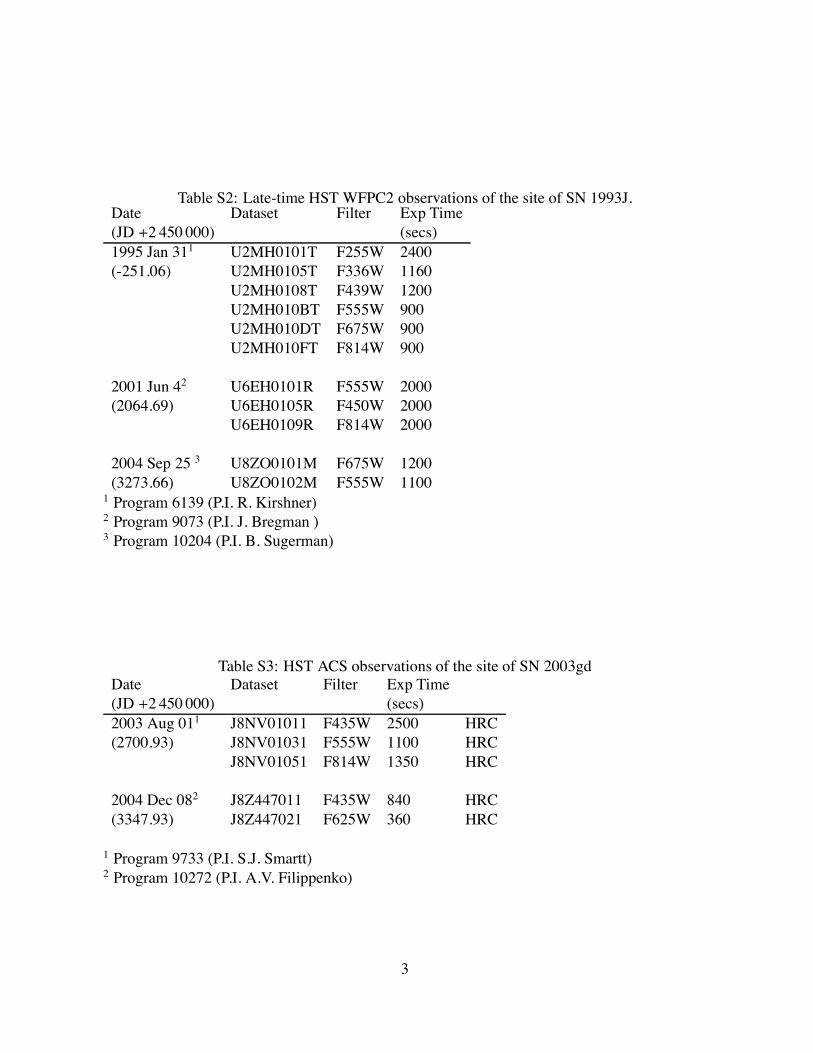
Table S2: Late-time HST WFPC2 observations of the site of SN 1993J.Date Dataset Filter Exp Time(JD +2 450 000) (secs)1995 Jan 311 U2MH0101T F255W 2400(-251.06) U2MH0105T F336W 1160
U2MH0108T F439W 1200U2MH010BT F555W 900U2MH010DT F675W 900U2MH010FT F814W 900
2001 Jun 42 U6EH0101R F555W 2000(2064.69) U6EH0105R F450W 2000
U6EH0109R F814W 2000
2004 Sep 25 3 U8ZO0101M F675W 1200(3273.66) U8ZO0102M F555W 1100
1 Program 6139 (P.I. R. Kirshner)2 Program 9073 (P.I. J. Bregman )3 Program 10204 (P.I. B. Sugerman)
Table S3: HST ACS observations of the site of SN 2003gdDate Dataset Filter Exp Time(JD +2 450 000) (secs)2003 Aug 011 J8NV01011 F435W 2500 HRC(2700.93) J8NV01031 F555W 1100 HRC
J8NV01051 F814W 1350 HRC
2004 Dec 082 J8Z447011 F435W 840 HRC(3347.93) J8Z447021 F625W 360 HRC
1 Program 9733 (P.I. S.J. Smartt)2 Program 10272 (P.I. A.V. Filippenko)
3
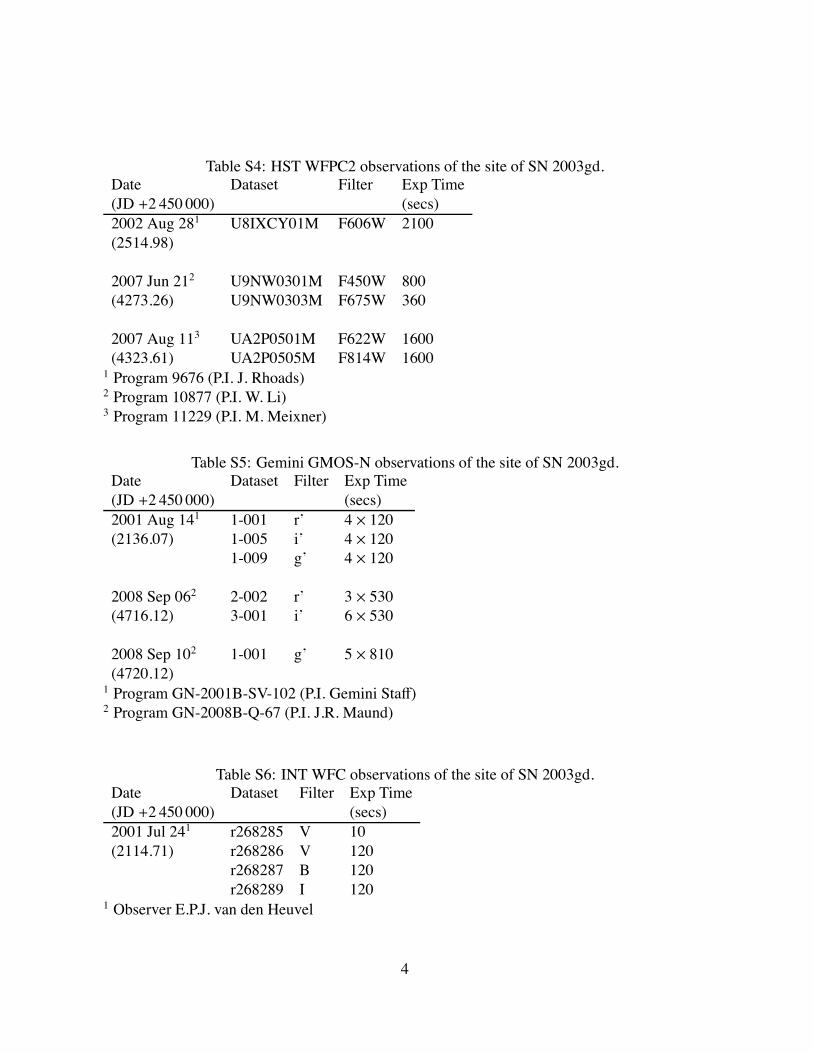
Table S4: HST WFPC2 observations of the site of SN 2003gd.Date Dataset Filter Exp Time(JD +2 450 000) (secs)2002 Aug 281 U8IXCY01M F606W 2100(2514.98)
2007 Jun 212 U9NW0301M F450W 800(4273.26) U9NW0303M F675W 360
2007 Aug 113 UA2P0501M F622W 1600(4323.61) UA2P0505M F814W 1600
1 Program 9676 (P.I. J. Rhoads)2 Program 10877 (P.I. W. Li)3 Program 11229 (P.I. M. Meixner)
Table S5: Gemini GMOS-N observations of the site of SN 2003gd.Date Dataset Filter Exp Time(JD +2 450 000) (secs)2001 Aug 141 1-001 r’ 4 × 120(2136.07) 1-005 i’ 4 × 120
1-009 g’ 4 × 120
2008 Sep 062 2-002 r’ 3 × 530(4716.12) 3-001 i’ 6 × 530
2008 Sep 102 1-001 g’ 5 × 810(4720.12)
1 Program GN-2001B-SV-102 (P.I. Gemini Staff)2 Program GN-2008B-Q-67 (P.I. J.R. Maund)
Table S6: INT WFC observations of the site of SN 2003gd.Date Dataset Filter Exp Time(JD +2 450 000) (secs)2001 Jul 241 r268285 V 10(2114.71) r268286 V 120
r268287 B 120r268289 I 120
1 Observer E.P.J. van den Heuvel
4
combined master science frames, on which photometry could be conducted. As a ditheringpattern had been employed, the coaddition of the subimages for each filter filled in any gapsbetween the detectors as well as move the location of any hot pixels relative to observed stars.The 2008 observations were conducted under photometric conditions, for which photometriczeropoints (for the Sloan AB magnitude system) were calculated in the standard way4.Fully reduced observations of M74 using the Isaac Newton Telescope Wide field Camera, withthe Harris BVI filters, were retrieved from the Cambridge Astronomical Survey Unit archive 5.
2 Photometry
2.1 HST data
Photometry of the HST WFPC2 data was conducted using the HSTphot package (S1)6, whichprovides corrections for aperture size and charge transfer efficiency, and includes transforma-tions for photometry from the WFPC2 magnitude system to the standard Johnson-Cousins sys-tem. In addition, in parallel, our own photometry was conducted using the daophot pack-age (S2) in IRAF. Corrections for the charge transfer efficiency were adopted from (S3) andaperture corrections were taken from (S4). The results from this parallel analysis were identicalto those provided by HSTphot.
HST ACS photometry was conducted using our own scripts (a modified version of daophot,which uses pre-calculated TinyTim7 PSFs) and the DOLphot program 8. Both of these codesprovide similar corrections and transformations for the ACS system, as HSTphot does for theWFPC2 instrument. DOLphot conducts photometry of cosmic-ray rejected, distorted, com-bined “crj” images and individual distorted “flt” images. Our script measures photometry usingthe distortion corrected drizzled “drz” images, with the sky background unsubtracted during thedrizzling process. Importantly, the photometry using the different images and different codesgenerally agreed with each other to within the photometric errors, but for consistency we reportthe magnitudes reported by the DOLphot package.
tion.4http://www.gemini.edu/sciops/instruments/gmos/calibration/photometric-stds5http://archive.ast.cam.ac.uk6http://purcell.as.arizona.edu/hstphot/7http://www.stsci.edu/software/tinytim/tinytim.html8http://purcell.as.arizona.edu/dolphot/
5

2.2 Gemini Data
Photometry of the Gemini GMOS data was conducted in the standard fashion using daophot.Aperture corrections were determined for each of the images using bright isolated stars presentin the field. PSF models were constructed for each of the images, and photometry was con-ducted by fitting PSFs to stars. The observations were flux calibrated using observations ofthe standard fields SA110-361 and SA95-100, for the nights of 06 Sep 2008 and 10 Sep 2008respectively. Zeropoints were derived in the standard manner (S5): mg′ = 27.852 ± 0.021,mr′ = 28.229 ± 0.037 and mi′ = 28.215 ± 0.023.In parallel the g’r’i’ magnitudes were transformed to the standard Johnson-Cousins system, bybootstrapping the photometry via INT WFC Harris BVI observations and the Henden Johnson-Cousins standard star sequence (S6). The correction from Cousins I to Johnson I magnitudes,with a quadratic dependence on V-I color, was computed using the IRAF STSDAS synphotpackage and spectra from the Bruzual-Persson-Gunn-Stryker Spectrophotometry Atlas.To test for consistency between our bootstrapped photometry and the absolute photometry de-rived from our zeropoints, we determined a relationship between i′(AB) − Ic(Vega) and V − Iusing synphot. This yielded a correction of i′−Ic = +0.7 at V−I = 2.5 which is consistent withthe Ic and i′(AB) magnitudes determined for progenitor of SN 2003gd using the two separatecalibrations.
3 SN 2003gd Images
A montage of images of the site of SN 2003gd is presented as Fig. S1. Broad band photometryof SN 2003gd at multiple late-time epochs is presented as Table S7
4 Image Subtraction
Image subtraction, and the photometry of the resulting clean images, of the SN 2003gd Geminiimages was principally conducted using the ISIS optimized image subtraction software (S8,S9)9.As the 2008 post-explosion Gemini GMOS i′ image was acquired under better seeing condi-tions than the pre-explosion i′ observation of 2001, the 2008 image was aligned with the pre-explosion observation using the geomap and geotran tasks in IRAF. Any degradation in theseeing in the resulting transformed post-explosion image was negligible compared to the muchlarger seeing of the pre-explosion image. The images used with the ISIS package were smaller900 × 900 stamps extracted from the larger observed images. The large area of these stampimages meant there were sufficient single stars, over a range of brightness, to enable the con-struction of a good PSF model. The transformed post-explosion image was used as the referenceframe for subtraction from the pre-explosion frame using ISIS. ISIS automatically matches the
9http://www2.iap.fr/users/alard/package.html
6

Figure S1: The site of SN 2003gd: (First Row, l to r) Post-explosion ACS HRC/F435W,ACS/HRC F555W and ACS/HRC F814W images (2003 Aug 01). (Second Row, l to r) Pre-explosion WFPC2/WF2 F606W image (2002 Aug 28), with the progenitor indicated as star A,pre-explosion Gemini GMOS i′ image (2001 Aug 14), and the ISIS subtraction image i′(pre)-i′(post). (Third Row, l to r) Post-explosion Gemini GMOS g′, r′ and i′ images (2008 Sep10 and 2008 Sep 06). (Fourth Row, l to r), Post-explosion WFPC2/PC F622W and F814Wimages (2007 Aug 11) and dithered, drizzled pre-explosion F606W image with a pixel scale of0.05”. The positions of Stars A and C, as identified by Smartt et al., (S7), are indicated by thecross-hairs.
7
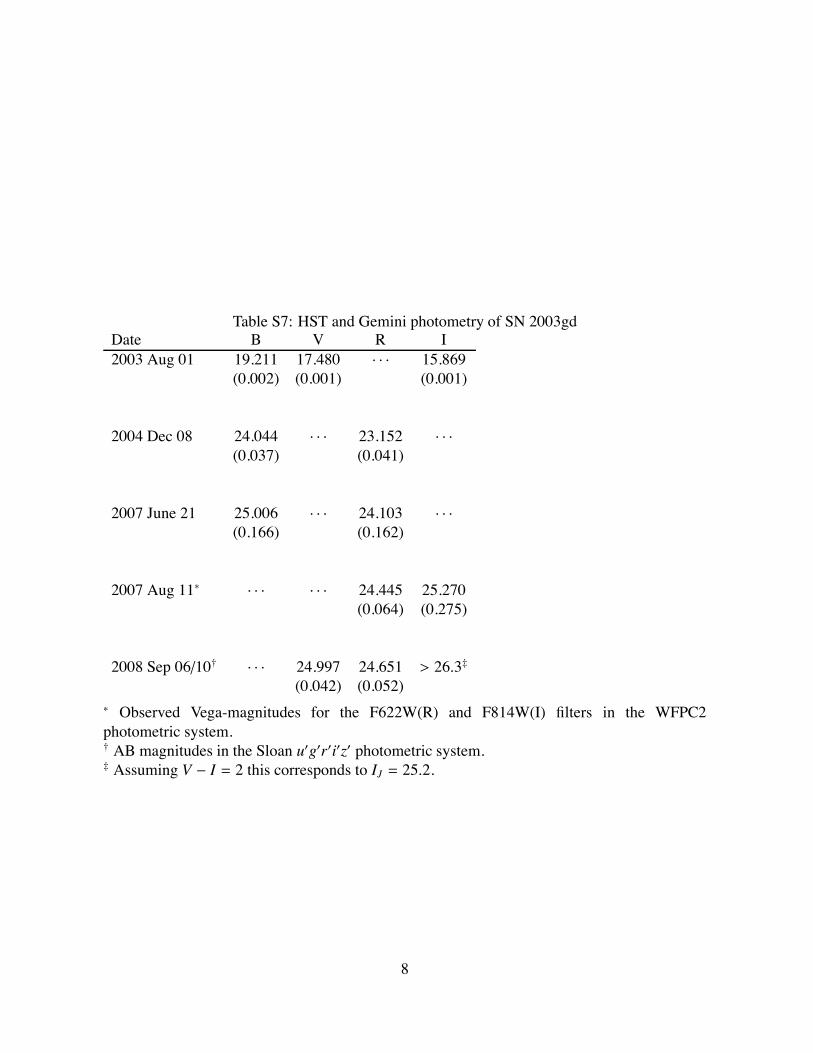
Table S7: HST and Gemini photometry of SN 2003gdDate B V R I2003 Aug 01 19.211 17.480 · · · 15.869
(0.002) (0.001) (0.001)
2004 Dec 08 24.044 · · · 23.152 · · ·(0.037) (0.041)
2007 June 21 25.006 · · · 24.103 · · ·(0.166) (0.162)
2007 Aug 11∗ · · · · · · 24.445 25.270(0.064) (0.275)
2008 Sep 06/10† · · · 24.997 24.651 > 26.3‡
(0.042) (0.052)∗ Observed Vega-magnitudes for the F622W(R) and F814W(I) filters in the WFPC2photometric system.† AB magnitudes in the Sloan u′g′r′i′z′ photometric system.‡ Assuming V − I = 2 this corresponds to IJ = 25.2.
8

PSF of the reference image to the input images, as well as appropriately scaling the flux of ob-jects and the background. ISIS produces subtraction images and photometry for variable objectswith different flux levels in the reference and input images. Single stellar objects, confirmed assingular on the post-explosion frame, were cleanly subtracted on the subtraction image, whereaslarge extended objects left minor residuals.The photometry of ISIS provides a measure of the flux, in counts, of any variable objects ateach epoch, along with a similar measure of flux for reference objects in the field which werenot variable between the two frames. Photometry of the progenitor used the flux level of theprogenitor object, reported in counts by ISIS, relative to the flux of these standard stars, whichwas converted to a magnitude using comparable daophot photometry of the reference stars onthe post-explosion frame and the standard formula relating magnitudes and relative flux.As ISIS automatically handles a large number of the details involved in image subtraction, andis sometimes considered a “black box”, a comparable analysis was conducted in parallel usingthe IRAF tasks linmatch and psfmatch, which scale the flux between two aligned images andproduces a convolution kernel to match the PSF of one image to another, respectively. Im-portantly, having run these tasks and subtracted the convoluted post-explosion image from thepre-explosion image an identical result to the ISIS analysis was achieved.The quality of the PSF and the subtraction process can be estimated by studying the residualdegree of flux in the self-subtracted image (i′(post) − i′(post)) after convolution and scaling. Atthe SN location, the residual flux is consistent with a null residual [(0.7 ± 44) × 10−3]. Theself-subtracted image is shown as Fig. S2.The background at the SN location in the post-explosion i′-band image is particularly com-plex (see Fig. S1). Application of the daophot allstar routine, with a PSF determined fromthe image, does not provided a satisfactory single star solution (for either the sharpness or χ2
parameters - χ2 = 4). Synthetic artificial stars, of known magnitude, were inserted into thepost-explosion frame at the SN position, using the daophot task addstar, and the ISIS packagewas used to recover them. A star of magnitude 26.5 was recovered at an 84% confidence levelusing ISIS; which we use as an estimate of the detection threshold at the SN location, on topof the complicated background structure (as ISIS only provides a measure of the flux differ-ence between two images). We cannot exclude, however, the possibility that there is still someSN flux that is contributing to the detected complex background feature. In this case, there-fore, a more conservative estimate was made using forced photometry at the SN position, usingdaophot allstar. We estimate an upper limit for the SN+background of 26.3, which we adoptas a conservative upper limit on the SN flux.The likelihood of a unrelated variable object being located at the SN location was calculatedin a simple fashion. The density of objects, per square pixel, was estimated using all detectedvariables on the 900 × 900px area. A more thorough treatment, using “association probabil-ity analysis”, requires appropriate handling of clustering. We note that a number of identifiedvariables occur in dense stellar regions, extended sources or moving objects, which also leavelarge residuals in the i′(post) − i′(post) image. The measured density is, therefore, an upperlimit on the density of true variable objects, but does not include the effects of “clustering” of
9

Figure S2: Self-subtracted post-explosion i′ images. (Left) 900 × 900px frame used in theISIS package. The black square indicates the area of the frame in which the SN is located (seenext panel). Minor residuals are associated with extended objects. (Right) The area of theself-subtracted frame containing the SN location. The area covered by the panel correspondsexactly to the panels presented in Fig. S1.
sources in the vicinity of the SN location (although we note that, in the case of SN 2003gd,neighbouring stars are resolved and the residual in the subtraction frame does not have thecharacteristic dipole signature of a moving object). The number of variable objects randomlyexpected within the astrometric error circle (see below) is 0.00001, suggesting the likelihood ofrandom coincidence to be low.
5 Differential Astrometry
The position of the progenitor object of SN 2003gd, on each of the pre-explosion frames, wasdetermined using differential astrometry. The position of SN 2003gd was determined from theACS/HRC F814W observation at 01 Aug 2003. Transformations between this image and thepre-explosion images were calculated using common stars in the images, and the IRAF taskgeomap. geomap also provides an estimate of the r.m.s. uncertainty associated with the trans-formation. The SN position from the post-explosion image was transformed to the coordinatesof the pre-explosion images using the IRAF task geoxytran. ISIS provides the position of theresidual on the subtraction image. The difference between the transformed position and the ISISposition was 0.023”, whereas the uncertainty on the transformation was 0.031”. Importantly,for the analysis presented here, the spatial coincidence is a secondary concern, since the identityof the progenitor has been confirmed by its absence in the post-explosion image.
10

Figure S3: The site of SN 1993J. Left) HST ACS HRC F625W image from 03 Nov 2006. Thepixel scale is 0.025” per pixel, and the image has been rotated to have North up, East left. Thestars in the vicinity of SN 1993J are labelled according to the established scheme (S11, S12).Right) Same as for the left, except an HST ACS HRC F814W image from 01 Nov 2006.
6 Excess flux correction for ground based imaging of the pro-genitor of SN 1993J
The site of SN 1993J at 01 Nov 2006 and 03 Nov 2006, in the F814W and F625W filtersrespectively, is shown as Fig. S3. As the pre-explosion imaging of the progenitor (S10) wasground-based, poor seeing (relative to HST observations) led to a number of bright nearbystars being unresolved and, hence, contributing flux to the measured progenitor photometry.Following previous work (S11, S12), the excess flux contribution was determined by using aGaussian-weighting scheme (where the flux contribution to the photometry of the progenitorbinary is the total stellar flux for each star scaled by a factor dependent on the distance of thestar from SN 1993J and the seeing, for each filter, of the pre-explosion observations). For ageneral filter X, the excess flux contribution to the progenitor binary photometry was calculatedas:
FX =∑i=A..D
FX,ie−r2i /4σ2x (1)
where r is the distance in arcseconds of the ith star from SN 1993J (measured from the ACS/HRCimages) and σX is the seeing, for each filter, in the original pre-explosion imaging (S10, S11).The pre-explosion photometry is in the Landolt system, and our ACS photometry has been con-verted to the appropriate Johnson UBV and Cousins RcIc colours (S13).
The pre-explosion photometry was corrected for the weighted contributions of stars A, B, Cand D (as identified in Fig. S3), which produced the largest contribution to the excess flux (in
11

Figure S4: The late-time HST light curve of SN 1993J. The boxes show the measured bright-ness, corrected for excess flux, of the binary progenitor system. The photometric data is plottedin day since the date of explosion (JD 2449074; (S15)).
particular in theU and B bands); while Stars E, F and G were not included in the calculation dueto their faintness. Photometry of these stars in all recent HST WFPC2 and ACS observations(as listed in Tables S1 and S2) were used to determine average UBVRI magnitudes as well asassess photometric variability. This photometry is presented in Table S8. The subtraction offlux corresponding to a magnitude m2 from an object of magnitude m1 gives a new magnitudem′ given by:
m′ = −2.5 log( f1 − f2) = m1 − 2.5 log(1 − 1
k
)(2)
where k = 10(m1−m2)/−2.5.The brightness of SN 1993J at 31 Jan 1995, 28 May 2002, 15 Jul 2004 and 1/3 Nov 2006 (aspresented in Fig. 2, in the main body of the paper) are given in Table S9.The photometry presented of SN 1993J and the surrounding stars are approximately consistentwith previously presented photometry of these objects (S11, S14). Minor differences may havearisen due to intrinsic photometric variability (see Star A), changes in the adopted zeropointsin the intervening period between the publication of those studies and differences in the filterresponses between the WFPC2 and ACS instruments. The evolution of the SN 1993J lightcurve, relative to the limits on the brightness of the binary progenitor system, corrected for theflux excess, is shown as Fig. S4.
12

Table S8: Photometry of Stars A, B, C and D in the vicinity of SN 1993J, the excess fluxcontribution and the corrected progenitor photometry.Star U B V R I Distance
(”)A� 23.387 23.808 22.634 21.523 20.530 0.74
(0.017) (0.362) (0.878) (0.644) (0.300)
B 23.080 23.088 22.989 23.042 22.917 1.43(0.033) (0.009) (0.006) (0.018) (0.020)
C 23.079 23.708 23.681 23.742 23.304 1.21(0.051) (0.013) (0.009) (0.019) (0.011)
D 22.961 23.704 23.827 23.907 23.906 1.19(0.065) (0.014) (0.011) (0.023) (0.033)
σX(”) 0.85 0.61 0.69 0.77 0.53Excess 22.129 23.045 22.323 21.492 20.971
(0.024) (0.124) (0.495) (0.450) (0.277)AHR1 21.450 21.730 20.720 19.940 19.430
0.200 0.070 0.040 0.080 0.170AHR Corr.2 22.283 22.114 21.002 20.237 19.731
(0.431) (0.113) (0.155) (0.140) (0.241)� Star A identified as variable (quoted uncertainty gives combined photometric errors and therange of variability as measured at the epochs of the observations given in Tables S1 and S2).1 Ground-based photometry of the progenitor object, including the excess flux contributionfrom unresolved nearby stars (S10).2 Photometry of the progenitor binary system corrected for the excess flux contribution fromnearby stars.
13

Table S9: HST WFPC2 and ACS photometry of SN 1993J at 31 Jan 1995, 28 May 2002, 15Jul 2004 and 1/3 Nov 2006. Magnitudes are given in the standard Johnson-Cousins UBVRIsystem.Date U B V R I
31 Jan 1995 18.512 19.116 18.767 17.856 18.557(0.011) (0.006) (0.003) (0.002) (0.004)
28 May 2002 21.032 21.195 20.317 · · · · · ·(0.024) (0.011) (0.021)
15 Jul 2004 21.320 21.430 20.515 20.441 20.078(0.022) (0.042) (0.020) (0.020) 0.041
1/3 Nov 2006 · · · 21.663 20.683 20.687 20.232(0.042) (0.030) (0.062) (0.091)
References and Notes
S1. A. E. Dolphin, PASP 112, 1383 (2000).
S2. P. B. Stetson, PASP 99, 191 (1987).
S3. A. E. Dolphin, PASP 112, 1397 (2000).
S4. J. A. Holtzman, J. J. Hester, S. Casertano, et al., PASP 107, 156 (1995).
S5. I. Jorgensen, ArXiv e-prints (2008).
S6. A. Henden, GRB Coordinates Network 1242, 1 (2002).
S7. S. J. Smartt, et al., Science 303, 499 (2004).
S8. C. Alard, R. H. Lupton, ApJ 503, 325 (1998).
S9. C. Alard, A&AS 144, 363 (2000).
S10. G. Aldering, R. M. Humphreys, M. Richmond, AJ 107, 662 (1994).
S11. S. D. Van Dyk, et al., PASP 114, 1322 (2002).
S12. J. R. Maund, S. J. Smartt, R. P. Kudritzki, P. Podsiadlowski, G. F. Gilmore, Nature 427,129 (2004).
14

S13. M. Sirianni, et al., PASP 117, 1049 (2005).
S14. J. R. Maund, The Observed Nature of the Progenitors of Core-collapse Super-novae, Ph.D. thesis, Institute of Astronomy, Cambridge (2005), http://www.dark-cosmology.dk/∼justyn/research/
S15. J. R. Lewis, et al., MNRAS 266, L27+ (1994).
15