
Max-Planck-Institut für Sonnensystemforschung Max Planck ...

Supporting InformationSong et al. 10.1073/pnas.1214739110SI Materials and MethodsCrystallization and Structure Solution of the Dermcidin Peptide. Thedermcidin peptide sequence (Fig. S1) was synthesized by thecompany Peptide2.0 (www.peptide2.com) to yield a product of>97% purity. For crystallization, the peptide was dissolved in 10mM Hepes at a concentration of 50 mg/mL (∼10 mM finalconcentration). Crystallization drops were prepared by mixing400 nL of the peptide solution with the same amount of reser-voir, and drops were incubated by vapor diffusion (sitting drops)under a variety of different conditions (800 conditions fromQiagen screens). Two conditions, both of which contained Zn-acetate, yielded crystals suitable for X-ray diffraction analysis.Crystals for X-ray diffraction were taken from a drop containing0.2 M Zn(ac)2, 0.1 M Na-cacodylate, 18% (wt/vol) PEG8000 atpH 6.5. Crystals were taken from the mother liquor and flash-frozen in liquid nitrogen without adding cryoprotectant. Datawere collected at the Swiss Light Source, beamline PXII at 100 Kand 20 eV above the theoretical Zn-edge (9.658 keV). Three-hundred sixty 1° images were collected at 2% beam intensity togenerate a highly redundant dataset for single anomalous dis-persion data processing. Diffraction data were processed withXDS/XSCALE (1). The structure was solved with the PHENIXprogram package (2) with Phaser (3) for heavy atom detectionand Resolve (4) for initial solvent flattening. Solvent flatteningwas repeated by Pirate of the CCP4 suite (5) and a model with85% completeness was built with Buccaneer (6). The final modelwas obtained after several rounds of manual rebuilding and re-finement with Coot (7), REFMAC (8), and PHENIX (2). Thestructural geometry of all ligand structures was verified withWhatcheck (9); values are given in Table S1. Crystal structureimages were generated with Pymol (Schrodinger). Sequencealignment of human dermcidin (DCD) (Fig. S1) was performedagainst sequences deposited to the current EXPASY (10) se-quence database. Sequences similar to DCD were extracted witha PSI-BLAST (11) search. In addition, the secondary structurewas predicted with PSIPRED (12).
Electrophysiology. Giant unilamellar vesicles (GUVs) were pre-pared by the electroformation method (13–15). A lipid mixturecomposed of diphytanoyl phosphatidylcholine (DPhPC)/cholesterol(9:1) dissolved in chloroform at a concentration of 10 mM (6.25 μL)was deposited on indium-tin-oxide (ITO) coated cover slides andallowed to dry. Two slides were connected to form a sealed chamberelectrically connected to a voltage generator (33210A; AgilentTechnologies). The lipid was rehydrated in approximately 2mL 1Msorbitol andGUV formation was carried out by application of a 3-Vpeak-to-peak AC voltage at a frequency of 5 Hz for 2 h at 20 °C.A freestandingmembranewas prepared by spreading aGUVon
an aperture with a size of a few micrometers in diameter ina borosilicate chip (Port-a-Patch; Nanion Technologies). Twomicroliters of the GUV-containing solution were added to 6-μLbuffer (1 M NaCl, 5 mM Hepes, pH 7.1) and a GUV was gentlysucked onto the aperture by application of 15–40-mbar negativepressure. Spontaneous spreading of the GUV on the surface gaverise to a solvent-free membrane with resistances in the GΩ range.After successful membrane formation, 50 μL of buffer were
added and varying amounts of DCD-1L stock solution (100 μM)were added at a DC bias of 100 mV. Current traces were re-corded with an Axopatch 200B amplifier (Axon Instruments).The analog output signals were filtered with a low-pass four-poleBessel filter of 1 kHz and subsequently digitized by an A/Dconverter (Digidata 1322; Axon Instruments). The sampling rate
was 50 kHz. Data evaluation was performed with the pClamp 9software package (Axon Instruments).
Solid-State NMR Spectroscopy. Samples for solid-state NMRspectroscopy were prepared by dissolving 4 mg of peptide and∼30 mg of lipid in TFE/water 50/50 vol/vol. Where appropriateZnCl2 was added in five- to ten-fold molar excess over the pep-tide. The solutions were mixed and carefully applied onto 20 ul-tra-thin cover glasses (6 × 11 mm; Paul Marienfeld) as describedpreviously (16). Care was taken to remove all organic solvent inhigh vacuum. Thereafter, the samples were equilibrated at 93%relative humidity for several days.An alternative preparation method consisted in mixing only
the lipid in organic solvent and forming a dry film by evaporatingthe solvent and exposure to high vacuum (16, 17). Then 0.2 mL ofwater was added and a transparent vesicular suspension wasprepared (five freeze/thaw cycles between liquid nitrogen and310 K water bath). Thereafter 2 mg of peptide and 62 μg of ZnCl2were codissolved in 100 μL of water and added to the membranevesicles, vortexed, and incubated for 4 h. The mixed lipid/peptidevesicles were applied onto glass plates, dried in air overnight, andequilibrated at 93% relative humidity.Solid-stateNMRspectrawere recordedonaBrukerAvancewide-
bore NMR spectrometer operating at 9.4 T. A commercial double-resonance solid-state NMR probe modified with flattened coils ofdimensions 15 × 4 × 9 mm was used. Proton-decoupled 15N solid-state NMR spectra were acquired using a cross-polarization se-quence and processed as described previously (18). The temperaturewas 310 K for 1-palmitoyl-2-oleoyl-sn-glycero-3-phosphoetha-nolamine (POPE)/1-palmitoyl-2-oleoyl-sn-glycero-3-phospho(1′-rac-glycerol) (POPG) and 295 K for 1-palmitoyl-2-oleoyl-sn-glycero-3-phosphocholine (POPC) and DPhPC/cholesterol 9:1membranes. NH4Cl (40.0 ppm) was used as an external referencecorresponding to 0 ppm for liquid NH3. An exponential apod-ization function corresponding to a line broadening of 50 Hz wasapplied before Fourier transformation.Deuterium solid-state NMR spectra were recorded using
a quadrupolar echo pulse sequence (19). The spectra were ref-erenced relative to 2H2O (0 Hz). An exponential apodizationfunction corresponding to a line broadening of 500 Hz (for the2H3-peptide) or 30 Hz (for chain deuterated lipids) was appliedbefore Fourier transformation. The deuterium order parametersare analyzed following reference (20).To verify the alignment of the lipids, proton-decoupled 31P
solid-state NMR spectra were recorded using a Hahn-echo pulsesequence as described previously (18) and referenced relative to85% phosphoric acid (0 ppm).
Calculation of Orientational Restraints from the Solid-State NMRSpectra. To evaluate the peptide orientations that agree withthe experimental spectra, a coordinate system was defined, withthe tilt angle being the angle between the long axis of the helixand the membrane normal, and a pitch angle between membranenormal and the line within the arbitrary plane of peptide helicalwheel projection (see Fig. S2B for angle definition). The calcu-lations were performed using the15N chemical shift main tensorelements for glycine (44, 65, 211) ppm (21) to agree with anisotropic chemical shift of 106.7 ppm and 74 kHz for the maxi-mum quadrupolar splitting for the alanine 2H3C-group at roomtemperature (22). The coordinates of DCD were frompdb:2ymk. By successively changing the tilt and pitch angles in(50 × 50 steps), the 3D topological space was systematically
Song et al. www.pnas.org/cgi/content/short/1214739110 1 of 9

screened and the corresponding 15N chemical shift and quad-rupolar splitting calculated (19). The restriction plot was calcu-lated using azimuthal fluctuations of 18° Gaussian distributionand wobbling motions of 10°, similar to those which have beenobserved for other in-plane amphipathic helical peptides (e.g.,refs. 23, 24). Contour plots mark the angular restrictions thatagree with the experimental results.
Molecular Dynamics Simulations. All molecular dynamics (MD)simulations were performed with the GROMACS package,version 4.5 (25, 26) in combination with the CHARMM36 forcefield (27). Unless otherwise stated, the simulation temperaturewas 310 K. The protein, lipids, and water/ions were coupledseparately to a temperature bath with the v-rescale method witha time constant of 0.1 ps (28). Short-range electrostatics werecalculated with a cutoff of 1.3 nm. Long-range electrostatics weretreated with the particle-mesh Ewald method (29, 30). Short-range Van der Waals (VdW) interactions were calculated ex-plicitly up to a distance of 0.8 nm, beyond which a switch func-tion was used to smoothly switch off the VdW interactions toreach zero at 1.2 nm. All bonds were constrained with the LINCSmethod (31). The time step was 2 fs for all-atom MD simulationsand 4 fs for simulations with the virtual site model for hydrogenatoms (32), respectively.The crystal structure of the DCD hexamer, as described in this
study, was used to generate the initial configuration for our MDsimulations. Specifically, the protein and six Zn2+ ions at themonomeric interfaces of the DCD oligomer were taken from thecrystal structure, which was then embedded into a mixed bilayerof palmitoyloleoyl-phosphatidylethanolamine and palmitoylo-leoylphosphatidylglycerol (POPE/POPG; 3:1) lipids, which re-sembles the composition of the bacterial cytoplasmic membrane(33). To test the tilting of DCD in various bilayer environments,additional simulations were carried out in dimyristoyl phospha-tidylcholine (DMPC), dipalmitoyl phosphatidylcholine (DPPC),distearoyl phosphatidylcholine (DSPC), and diarachidonoylphosphatidylcholine (DAPC) lipid bilayers. All membranes weregenerated with CHARMM-GUI (34).The POPE/POPG bilayer consisted of 72 POPE and 24 POPG
molecules in each bilayer leaflet, solvated by 13,938 TIP3P watermolecules (35). Also, 82 Na+ and 38 Cl− ions were added to thesimulation system resulting in an ionic strength of about 150mM. The POPE/POPG lipids were first energy-minimized for5,000 steps with the steepest descent algorithm, then equili-brated in an NVT ensemble at 310 K for 500 ps, while positionrestraints were applied (1,000 kJ·mol−1·nm−2) on the lipid heavyatoms. Subsequently, the system was further equilibrated withoutany restraints under semi-isotropic Berendsen pressure coupling(36). The reference pressure was set to 1 bar and the pressurecoupling time constant was 1.0 ps. After ∼1 ns of simulation inthe NPT ensemble, the area per lipid reached about 0.615 nm2.This configuration was adopted for additional 15 ns of NPATsimulation to further equilibrate the system. The GROMACSutility g_membed (37) was used to insert DCD into the lipidbilayer. By comparing the lateral pressures to those of purelipids, we found that by removing nine lipid molecules, the dif-ferences between the lateral pressures of DCD-embedded andpure systems are smallest. Therefore, approximately nine lipidmolecules were removed in each leaflet before insertion of theDCD oligomer. To test convergence, we used three differentinitial configurations of the lipid bilayer in our MD simu-lations by taking frames at various points of the equilibrationsimulation (taken at 13, 14, and 15 ns from the above lipidsequilibration simulation). The antimicrobial peptide (AMP) as-sembled structure was thus inserted into three different membrane
microenvironments. The adoption of three independent initialsimulation systems can reduce possible bias on the simulationresults arising from the initial system setup. One of the resultingsingle-bilayer simulation systems is shown in Fig. S5 A and B.Starting from the three independent systems described above,
we first performed 5,000 steps of steepest descent energy mini-mization, then 10 ns of NPAT equilibration simulations with theheavy atoms of the protein and Zn2+ position restrained (1,000kJ·mol−1·nm−2). These equilibration simulations allowed watermolecules to fill the interior of the DCD oligomer. Monitoring ofthe number of water molecules showed that it no longer in-creased after 7.5 ns. Subsequently, 250-ns simulations wereperformed for all of the three systems under NPAT conditions.In addition, we performed three corresponding simulationswithout any Zn2+ in the system to investigate the importance ofZn2+ for the stability of the X-ray structure.To study whether the oligomer is ion conductive, we used the
computational electrophysiology method (38). Structures weretaken from the three single-patch simulations at 100 ns and thesystems were duplicated in the Y direction. The virtual-sitemodel was used for peptides and lipids (32). A transmembraneelectric field was generated by sustaining a slight imbalance ofions in the two compartments thus formed during the simulationby ion exchanges. This ionic imbalance evoked an electrostaticpotential gradient across the two bilayers of ± 200–800 mV inmultiple simulations, as determined by double integration ofPoisson’s equation (38). Under these conditions, six independent200-ns production simulations were performed with a time stepof 4 fs in the NPAT ensemble. The simulation system of thedouble-bilayer setup is shown in Fig. S5C.To run simulations under conditions similar to our electrophys-
iological experiments, we also carried out computational electro-physiology simulations, in which 506 Cl− and 594 Na+ ions wereincluded in the double-patch system, which resulted in an ionconcentration of ∼1 M. Here again, an equal number of Cl− ionswere included in the two compartments, and a small difference ofNa+ ions between compartment I and II was sustained during thesimulation, which generated transmembrane potentials fluctuatingin the range from ∼20 to 300 mV. Subsequently, five independentsimulations were performed to monitor ion permeation.Altogether, we performed five independent double-patch simu-
lations with 1M NaCl (200 ns each), six independent double-patchsimulations with 150 mM NaCl (200 ns each), four single-patchsimulations with various lipids (>250 ns each), three independentsingle-patch simulations (250 ns each), and three independentsingle-patch simulations in the absence of Zn2+ (200 ns each).Simulation images were generated with Pymol (Schrodinger).
Pore Size Analysis. To good approximation, the conductance ofmembrane channels is proportional to their channel cross-sectionalarea; i.e., it varies with the square of the difference of the pore radii(39). Due to the fact that the channel is composed of units ofantiparallel dermcidin dimers, it is reasonable to assume thatchannel-forming oligomers would consist of an even number of 4,6, 8, etc., peptides. By using the peptide–peptide docking softwarem-Zdock (40), which is specialized for generating symmetricalpores, we find that (i) tetrameric assemblies are not capable offorming a pore, and (ii) peptide octamers with their hydrophobicface toward the membrane would have a pore diameter of about∼11 Å. According to our calculations, this pore size would lead toa conductance above 0.5 nS. This value is more than five timeshigher than that found in our experiments. Higher-order oligomerscould be expected to have a further increased conductance. Hence,lower- or higher-order dermcidin channels are not a likely expla-nation for our experimentally measured channel currents.
Song et al. www.pnas.org/cgi/content/short/1214739110 2 of 9

1. Kabsch W (2010) Integration, scaling, space-group assignment and post-refinement.Acta Crystallogr D Biol Crystallogr 66(Pt 2):133–144.
2. Adams PD, et al. (2011) The Phenix software for automated determination ofmacromolecular structures. Methods 55(1):94–106.
3. Read RJ, McCoy AJ (2011) Using SAD data in Phaser. Acta Crystallogr D Biol Crystallogr67(Pt 4):338–344.
4. Zwart PH, et al. (2008) Automated structure solution with the PHENIX suite. MethodsMol Biol 426:419–435.
5. Winn MD, et al. (2011) Overview of the CCP4 suite and current developments. ActaCrystallogr D Biol Crystallogr 67(Pt 4):235–242.
6. Cowtan K (2006) The Buccaneer software for automated model building. 1. Tracingprotein chains. Acta Crystallogr D Biol Crystallogr 62(Pt 9):1002–1011.
7. Emsley P, Lohkamp B, Scott WG, Cowtan K (2010) Features and development of Coot.Acta Crystallogr D Biol Crystallogr 66(Pt 4):486–501.
8. Murshudov GN, et al. (2011) REFMAC5 for the refinement of macromolecular crystalstructures. Acta Crystallogr D Biol Crystallogr 67(Pt 4):355–367.
9. Schwede T, Kopp J, Guex N, Peitsch MC (2003) SWISS-MODEL: An automated proteinhomology-modeling server. Nucleic Acids Res 31(13):3381–3385.
10. Gasteiger E, et al. (2003) ExPASy: The proteomics server for in-depth proteinknowledge and analysis. Nucleic Acids Res 31(13):3784–3788.
11. Altschul SF, Gish W, Miller W, Myers EW, Lipman DJ (1990) Basic local alignmentsearch tool. J Mol Biol 215(3):403–410.
12. Jones DT (1999) Protein secondary structure prediction based on position-specificscoring matrices. J Mol Biol 292(2):195–202.
13. Angelova MI, Dimitrov DS (1986) Liposome electroformation. Faraday Discuss ChemSoc 81:303–311.
14. Angelova M, Dimitrov D (1988) A mechanism of liposome electroformation. Trends inColloid and Interface Science II, ed Degiorgio V (Springer, Berlin), pp 59–67.
15. Angelova M (2000) Giant vesicles. Perspectives in Supramolecular Chemistry, edsLuisi PL, Walde P (Wiley-Interscience Chichester, UK), 1st Ed, pp 27–36.
16. Aisenbrey C, Bertani P, Bechinger B (2010) Solid-state NMR investigations ofmembrane-associated antimicrobial peptides. Methods Mol Biol 618:209–233.
17. Aisenbrey C, Michalek M, Salnikov E, Bechinger B (2013) Lipid-Protein Interactions:Methods and Protocols (Methods in Molecular Biology), ed Jh K (Springer, New York).
18. Salnikov ES, et al. (2011) Structure and alignment of the membrane-associatedantimicrobial peptide arenicin by oriented solid-state NMR spectroscopy. Biochemistry50(18):3784–3795.
19. Aisenbrey C, Bechinger B (2004) Tilt and rotational pitch angle of membrane-insertedpolypeptides from combined 15N and 2H solid-state NMR spectroscopy. Biochemistry43(32):10502–10512.
20. Bechinger B, Salnikov ES (2012) The membrane interactions of antimicrobial peptidesrevealed by solid-state NMR spectroscopy. Chem Phys Lipids 165(3):282–301.
21. Salnikov E, Bertani P, Raap J, Bechinger B (2009) Analysis of the amide (15)N chemicalshift tensor of the C(α) tetrasubstituted constituent of membrane-active peptaibols,
the α-aminoisobutyric acid residue, compared to those of di- and tri-substitutedproteinogenic amino acid residues. J Biomol NMR 45(4):373–387.
22. Batchelder LS, Niu CH, Torchia DA (1983) Methyl reorientation in polycrystallineamino acids and peptides: A deuteron NMR spin-lattice relaxation study. J Am ChemSoc 105:2228–2231.
23. Strandberg E, Esteban-Martín S, Salgado J, Ulrich AS (2009) Orientation and dynamicsof peptides in membranes calculated from 2H-NMR data. Biophys J 96(8):3223–3232.
24. Michalek M, Salnikov ES, Werten S, Bechinger B (2013) Membrane interactions of theamphipathic amino-terminus of huntingtin. Biochemistry 52(5):847–858.
25. Berendsen HJC, van der Spoel D, van Drunen R (1995) GROMACS: A message-passingparallel molecular dynamics implementation. Comput Phys Commun 91:43–56.
26. Hess B, Kutzner C, van der Spoel D, Lindahl E (2008) GROMACS 4: Algorithms forhighly efficient, load-balanced, and scalable molecular simulation. J Chem TheoryComput 4:435–447.
27. Klauda JB, et al. (2010) Update of the CHARMM all-atom additive force field for lipids:Validation on six lipid types. J Phys Chem B 114(23):7830–7843.
28. Bussi G, Donadio D, Parrinello M (2007) Canonical sampling through velocityrescaling. J Chem Phys 126(1):014101.
29. Darden T, York D, Pedersen L (1993) Particle mesh Ewald: An N· log (N) method forEwald sums in large systems. J Chem Phys 98:10089.
30. Essmann U, et al. (1995) A smooth particle mesh Ewald method. J Chem Phys 103:8577–8593.
31. Hess B, Bekker H, Berendsen HJC, Fraaije JGEM (1997) LINCS: A linear constraint solverfor molecular simulations. J Comput Chem 18:1463–1472.
32. Feenstra KA, Hess B, Berendsen HJC (1999) Improving efficiency of large time-scalemolecular dynamics simulations of hydrogen-rich systems. J Comput Chem 20:786–798.
33. Murzyn K, Róg T, Pasenkiewicz-Gierula M (2005) Phosphatidylethanolamine-phosphatidylglycerol bilayer as a model of the inner bacterial membrane. Biophys J88(2):1091–1103.
34. Jo S, Kim T, Iyer VG, Im W (2008) CHARMM-GUI: A web-based graphical user interfacefor CHARMM. J Comput Chem 29(11):1859–1865.
35. Jorgensen WL, Chandrasekhar J, Madura JD, Impey RW, Klein ML (1983) Comparisonof simple potential functions for simulating liquid water. J Chem Phys 79:926–935.
36. Berendsen HJC, Postma JPM, Van Gunsteren WF, DiNola A, Haak JR (1984) Moleculardynamics with coupling to an external bath. J Chem Phys 81:3684–3690.
37. Wolf MG, Hoefling M, Aponte-Santamaría C, Grubmüller H, Groenhof G (2010)g_membed: Efficient insertion of a membrane protein into an equilibrated lipidbilayer with minimal perturbation. J Comput Chem 31(11):2169–2174.
38. Kutzner C, Grubmüller H, de Groot BL, Zachariae U (2011) Computationalelectrophysiology: The molecular dynamics of ion channel permeation and selectivityin atomistic detail. Biophys J 101(4):809–817.
39. Hille B (2001) Ion channels of excitable membranes (Sinauer, Sunderland, MA), 3rd Ed.40. Pierce B, Tong W, Weng Z (2005) M-ZDOCK: A grid-based approach for Cn symmetric
multimer docking. Bioinformatics 21(8):1472–1478.
Song et al. www.pnas.org/cgi/content/short/1214739110 3 of 9

Fig. S1. Sequence and structural analysis of human DCD. (A) Sequence alignment of human DCD (isoform 1) and sequences deposited to the current EXPASYsequence database (www.expasy.org). Four sequences similar to DCD were extracted with a PSI-BLAST search, one of which is a second human isoform, and theremaining three sequences are derived from monkey genomes. Hydrophobic residues are colored in green, positively charged residues are blue, and negativelycharged residues are red. Residues involved in Zn binding are marked and the similarity between the sequences chosen is represented by (*) for identicalresidues and (:) for similar residues. In addition, the secondary structure as predicted by PSIPRED is shown. (B) Analysis of the sequence for repetitive elements.The peptides show three of those elements (residue numbers are provided). (C) Amphipathic plot of the DCD peptide with Kyte–Doolittle values. (D) Analysis ofthe two peptide interfaces. Each peptide in the hexameric DCD structure faces two differently oriented peptide neighbors. Therefore, two different interfacesare formed, which are analyzed here with the PISA server software (http://www.ebi.ac.uk/msd-srv/prot_int/pistart.html). The size of the interfaces is given inÅngstrom and the residues important for interface stabilization are mentioned together with the residue numbers and distances.
Fig. S2. ss-NMR helix tilt/pitch angles. (A) The tilt/pitch angular pairs that agree with the 15N chemical shift and the 2H quadrupolar splitting observed inoriented POPE/POPG 3/1 (including error bars) are shown by the red and black traces, respectively. (B) The energetically most probable alignment is sche-matically illustrated. Neutral Leu, Val are colored in green, charged Lys, Glu and Asp in red, and Ala25 is in magenta.
Song et al. www.pnas.org/cgi/content/short/1214739110 4 of 9

Fig. S3. 2H ss-NMR spectra and order parameters of 2H-chain deuterated lipid membranes. (A and C) 2H solid-state NMR spectra of 2H-chain deuterated lipidmembranes and (B and D) the corresponding deuterium order parameters. The spectra are recorded at 310 K from nonoriented and fully hydrated POPE/POPG3:1 mol/mole membranes where the palmitoyl chains of either POPG (A and C) or POPE (B and D) are fully deuterated. In gray (squares) are shown the lipidsalone, in black (inverted triangles) the pure lipids in the presence of ZnCl2. The data in the presence of 2 mol % DCD are shown in blue and red (circles) in theabsence and presence of zinc, respectively. The data with and without ZnCl2 overlap in B as well as in D for the DCD/POPE/POPG mixtures.
Fig. S4. Electrophysiological measurements on the DCD mutant H38A. Even under addition of zinc ions, no specific current steps are observed.
Song et al. www.pnas.org/cgi/content/short/1214739110 5 of 9

Fig. S5. Model system used in the MD simulations. (A) The initial simulation system, which contains the X-ray structure of DCD (orange and deep blue cartoonhelices), the POPE/POPG (3:1) lipids bilayer (gray sticks), water box (light blue surface), Na+ (blue spheres), and Cl− (red spheres) ions. (B) The MD conformationafter 100-ns simulation, which was then duplicated in the membrane normal direction to form the double-patch simulation system for the computationalelectrophysiology simulations (C).
Fig. S6. Stability of the X-ray structure in MD simulations. (A) Evolution of the RMSD of the DCD oligomer (alpha carbon atoms) in the POPE/POPG bilayerduring the 250-ns MD simulations. Results are calculated from three independent simulations. (B) Comparison of the stability of the DCD X-ray structure inmembrane (blue) and solution (red). On average, the oligomer structure deviates from the X-ray structure by about 1 Å more in solution than in the mem-brane. Therefore, the X-ray channel structure is relatively more stable in a membrane environment. (C) Side and top views of the comparison between theX-ray structure (in blue) and the MD conformation at 250 ns (in red), respectively. The MD conformation was fitted onto the X-ray structure, which was thenused as the starting structure for additional computational electrophysiology simulations. (D) Importance of Zn2+ ions for the stability of the oligomer channel.Starting with the initial oligomer structure in the single-patch MD simulations, the channel structure is preserved in the MD simulations in the presence of sixZn2+ ions. By contrast the channel structure evolves strong distortions in the absence of Zn2+.
Song et al. www.pnas.org/cgi/content/short/1214739110 6 of 9

Fig. S7. Additional simulation results. (A) Evolution of the tilt angle of the DCD channel in various lipid bilayers in MD simulations. The simulations wereperformed in an NPT ensemble at a temperature of 345 K to keep all lipids in their fluid phase. As can be seen with the increase of the lipid tail length, i.e., thethickness of the bilayer, the tilt angle of the DCD channel decreases. In DPPC, the tilting process occurs on a much longer time scale than in the other lipidbilayers. Therefore, the type of the lipid bilayer and its composition may have a significant effect on the channel properties, which we reserve for a futurestudy. (B) Exemplary ion permeation counts during the 200-ns computational electrophysiology simulations (averages from six independent simulations withSEs), with 0.15 M NaCl in solution.
Fig. S8. Helical wheel analysis of a monomer of DCD. Top view of a monomeric helical wheel, showing the distribution of residues and their types. Angularpartitions of hydrophobic/hydrophilic regions are distinctly centered around 240°/120°, favoring hexamer formation when being embedded in a lipid bilayer,as shown (Lower Left) where the gray shaded areas indicate the hydrophilic surfaces and interfaces.
Song et al. www.pnas.org/cgi/content/short/1214739110 7 of 9
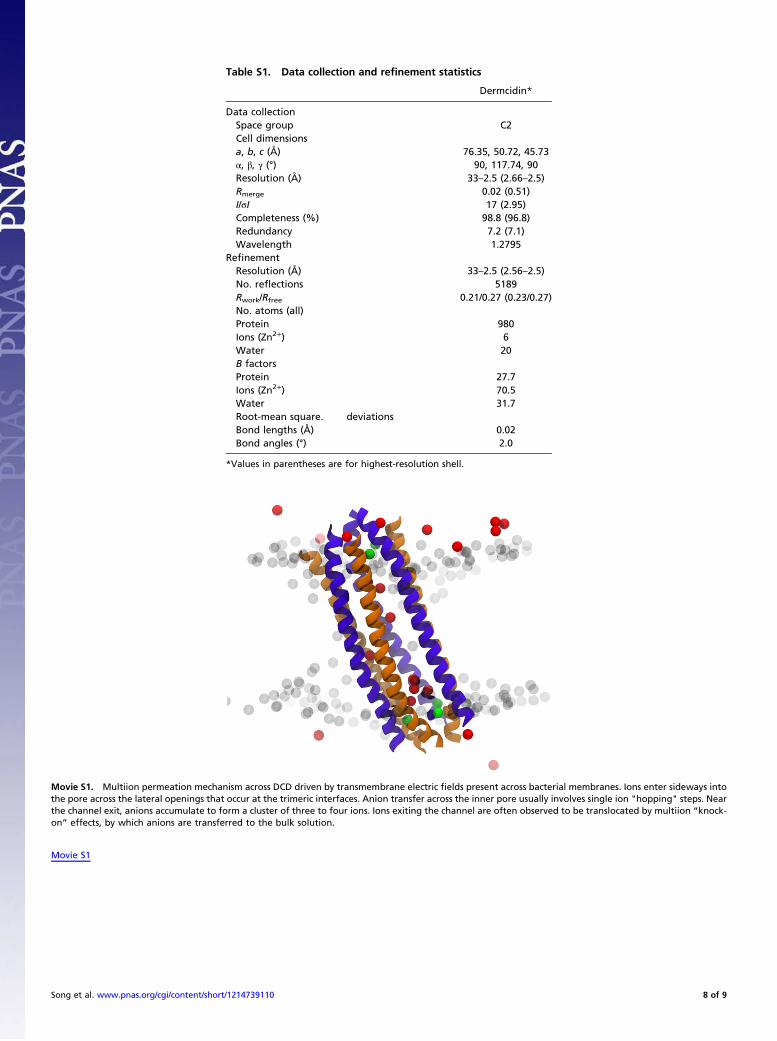
Table S1. Data collection and refinement statistics
Dermcidin*
Data collectionSpace group C2Cell dimensionsa, b, c (Å) 76.35, 50.72, 45.73α, β, γ (°) 90, 117.74, 90Resolution (Å) 33–2.5 (2.66–2.5)Rmerge 0.02 (0.51)I/σI 17 (2.95)Completeness (%) 98.8 (96.8)Redundancy 7.2 (7.1)Wavelength 1.2795
RefinementResolution (Å) 33–2.5 (2.56–2.5)No. reflections 5189Rwork/Rfree 0.21/0.27 (0.23/0.27)No. atoms (all)Protein 980Ions (Zn2+) 6Water 20B factorsProtein 27.7Ions (Zn2+) 70.5Water 31.7Root-mean square. deviationsBond lengths (Å) 0.02Bond angles (°) 2.0
*Values in parentheses are for highest-resolution shell.
Movie S1. Multiion permeation mechanism across DCD driven by transmembrane electric fields present across bacterial membranes. Ions enter sideways intothe pore across the lateral openings that occur at the trimeric interfaces. Anion transfer across the inner pore usually involves single ion "hopping" steps. Nearthe channel exit, anions accumulate to form a cluster of three to four ions. Ions exiting the channel are often observed to be translocated by multiion “knock-on” effects, by which anions are transferred to the bulk solution.
Movie S1
Song et al. www.pnas.org/cgi/content/short/1214739110 8 of 9

Movie S2. Single anion followed on its pathway through the DCD channel, driven by a transmembrane electric field. Simulations settings are identical toMovie S1, but only one permeating ion is shown to clearly illustrate the permeation pathway.
Movie S2
Song et al. www.pnas.org/cgi/content/short/1214739110 9 of 9