Gerda - Max Planck Society
36
Gerda Progress report to the LNGS scientific committee (Appendix) LNGS-EXP 33/05 add. 11/10 This Gerda report summarizes the progress achieved during the last six months. A Short Write-up is linked at: http://www.mpi-hd.mpg.de/GERDA/reportsLNGS/gerda-lngs-sc-oct10-shwup.pdf. Experimental and technical details are given in the Appendix which is linked at: http://www.mpi-hd.mpg.de/GERDA/reportsLNGS/gerda-lngs-sc-oct10-appdx.pdf. Previous reports are available at: http://www.mpi-hd.mpg.de/GERDA/reportsLNGS. October 2010
Transcript of Gerda - Max Planck Society
Gerda
Progress report to the LNGS scientific committee
(Appendix)
LNGS-EXP 33/05 add. 11/10
This Gerda report summarizes the progress achieved during the last six months. AShort Write-up is linked at:
http://www.mpi-hd.mpg.de/GERDA/reportsLNGS/gerda-lngs-sc-oct10-shwup.pdf.
Experimental and technical details are given in the Appendix which is linked at:
http://www.mpi-hd.mpg.de/GERDA/reportsLNGS/gerda-lngs-sc-oct10-appdx.pdf.
Previous reports are available at: http://www.mpi-hd.mpg.de/GERDA/reportsLNGS.
October 2010

H. Aghaeim, M. Agostini f , M. Allardt c, A.M. Bakalyarov l, M. Balata a, I. Barabanov j ,M. Barnabe-Heider f , L. Baudis r, C. Bauer f , N. Becerici-Schmidm, E. Bellotti g,h,
S. Belogurov k,j , S.T. Belyaev l, A. Bettini n,o, L. Bezrukov j , T. Bruch r, V. Brudanin d,R. Brugnera n,o, D. Budjas f , A. Caldwellm, C. Cattadori g,h, F. Cossavellam,
E.V. Demidova k, A. Denisiv j , S. Dinterm, A. Di Vacri a, A. Domula c, V. Egorov d,F. Faulstichm, A. Ferella r, K. Freund q, F. Froborg r, N. Frodyma b, A. Gangapshev j ,
A. Garfagnini n,o, S. Gazzana f,a, R. Gonzalea de Orduna e, P. Grabmayr q, K.N. Gusev l,d,V. Gutentsov j , W. Hampel f , M. Heisel f , S. Hemmerm, G. Heusser f , W. Hofmann f ,M. Hult e, L.V. Inzhechik j , J. Janicskom, J. Jochum q, M. Junker a, S. Kionanovsky j ,
I.V. Kirpichnikov k, A. Klimenko d,j , K-T. Knoepfle f , O. Kochetov d, V.N. Kornoukhov k,j ,V. Kusminov j , M. Laubenstein a, V.I. Lebedev l, B. Lehnert c, D. Lenzm, S. Lindemann f ,M. Lindner f , I. Lippi o, X. Liu p, A. Lubashevskiy f , B. Lubsandorzhiev j , B. Majorovitsm,G. Meierhofer q, I. Nemchenok d, C. O’Shaugnessym, L. Pandola a, K. Pelczar b, G. Pivato o,
F. Potenza a, A. Pullia i, S. Riboldi i, F. Ritter q, C. Rossi Alvarez o, C. Sada o,J. Schreiner f , B. Schwingenheuer f , S. Schonert f , M. Shirchenko l,d, H. Simgen f ,
A. Smolnikov d,j , L. Stanco o, F. Stelzerm, M. Tarka r, A.V. Tikhomirov l, C.A. Ur o,A.A. Vasenko k, A. Vauthm, O. Volynetsm, M. Weber f , M. Wojcik b, E. Yanovich j ,
P. Zavarise a, S.V. Zhukov l, D. Zinatulina d, F. Zocca i, K. Zuber c, G. Zuzel b,
a) INFN Laboratori Nazionali del Gran Sasso, LNGS, Assergi, Italyb) Institute of Physics, Jagellonian University, Cracow, Poland
c) Institut fur Kern- und Teilchenphysik, Technische Universitat Dresden, Dresden, Germanyd) Joint Institute for Nuclear Research, Dubna, Russia
e) Institute for Reference Materials and Measurements, Geel, Belgiumf ) Max Planck Institut fur Kernphysik, Heidelberg, Germany
g) Dipartimento di Fisica, Universita Milano Bicocca, Milano, Italyh) INFN Milano Bicocca, Milano, Italy
i) Dipartimento di Fisica, Universita degli Studi di Milano e INFN Milano, Milano, Italyj) Institute for Nuclear Research of the Russian Academy of Sciences, Moscow, Russia
k) Institute for Theoretical and Experimental Physics, Moscow, Russial) Russian Research Center Kurchatov Institute, Moscow, Russia
m) Max-Planck-Institut fur Physik, Munchen, Germanyn) Dipartimento di Fisica dell‘Universita di Padova, Padova, Italy
o) INFN Padova, Padova, Italyp) Shanghai Jiaotong University, Shanghai, China
q) Physikalisches Institut, Eberhard Karls Universit”at Tubingen, Tubingen, Germanyr) Physik Institut der Universitat Zurich, Zurich, Switzerland
Spokesperson: S. Schonert([email protected])Deputy Spokesperson: C. Cattadori
([email protected])Technical Coordinator: K.T. Knoepfle([email protected])
URL: http://www.mpi-hd.mpg.de/GERDA/
2
Contents
1 Phase I detectors and R&D for liquid argon instrumentation 41.1 Background suppression of a BEGe detector in LArGe . . . . . . . . . . . 4
2 Phase II Detectors 72.1 Phase II detector decision . . . . . . . . . . . . . . . . . . . . . . . . . . . 72.2 Purification at PPM Pure Metals GmbH . . . . . . . . . . . . . . . . . . . 72.3 Update on crystal pulling at IKZ . . . . . . . . . . . . . . . . . . . . . . . 82.4 Update on BEGe detector procurement and tests . . . . . . . . . . . . . . 92.5 Update on n-type segmented detector R&D . . . . . . . . . . . . . . . . . 9
3 Cryostat and infrastructure 10
4 Detector loading infrastructure 114.1 Clean room on top of the tank . . . . . . . . . . . . . . . . . . . . . . . . . 114.2 The commissioning lock system . . . . . . . . . . . . . . . . . . . . . . . . 124.3 Second cable arm . . . . . . . . . . . . . . . . . . . . . . . . . . . . . . . . 124.4 Final lock system . . . . . . . . . . . . . . . . . . . . . . . . . . . . . . . . 12
5 Status of Front End Electronics 14
6 DAQ electronics and online software 156.1 DAQ systems . . . . . . . . . . . . . . . . . . . . . . . . . . . . . . . . . . 156.2 Slow Control and Network infrastructure . . . . . . . . . . . . . . . . . . . 15
7 The Muon Veto 197.1 Repair and calibration . . . . . . . . . . . . . . . . . . . . . . . . . . . . . 197.2 Test of trigger conditions . . . . . . . . . . . . . . . . . . . . . . . . . . . . 197.3 The Plastic Muon Veto . . . . . . . . . . . . . . . . . . . . . . . . . . . . . 20
8 Simulations and background studies 248.1 Data analysis algorithms and infrastructures . . . . . . . . . . . . . . . . . 248.2 Background studies from radioactive sources . . . . . . . . . . . . . . . . . 26
9 Material screening 29
10 Calibration 2910.1 New sources, γ- and n-flux measurements . . . . . . . . . . . . . . . . . . . 2910.2 Calibration Source Lowering System . . . . . . . . . . . . . . . . . . . . . 3110.3 Calibration Analysis Pipeline . . . . . . . . . . . . . . . . . . . . . . . . . 32
11 Data management and quality control 35
3

1 Phase I detectors and R&D for liquid argon instru-
mentation
The activities of task group one (TG-01) focused during the last six months on i) thedeployment and operations of the non-enriched germanium diodes in Gerda and thestudies related to the 42Ar/42K signal, ii) the operation of a natural BEGe detector in theGerda low-background test-stand LArGe in order to study the background reductionachievable with a liquid argon scintillation veto combined with pulse shape analysis, andiii) on the 42Ar/42K signal in LArGe. The details of the activities of i and iii, and theachieved results are reported in the internal GSTR note on the first data taking periodwith natural detectors, which is available to the Lngs Sc. Here we briefly summarize theresults obtained with the BEGe detector operated in LArGe.
1.1 Background suppression of a BEGe detector in LArGe
The 80 mm diameter BEGe (s/n: b 09001) with 878 g mass, previously operated in theGDL liquid argon test stand [1], has been deployed in the LArGe test stand. The energyresolution of the detector inside LArGe, coupled to a (non-low background) CC2 front-end board was 2.0 keV (FWHM) at 1.33 MeV and 1.6 keV (FWHM) with the pulser. Theoperational voltage was 4000 V and the leakage current stable at about 4 pA.
Figure 1: Coincident signals of the BEGe detector (top canvas) and the PMT liquid argonscintillation (middle, zoom in bottom canvas) in LArGe.
The purpose of this measurement campaign was to study the achievable backgroundsuppression combining the liquid argon scintillation veto and the pulse shape analysisemploying the A/E method. For this purpose, a comprehensive series of measurementswas performed employing 228Th, 226Ra,60Co, 137Cs gamma sources located both close to
4
the crystal inside the liquid argon and outside of the cryostat. The germanium and liquidargon scintillation data were recorded with a FADC system and stored for the off-lineanalysis. Fig. 1 displays the FADC traces of the BEGe and the PMT signal
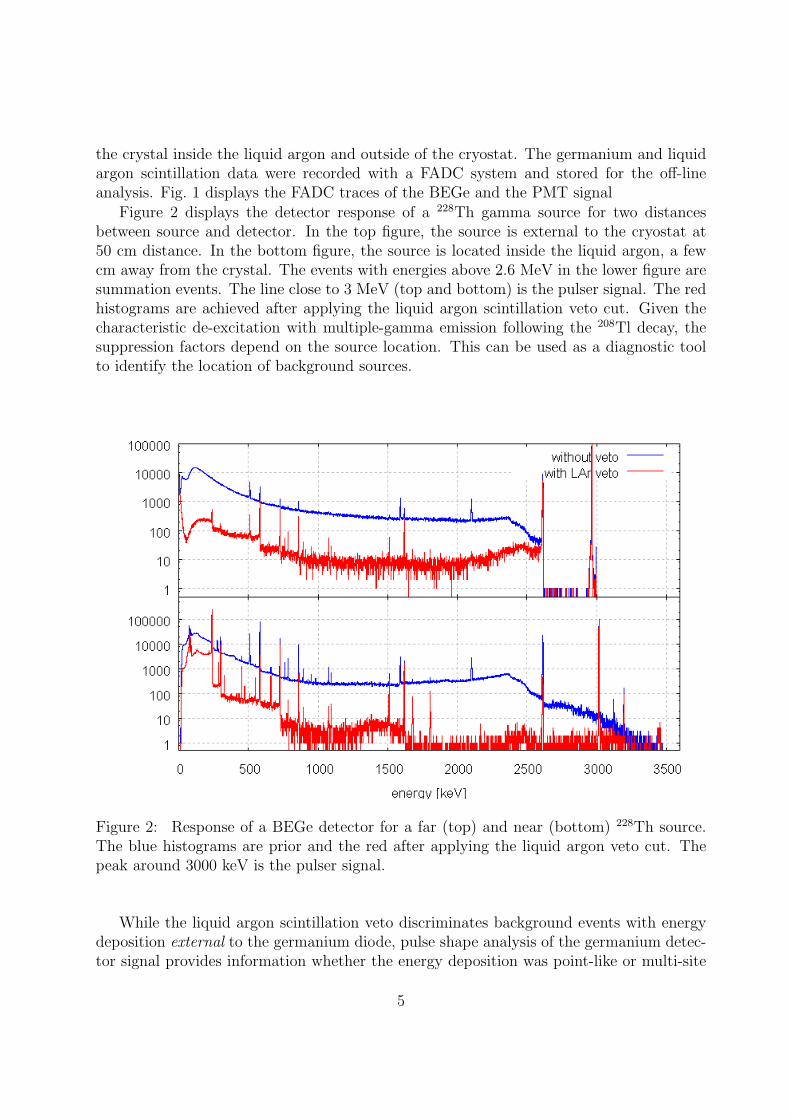
Figure 2 displays the detector response of a 228Th gamma source for two distancesbetween source and detector. In the top figure, the source is external to the cryostat at50 cm distance. In the bottom figure, the source is located inside the liquid argon, a fewcm away from the crystal. The events with energies above 2.6 MeV in the lower figure aresummation events. The line close to 3 MeV (top and bottom) is the pulser signal. The redhistograms are achieved after applying the liquid argon scintillation veto cut. Given thecharacteristic de-excitation with multiple-gamma emission following the 208Tl decay, thesuppression factors depend on the source location. This can be used as a diagnostic toolto identify the location of background sources.
Figure 2: Response of a BEGe detector for a far (top) and near (bottom) 228Th source.The blue histograms are prior and the red after applying the liquid argon veto cut. Thepeak around 3000 keV is the pulser signal.
While the liquid argon scintillation veto discriminates background events with energydeposition external to the germanium diode, pulse shape analysis of the germanium detec-tor signal provides information whether the energy deposition was point-like or multi-site
5
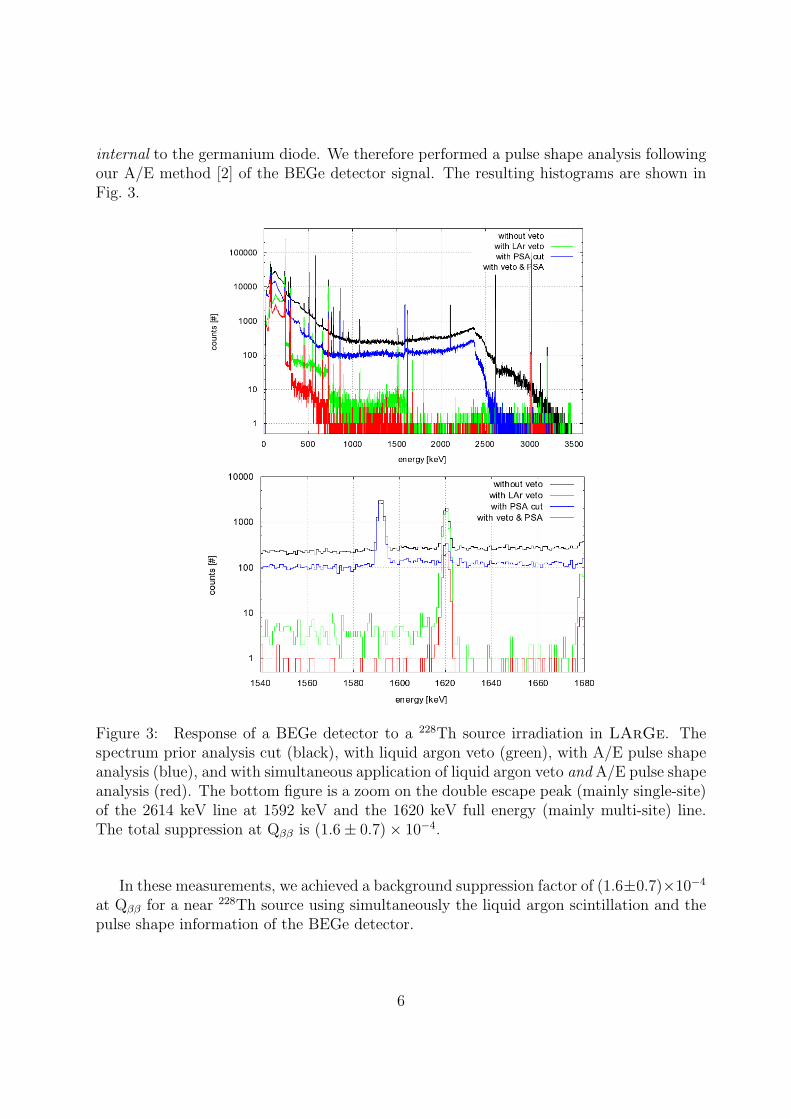
internal to the germanium diode. We therefore performed a pulse shape analysis followingour A/E method [2] of the BEGe detector signal. The resulting histograms are shown inFig. 3.
Figure 3: Response of a BEGe detector to a 228Th source irradiation in LArGe. Thespectrum prior analysis cut (black), with liquid argon veto (green), with A/E pulse shapeanalysis (blue), and with simultaneous application of liquid argon veto and A/E pulse shapeanalysis (red). The bottom figure is a zoom on the double escape peak (mainly single-site)of the 2614 keV line at 1592 keV and the 1620 keV full energy (mainly multi-site) line.The total suppression at Qββ is (1.6± 0.7)× 10−4.
In these measurements, we achieved a background suppression factor of (1.6±0.7)×10−4
at Qββ for a near 228Th source using simultaneously the liquid argon scintillation and thepulse shape information of the BEGe detector.
6
2 Phase II Detectors
Since the last scientific committee meeting, a milestone was reached and a very importantdecision was made:
• The collaboration has decided to pursue the BEGe detector technology for Phase II,and
• the purification of the enrGe for Phase II was completed successfully with very highyield of 6N material.
We give more details on these items below, as well as give updates on the crystal pulling ac-tivities at IKZ, on procurement and test of BEGe prototypes and on R&D with segmentedn-type detectors.
2.1 Phase II detector decision
As has been documented in previous reports, the BEGe detector production chain startingfrom GeO2 from ECP, reduction and purification at PPM Pure Metals, GmbH, zone refiningand crystal pulling at Canberra (Oak Ridge) and detector production at Canberra (Olen)was successfully tested. To date, five BEGe detectors have been produced from depGe(’waste’ material resulting from the enrichment procedure at ECP). The performance ofthese detectors has been excellent both for energy resolution and background suppressionvia pulse shape analysis. The active background rejection achieved with these detectors isat least as good as that achieved with segmented detectors. The fewer electronics channelsrequired compared to segmented detectors implies that the ambient background levelsshould be smaller, so that the overall performance is expected to meet our Phase II goals.The costs for these detectors is also estimated to be smaller than for the n-type segmenteddetectors. The collaboration has therefore decided to make the BEGe detectors the nominalchoice for Phase II, and negotiations have begun with Canberra on a contract for productionof ca. 20 kg of BEGe detectors. Our goal is to have the first batch of Phase II diodesavailable by the end of 2011.
We anticipate having of order 15 kg of enrGe remaining after this production run. Thismaterial will need re-purification, and this is expected to take place at PPM. We willpursue our crystal pulling research activities at IKZ. If the required crystal quality isreached, producing a further batch of detectors from IKZ crystals would be our favoredpath for processing this remaining material. The detector technology for this productionwould be determined based on the performance of the BEGe detectors in Gerda.
2.2 Purification at PPM Pure Metals GmbH
The 53.3 kg enriched GeO2 was stored in the SCK CEN Mol (Belgium) undergroundlab from April 2006 - March 2010. On the 8th of March 2010 it was transported toGoslar (Germany) for reduction and purification at PPM Pure Metals in Langelsheim
7
(near Goslar). For the time of the processing the material was stored underground in theRammelsberg mining museum in Goslar.
The total amount of GeO2 was reduced to Ge metal and purified with zone refinement.The yield of the chemical reduction was around 98%.
The first step was to reduce the GeO2 to Ge metal. Once the reduction producedenough material the zone refinement could be done in parallel. To increase the yield of thepurification the low resistivity (< 50 Ωcm) part of the refined ingot was cut off and was zonerefined again. This procedure was repeated until the left over material was insufficient tofill a zone-refining boat. At the end of the zone refining process, only a half ingot, 1.16 kg,remained that did not qualify as 6N material. The reduction and zone-refinement of theenriched material was completed on April 29th, 2010.
The overall yield of germanium metal was 97 %. This is only slightly less than the 98%yield of the reduction. Losses occurred during chemical etching and cutting of the ingots.In total 36.6 kg Ge metal was produced out of which 35.4 kg is 6N material. The overallyield of 6N material was about 94 %.
To reduce the cosmogenic activation only the material that was actually being processedwas above ground. The finished ingots were taken back in the mine within the sameday. The total average exposure during the processing including transport from Geel was125.97 h or 5.25 days.
At the end of the processing the material was packed in two aluminium boxes and leftunderground in the Rammelsberg mine to await crystal pulling and detector fabrication.
2.3 Update on crystal pulling at IKZ
The development of a reliable high quality crystal pulling setup at IKZ continued usingdepleted Ge from ECP, reduced and zone refined at PPM. To improve the quality of theinput material for the crystal puller, we produced multiply zone refined ingots at PPM.This was done using the leftover of previous crystal pulling tests and 10 kg of depletedgermanium was sent to PPM for reprocessing. In total 30 zone refinement passes weredone on each ingot, about three times more than during the usual procedure. The purifiedmaterial was delivered to IKZ in May.
In the crystals grown from the multiply zone refined material the dominant impuritiesare Al and P with a concentration of the order of 1011/cm3. All crystals show predom-inantly p-type conductivity. The impurity level in the crystals from the multiply zonerefined material is on average better, indicating that this approach holds promise for fu-ture improvements.
The dislocation density was measured on some crystals grown in the past. It was foundthat typically is between 104 and 105/cm2 about one or two orders of magnitude higherthan what is needed to produce HPGe detectors. In the future the temperature and thegrowing speed will be adjusted to produce the right number of dislocations.
Future plans to improve the crystal purity include installing a quartz tube inside thepuller to reduce the volume from where impurities can diffuse into the crystal. The firstresults with this method are expected in October.
8
2.4 Update on BEGe detector procurement and tests
Two more thick-window p-type BEGe detectors produced from depleted germanium havebeen produced and tested since the last LNGS SC meeting. In total, five diodes have beenproduced from the depleted germanium material so far. Four of them have been mountedinto vacuum cryostats while one (from P81878AA) has been tested only for it’s performanceas a diode because of it’s bevel shape. Table 1 summarizes the main characteristics of thesedetectors.
Table 1: Summary table of thick-window BEGe diodes produced from depleted germaniummaterial. The diode made from the seed end (AA) of P81878 has a strong bevel shape andonly its diode characteristics have been measured.
Crystal Slice Batch s/n Diam./Length (mm) Mass (g) FWHM (keV)P81878 AA 1st b 11008 66.0/28.0 400 N.A.P81890 CC 1st b 11009 74.5/33.0 760 1.61P81890 DD 1st b 11039 74.0/32.0 700 1.66P81878 BB 2nd b 11123 75.4/31.0 734 1.6P81886 BB 2nd b 11124 74.5/41.0 930 1.7
The selection of the crystal slices was based on the particular characteristics of thecrystal. With the P81878AA slice we investigated whether diodes can be produced fromthe seed end of the crystal. Only after removal of additional material from the conicalpart, a diode could be produced successfully. The diodes made from P81890CC and fromP81890DD were both from the 1st batch. They were produced according to the usual de-sign criteria by the manufacturer though P81890DD is from the tail end and slightly bevelshaped. Such geometry is usually not used in the commercial BEGe detector production.The crystal slices P81878BB and P81886BB were dimensioned and cut in a non-standardway in order to optimize the overall detector mass yield. Less crystal skin was removedfor P81878BB, while the length of P81886BB had been increased given the impurity lev-els of this crystal slice. All detectors show excellent energy resolution and pulse shapecharacteristics. The analysis characterization of the detectors of the 2nd batch is stillongoing.
2.5 Update on n-type segmented detector R&D
A production chain for producing polyethylene napthelate (PEN) cables is being investi-gated as a possible low-background readout for segmented n-type germanium detectors.The PEN film can be produced with low contamination levels; 238U/226Ra < 2 mBq/kg,232Th < 1.4 mBq/kg, and 40K < 3.6 mBq/kg have been measured using ultra low levelgamma spectrometry. From this substrate a flexible printed circuit (FPC) has been pro-duced for readout of the germanium detectors in a design layout that has been proven by
9
production on a polyimide Kapton substrate.A PEN readout cable has been installed on one of the 18-fold segmented prototype de-
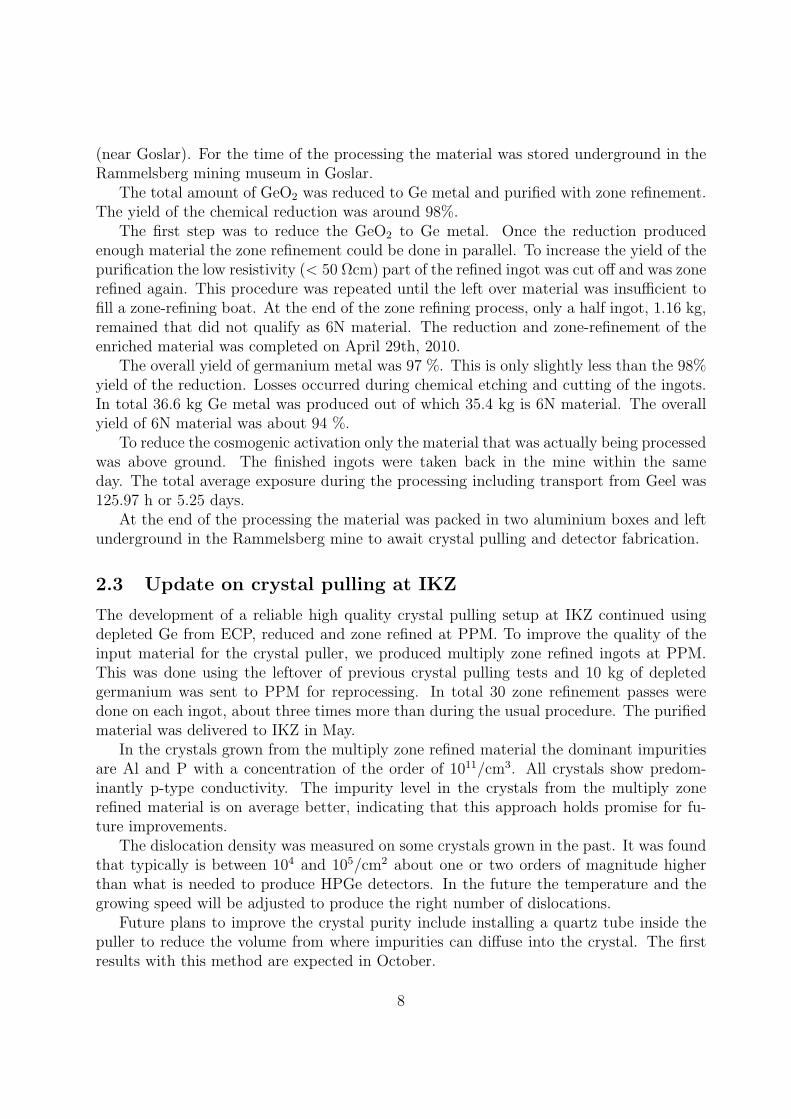
tectors. The detector used has one segment that draws increased leakage current. Thereforethe energy resolution of the corresponding segment and of the core were deteriorated. Thedetector has been operated in liquid nitrogen with the PEN readout cable. A picture isshown in Fig. 4a.) The spectrum recorded from a 60Co source on one of the typical seg-ment channels is shown in Fig. 4b.) With the exception of the core channel and channel15, the broken segment that draws a high leakage current, the obtained energy resolutionsat 1.3 MeV are with 3 keV to 5 keV commensurate with the resolutions recorded with theequivalent cable produced on a polyimide substrate as published earlier [3].
E [keV]200 400 600 800 1000 1200 14000
20
40
60
80
100
120
140
160
180
a.) b.)
Figure 4: a.) Photograph of the 18-fold segmented n-type HPGe detector with PEN cablefor signal transmission installed, and b.) the 60Co spectrum as recorded from one of thesegments of the detector.
3 Cryostat and infrastructure
The operation of the cryostat is very stable since it was filled in December 2009. Thevacuum pressure is stable at 3 × 10⁻⁸ mbar, the active cooling with liquid nitrogen isworking such that no argon was refilled since January 2010, the pressure regulation keepsthe absolute pressure at 1.2 bar with a variation of less than 50 mbar and the monitoringand PLC control is running continuously.
During a refilling of the nitrogen storage tank, the operator let the tank pressure riseabove 10 bar which triggered the safety valve on our transfer line and cause a spill of liquidnitrogen. This the only incident since the operation started.
The water drainage is controlled by the cryostat PLC. In a test performed in May wemanaged to empty the entire water tank in less than two hours while keeping the maximumflow rate below 70 l/sec. This is achieved by adjusting the opening angle of a butterflyvalve which was added in the drainage pipe. The only hardware piece missing is a drainagepipe to the “GNO” pits to reduce the time for emptying further.
10
4 Detector loading infrastructure
4.1 Clean room on top of the tank
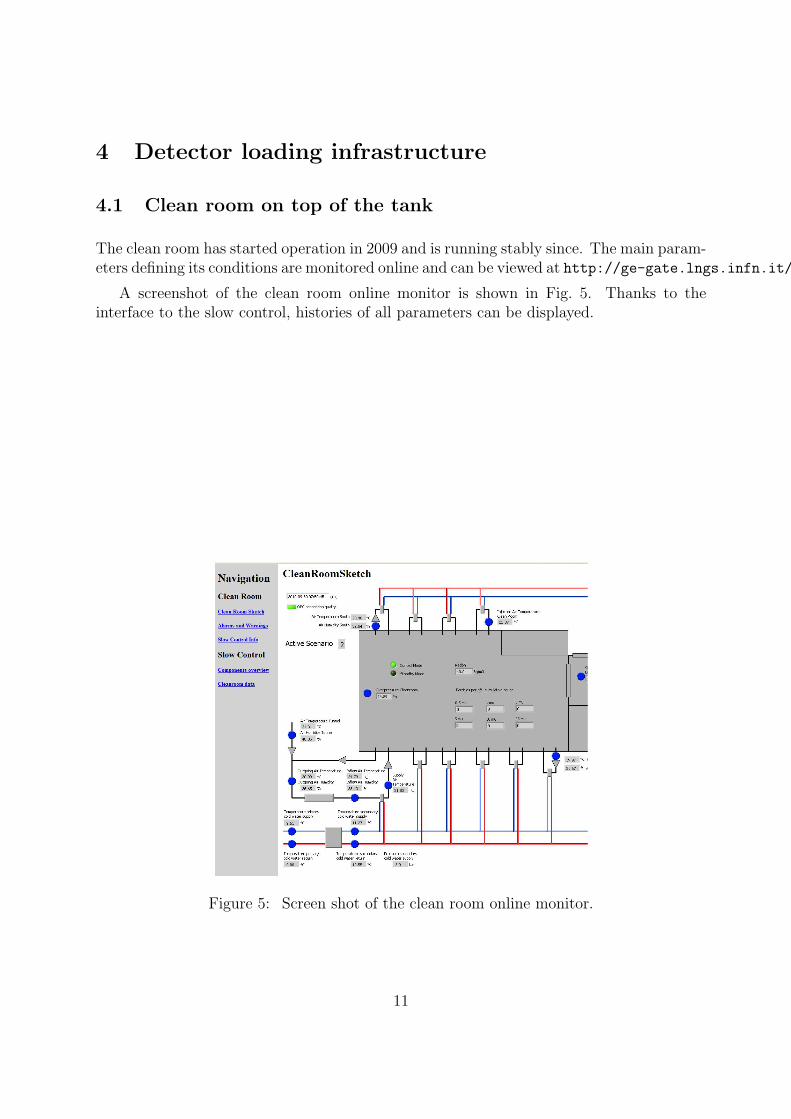
The clean room has started operation in 2009 and is running stably since. The main param-eters defining its conditions are monitored online and can be viewed at http://ge-gate.lngs.infn.it/cleanr/.
A screenshot of the clean room online monitor is shown in Fig. 5. Thanks to theinterface to the slow control, histories of all parameters can be displayed.
Figure 5: Screen shot of the clean room online monitor.
11
4.2 The commissioning lock system
The infrastructure to lower three detectors into the cryostat has been installed in hall Ain March 2010. The associated PLC as well as gas- and vacuum system were installedin April and May 2010. To test the system a first detector dummy was released into theliquid Argon tank on 10th of May 2010. The cable arm with three HPGe detectors is usedfor the first background measurements since.
4.3 Second cable arm
A second cable arm is presently being prepared at MPI fur Physik in Munich, Germanyfor installation in hall A. This cable arm will have enough space to install three strings ofdetectors.
The additional weight requirements due to the increase from one to three strings andthe increased number of signal transmission and HV lines made a modification of somecomponents of the linear pulley system necessary. Instead of the steel wire holding themovable deflection pulley a steel band on a modified drum was designed, tested and imple-mented. Stress tests revealed that even a damaged steel rope does not break at a weightof 200 kg, which is roughly a factor of five safety margin.
Signal transmission lines and HV cables have been interwoven with PTFE thread intoflat band cables. A flat steel band was included inside the cable chain as a gliding surface forthe cable bundles. With this solution, the required number of cables can be implementedinto the cable chain.
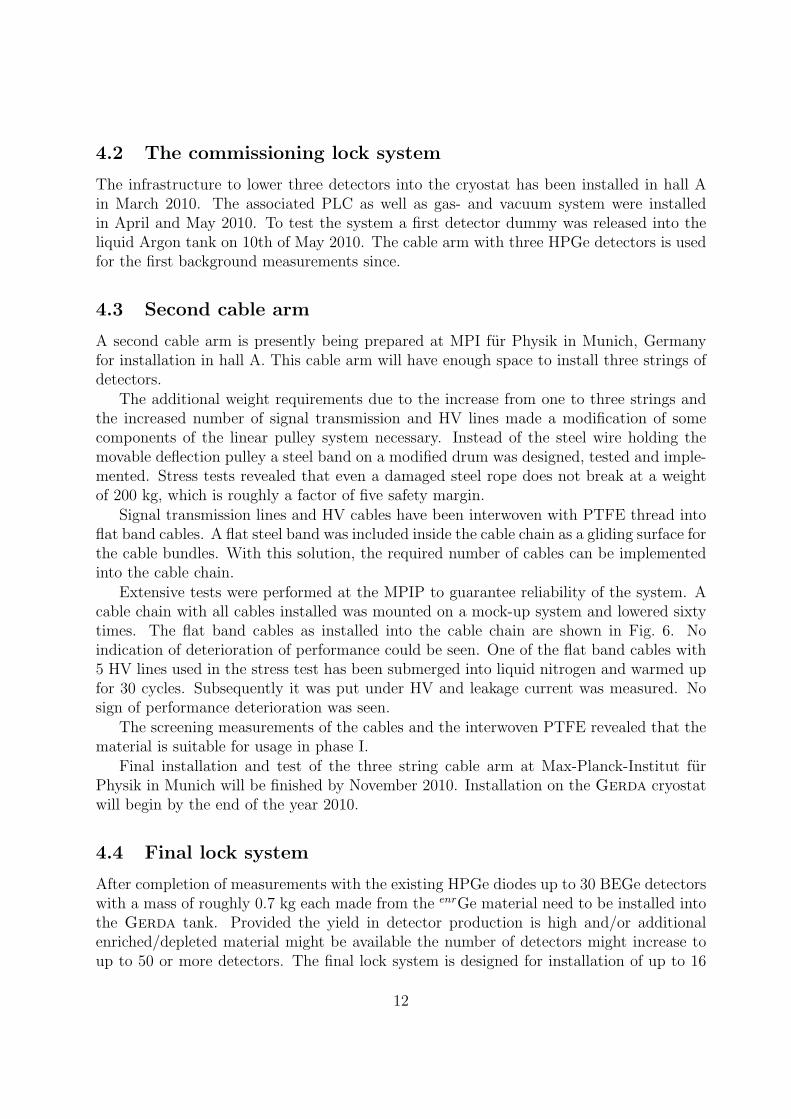
Extensive tests were performed at the MPIP to guarantee reliability of the system. Acable chain with all cables installed was mounted on a mock-up system and lowered sixtytimes. The flat band cables as installed into the cable chain are shown in Fig. 6. Noindication of deterioration of performance could be seen. One of the flat band cables with5 HV lines used in the stress test has been submerged into liquid nitrogen and warmed upfor 30 cycles. Subsequently it was put under HV and leakage current was measured. Nosign of performance deterioration was seen.
The screening measurements of the cables and the interwoven PTFE revealed that thematerial is suitable for usage in phase I.
Final installation and test of the three string cable arm at Max-Planck-Institut furPhysik in Munich will be finished by November 2010. Installation on the Gerda cryostatwill begin by the end of the year 2010.
4.4 Final lock system
After completion of measurements with the existing HPGe diodes up to 30 BEGe detectorswith a mass of roughly 0.7 kg each made from the enrGe material need to be installed intothe Gerda tank. Provided the yield in detector production is high and/or additionalenriched/depleted material might be available the number of detectors might increase toup to 50 or more detectors. The final lock system is designed for installation of up to 16
12
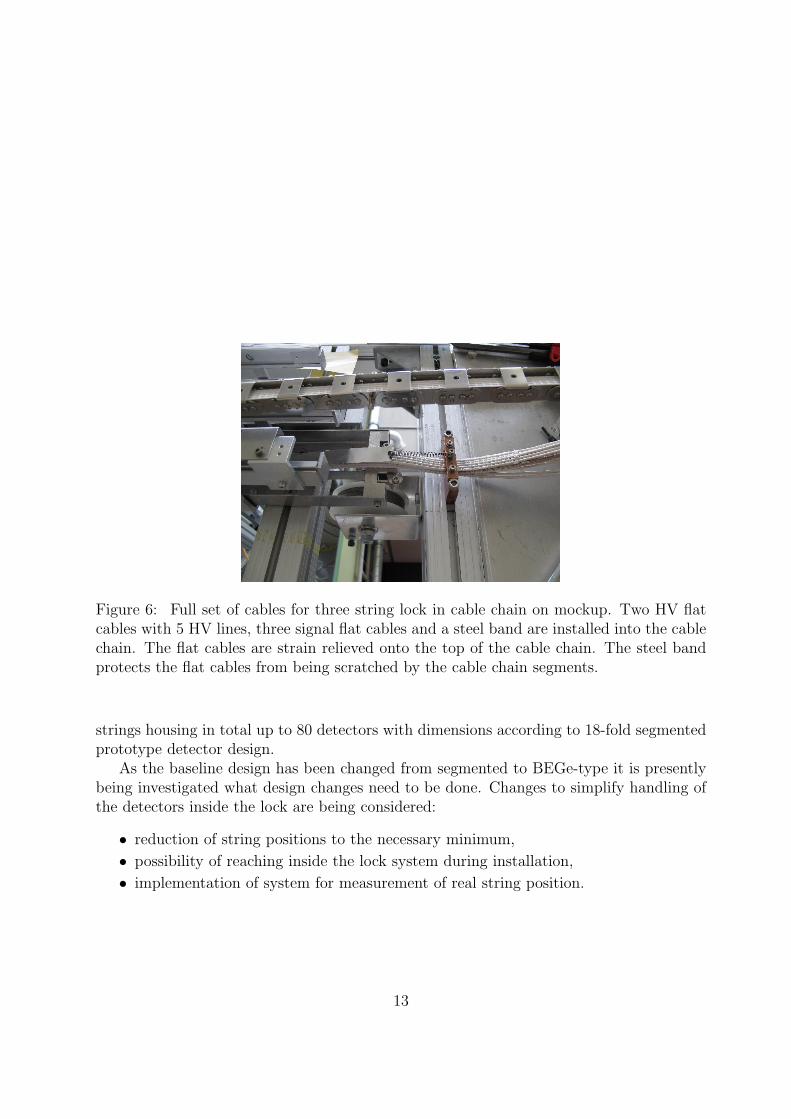
Figure 6: Full set of cables for three string lock in cable chain on mockup. Two HV flatcables with 5 HV lines, three signal flat cables and a steel band are installed into the cablechain. The flat cables are strain relieved onto the top of the cable chain. The steel bandprotects the flat cables from being scratched by the cable chain segments.
strings housing in total up to 80 detectors with dimensions according to 18-fold segmentedprototype detector design.
As the baseline design has been changed from segmented to BEGe-type it is presentlybeing investigated what design changes need to be done. Changes to simplify handling ofthe detectors inside the lock are being considered:
• reduction of string positions to the necessary minimum,
• possibility of reaching inside the lock system during installation,
• implementation of system for measurement of real string position.
13
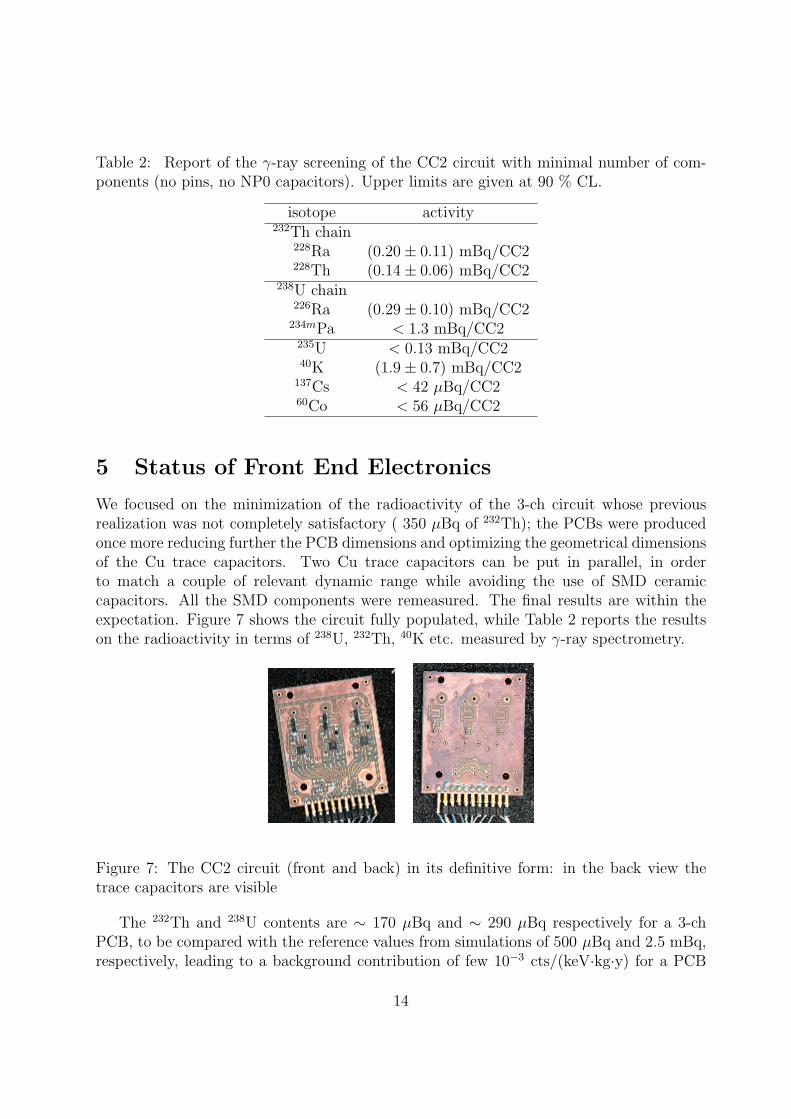
Table 2: Report of the γ-ray screening of the CC2 circuit with minimal number of com-ponents (no pins, no NP0 capacitors). Upper limits are given at 90 % CL.
isotope activity232Th chain
228Ra (0.20± 0.11) mBq/CC2228Th (0.14± 0.06) mBq/CC2
238U chain226Ra (0.29± 0.10) mBq/CC2
234mPa < 1.3 mBq/CC2235U < 0.13 mBq/CC240K (1.9± 0.7) mBq/CC2
137Cs < 42 µBq/CC260Co < 56 µBq/CC2
5 Status of Front End Electronics
We focused on the minimization of the radioactivity of the 3-ch circuit whose previousrealization was not completely satisfactory ( 350 µBq of 232Th); the PCBs were producedonce more reducing further the PCB dimensions and optimizing the geometrical dimensionsof the Cu trace capacitors. Two Cu trace capacitors can be put in parallel, in orderto match a couple of relevant dynamic range while avoiding the use of SMD ceramiccapacitors. All the SMD components were remeasured. The final results are within theexpectation. Figure 7 shows the circuit fully populated, while Table 2 reports the resultson the radioactivity in terms of 238U, 232Th, 40K etc. measured by γ-ray spectrometry.
Figure 7: The CC2 circuit (front and back) in its definitive form: in the back view thetrace capacitors are visible
The 232Th and 238U contents are ∼ 170 µBq and ∼ 290 µBq respectively for a 3-chPCB, to be compared with the reference values from simulations of 500 µBq and 2.5 mBq,respectively, leading to a background contribution of few 10−3 cts/(keV·kg·y) for a PCB
14
placed at 30 cm from the top detector (3 string simulated). We believe that this is theminimal value obtainable with the present architecture. As soon as the measurements froma new batch of soldering wire will be available, we will mount 8 PCBs with the availablescreened components.
One of the new low activity PCBs has been installed on 14th August in LArGe toread out the GTF detector, and it allowed the reduction of the background of a significantfactor.
6 DAQ electronics and online software
6.1 DAQ systems
Since June, the first detector string is operating in Gerda. While the first data taking wasdone with a multi channel analyzer (MCA), we are now taking data with a FADC system.We have tested both systems: the one using the commercial SIS3301 VME modules and thecustom-built system. The resolution achieved with these systems are similar now (typicallybetween 4.5 and 6 keV FWHM for the 2.6 MeV 208Tl line) but somewhat worse than theone measured with the MCA (3.8-4.5 keV). The most likely reason is the low gain of thepreamplifier of 0.55 mV per MeV energy deposition. This will be improved soon. For theunderstanding of the background these performance numbers are acceptable.
For the custom-built system, the graphical user interface was improved. The settingof trigger thresholds and monitoring of baselines to measure detector leakage currents wasfinalized.
The muon DAQ is running as well and providing a veto signal which is included in thediode readout stream. The final integration between the muon and germanium readoutwill take place when the background data taking is finished.
Still to be done is the storage of run based information like trigger settings and ratesin the slow control database.
6.2 Slow Control and Network infrastructure
The underground Gerda network infrastructure has been enriched with a new server(GerdaServer tier0) with the following characteristics:
• dual Xenon 5520 CPU (1.86 GHz);
• 12 GBytes RAM (6 × 2 GBytes);
• RAID Adaptec 5805 controller;
• 8 SATA II disks, 2 TBytes each, 7200 RPM (server edition).
The disk space has been configured in RAID 5 with two partitions:
• 100 Gbytes for the OS (Debian Etch);
• 14 TBytes for data (xfs file system).
15
The data partition is exported via NFS and used to store Ge DAQ data and Veto DAQdata files. Batch scripts were started to copy files to the LNGS computing center.
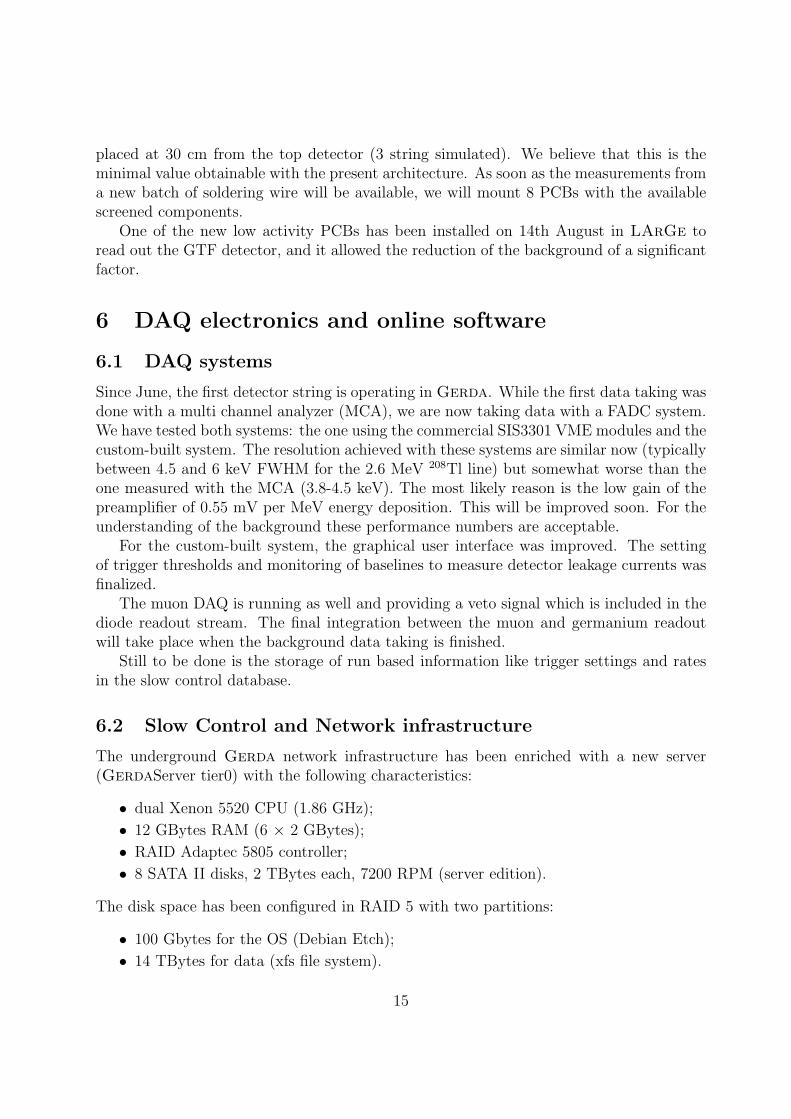
The integration of the various sub-components has carried on. With respect to the lastreport (April 2010) the following components were integrated: water loop, temperaturesensors of the room containing the Ge electronics and DAQ, VME and NIM crates. Forexample, Fig. 8 exhibits the values of temperatures registered in the rack hosting the GeDAQ.
Figure 8: Ge DAQ rack temperature versus time.
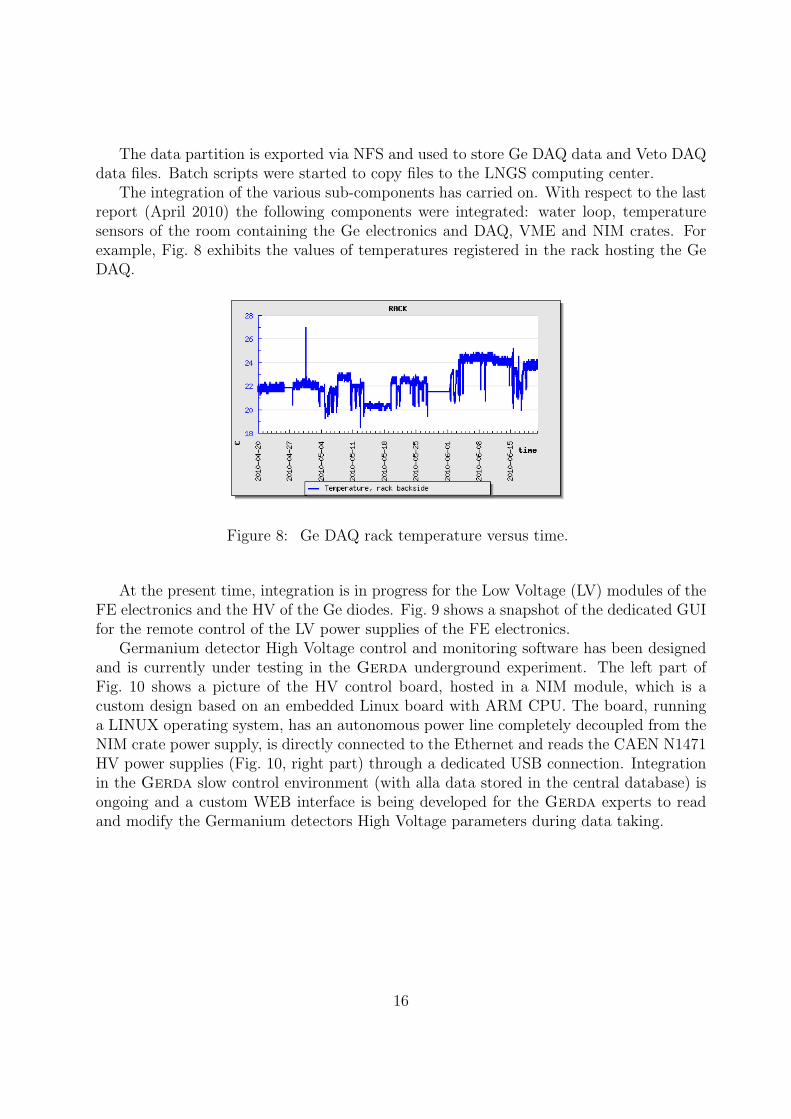
At the present time, integration is in progress for the Low Voltage (LV) modules of theFE electronics and the HV of the Ge diodes. Fig. 9 shows a snapshot of the dedicated GUIfor the remote control of the LV power supplies of the FE electronics.
Germanium detector High Voltage control and monitoring software has been designedand is currently under testing in the Gerda underground experiment. The left part ofFig. 10 shows a picture of the HV control board, hosted in a NIM module, which is acustom design based on an embedded Linux board with ARM CPU. The board, runninga LINUX operating system, has an autonomous power line completely decoupled from theNIM crate power supply, is directly connected to the Ethernet and reads the CAEN N1471HV power supplies (Fig. 10, right part) through a dedicated USB connection. Integrationin the Gerda slow control environment (with alla data stored in the central database) isongoing and a custom WEB interface is being developed for the Gerda experts to readand modify the Germanium detectors High Voltage parameters during data taking.
16
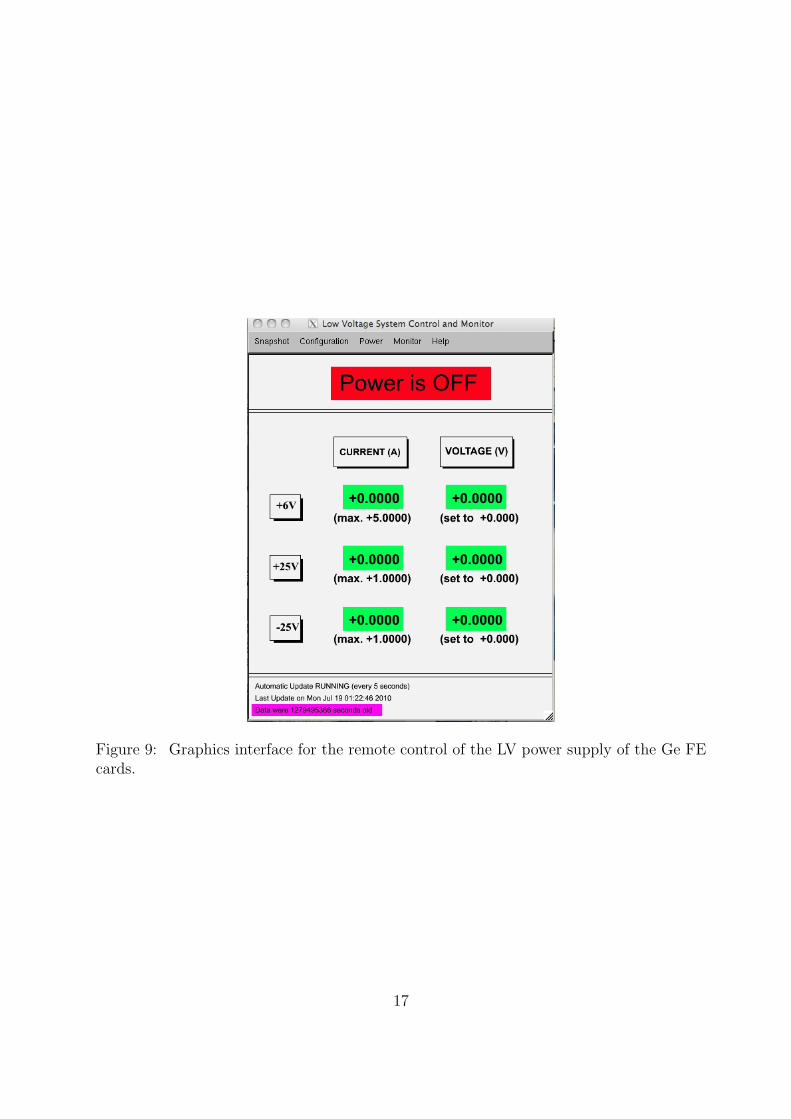
Figure 9: Graphics interface for the remote control of the LV power supply of the Ge FEcards.
17
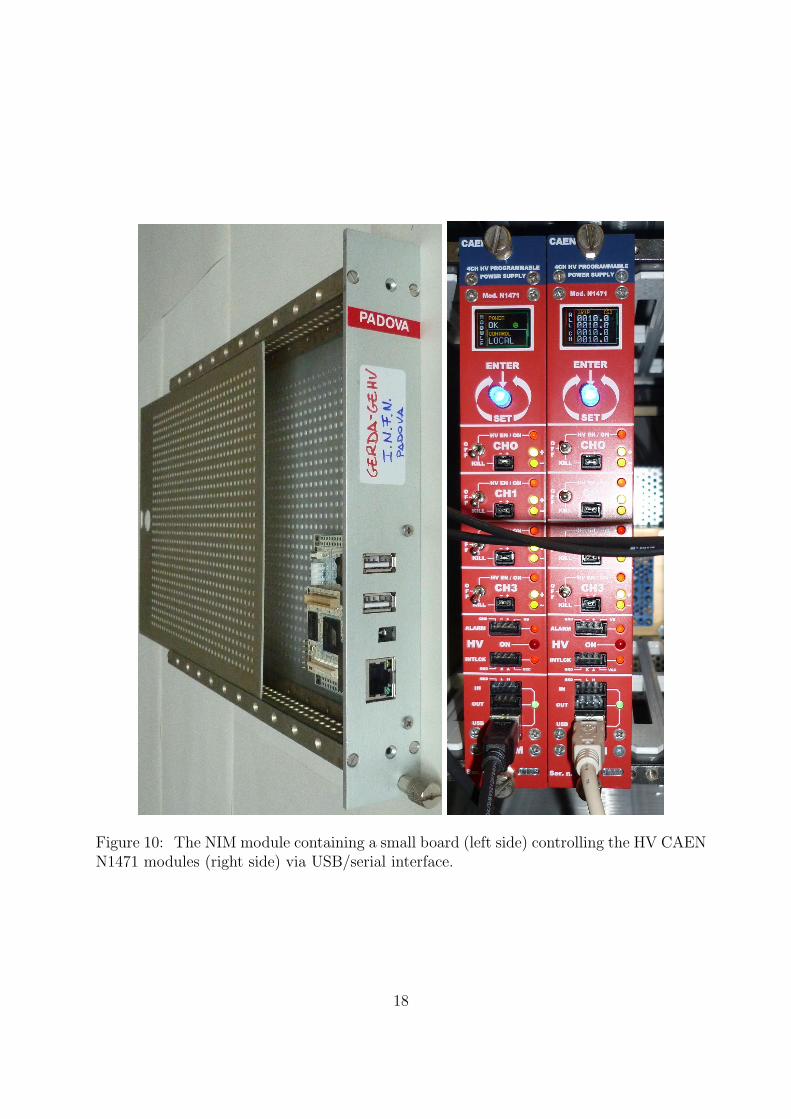
Figure 10: The NIM module containing a small board (left side) controlling the HV CAENN1471 modules (right side) via USB/serial interface.
18
7 The Muon Veto
7.1 Repair and calibration
Due to the water drainage for a safety test the photomultipliers of the Cerenkov muonveto [4] could not be tested when submerged immediately after the installation in 2009.Only in early summer 2010 the water level could be raised above 6 m to submerge allPMTs. As it turned out, one of the cables was damaged during installation, one PMTwas not working. The latter could be replaced by cutting the cable and substituting aspare PMT with the equivalent length of cable. The damaged cable could not be replaceddue to problems of access and this PMT remains out of order until repair during a longershut down period. The Monte Carlo simulation indicate that the loss of this PMT on thebottom of the water tank does not reduce the efficiency of the muon veto significantly.Even if a second PMT would be lost, the efficiency remains at a level of ∼99,4 %.
By use of the diffuser balls a calibration of the response of the PMTs was achieved.A low intensity was chosen to find the one-photon response and adjust the HV such thatthis intensity falls into channel 80 (-80 resp.) of the FADC for all PMTs. The goodreflectivity of the VM2000 foils allowed to fire all PMTs in a single measurement with allfive diffuser balls shining simultaneously. We are checking if more complicated procedureswill be needed for refined tuning.
This adjustment was also part of the setup of the FADC and DAQ system providedoriginally by the MPI in Heidelberg. A quick commissioning of the DAQ was sufficientto establish the main features of the muon veto and to permit a first rough veto signalto augment the tests of the Ge-array. Presently, a low level trigger signal from the muonveto is fed into the DAQ of the Ge-detectors. No pulse heights are recorded, only the timecorrelation between the muon and the Ge-diode signals. Evaluating the coincidence givesan upper limit of the muon induced background events.
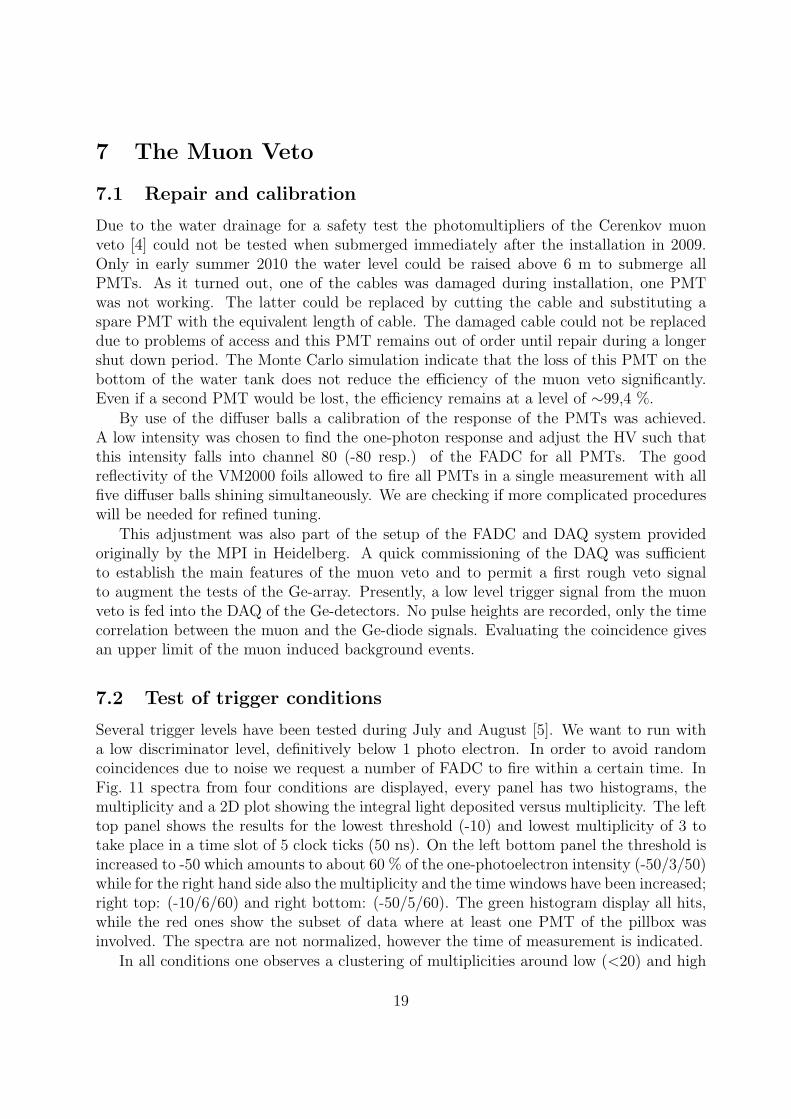
7.2 Test of trigger conditions
Several trigger levels have been tested during July and August [5]. We want to run witha low discriminator level, definitively below 1 photo electron. In order to avoid randomcoincidences due to noise we request a number of FADC to fire within a certain time. InFig. 11 spectra from four conditions are displayed, every panel has two histograms, themultiplicity and a 2D plot showing the integral light deposited versus multiplicity. The lefttop panel shows the results for the lowest threshold (-10) and lowest multiplicity of 3 totake place in a time slot of 5 clock ticks (50 ns). On the left bottom panel the threshold isincreased to -50 which amounts to about 60 % of the one-photoelectron intensity (-50/3/50)while for the right hand side also the multiplicity and the time windows have been increased;right top: (-10/6/60) and right bottom: (-50/5/60). The green histogram display all hits,while the red ones show the subset of data where at least one PMT of the pillbox wasinvolved. The spectra are not normalized, however the time of measurement is indicated.
In all conditions one observes a clustering of multiplicities around low (<20) and high
19

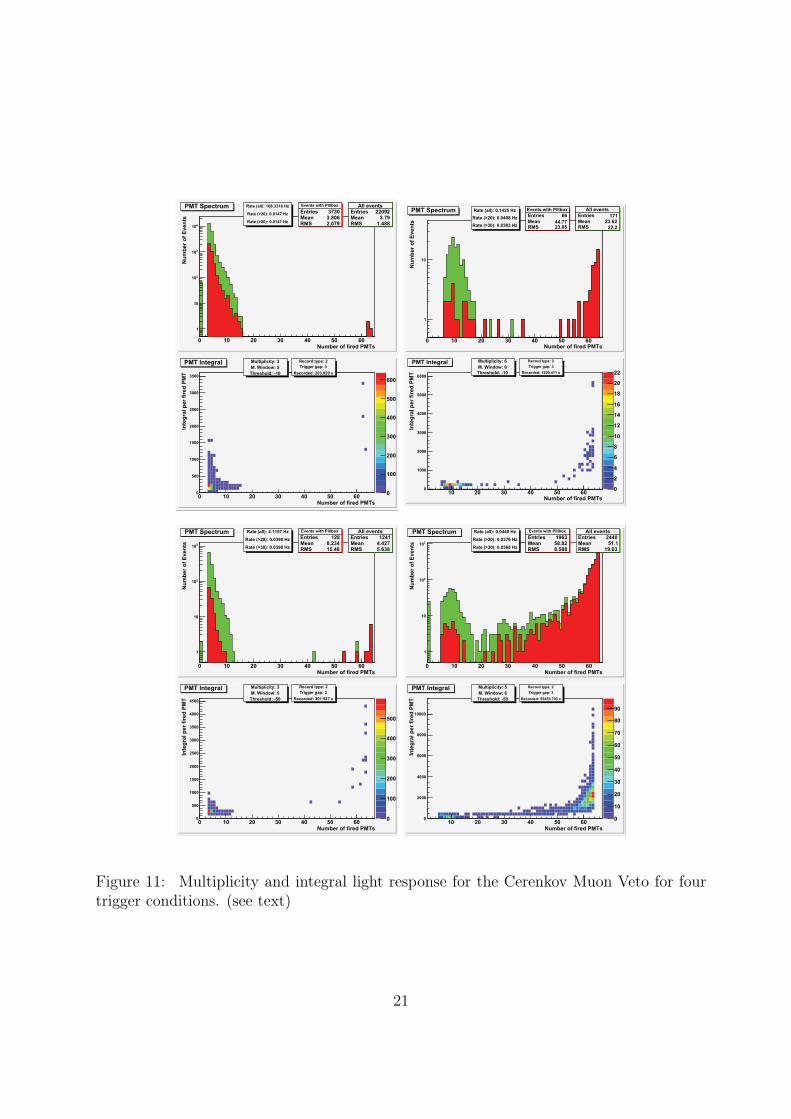
values above 60. The integral intensities indicate that the former might come from naturalor induced radioactivity with some undetermined contributions from noise, while the highmultiplicities clearly show the light from the electro-magnetic shower due to the passage ofthe muon. A typical high multiplicity event is shown in Fig. 12, where the light intensityand arrival time are indicated via the color code and size. The left panel shows an eventwhere the PMT fired in the pillbox only, the volume below the cryostat; the right oneshows a high multiplicity event, which is attributed to a direct muon hit in the water.
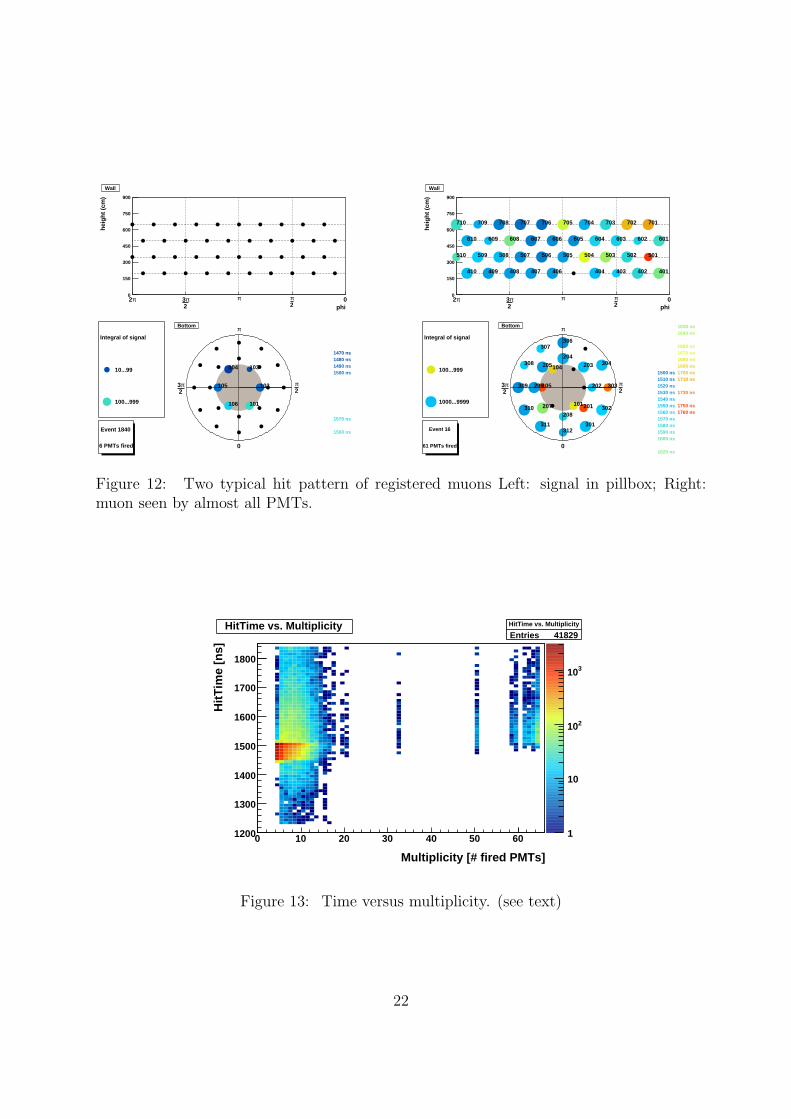
The randomness of the low multiplicity contributions, or at least part of it is demon-strated in Fig. 13. The trigger time window is set around 1500 ns of the “HitTime”. Highmultiplicity events are not found at earlier times in contrast to the lower ones, which arespread over the full range. Present investigations aim at the understanding of differentpossible contributions to this part. The rate of high multiplicity events is within a factor 2of the expected muon rate.
The present veto trigger fed into the DAQ of the Germanium test array is set to a levelof -10 and a multiplicity of 4 within a time window of 50 ns. The above considerations tellus that this rate of veto signals is too high compared to reality. Thus, this rate is a veryhigh ‘upper limit’. In case of few coincidences between the Ge and the muon signals, onereaches the conclusions that the background seen currently in Gerda can not be inducedby cosmic muons.
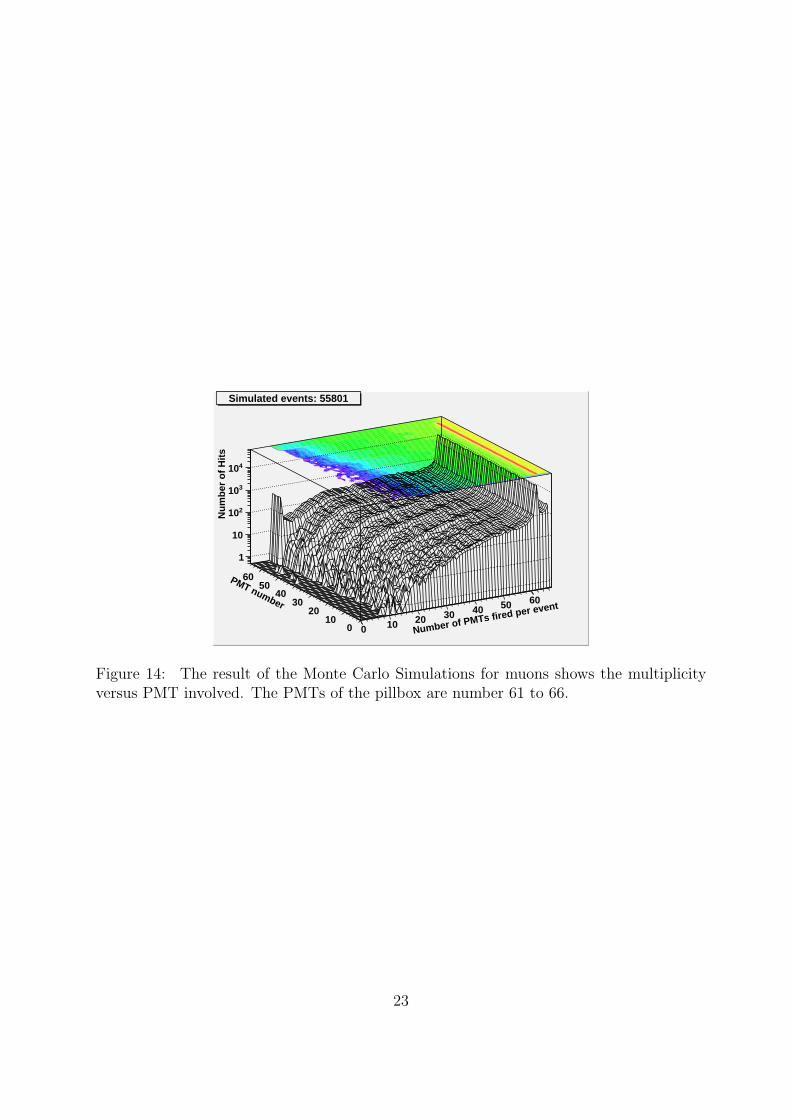
The high multiplicity for events from muons is demonstrated by the Monte Carlo sim-ulation. In Fig. 14 the PMTs are numbered from top to the pillbox with the latter havingnumbers 61 to 66. There are clear indications that a muon in the pillbox fires all 6 PMTs.The ridge at multiplicity 60 (and events below) indicates that some showers are seen onlyin the outside part of the water tank. Note, that the configuration of the PMTs in rings isresembled by the increased intensity observed as a grid in Fig. 14.
7.3 The Plastic Muon Veto
The plastic panels for the muon veto to be installed on top of the clean room are assembledin Dubna and are being prepared for shipment to LNGS via Tubingen for customs reasons.
In parallel we are going to perform in November a test with 7 panels on top of theclean room to explore the mechanical construction and check the slow control as well asthe DAQ in connection with Ge data.
20
All eventsEntries 22092Mean 3.79RMS 1.488
Number of fired PMTs0 10 20 30 40 50 60
Nu
mb
er
of
Ev
en
ts
1
10
210
310
410
All eventsEntries 22092Mean 3.79RMS 1.488
Events with Pillbox
Entries 3730Mean 3.806RMS 2.079
Events with Pillbox
Entries 3730Mean 3.806RMS 2.079
Rate (all): 108.3316 Hz
Rate (>20): 0.0147 Hz
Rate (>30): 0.0147 Hz
PMT Spectrum
Number of fired PMTs0 10 20 30 40 50 60
Inte
gra
l p
er
fire
d P
MT
0
500
1000
1500
2000
2500
3000
3500
0
1000
2000
3000
4000
5000
6000
Multiplicity: 3
M. Window: 5
Threshold: -10
Record type: 2
Trigger gap: 3
Recorded: 203.929 s
PMT Integral
All eventsEntries 1241Mean 4.427RMS 5.638
Number of fired PMTs0 10 20 30 40 50 60
Nu
mb
er
of
Ev
en
ts
1
10
210
310
All eventsEntries 1241Mean 4.427RMS 5.638
Events with Pillbox
Entries 128Mean 8.234RMS 15.48
Events with Pillbox
Entries 128Mean 8.234RMS 15.48
Rate (all): 4.1157 Hz
Rate (>20): 0.0398 Hz
Rate (>30): 0.0398 Hz
PMT Spectrum
Number of fired PMTs0 10 20 30 40 50 60
Inte
gra
l p
er
fire
d P
MT
0
500
1000
1500
2000
2500
3000
3500
4000
4500
0
100
200
300
400
500
Multiplicity: 3
M. Window: 5
Threshold: -50
Record type: 2
Trigger gap: 3
Recorded: 301.527 s
PMT Integral
All events
Entries 171Mean 23.62RMS 22.2
Number of fired PMTs0 10 20 30 40 50 60
Nu
mb
er
of
Ev
en
ts
1
10
All events
Entries 171Mean 23.62RMS 22.2
Events with Pillbox
Entries 66
Mean 44.77RMS 23.05
Events with Pillbox
Entries 66
Mean 44.77RMS 23.05
Rate (all): 0.1425 Hz
Rate (>20): 0.0408 Hz
Rate (>30): 0.0383 Hz
PMT Spectrum
0
2
4
6
8
10
12
14
16
18
20
22
Number of fired PMTs10 20 30 40 50 60
Inte
gra
l p
er
fire
d P
MT
0
1000
2000
3000
4000
5000
6000
Multiplicity: 6
M. Window: 6
Threshold: -10
Record type: 2
Trigger gap: 3
Recorded: 1200.411 s
PMT Integral
All eventsEntries 2440Mean 51.1RMS 19.03
Number of fired PMTs0 10 20 30 40 50 60
Nu
mb
er
of
Ev
en
ts
1
10
210
310
All eventsEntries 2440Mean 51.1RMS 19.03
Events with Pillbox
Entries 1963Mean 58.82RMS 8.588
Events with Pillbox
Entries 1963Mean 58.82RMS 8.588
Rate (all): 0.0440 Hz
Rate (>20): 0.0376 Hz
Rate (>30): 0.0368 Hz
PMT Spectrum
Number of fired PMTs10 20 30 40 50 60
Inte
gra
l p
er
fire
d P
MT
0
2000
4000
6000
8000
10000
0
10
20
30
40
50
60
70
80
90
Multiplicity: 5
M. Window: 6
Threshold: -50
Record type: 2
Trigger gap: 3
Recorded: 55453.793 s
PMT Integral
Figure 11: Multiplicity and integral light response for the Cerenkov Muon Veto for fourtrigger conditions. (see text)
21
Event 1840
6 PMTs fired
1590 ns
1570 ns
1500 ns
1470 ns1480 ns1490 ns
Integral of signal
10...99
100...999
02ππ
2π3π2
phi
hei
gh
t (c
m)
0
150
300
450
600
750
900
Wall
Bottom
101106
105
104 103
102 1.57
3.14
4.71
6.28
2π
π
2π3
0
Event 16
61 PMTs fired
1680 ns
1560 ns1550 ns
1530 ns
1760 ns1570 ns
1500 ns
1600 ns
1660 ns
1750 ns
1630 ns
1730 ns1540 ns
1690 ns
1590 ns1580 ns
1520 ns
1700 ns1510 ns 1710 ns
1620 ns
1670 ns
1640 nsIntegral of signal
100...999
1000...9999
02ππ
2π3π2
phi
hei
gh
t (c
m)
0
150
300
450
600
750
900
409
501
604
706
408
510
603
705
407
509
602
704
406
508
601
703
507
610
702
404
506
609
701
403
505
608
710
402
504
607
709
401
503
606
708
410
502
605
707
Wall
Bottom
101
307
301
304
310
105
207
303
104
206
302
205
312
204
311
203
309 202
308
201
306
208
1.57
3.14
4.71
6.28
2π
π
2π3
0
Figure 12: Two typical hit pattern of registered muons Left: signal in pillbox; Right:muon seen by almost all PMTs.
Multiplicity [# fired PMTs]
0 10 20 30 40 50 60
Hit
Tim
e [n
s]
1200
1300
1400
1500
1600
1700
1800
HitTime vs. Multiplicity
Entries 41829
1
10
210
310
HitTime vs. Multiplicity
Entries 41829HitTime vs. Multiplicity
Figure 13: Time versus multiplicity. (see text)
22
Number of PMTs fired per event
0 10 20 30 40 50 60
PMT number
010
2030
4050
60
Nu
mb
er o
f H
its
1
10
210
310
410
Simulated events: 55801
Figure 14: The result of the Monte Carlo Simulations for muons shows the multiplicityversus PMT involved. The PMTs of the pillbox are number 61 to 66.
23
8 Simulations and background studies
The main activity within the Task Group was the design, implementation and test of newsoftware tools for data handling and analysis. A significant effort has also been placed indetailed Monte Carlo simulations to interpret the recent measurements with the 3-detectorpilot string, and specifically the 42K signal.
8.1 Data analysis algorithms and infrastructures
MGDO
As described in the previous report to the Committee, a major activity within the TaskGroup had been the development, test and upgrade of the MGDO (Majorana-GERDAData Object) software library, which is maintained jointly with the Majorana MonteCarlo group.
The format defined in MGDO is meant to be used as a standardized format (“tier1”)for easy sharing and readability of data files. All raw data collected within the Gerdaactivities (main Gerda setup, LArGe, characterization of BEGe detectors, etc.) areconverted in an MGDO-based format, so they can be read and analyzed with the samecodes, irrespectively of the original format.
In the last six months, a substantial effort in the MGDO development has been ded-icated to the extension and improvement of general-purpose basic algorithms (“Trans-forms”) for data analysis. Newly implemented algorithms include pulse fitting, baselinerestoration, calculation of rise time, smoothing and deconvolution. Individual algorithmsare intended to be used sequentially in a chain for complex data analysis (e.g. energyreconstruction), as discussed below.
GELATIO
A new dedicated C++ software package called Gelatio (GErda LAyouT for Input/Output)has been initiated and intensively developed in the past months. The main aim of Gela-tio is to provide general and flexible Gerda-dedicated tools for the handling and analysisof data, starting from data files in MGDO format. While MGDO is uniquely a library,Gelatio contains executables that users can actually run and includes the informationto decode all the raw data formats currently used in Gerda. Gelatio is an originaldevelopment of the Gerda TG10 group.
Gelatio uses the approach of the Root-based TAM library [6] to achieve a com-pletely modular analysis. The software contains several independent analysis modules,each one performing a well-determined and self-consistent task of the digital data analysis.This encompasses - e.g. - determination of the onset, reconstruction of energy (possiblyaccording to different algorithms), calculation of the A/E ratio, calculation of rise time.Each module implements a chain of basic MGDO Transforms. Users can freely customizethe number/type of active modules (as well as their internal parameters) for the analysisof a given data file. The choice of modules to be activated and of their parameters does
24
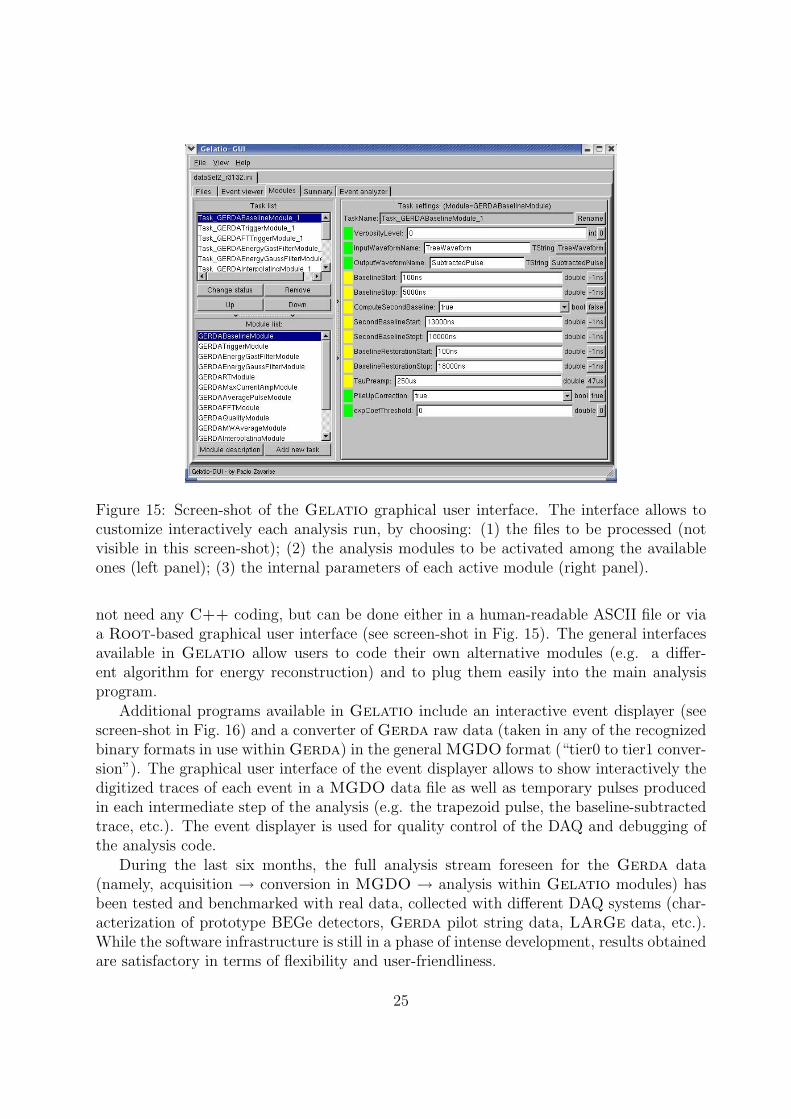
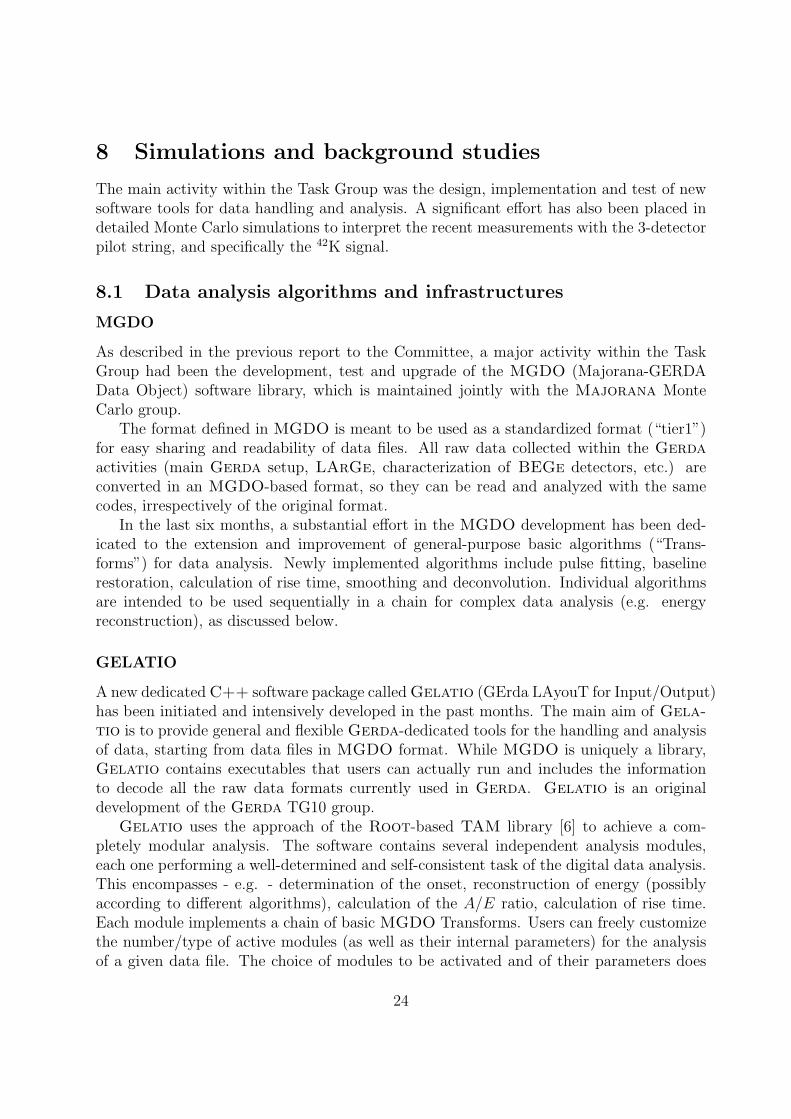
Figure 15: Screen-shot of the Gelatio graphical user interface. The interface allows tocustomize interactively each analysis run, by choosing: (1) the files to be processed (notvisible in this screen-shot); (2) the analysis modules to be activated among the availableones (left panel); (3) the internal parameters of each active module (right panel).
not need any C++ coding, but can be done either in a human-readable ASCII file or viaa Root-based graphical user interface (see screen-shot in Fig. 15). The general interfacesavailable in Gelatio allow users to code their own alternative modules (e.g. a differ-ent algorithm for energy reconstruction) and to plug them easily into the main analysisprogram.
Additional programs available in Gelatio include an interactive event displayer (seescreen-shot in Fig. 16) and a converter of Gerda raw data (taken in any of the recognizedbinary formats in use within Gerda) in the general MGDO format (“tier0 to tier1 conver-sion”). The graphical user interface of the event displayer allows to show interactively thedigitized traces of each event in a MGDO data file as well as temporary pulses producedin each intermediate step of the analysis (e.g. the trapezoid pulse, the baseline-subtractedtrace, etc.). The event displayer is used for quality control of the DAQ and debugging ofthe analysis code.
During the last six months, the full analysis stream foreseen for the Gerda data(namely, acquisition → conversion in MGDO → analysis within Gelatio modules) hasbeen tested and benchmarked with real data, collected with different DAQ systems (char-acterization of prototype BEGe detectors, Gerda pilot string data, LArGe data, etc.).While the software infrastructure is still in a phase of intense development, results obtainedare satisfactory in terms of flexibility and user-friendliness.
25
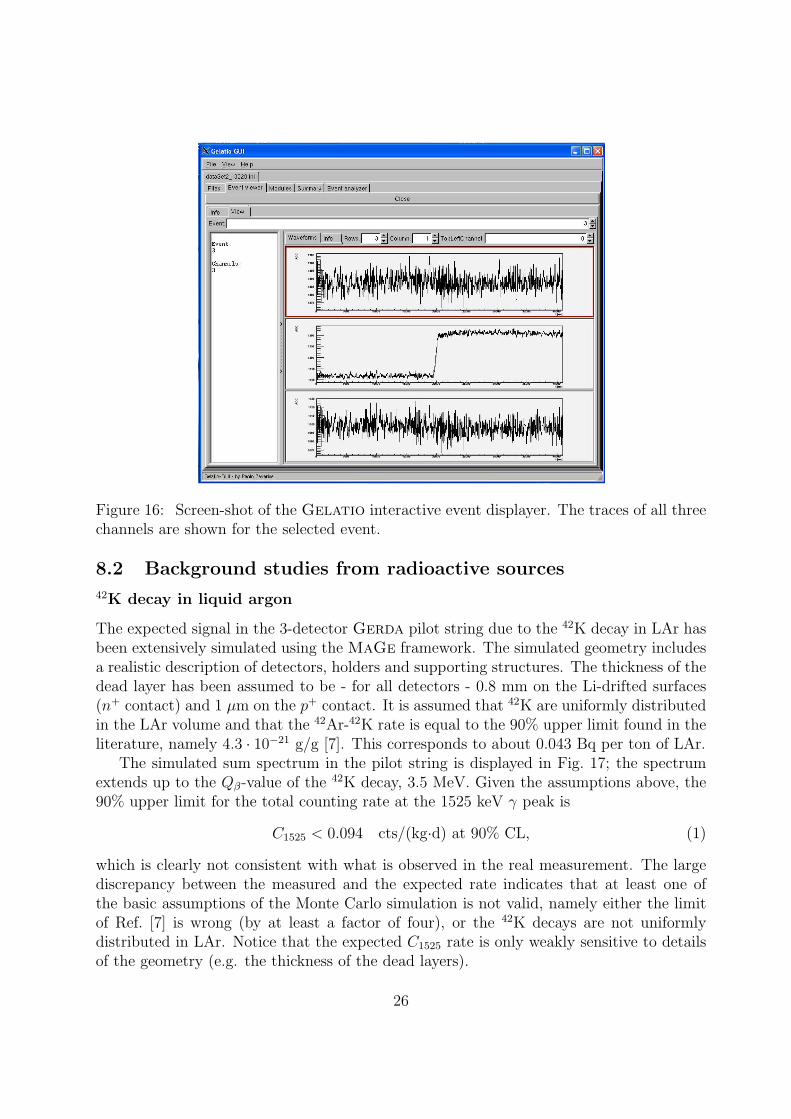
Figure 16: Screen-shot of the Gelatio interactive event displayer. The traces of all threechannels are shown for the selected event.
8.2 Background studies from radioactive sources42K decay in liquid argon
The expected signal in the 3-detector Gerda pilot string due to the 42K decay in LAr hasbeen extensively simulated using the MaGe framework. The simulated geometry includesa realistic description of detectors, holders and supporting structures. The thickness of thedead layer has been assumed to be - for all detectors - 0.8 mm on the Li-drifted surfaces(n+ contact) and 1 µm on the p+ contact. It is assumed that 42K are uniformly distributedin the LAr volume and that the 42Ar-42K rate is equal to the 90% upper limit found in theliterature, namely 4.3 · 10−21 g/g [7]. This corresponds to about 0.043 Bq per ton of LAr.
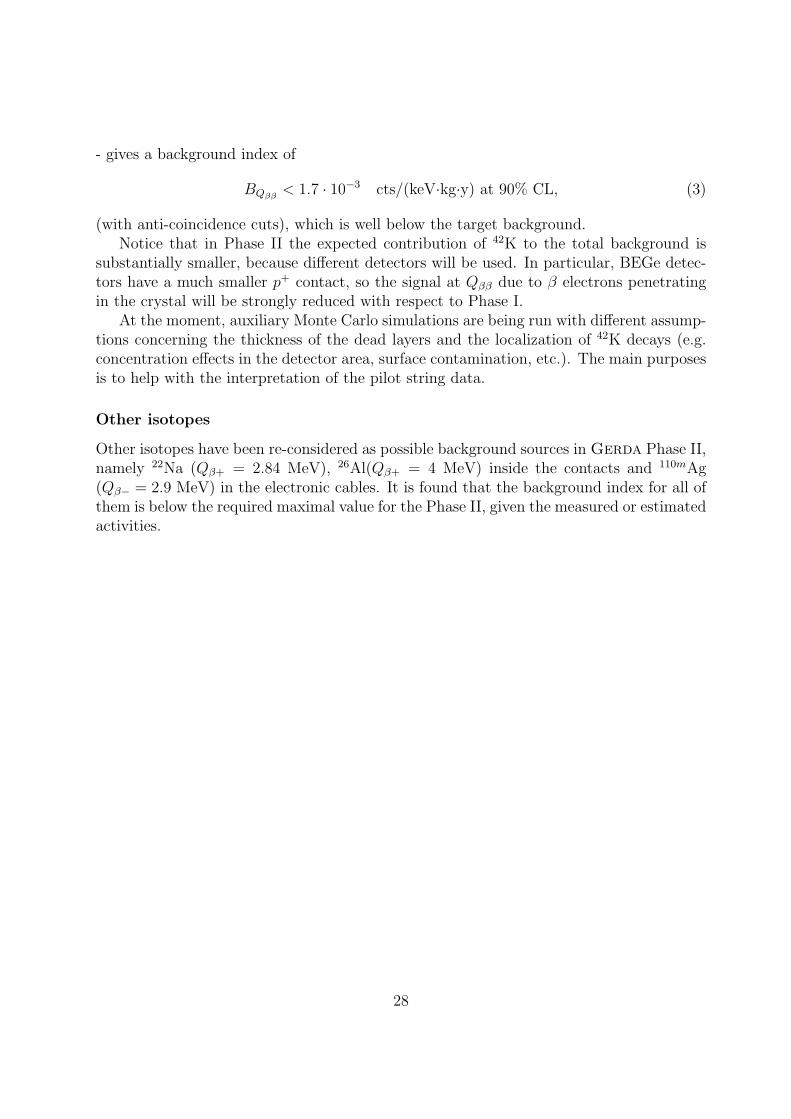
The simulated sum spectrum in the pilot string is displayed in Fig. 17; the spectrumextends up to the Qβ-value of the 42K decay, 3.5 MeV. Given the assumptions above, the90% upper limit for the total counting rate at the 1525 keV γ peak is
C1525 < 0.094 cts/(kg·d) at 90% CL, (1)
which is clearly not consistent with what is observed in the real measurement. The largediscrepancy between the measured and the expected rate indicates that at least one ofthe basic assumptions of the Monte Carlo simulation is not valid, namely either the limitof Ref. [7] is wrong (by at least a factor of four), or the 42K decays are not uniformlydistributed in LAr. Notice that the expected C1525 rate is only weakly sensitive to detailsof the geometry (e.g. the thickness of the dead layers).
26
E[keV]0 500 1000 1500 2000 2500 3000 3500
cou
nts
/(ke
V k
g y
)
-310
-210
-110
1
10
g/g-21Ar=4.3 1040Ar/42K total spectrum (3 detectors) for 42
Figure 17: Simulated sum spectrum from 42K in the pilot detector string in the assumptionof uniform distribution with specific rate 0.043 Bq per ton of Ar (90% CL upper limit on42Ar contamination in liquid argon). No anti-coincidence cut has been applied.
The expected background index at Qββ for the pilot string is
BQββ< 1.6 · 10−3 cts/(keV·kg·y) at 90% CL. (2)
Simulations show that the signal at Qββ is largely due to electrons penetrating in thecrystals (about 93%); the remaining part is the Compton continuum from the rare 42Kγ-ray at 2424 keV (Iγ = 0.02%). Indeed, electrons can penetrate in the detector only ifthey start from a very small region in the surrounding of the detector themselves, especiallyclose to the p+ surfaces, where the dead layer is extremely thin. The simulation results atQββ are very sensitive to small details of the geometry, and specifically the thickness andextension of the dead layer. The predicted BQββ
should be hence regarded as qualitativeonly, due to the large systematic uncertainty on the contribution from β electrons (whichis dominant).
The extrapolation to the nominal Phase I array - with the assumptions described above
27
- gives a background index of
BQββ< 1.7 · 10−3 cts/(keV·kg·y) at 90% CL, (3)
(with anti-coincidence cuts), which is well below the target background.Notice that in Phase II the expected contribution of 42K to the total background is
substantially smaller, because different detectors will be used. In particular, BEGe detec-tors have a much smaller p+ contact, so the signal at Qββ due to β electrons penetratingin the crystal will be strongly reduced with respect to Phase I.
At the moment, auxiliary Monte Carlo simulations are being run with different assump-tions concerning the thickness of the dead layers and the localization of 42K decays (e.g.concentration effects in the detector area, surface contamination, etc.). The main purposesis to help with the interpretation of the pilot string data.
Other isotopes
Other isotopes have been re-considered as possible background sources in Gerda Phase II,namely 22Na (Qβ+ = 2.84 MeV), 26Al(Qβ+ = 4 MeV) inside the contacts and 110mAg(Qβ− = 2.9 MeV) in the electronic cables. It is found that the background index for all ofthem is below the required maximal value for the Phase II, given the measured or estimatedactivities.
28
9 Material screening
In the last few months the selection of radio-pure materials for front-end electronics wascontinued. New batches of previously selected low background components were purchasedand measured. The results were in agreement with earlier measurements. Consequently,we have now the material in hand to mount all PCBs for the first phase of GERDA (seesection 5).
Most of the other activities concerned radon measurements. The electrostatic radonmonitor is working since September 2009 at LNGS below the Gerda tank without prob-lems. The radon monitor is now connected to the exhaust line of the Gerda cryogenictank via a mass flow controller and measures the radon content of the gaseous Ar. Theflow is at the moment too low (0.3 l/min) to obtain meaningful results. A change of theconnections will hopefully increase the flow through the monitor to 6 liters per minute.The Labview software which calculates the radon concentration based on the 214Po and218Po peak intensity was updated and produces now a website displaying the radon con-centration.
We have also investigated the dependency of the 222Rn emanation rate on the tempera-ture and on the environment by measuring the 222Rn which is emanated from 4 % thoratedthungsten welding rods. Due to traces of uranium in the thorium 100 welding rods yield asufficiently high 222Rn emanation rate into gaseous helium at room temperature (1.8±0.1)mBq. When changing the temperature to -186 C and still using gaseous helium as a carriergas we could not measure any signal (< 0.04 mBq). In this case the 222Rn is still emanated,but it sticks to the cold surfaces as could be demonstrated by a quick warm-up test afterthe measurement in which we found back almost all the 222Rn. In a final series of tests wereplaced the gaseous helium by liquid argon. The temperature remained unchanged (-186C), but now the environment is a cryogenic liquid instead of a cold gas. In this setupwe found a 222Rn emanation rate of (2.5 ± 0.1) mBq which is even higher than the roomtemperature result. A possible explanation is the larger stopping power of the liquid argoncompared to the gaseous helium. 222Rn which is recoiled during the 226Ra-decay may beimplanted to an opposite surface, if it only crosses gaseous helium. However, if it crossesliquid argon instead, it may be stopped and thus remains in the mobile phase.
10 Calibration
10.1 New sources, γ- and n-flux measurements
The first custom made 228Th source has been calibrated at IRMM in Geel in May 2010,yielding an activity of (17.7±0.5) kBq (the reference date being 1.04.2009, which is directlyafter the source preparation at PSI). The calibration procedure has been cross checked witha reference source from Eckert&Ziegler with a nominal activity of (25.5 ±1.5) kBq (with1.02.2010 as the reference date). For the commercial source, the activity measurementperformed at IRMM is consistent with the value given by Eckert&Ziegler, with a relative
29
uncertainty that decreased to 3.1% with respect to the 5% value quoted by the company.Table 3 shows a summary of these results. Two additional custom sources were shipped toIRMM for calibration, before they were brought to LNGS for neutron flux measurements.The final calibration results for these two newest 228Th sources are in preparation.
Table 3: Results of the 228Th calibrations at IRMM
Source Activity [kBq] reference date228Th custom 17.7 ± 0.5 IRMM, 01.04.2009228Th commercial 26.5 ± 0.8 IRMM, 01.02.2010228Th commercial 25.5 ± 1.3 E&Z, 01.02.2010
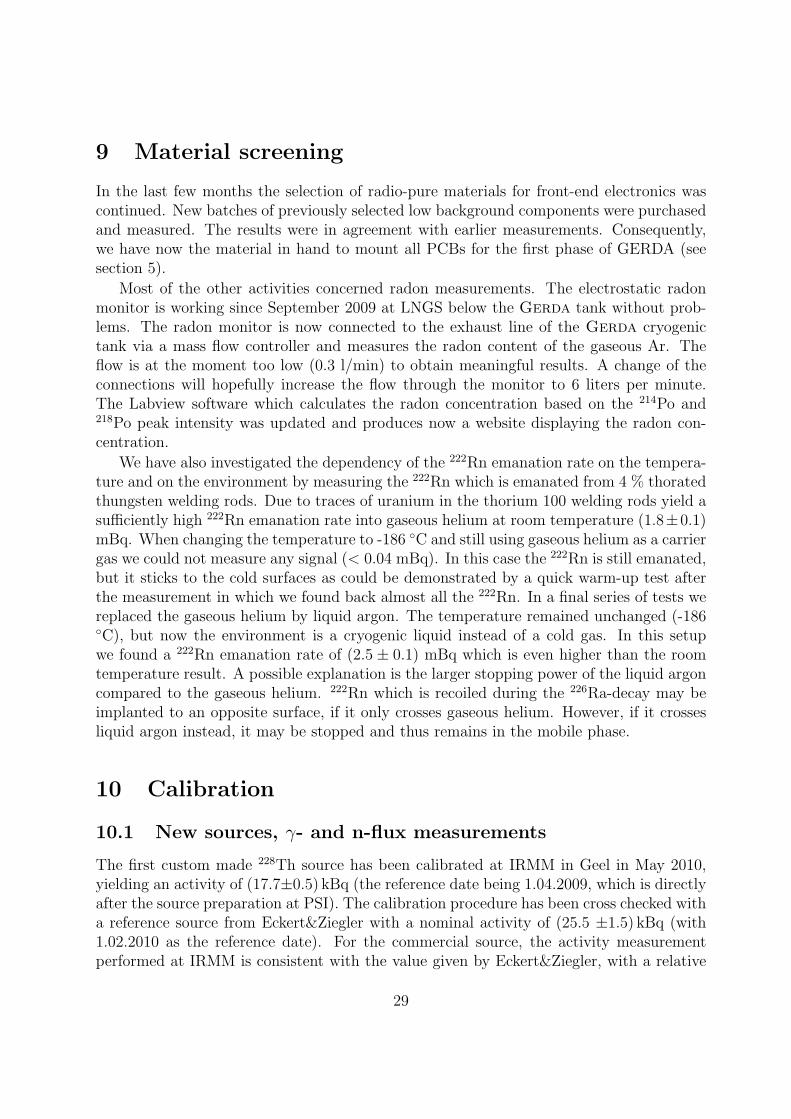
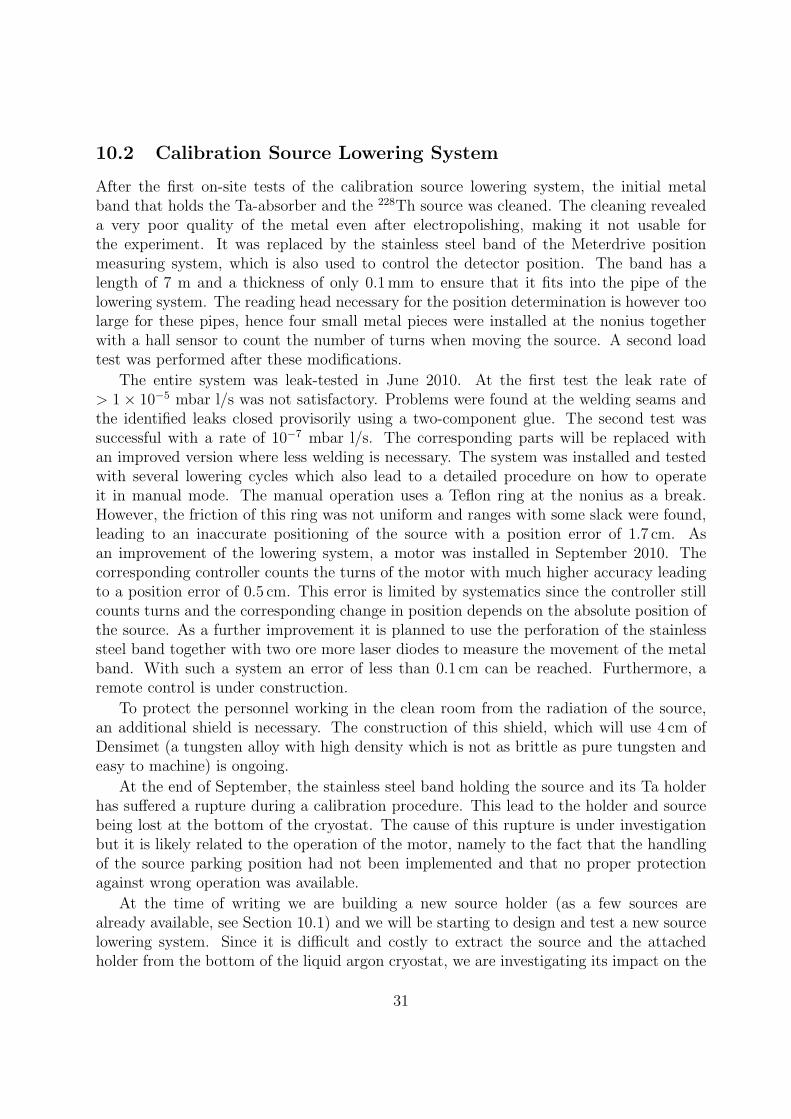
In order to determine the neutron flux from all the sources and to cross check theneutron rates obtained with a 3He detector (as reported in April 2010), a new LiI(Eu)detector has been tested in Zurich and brought to LNGS in August 2010. The neutrondetection takes place via a prompt nuclear reaction in 6Li with a Q-value of 4.78 MeV.The high Q-value results in an excellent γ-rejection performance. The detection efficiencyof the LiI(Eu) detector reaches ∼100% for thermal neutrons. The thermalization of theneutrons takes place in a 5 cm thick polyethylene moderator in front of the detector, theoptimal moderator thickness having been determined by measurements and Monte Carlosimulations. Fig. 18 shows the detector at LNGS, along with the inner and part of theouter polyethylene moderator (left) and calibration spectra taken with a gamma (137Cs)and a neutron (AmBe) source above ground (right). The neutron capture peak on 6Li isclearly visible.
1000 2000 3000 4000 50000
0.2
0.4
0.6
0.8
1 x 10 3
Channel number
a.u.
137CsAmBe
µ (137Cs) = 550.48 ch
µ(AmBe) = 3273.2 ch
Figure 18: (Left) LiI(Eu) setup at LNGS. The inner polyethylene will moderate theneutrons coming from the calibration source. The outer, borated polyethylene, providesa shield against the ambient neutron background; (Right) AmBe and 137Cs calibrationspectra taken above ground.
30
10.2 Calibration Source Lowering System
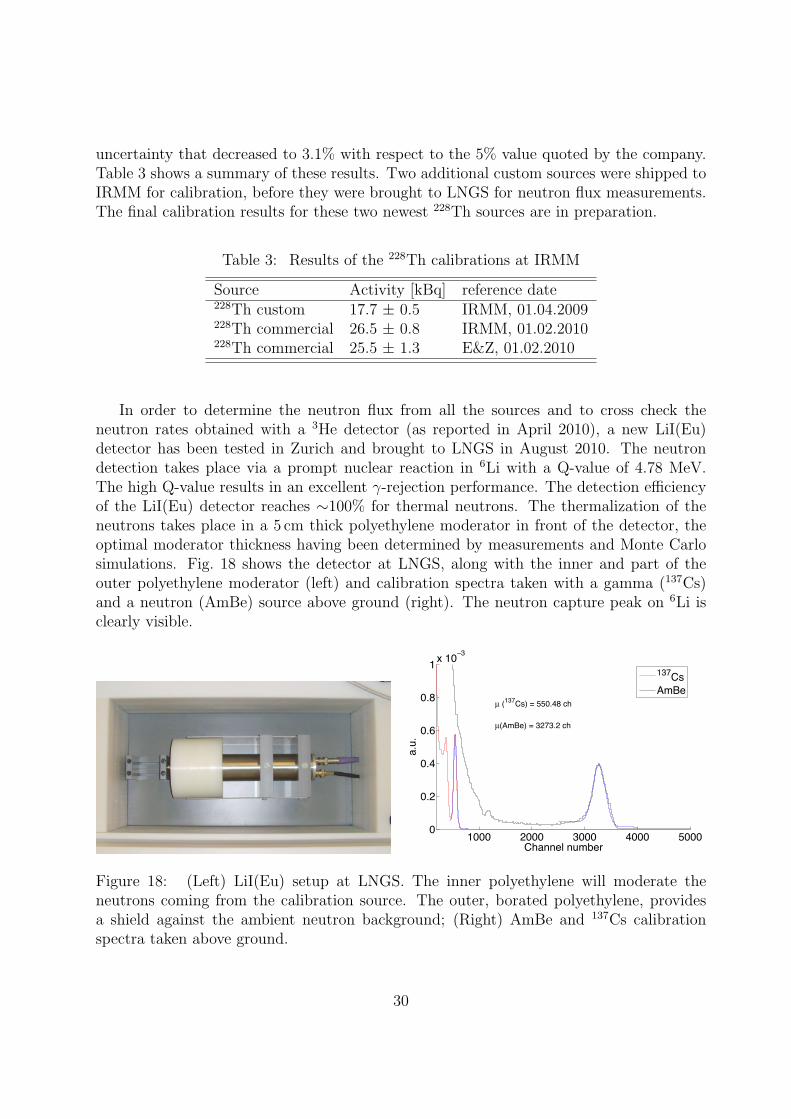
After the first on-site tests of the calibration source lowering system, the initial metalband that holds the Ta-absorber and the 228Th source was cleaned. The cleaning revealeda very poor quality of the metal even after electropolishing, making it not usable forthe experiment. It was replaced by the stainless steel band of the Meterdrive positionmeasuring system, which is also used to control the detector position. The band has alength of 7 m and a thickness of only 0.1 mm to ensure that it fits into the pipe of thelowering system. The reading head necessary for the position determination is however toolarge for these pipes, hence four small metal pieces were installed at the nonius togetherwith a hall sensor to count the number of turns when moving the source. A second loadtest was performed after these modifications.
The entire system was leak-tested in June 2010. At the first test the leak rate of> 1× 10⁻⁵ mbar l/s was not satisfactory. Problems were found at the welding seams andthe identified leaks closed provisorily using a two-component glue. The second test wassuccessful with a rate of 10−7 mbar l/s. The corresponding parts will be replaced withan improved version where less welding is necessary. The system was installed and testedwith several lowering cycles which also lead to a detailed procedure on how to operateit in manual mode. The manual operation uses a Teflon ring at the nonius as a break.However, the friction of this ring was not uniform and ranges with some slack were found,leading to an inaccurate positioning of the source with a position error of 1.7 cm. Asan improvement of the lowering system, a motor was installed in September 2010. Thecorresponding controller counts the turns of the motor with much higher accuracy leadingto a position error of 0.5 cm. This error is limited by systematics since the controller stillcounts turns and the corresponding change in position depends on the absolute position ofthe source. As a further improvement it is planned to use the perforation of the stainlesssteel band together with two ore more laser diodes to measure the movement of the metalband. With such a system an error of less than 0.1 cm can be reached. Furthermore, aremote control is under construction.
To protect the personnel working in the clean room from the radiation of the source,an additional shield is necessary. The construction of this shield, which will use 4 cm ofDensimet (a tungsten alloy with high density which is not as brittle as pure tungsten andeasy to machine) is ongoing.
At the end of September, the stainless steel band holding the source and its Ta holderhas suffered a rupture during a calibration procedure. This lead to the holder and sourcebeing lost at the bottom of the cryostat. The cause of this rupture is under investigationbut it is likely related to the operation of the motor, namely to the fact that the handlingof the source parking position had not been implemented and that no proper protectionagainst wrong operation was available.
At the time of writing we are building a new source holder (as a few sources arealready available, see Section 10.1) and we will be starting to design and test a new sourcelowering system. Since it is difficult and costly to extract the source and the attachedholder from the bottom of the liquid argon cryostat, we are investigating its impact on the
31
background given its current position. We are assuming 3 m of liquid argon between sourceand detectors and no shielding by the holder. The 228Th source has a current activity of30 kBq and a measured neutron flux of 1.3 × 10⁻³ n/(s·kBq). We obtain a backgroundrate of 1-2·10−3 cnt/(kg·y·keV) and 5·10−5 cnt/(kg·y·keV) from gammas and neutrons,respectively, which is acceptable for Gerda Phase I.
10.3 Calibration Analysis Pipeline
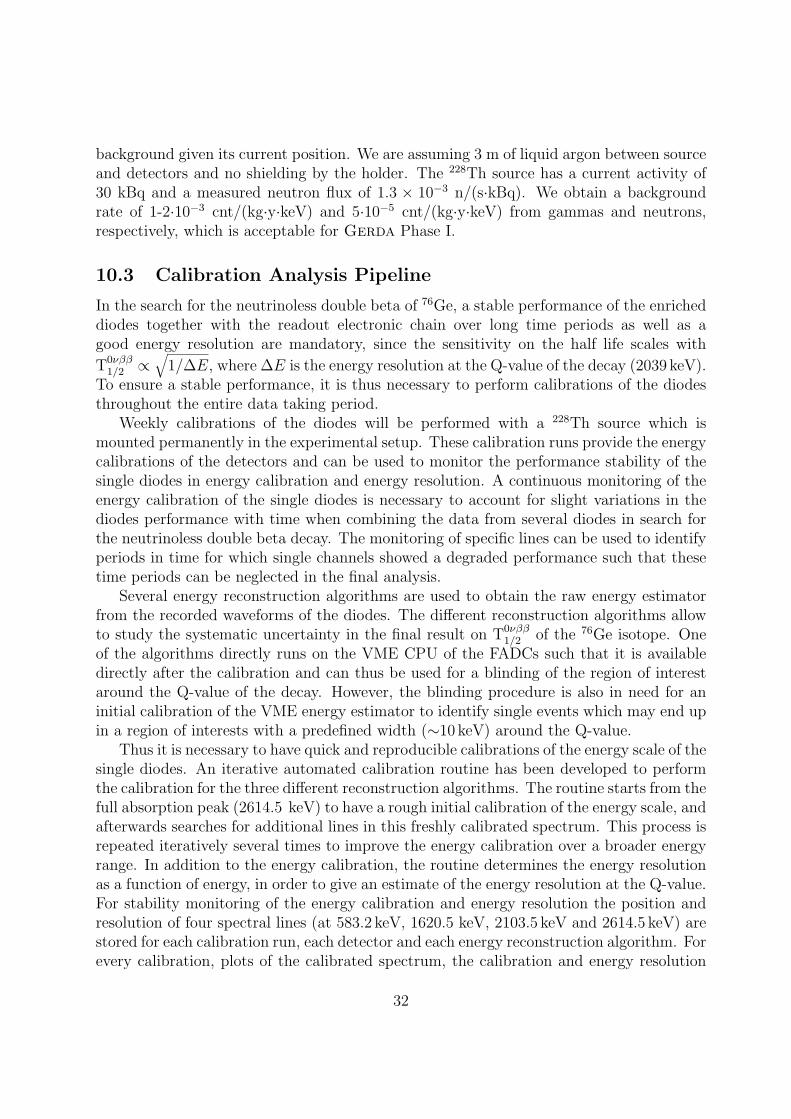
In the search for the neutrinoless double beta of 76Ge, a stable performance of the enricheddiodes together with the readout electronic chain over long time periods as well as agood energy resolution are mandatory, since the sensitivity on the half life scales with
T0νββ1/2 ∝
√1/∆E, where ∆E is the energy resolution at the Q-value of the decay (2039 keV).
To ensure a stable performance, it is thus necessary to perform calibrations of the diodesthroughout the entire data taking period.
Weekly calibrations of the diodes will be performed with a 228Th source which ismounted permanently in the experimental setup. These calibration runs provide the energycalibrations of the detectors and can be used to monitor the performance stability of thesingle diodes in energy calibration and energy resolution. A continuous monitoring of theenergy calibration of the single diodes is necessary to account for slight variations in thediodes performance with time when combining the data from several diodes in search forthe neutrinoless double beta decay. The monitoring of specific lines can be used to identifyperiods in time for which single channels showed a degraded performance such that thesetime periods can be neglected in the final analysis.
Several energy reconstruction algorithms are used to obtain the raw energy estimatorfrom the recorded waveforms of the diodes. The different reconstruction algorithms allowto study the systematic uncertainty in the final result on T0νββ
1/2 of the 76Ge isotope. Oneof the algorithms directly runs on the VME CPU of the FADCs such that it is availabledirectly after the calibration and can thus be used for a blinding of the region of interestaround the Q-value of the decay. However, the blinding procedure is also in need for aninitial calibration of the VME energy estimator to identify single events which may end upin a region of interests with a predefined width (∼10 keV) around the Q-value.
Thus it is necessary to have quick and reproducible calibrations of the energy scale of thesingle diodes. An iterative automated calibration routine has been developed to performthe calibration for the three different reconstruction algorithms. The routine starts from thefull absorption peak (2614.5 keV) to have a rough initial calibration of the energy scale, andafterwards searches for additional lines in this freshly calibrated spectrum. This process isrepeated iteratively several times to improve the energy calibration over a broader energyrange. In addition to the energy calibration, the routine determines the energy resolutionas a function of energy, in order to give an estimate of the energy resolution at the Q-value.For stability monitoring of the energy calibration and energy resolution the position andresolution of four spectral lines (at 583.2 keV, 1620.5 keV, 2103.5 keV and 2614.5 keV) arestored for each calibration run, each detector and each energy reconstruction algorithm. Forevery calibration, plots of the calibrated spectrum, the calibration and energy resolution
32
functions as well the monitoring lines are available via an online display. The online displayalso has links to the calibration parameters for each diode which can be used for analysesof the data taken after the specific calibration run.
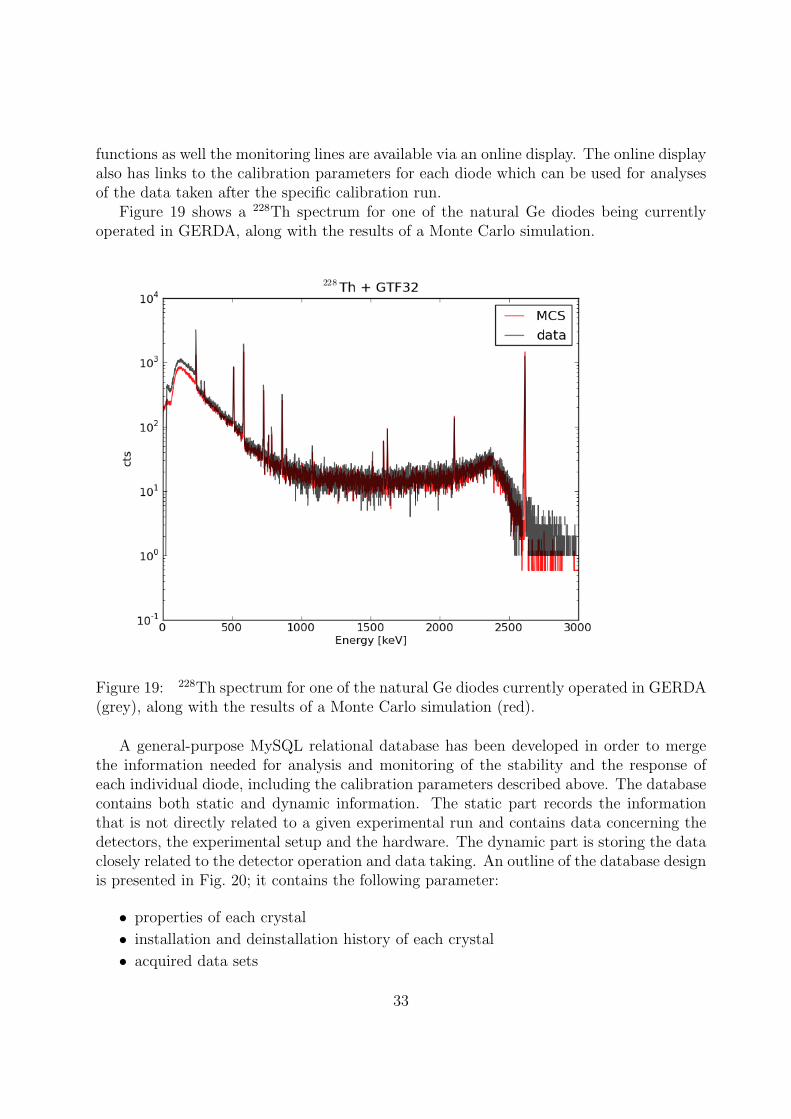
Figure 19 shows a 228Th spectrum for one of the natural Ge diodes being currentlyoperated in GERDA, along with the results of a Monte Carlo simulation.
Figure 19: 228Th spectrum for one of the natural Ge diodes currently operated in GERDA(grey), along with the results of a Monte Carlo simulation (red).
A general-purpose MySQL relational database has been developed in order to mergethe information needed for analysis and monitoring of the stability and the response ofeach individual diode, including the calibration parameters described above. The databasecontains both static and dynamic information. The static part records the informationthat is not directly related to a given experimental run and contains data concerning thedetectors, the experimental setup and the hardware. The dynamic part is storing the dataclosely related to the detector operation and data taking. An outline of the database designis presented in Fig. 20; it contains the following parameter:
• properties of each crystal
• installation and deinstallation history of each crystal
• acquired data sets
33
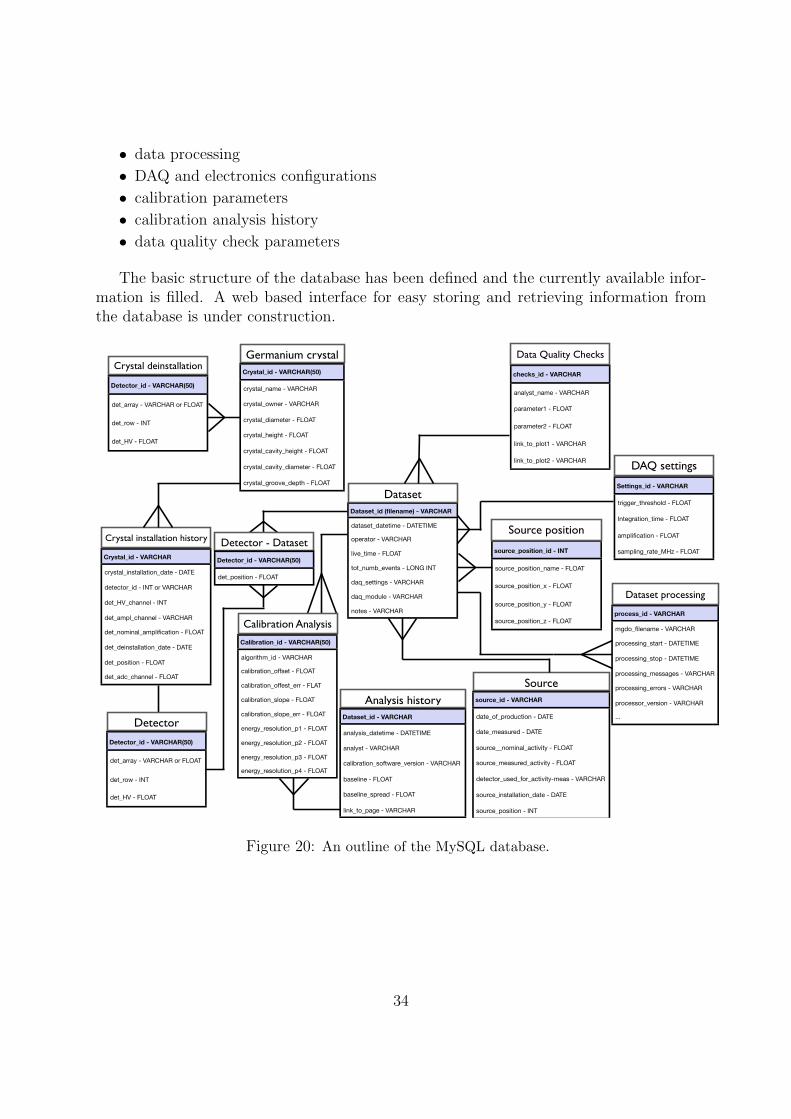
• data processing
• DAQ and electronics configurations
• calibration parameters
• calibration analysis history
• data quality check parameters
The basic structure of the database has been defined and the currently available infor-mation is filled. A web based interface for easy storing and retrieving information fromthe database is under construction.
Crystal_id - VARCHAR
crystal_installation_date - DATE
detector_id - INT or VARCHAR
det_HV_channel - INT
det_ampl_channel - VARCHAR
det_nominal_amplification - FLOAT
det_deinstallation_date - DATE
det_position - FLOAT
det_adc_channel - FLOAT
Dataset_id (filename) - VARCHAR
dataset_datetime - DATETIME
operator - VARCHAR
live_time - FLOAT
tot_numb_events - LONG INT
daq_settings - VARCHAR
daq_module - VARCHAR
notes - VARCHAR
source_id - VARCHAR
date_of_production - DATE
date_measured - DATE
source__nominal_activity - FLOAT
source_measured_activity - FLOAT
detector_used_for_activity-meas - VARCHAR
source_installation_date - DATE
source_position - INT
source_position_id - INT
source_position_name - FLOAT
source_position_x - FLOAT
source_position_y - FLOAT
source_position_z - FLOAT
Dataset_id - VARCHAR
analysis_datetime - DATETIME
analyst - VARCHAR
calibration_software_version - VARCHAR
baseline - FLOAT
baseline_spread - FLOAT
link_to_page - VARCHAR
Calibration_id - VARCHAR(50)
algorithm_id - VARCHAR
calibration_offset - FLOAT
calibration_offest_err - FLAT
calibration_slope - FLOAT
calibration_slope_err - FLOAT
energy_resolution_p1 - FLOAT
energy_resolution_p2 - FLOAT
energy_resolution_p3 - FLOAT
energy_resolution_p4 - FLOAT
Calibration Analysis
Detector_id - VARCHAR(50)
det_array - VARCHAR or FLOAT
det_row - INT
det_HV - FLOAT
Detector
Crystal installation history
Dataset
Source position
SourceAnalysis history
Settings_id - VARCHAR
trigger_threshold - FLOAT
Integration_time - FLOAT
amplification - FLOAT
sampling_rate_MHz - FLOAT
DAQ settings
checks_id - VARCHAR
analyst_name - VARCHAR
parameter1 - FLOAT
parameter2 - FLOAT
link_to_plot1 - VARCHAR
link_to_plot2 - VARCHAR
Data Quality Checks
process_id - VARCHAR
mgdo_filename - VARCHAR
processing_start - DATETIME
processing_stop - DATETIME
processing_messages - VARCHAR
processing_errors - VARCHAR
processor_version - VARCHAR
...
Dataset processing
Crystal_id - VARCHAR(50)
crystal_name - VARCHAR
crystal_owner - VARCHAR
crystal_diameter - FLOAT
crystal_height - FLOAT
crystal_cavity_height - FLOAT
crystal_cavity_diameter - FLOAT
crystal_groove_depth - FLOAT
Germanium crystal
Detector - Dataset
Detector_id - VARCHAR(50)
det_position - FLOAT
Detector_id - VARCHAR(50)
det_array - VARCHAR or FLOAT
det_row - INT
det_HV - FLOAT
Crystal deinstallation
Figure 20: An outline of the MySQL database.
34
11 Data management and quality control
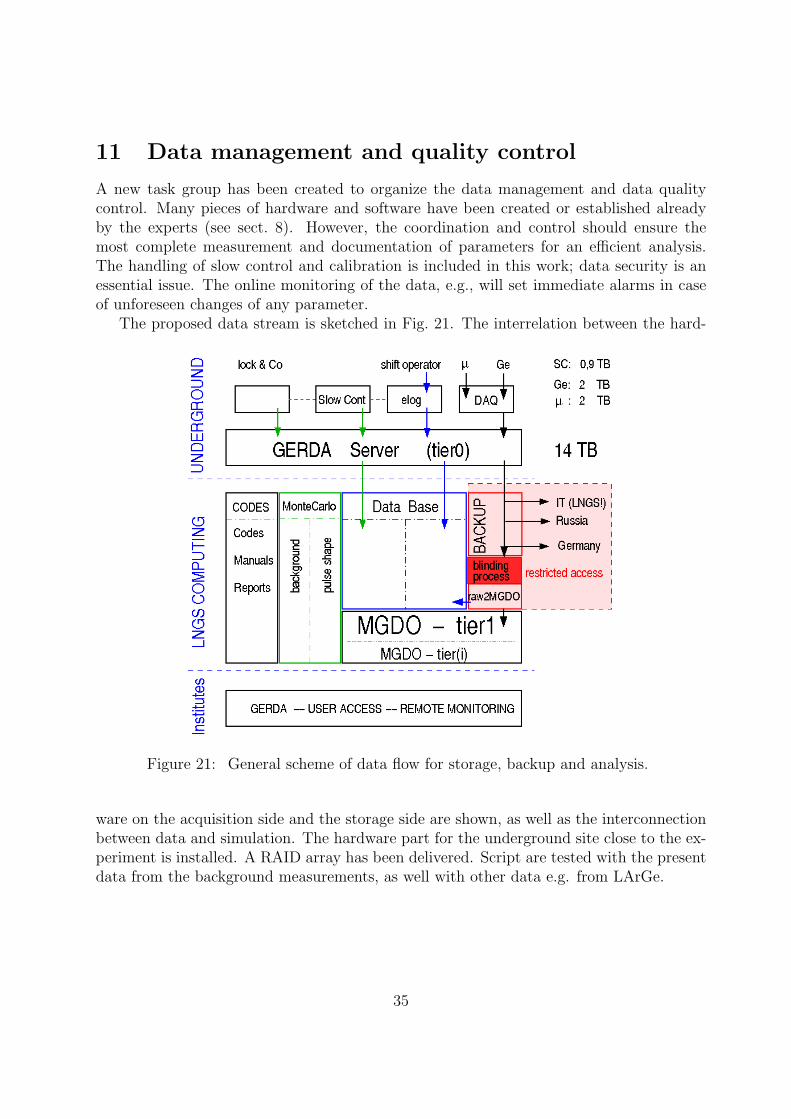
A new task group has been created to organize the data management and data qualitycontrol. Many pieces of hardware and software have been created or established alreadyby the experts (see sect. 8). However, the coordination and control should ensure themost complete measurement and documentation of parameters for an efficient analysis.The handling of slow control and calibration is included in this work; data security is anessential issue. The online monitoring of the data, e.g., will set immediate alarms in caseof unforeseen changes of any parameter.
The proposed data stream is sketched in Fig. 21. The interrelation between the hard-
Figure 21: General scheme of data flow for storage, backup and analysis.
ware on the acquisition side and the storage side are shown, as well as the interconnectionbetween data and simulation. The hardware part for the underground site close to the ex-periment is installed. A RAID array has been delivered. Script are tested with the presentdata from the background measurements, as well with other data e.g. from LArGe.
35
References
[1] M. Barnabe-Heider et al. JINST (in print)
[2] D. Budjas et al. JINST 4:P10007,2009
[3] I. Abt et al. Nucl.Instrum.Meth. A 577 (2007) 574
[4] M. Knapp, PhD thesis 2009, Eberhard Karls Universitat Tubingen
[5] K. Freund, F. Ritter, B.Shaybonov and P. Grabmayr, GSTR-10-003, “Update on theMuon Veto – installation of the DAQ”, Sep 2010
[6] M. Ballintijin, C. Loizides and C. Reed, Tree Analysis Modules,http://www.cmsaf.mit.edu/twiki/bin/view/Software/TAM
[7] V.D. Ashitkov et al., [arXiv:nucl-ex/0309001].
36