Supplementary Materials for -...
47
www.sciencemag.org/cgi/content/full/339/6124/1207/DC1 Supplementary Materials for Gene Transfer from Bacteria and Archaea Facilitated Evolution of an Extremophilic Eukaryote Gerald Schönknecht,* Wei-Hua Chen, Chad M. Ternes, Guillaume G. Barbier, Roshan P. Shrestha, Mario Stanke, Andrea Bräutigam, Brett J. Baker, Jillian F. Banfield, R. Michael Garavito, Kevin Carr, Curtis Wilkerson, Stefan A. Rensing, David Gagneul, Nicholas E. Dickenson, Christine Oesterhelt, Martin J. Lercher, Andreas P. M. Weber* *To whom correspondence should be addressed. E-mail: [email protected] (G.S.); [email protected] (A.P.M.W.) Published 8 March 2013, Science 339, 1207 (2013) DOI: 10.1126/science.1231707 This PDF file includes: Materials and Methods Supplementary Text Figs. S1 to S27 Tables S1 to S3 Caption for data table S4 References (21–79) Other Supplementary Material for this manuscript includes the following: (available at www.sciencemag.org/cgi/content/full/339/6124/1207/DC1) Data table S4 (Microsoft Excel file)
-
Upload
nguyenhuong -
Category
Documents
-
view
228 -
download
0
Transcript of Supplementary Materials for -...

www.sciencemag.org/cgi/content/full/339/6124/1207/DC1
Supplementary Materials for
Gene Transfer from Bacteria and Archaea Facilitated Evolution of an Extremophilic Eukaryote
Gerald Schönknecht,* Wei-Hua Chen, Chad M. Ternes, Guillaume G. Barbier, Roshan P. Shrestha, Mario Stanke, Andrea Bräutigam, Brett J. Baker, Jillian F. Banfield, R. Michael Garavito, Kevin Carr, Curtis Wilkerson, Stefan A. Rensing, David Gagneul, Nicholas E.
Dickenson, Christine Oesterhelt, Martin J. Lercher, Andreas P. M. Weber*
*To whom correspondence should be addressed. E-mail: [email protected] (G.S.);
[email protected] (A.P.M.W.)
Published 8 March 2013, Science 339, 1207 (2013) DOI: 10.1126/science.1231707
This PDF file includes:
Materials and Methods Supplementary Text Figs. S1 to S27 Tables S1 to S3 Caption for data table S4 References (21–79)
Other Supplementary Material for this manuscript includes the following: (available at www.sciencemag.org/cgi/content/full/339/6124/1207/DC1)
Data table S4 (Microsoft Excel file)
2
Materials and Methods
Strains and Media Galdieria sulphuraria strain 074W was cultivated axenically in minimal mineral medium
supplemented with 25 mM Gal at 37°C in the dark as described previously (3).
DNA isolation and sequencing G. sulphuraria cells were harvested from heterotrophic cultures and ground to a fine
powder with a mortar and a pestle. Total nucleic acids were extracted by incubating the ground tissue overnight in 50 mM Tris-Cl pH7.5, 5 mM EDTA, and 1% (w/v) SDS, followed by extraction of proteins with phenol:chloroform:isoamylalcohol (24:24:1), and precipitation of DNA from the aqueous phase by ethanol. The pellet was dissolved in 10 mM Tris-Cl pH 7.5, 1 mM EDTA, and RNA was removed by incubation with DNAse-free RNAse, followed by de-proteination with phenol:chloroform:isoamylalcohol, and DNA-precipitation by ethanol. Nuclear DNA was further purified by CsCl-density gradient centrifugation of bis-benzamide-treated total DNA (21).
Three different libraries were generated for sequencing of genomic DNA: (i) a small-insert (approx. 2 kB inserts) shotgun sequencing plasmid library that was constructed in pSMART-HC Kan (Lucigen, Middleton, WI; www.lucigene.com); (ii) a Fosmid library containing 40 kbp inserts was constructed by physically shearing genomic DNA and ligation of end repaired, size fractionated DNA into the Fosmid vector pCC1FOS, followed by packing into Lambda phages. (iii) two BAC libraries (BamHI, HindIII) containing > 100 kbp inserts were constructed by the TAMU GENEfinder Genomics Resource Center (Texas A&M University, College Station, TX).
DNA sequencing was conducted using fluorescence-labeled dye terminators on an ABI 3730xl capillary DNA sequencing systems. Sequence data and chromatograms were stored on a Geospiza Finch server (Geospiza, Seattle, WA). After cleaning the raw sequence data (base quality > Q20, exclusion of contaminating vector or bacterial sequences), 1,769 and 1,699 sequence reads were generated from the BamH1 and HindIII BAC libraries, respectively, 5,817 sequence reads were generated from the Fosmid library, and 190,911 sequence reads were generated from three different small-insert libraries. A total of 147,097,538 Q20-bases were thus sequenced by Sanger technology, yielding approx. 10-fold genome coverage by Sanger-sequenced Q20-bases, based on an approximate genome size of 14 Mb. In addition, we generated 163,727 sequence reads (8.55 x genome coverage) from physically sheared genomic DNA using a GS20 Genomic Sequencer (Roche, Indianapolis, IN). A hybrid (i.e., Sanger and 454) assembly using the ARACHNE genome assembler (22) yielded 433 scaffolds with an N50 of 172,322 bases, giving a total scaffold length of 13712004 bases of which 292650 bases (2.1%) are gaps. Sequencing of mRNA as described previously (23).
Generation of gene models and annotation of protein coding genes
The AUGUSTUS (24) gene prediction program was used for the prediction of genes on the ARACHNE-generated scaffolds. AUGUSTUS was trained with EST-sequences generated by Sanger-technology (25) and by mRNA sequence data generated from two different normalized libraries (cells grown autotrophically and heterotrophically) using a GS20 sequencing system. The genes were then predicted with AUGUSTUS (24) integrating evidence from the mRNA sequencing and from proteins of C. merolae, but also allowing for ab initio predicted models in absence of such data. As a result 6,623 protein coding genes were predicted, 551 with two splice

3
variants, and three with three splice variants. Routine analyses were performed with splice variant 1, which is most confident according to the model of AUGUSTUS. Functions were assigned to the 6,623 predicted major isoforms of proteins based on sequence similarity to annotated genes from NCBI non-redundant (nr) protein database (26), NCBI Conserved Domain Database (CDD) (27), Arabidopsis thaliana genome (28), C. merolae genome (7), KEGG (29), and UniProt (30) databases. In addition, Gene Ontology (GO) (31), Mercator (32), InterProScan (33), and HHpred (34) were used to identify protein functions. Similarity searching was done with the BLAST program with soft masking being turned on (-F “m S”) (35). A BLAST bit-score cutoff of 50 was used, unless stated otherwise. Membrane transporter proteins were annotated with the TransAAP tool from TransportDB (36), with TransportTP (37), and by BLAST against the Transporter Classification Database (TCDB) (38). SignalP 4.0 (39) was used to search for secretory signal peptides. To test for enrichment of certain functional categories in subsets of annotated proteins High-Throughput GoMiner (40) was used. For this analysis G. sulphuraria proteins were substituted by UniProt (30) identifiers of best BLAST hits.
Generation of protein families
G. sulphuraria gene families were constructed to investigate both the size and functions of proteins associated with these families. We performed an all-against-all BLAST (35) using protein sequences in G. sulphuraria, parsed the bit scores from the BLAST output and submitted them to MCL (Markov Clustering; run with default parameters) to build gene families. Each resulting gene family contains either multiple proteins (table S2) that were derived from a common ancestor through duplication events or only a single protein (singlet). InParanoid version 2 (41) with default parameters was used to search for orthologous relationships between proteins in G. sulphuraria and proteins from 208 sequenced genomes (http://dx.doi.org/10.5061/dryad.84r5q) of common model organisms, thermophilic bacteria and archaea, as well as genomes containing top BLAST hits of G. sulphuraria proteins in the NCBI nr database (26). We chose orthologous groups with score 1 for further analysis when testing for horizontal gene transfer (HGT; see below). To investigate the evolutionary histories of G. sulphuraria protein families, we used a method similar to Merchant et al. (42) to expand G. sulphuraria gene families with orthologous proteins (identified using InParanoid, see above) plus paralogous proteins of the identified orthologs from 43 eukaryotic genomes (http://dx.doi.org/10.5061/dryad.84r5q). These expanded protein families were used for phylogenetic analyses and to compare expansion or reduction of a specific protein family among different eukaryotic species.
Identification of horizontal gene transfer (HGT) candidates
All HGT candidates were identified by phylogenetic analyses. Detailed phylogenetic trees were constructed manually (see below) for most large protein families (i.e., those with ten or more paralogs; table S2), for some protein families with best BLAST hits (NCBI, nr) in bacterial or archaeal sequences, and for some protein families with protein domains (PFAM) and/or annotations characteristic for Bacteria or Archaea. This resulted in the identification of several HGT candidates.
In addition, a genome-wide, systematic screen for HGT candidates was performed using bioinformatics methods. To estimate a lower bound for HGT into G. sulphuraria, we aimed to identify only unequivocal cases of HGT. Proteins giving only hits in bacterial or archaeal sequences when blasted against our 208-species database were further analyzed as described

4
below (next paragraph a) to e)). For proteins giving best BLAST hits in bacterial or archaeal sequences in addition to hits in eukaryotic sequences, we performed a phylogenetic analysis using the following procedure. A multiple sequence alignment (MSA) for each of the proteins and their orthologous proteins (identified using InParanoid) from the same 208 genomes was constructed using MUSCLE (43), with the maximum number of iterations set to 100, followed by GBLOCKS (44) with parameters ‘-b3=8 –b4=2 –n=y’ to remove poorly aligned regions. We selected the best protein evolution model for each MSA using ProtTest (45), and used it to reconstruct the phylogenetic relationships for the proteins in the MSA with PhyML (46). To select putative HGT candidates with statistical significance, we performed a RELL analysis implemented in the ‘codeml’ command of the PAML package (47) on each phylogenetic tree indicating HGT. This test compares the protein family tree obtained from our analysis, indicating HGT from a bacterium or archaeon into G. sulphuraria, with the best tree that enforces monophyly of eukaryotic sequences. HGT is only assumed if the tree enforcing monophyly of eukaryotic sequences gets a RELL bootstrap support (pRELL) of 5% or less out of 10,000 replicates in this analysis. Following this systematic bioinformatics screen, the phylogenetic tree for each statistically significant (according to the RELL analysis) HGT candidate was manually checked and only accepted when a clear pattern of horizontal gene transfer was observed.
Very stringent criteria were used for our phylogenetic analyses: a) Sequences that were too short (<150 amino acids) to build reliable MSAs were not accepted; b) phylogenetic trees with less than ten species were excluded: c) genes that were potentially transferred from cyanobacteria were only accepted as HGT candidates when homologs were absent from other photosynthetic eukaryotes, and when the annotation did not indicate a function in photosynthesis, to discriminate against endosymbiotic gene transfer; d) in cases where a corresponding phylogenetic tree did not allow conclusions about the origin of a gene in G. sulphuraria the gene was removed; e) in order to check whether a potential HGT candidate had significant sequence similarity with proteins from eukaryotic species not included in the 208 genomes used for the systematic bioinformatics screen, each potential HGT candidate was submitted to the NCBI Web BLAST service (nr) and a tree of best BLAST hits was generated by the Tree View option; HGT candidates that were not confirmed by a tree of best BLAST hits were not accepted. In cases where an identified HGT candidate was a member of a protein family with two or more paralogs, and the other paralogs had not been identified as HGT candidates, a detailed phylogenetic tree was constructed for the complete protein family to decide which family members were HGT candidates. To facilitate manual inspection of the phylogenetic trees from the systematic bioinformatics screen, we colored tree branches and leaf labels with predefined rules using ColorTree (48).
Data analysis and generation of phylogenetic trees
Non-linear regression analysis was performed with GraphPad Prism 5.01 (GraphPad Software Inc., La Jolla, CA). Two-tail P values for Fisher's exact tests were calculated as defined by Agresti (49) (at http://www.langsrud.com/stat/fisher.htm ). To generate the phylogenetic trees presented as figures, homologous sequences from protein families (see above) and sequences resulting from BLAST (35) searches (NCBI non-redundant (nr) protein database (26) and KEGG (29)) were collected using MEGA (50). At NCBI BLAST runs were carried out separately for different clades to improve broad phylogenomic sampling. Protein sequences from bacteria or archaea that were identified as potential ‘donor’ organisms for HGT into G. sulphuraria were used as BLAST queries to further improve the resolution of phylogenetic trees. Incomplete or

5
highly redundant sequences (>90% amino acid identity) were removed. Multiple sequence alignments were generated with T-Coffee in the ‘mcoffe’ and the ‘accurate’ mode (51). High scoring portions of multiple sequence alignments (T-Coffee score 5 to 9) were extracted (44), followed by comparison of the two resulting alignments (‘mcoffee’ versus ‘accurate’). The better alignment, based on scores (T-Coffee scores from 0 to 100), length, number of invariant positions, and visual inspection, was used to construct a phylogenetic tree. An estimation which model of protein evolution best fits the multiple sequence alignment was generated by ProtTest (45). The best models were used to generate phylogenetic trees with PhyML 3.0 (46) estimating branch support values by non-parametric bootstrap with 200 replicates, and with the MPI version of MrBayes 3.1 (52). MrBayes was run with twelve chains for 5,000,000 generations sampling every 100th generation; the first 25% of samples were ignored when calculating parameters and consensus tree. Phylogenetic trees were visualized in Dendroscope (53), MEGA (50), and EvolView (54). Only support values >50% are given.
Supplementary Text
Early divergence of G. sulphuraria and C. merolae The low degree of colinearity between the genomes of G. sulphuraria and C. merolae (fig.
S2) indicates an early divergence of these two species. To obtain a rough estimate as to when G. sulphuraria and C. merolae diverged, percent amino acid identity of orthologous gene pairs was compared for genomes from different pairs of species, and normalized cumulative frequencies were plotted (fig. S1). At 50% percent cumulative frequency (median value), amino acid identity for annotated proteins from the two red algal genomes was 44.9%, compared to 45.4% for the species pair Homo sapiens / Drosophila melanogaster. Taking percent amino acid identity as a rough measure for divergence time, this means that G. sulphuraria and C. merolae split slightly earlier (lower amino acid identity) than H. sapiens and D. melanogaster did. The divergence between vertebrates and insects is dated to about 910 (±300) million years ago (55), indicating that - assuming comparable mutation rates - G. sulphuraria and C. merolae diverged about 900 million years ago.
This early divergence is further supported by a comparison of all annotated proteins in the genomes of G. sulphuraria and C. merolae. Only 1,259 annotated proteins (19%) from G. sulphuraria have proteins from C. merolae as best BLAST hits, and only slightly more than 60% (4,017 proteins) give a significant BLAST hit (score >50) with C. merolae. The latter percentage is comparable to that of BLAST hits with proteins from Arabidopsis thaliana (4,032 proteins), emphasizing the early divergence of the two red algae These data are in agreement with phylogenetic studies of the Cyanidiophyceae showing a very early divergence of the lineages leading to G. sulphuraria and C. merolae (56, 57). Based on estimates that the Cyanidiophyceae split from the other red algae (Rhodophyta) approximately one billion years ago (57, 58), this also indicates that G. sulphuraria and C. merolae probably diverged about 900 million years ago.
Horizontal gene transfer (HGT)
While HGT has been observed for unicellular eukaryotes (59), its scope and function in eukaryotic evolution are not well understood. To develop an idea about the extent of horizontal gene transfer in G. sulphuraria, and to statistically confirm HGT candidates, an independent, genome-wide screen combining bioinformatics methods and manual inspection was performed (see above). This search was limited to genes that were acquired specifically by

6
Cyanidiophyceae (G. sulphuraria and C. merolae), and in most cases the genes were only observed in G. sulphuraria and no other eukaryotic organism. To be conservative, we excluded genes that might have been acquired before red alga and green plants split (60) and therefore occur in Cyanidiophyceae as well as green algae and/or land plants. Moreover, we included only genes that most likely have originated from Bacteria or Archaea. As outlined above, we attempted to exclude endosymbiotic gene transfer from cyanobacteria, i.e., the massive gene transfer from the cyanobacterial genome of the evolving plastid into the nuclear genome of the host cell during primary endosymbiosis (61). It seems more likely that a gene of potential cyanobacterial origin only observed in G. sulphuraria originates from HGT, compared to the alternative of endosymbiotic gene transfer followed by loss in all other eukaryotic photosynthetic lineages. Moreover, for genes potentially transferred from cyanobacteria to G. sulphuraria, the phylogenetic position of the descendant of the potential ‘donor’ clade (see below; table S4) was compared with the recently published phylogenetic position of the primary plastid within the cyanobacterial tree (62). HGT candidates for which the potential donor was a close neighbor of the primary plastid were excluded. Similarly, it is unlikely that HGT candidates result from endosymbiotic gene transfer that occurred in the process of mitochondrial evolution after the primary endosymbiosis of an alphaproteobacterium. HGT candidates (only observed in G. sulphuraria) of alphaproteobacterial origin seem more likely to originate from HGT, as the alternative hypothesis of endosymbiotic gene transfer requires subsequent losses in all other eukaryotic lineages. Moreover, no HGT candidate shows similarity to sequences from Rickettsia, which are believed to be similar to the primary endosymbiont (63) (table S4).
178 G. sulphuraria proteins had significant BLAST hits (score > 50) only in bacterial or archaeal sequences, meaning that no RELL analysis (see above) could be performed due to a lack of eukaryotic homologs. Out of those 178 proteins, 110 were accepted as HGT candidates after further inspection using the NCBI Web BLAST service (nr) combined with the Tree View option and criteria as described above. Phylogenetic analyses indicated that those 110 HGT candidates resulted from 25 HGT events. Members of the large Archaeal ATPase families with numerous paralogs (see fig. S11) were included here. 618 proteins had best BLAST hits in bacterial or archaeal sequences. Out of those, RELL analyses for maximum likelihood phylogenetic trees confirmed horizontal gene transfer for 163 proteins with statistical significance (5% significance level). From these 163 proteins, 50 were accepted as HGT candidates after further inspection. Phylogenetic analyses indicated that those 50 HGT candidates resulted from 44 HGT events.
Genes were excluded as HGT candidates during further inspection in case the encoded protein a) was too short (<150 amino acids); b) had too few BLAST hits; c) potentially originated from endosymbiotic gene transfer; d) resulted in a phylogenetic tree that did not allow conclusions; e) had significant sequence similarity with proteins from eukaryotic species not included in the 208 genomes used for the systematic bioinformatics screen, resulting in a phylogenetic tree of best BLAST hits (NCBI nr) that did not confirm HGT. These very stringent criteria for the manual inspection of each HGT candidate were aimed at preventing false positives as far as possible. Out of eight cases where a more detailed manual phylogenetic analysis was performed for a protein family that contained HGT candidates identified by the systematic bioinformatics screen, only one phylogenetic tree indicated a false positive (probably caused by limited phylogenomic sampling).
Together with HGT candidates identified during detailed, manual phylogenetic analyses of large protein families and of protein families showing obvious similarity to bacterial or archaeal

7
proteins, a total of 337 genes resulting from 75 horizontal gene transfers were detected (see table S4). The genome-wide bioinformatics screen detected 69 HGT events, and missed six out of 18 HGT events that were identified during detailed, manual phylogenetic analyses of protein families from G. sulphuraria. The genome-wide bioinformatics screen thus had a non-negligible number of false negatives. This is even more obvious when total numbers of HGT candidates are compared: out of a total of 337, only 160 HGT candidates were identified by the genome-wide bioinformatics screen. The low sensitivity was accepted in favor of high stringency. Some proteins did not give a sufficient number (>10) of significant BLAST hits (score >50) in our 208-species dataset, as for example the Archaeal ATPases of protein family #1, where just one family member out of 133 was detected. In other cases, best BLAST scores in eukaryotic sequences did not correctly predict the position of a G. sulphuraria protein sequence in a detailed, manually constructed phylogenetic tree, also resulting in false negatives in the systematic bioinformatics screen. The rather stringent criteria for the manual inspection of each HGT candidate that aimed at preventing false positives are likely to have increased the number of false negatives as well. Due to the high stringency, the number of 75 HGT events giving rise to 337 genes should be considered a lower bound for HGT in G. sulphuraria.
As a control for contaminations with bacterial sequences during sample preparation and sequencing, all HGT candidate genes were compared by BLASTN against the NCBI nt database. The only significant hit was with a 'Cyanidium caldarium' (a historic name for G. sulphuraria and related Cyanidiophyceae) gene. All HGT candidates were mapped onto the 433 scaffolds, and the percentage of all genes on each scaffold was compared with the percentage of HGT candidates on each scaffold. This comparison did not show any indication for an enrichment of HGT candidates on specific scaffolds, excluding the possibility that HGT candidates were largely located on small scaffolds that cannot be assembled into the overall genome. A comparison of protein sequence lengths showed little difference between HGT candidates and all other proteins.
While bacterial (or archaeal) genes usually do not have introns, 72.4% of G. sulphuraria genes contain introns (table S1). For genes transferred recently from bacteria or archaea into the G. sulphuraria genome one therefore would expect fewer or no introns. Genes inferred to originate from horizontal gene transfer (table S4) on average have 0.80 introns per gene (55% have no intron), less than half of the 2.06 introns per gene for the entire genome (median 1 intron per gene; fig. S6). This significantly smaller number of introns per gene (P = 0.0012, Mann-Whitney test) is expected for genes that are of bacterial or archaeal origin and thus initially did not contain any introns. Similarly, the GC content of genomes from different organisms can differ significantly, and as a result, genes acquired by HGT can deviate in their GC content from the GC content of the entire genome (64). For G. sulphuraria the average GC content of all 6623 annotated genes is 39.9±0.034% compared to 38.5±0.16% for all 337 HGT candidate genes, and 40.6±0.2% for the 120 HGT candidates without Archaeal ATPases (fig. S7). All 217 Archaeal ATPase genes go back to a single HGT event (fig. S9; possibly by a gene with a rather low GC content; fig. S7), but make up almost two thirds of all genes likely to result from HGT. Their inclusion would thus strongly bias comparisons of HGT vs. non-HGT genes. Comparing the GC content of 120 HGT candidates (without Archaeal ATPase genes) to the entire genome indicates a significantly higher GC content for HGT candidates (P = 0.0030, t-test).
Finally, oligonucleotide usage of genomes from different organisms can differ, and as a result, genes acquired by HGT can deviate in their oligonucleotide usage from the rest of the

8
genome. To test this, we calculated ‘genomic signatures’ (zero order Markov distributions) using di-, tri-, tetra-, and hexanucleotides (65). The signature for each gene is defined by a vector containing the relative frequencies of all words of length n (n = 2, 3, 4, or 6), divided by the relative frequencies of the individual nucleotides (65). We first calculated the signatures of the coding sequences of all non-HGT genes, and averaged them to define a genomic reference signature. We then scored the signature of each individual gene by calculating the Pearson correlation coefficient (R) between the signature of the gene and the genomic reference signature. The dinucleotide score distribution of the 120 HGT candidates (without the Archaeal ATPases) showed a significantly stronger deviation from the genomic reference signature compared to non-HGT genes (P = 0.00034) (fig. S7). We obtained similar results using signatures of tri-, tetra-, and hexanucleotides (P = 0.00011, 0.0014, and 0.011, respectively). The lower average intron number of HGT candidates (fig. S6), the significantly different GC content (fig. S7), and the deviating oligonucleotide usage (fig. S7) can be taken as additional support that these genes in G. sulphuraria did indeed originate from bacterial or archaeal genes that had no introns, on average slightly higher GC contents, and different oligonucleotide usages compared to the core genome of G. sulphuraria.
To gain insight into the possible ‘donor’ organisms from which G. sulphuraria might have acquired genes by HGT, we determined for each HGT candidate the organism containing the protein that gave the best BLAST hit, or that was closest in a phylogenetic tree (table S4). Since most HGT events in G. sulphuraria likely occurred a long time ago, the extant strains identified in this way did probably not transfer genetic material into G. sulphuraria, but are likely to be descendants (or close relatives of descendants) of the original ‘donor’ organisms. This analysis indicates that there is no special bacterial or archaeal clade that mainly ‘donated’ genes to G. sulphuraria. Instead, G. sulphuraria acquired genes from a wide variety of different clades of Archaea and Bacteria (fig. S8).
It is becoming increasingly clear that ecological similarity shapes horizontal gene transfer (66), and therefore one would expect that a large fraction of potential gene ‘donors’ lived in the same extreme environment as G. sulphuraria does (and most likely did at the time of the HGTs). Indeed, when looking at the habitat of the bacterial organisms identified as descendants of possible gene donors, almost one third (22 out of 67) are thermophilic or thermoacidophilic, compared to less than 10% of all sequenced bacterial genomes (67 out of 927 as of February 2010). Thus, there is a significant enrichment in thermophilic and thermoacidophilic bacteria among the potential ‘donors’ for HGT into G. sulphuraria (P = 7.8×10⁻⁹, Fisher's exact test; Odds Ratio = 6.28 = (22/45)/(67/860)). In addition, we calculated the number of protein families that have orthologs in extremophilic bacteria or archaea. This resulted in 66 out of 76 proteins families containing HGT candidates, compared to 1648 out of 5117 non-HGT protein families (Odds Ratio = 13.89 = (66/10)/(1648/3469)). Thus, there is a significant enrichment of protein families with orthologs in extremophiles among HGT candidates (P = 1.52×10⁻²², Fisher's exact test).
Most HGTs from Bacteria or Archaea into G. sulphuraria seem to be ancient according to our phylogenetic analyses. The resulting protein sequences from G. sulphuraria in most cases branch off relative ‘deep’ within phylogenetic trees, forming rather long branches, and often subsequent gene duplications into several paralogs are observed. In a few instances, HGT even happened before the G. sulphuraria and C. merolae lineages split (see, e.g., fig. S13). This long evolutionary history within the G. sulphuraria genome probably explains why 45% (152 out of

9
337) of HGT candidates have acquired introns, even though they are of bacterial or archaeal origin.
Excreted proteins
Using a newly designed rRNA-specific oligonucleotide probe (Cya1208, 5’-AGCCCAGGACATCAAAGG-3’), we detected metabolically active Galdieria spp. cells in a subsurface mine, the Richmond Mine in northern California, by FISH (fluorescence in-situ hybridization) (http://dx.doi.org/10.5061/dryad.84r5q). G. sulphuraria cells growing in environments such as the Richmond Mine are dependent on the uptake of organic nutrients from the environment to drive heterotrophic growth, as the absence of light does not permit photosynthesis. It is reasonable to hypothesize that G. sulphuraria is ‘grazing’ on sulfur-oxidizing microbial communities to satisfy its energy needs since these bacteria are the sole net producers in this environment. Likely, G. sulphuraria is able to degrade the microbial biofilm by secretion of hydrolytic enzymes that release monosaccharides and other small metabolites from the organic polymeric film matrix. Supporting this hypothesis is the fact that G. sulphuraria possess a highly cross-linked, protein-rich cell wall (67), frequently incrusted with silica (68), that protects the alga from its own extracellular enzymes. Proteomic analyses have indicated that G. sulphuraria excretes several proteins, which may be related to its heterotrophic life style or may be involved in cell wall metabolism (18, 69). Genome-wide analyses of proteins containing a predicted secretory signal peptide (39, 70) showed more than half (138 from 266, or 52%) annotated as ‘hypothetical protein’, significantly more than in the genome as a whole (36%). Similarly, out of 17 proteins that were identified in a proteomic analysis (18) as being excreted (i.e., at least five-times more spectral counts in the medium compared to the soluble fraction), eight were annotated as ‘hypothetical proteins’ due to a lack of similarity to any protein with known function.

10
Fig. S1.
Molecular divergence between G. sulphuraria and C. merolae. As a measure of molecular divergence, percent amino acid identity of orthologous gene pairs was compared for different species pairs. Sets of orthologous gene pairs were identified by reciprocal best BLAST hits with BLAST scores > 50. Normalized (to 100%) cumulative frequencies are plotted against % amino acid identity for six different species pairs. The two red algal genomes display a slightly lower amino acid identity (median 44.9%) compared to Homo sapiens / Drosophila melanogaster (45.4%). The vertebrate – insect divergence probably occurred about 910 million years ago (55), indicating a similar age for the G. sulphuraria – C. merolae split.
0
10
20
30
40
50
60
70
80
90
100
20 30 40 50 60 70 80
Cu
mu
lati
ve F
req
uen
cy (%
)
% Amino Acid Identity
G. sulphuraria / T. brucei
G. sulphuraria / H. sapiens
G. sulphuraria / O. sativa
G. sulphuraria / C. merolae
H. sapiens / D. melanogaster
H. sapiens / S. purpuratus

11
Fig. S2
Colinear regions between G. sulphuraria and C. merolae genomes. A colinearity plot of all 20 C. merolae chromosomes (Y axis) against 433 G. sulphuraria scaffolds (X axis) was generated with ColinearScan (http://colinear.cbi.pku.edu.cn/#overview) using a minimum BLAST score of 100. Blue dots indicate orthologous genes identified using InParanoid (41), which are linked by red lines if they are in synteny blocks. Genes in one block are not necessarily next neighbors, but may be separated by other genes, to allow for gene loss, gene creation, and/or minor chromosomal re-arrangements.
0 2 4 6 8 10 15 20 25 30 35 40 45 60 100 22050 432
234
5
6
7
8
1
9
10
11
12
13
14
15
16
17
18
19
20C
ya
nid
iosc
hy
zon
me
rola
e c
hro
mo
som
es
Galdieria sulphuraria scaffolds
2 M
b
2 Mb

12
Fig. S3.
Distribution of distances between coding regions in different unicellular algae, displayed as normalized (to 100%) cumulative frequencies against length (log-scale). Median values in bp are (from smallest to largest): Ostreococcus tauri, 228 (71); G. sulphuraria, 230; Ostreococcus lucimarinus, 284 (72); Thalassiosira pseudonana, 634.5 (73); Phaeodactylum tricornutum, 687 (10); C. merolae, 1404.5 (7); Chlamydomonas reinhardtii, 1534 (42); and Aureococcus anophagefferens, 1563 (74). Color coding: Chlorophyta, Rhodophyta, Stramenopiles).
0
10
20
30
40
50
60
70
80
90
100
1 10 100 1000 10000 100000
Cu
mu
lati
ve F
req
uen
cy (
%)
Distance between coding regions (bp)
G. sulphurariaC. merolaeP. tricornutumT. pseudonanaA. anophagefferensC. reinhardtiiO. lucimarinusO. tauri

13
Fig. S4.
Histogram (log-scale) for the number of introns per gene. The distribution of genes with a certain number of introns is described by an exponential decay function (light blue line),
expy A K x with start amplitude A = 2860±59 and rate constant K = 0.47±0.01.

14
Fig. S5.
Intron and exon size distributions of the G. sulphuraria genome. Size distributions of 13630 introns (top) and 20050 exons (bottom) are displayed as frequency against logarithmic length (log10 bp). (Top) The distribution of logarithmic intron lengths is described by a simple Gaussian distribution with Ampl = 2796±34, Mean = 1.752±0.0005 (56.5 bp), and SD = 0.0363±0.0005. (Bottom) The distribution of logarithmic exon lengths is more complex and was described by the sum of two Gaussian distributions
2 2
1 21 2
1 2
0.5 0.5x Mean x Mean
y Ampl exp Ampl expSD SD
with Ampl1 = 926±13, Mean1 = 2.20±0.01 (158 bp), SD1 = 0.299±0.008, Ampl2 = 422±15, Mean2 = 2.95±0.02 (891 bp), and SD2 = 0.27±0.01. Bin width is 0.02 for the upper and 0.5 for the lower graph; note different X-axis scaling in top and bottom graph.
15
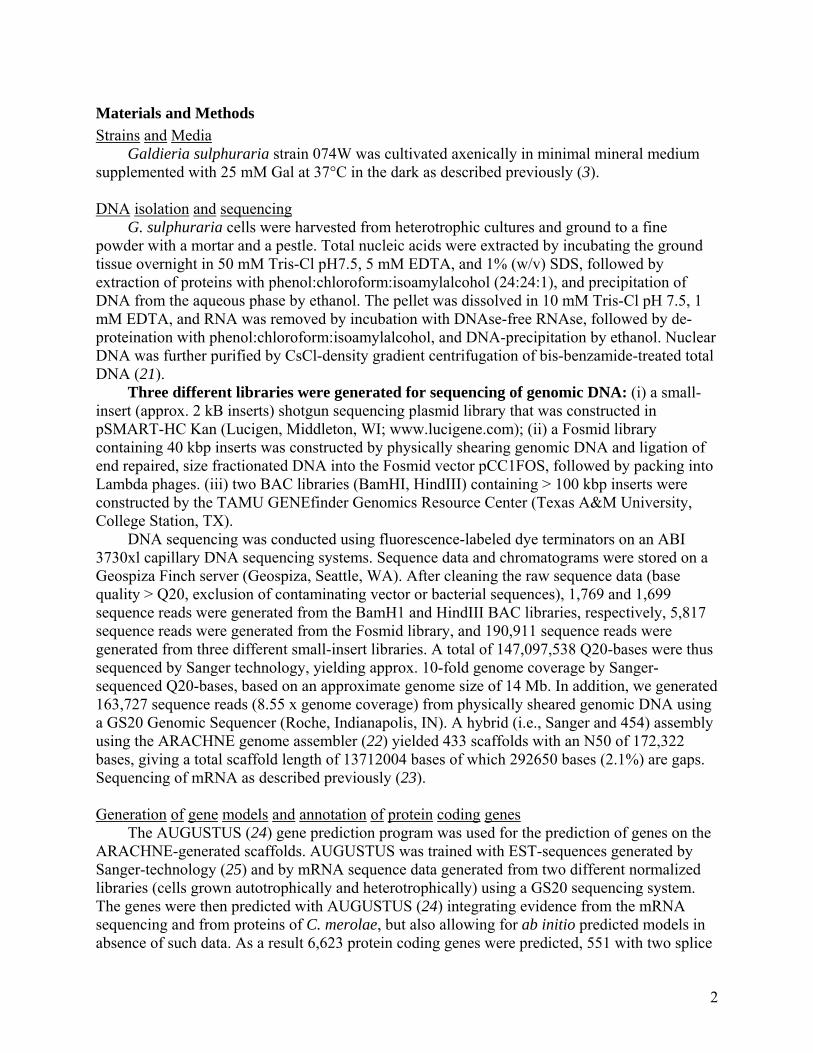
Fig. S6.
Genes originating from horizontal gene transfer have fewer introns. The histograms show the percentage of genes with a given number of introns (compare fig. S4). A comparison of all 6623 annotated genes (blue) with the 337 genes likely to originate from horizontal gene transfer (orange; HGT) shows a significantly lower number of introns in genes originating from HGT (average of 0.8 introns per gene compared to 2.06 for all genes; P = 0.0012, Mann-Whitney test).
0%
10%
20%
30%
40%
50%
0 1 2 3 4 5 6 7 8 9 10 11 12 13 14 15
Fre
qu
en
cy
# of Introns
All GenesHGT Candidates

16
Fig. S7.
Genes originating from horizontal gene transfer differ in GC content (top) and dinucleotide usage (bottom) from the rest of the genome. Top: Histogram of GC content in 1% intervals. A comparison of all 6623 annotated genes (blue) with the 120 HGT candidates (*excluding the 217 genes encoding Archaeal ATPases; orange) shows a significantly higher GC content of HGT candidates (P = 0.0030, t-test). The 217 genes encoding Archaeal ATPases (grey) show a significantly (P = 0.0035) lower GC content compared to all genes (blue). Bottom: Histogram of dinucleotide usage scores in 0.05 intervals. A comparison of all non-HGT genes (green) with the 120 HGT candidates (*excluding the 217 genes encoding Archaeal ATPases; orange) shows different dinucleotide usage scores (‘genomic signatures’). Dinucleotide usage score was defined as Pearson’s correlation coefficient R between normalized dinucleotide frequencies in each gene and the corresponding mean normalized frequencies across all G. sulphuraria non-HGT genes (for details see text). As all 217 genes encoding Archaeal ATPases result from the transfer of a single gene (fig. S9), their inclusion would strongly bias both analyses (top and bottom), and consequently these genes were excluded from the statistical comparisons.
0
5
10
15
20
25
30
22 24 26 28 30 32 34 36 38 40 42 44 46 48 50 52 54
Fre
qu
ency
(%
)
% GC
All Genes
HGT Candidates*
Archaeal ATPases
0
10
20
30
40
50
0.0 0.1 0.2 0.3 0.4 0.5 0.6 0.7 0.8 0.9 1.0
Fre
qu
ency
(%
)
R (for Dinucleotide Usage)
Non-HGT Genes
HGT Candidates*
Archaeal ATPases

17
Fig. S8.
Number of horizontal gene transfers from different phyla into the genome of G. sulphuraria. For each horizontal gene transfer the phylum of the ‘donor’ organism from which the gene might have originated was determined by phylogenetic analysis or best BLAST hits (see table S4 for details).

18
Fig. S9.
Phylogenetic tree of the MNS clade of the STAND class of P-loop ATPases. The unrooted Bayesian (52) tree calculated with a CpREV+I+G model of protein evolution shows posterior probabilities above the branches and PhyML (75) bootstrap support values (using LG+I+G+F) below the branches. Thick branches indicate 1.0 posterior probability. Constraining all eukaryotic sequences into one monophyletic branch outside the Archaeal ATPases resulted in a tree with pRELL = 0.0. For clarity some sub-branches with sequences from the same clade have been collapsed (elongated triangles) with the height of the triangles reflecting the number of taxa included (3 to 22). The tree was constructed from 136 sequences: 41 from G. sulphuraria, all 56 seed sequences of the ‘Arch_ATPase’ family (PF01637) (76), plus sequences mentioned in Leipe et al. (20) plus BLAST (35) hits of these three groups for sequences outside the Archaeal ATPases. Sequences with >90 % identity were removed, and thus only one sequence from protein family #19 is included. Square brackets indicate proteins of monophyletic origin. Six families as established by Leipe et al. (20) are indicated; MJ-type, SSO-type, and PH-type families of the Archaeal ATPases, plus BL0662 family, SpsJ family, and Npun2340/2341 family outside the Archaeal ATPases. Color coding: Archaea, Cyanobacteria, other Bacteria, Rhodophyta, Amoebozoa. Bar represents 0.2 changes per site.
Dictyostelium discoideum DDBG0277693 Dictyostelium discoideum DDBG0269752
Npun2340/2341 Cyanobacteria( )
Lyngbya majuscula LYNGBM3L_74060 Trichodesmium erythraeum Tery1785
Cyanobacteria Pseudomonas syringae PSYAR_12904
Synechocystis sp. slr1243 Proteobacteria
SpsJ
( )BL0662 Actinobacteria Bacteroides thetaiotaomicron BT0660
Parabacteroides sp. HMPREF0619_03070 Thermococcus barophilus TERMP_02055 Pyrococcus furiosus PF0007
Thermococcus gammatolerans TGAM_0978 Methanosarcina acetivorans MA1854
. GI:1914801Thermococcus sp Methanocaldococcus jannaschii MJECL04
MTH196Methanothermobacter thermautotrophicus Pyrococcus horikoshii PH0977
PAB1582Pyrococcus abyssi PH0436Pyrococcus horikoshii
PAB1598Pyrococcus abyssi PAB1371Pyrococcus abyssi
Fusobacterium nucleatum FN0123 PH0846Pyrococcus horikoshii
PAB2383Pyrococcus abyssi
PH
0846
Arc
h_1
SSO1545Sulfolobus solfataricus CTN 1567Thermotoga naphthophila TM1011Thermotoga maritima
Pyrococcus SS
O1
54
5
Protein family #2
Protein family #19 Protein family #1b
Protein family #1a
Ga
ldie
ria
sulp
hu
rari
a
Methanocaldococcus jannaschii PH0541Pyrococcus horikoshii
PAB0800Pyrococcus abyssi MJ0
074
Euryarchaeota
PAE2855Pyrobaculum aerophilum
Pcal1542Pyrobaculum calidifontis Tpen1344Thermofilum pendens
Hbut0744Hyperthermus butylicus Pcal1338Pyrobaculum calidifontis
Pcal0469Pyrobaculum calidifontis Pcal0902Pyrobaculum calidifontis
Caldivirga maquilingensis Tpen1381Thermofilum pendens
Cmaq1422Caldivirga maquilingensisPyrobaculum
Cre
nar
chae
ota
Arc
ha
eal A
TP
ases
0.9870
100
100
100
100
100
0.94
0.81
0.690.8261
0.93
98
0.82
0.61
0.9986
98
0.94
0.935583
8382
0.530.70 72
0.8
0
0.97
820.77
96
0.90100
100
100100
100
100
100
10095
0.5
1
72
0.96
0.9089
98
0.88
0.5
7
0.5
9
0.97
870.580.56
0.2

19
Fig. S10.
Manual alignment of Archaeal ATPase domains of proteins from different families of the MNS clade of the STAND class of P-loop ATPases (20). Top to bottom: ten seqs. from the MNS clade not belonging to the Archaeal ATPases (six of the Npun2340/2341 family and four of the SpsJ family), 15 seqs. from the Archaeal ATPases (three each of the five families; fig. S9), and ten seqs. from G. sulphuraria (four each of protein family #1 and #2, two of family #19). An asterisk indicates a column of strict conservation. A poorly conserved region between strand 2 and 3 indicated by -X- was omitted, as was the region between strand 3 and 4 separating the two blocks of alignment shown. Secondary structure elements indicated below the alignment. Amino acids are color coded according to their biochemical properties: hydrophobic (A, F, I, L, M, V in yellow), neutral (N, Q, S, T, W in green), negative (D, E in red), positive (K, R in blue), cysteine (C in olive), glycine (G in fuchsia), histidine (H in teal), tyrosine (Y in lime), proline (P in blue).

20
Gasu_29710 Gasu_61330
Gasu_07060 Gasu_63600
Gasu_07070 Gasu_61130 Gasu_15680 Gasu_63480 Gasu_63570 Gasu_64870
Gasu_65290 Gasu_26630 Gasu_65440 Gasu_64910
Gasu_64580 Gasu_51710
Gasu_56180 Gasu_63950
Gasu_24660 Gasu_63640
Gasu_36120 Gasu_65980
Gasu_42890 Gasu_64690
Gasu_34410 Gasu_62190 Gasu_31660 Gasu_19180 Gasu_32560 Gasu_63670
Gasu_38370 Gasu_65590 Gasu_00960
Gasu_39160 Gasu_61070
Gasu_51120 Gasu_62770
Family #1a
Gasu_30810 Gasu_61090
Gasu_36780 Gasu_61670
Gasu_25720 Gasu_41410
Gasu_19170 Gasu_37570
Gasu_63280 Gasu_65430
Gasu_27640 Gasu_56170
Gasu_64600 Gasu_29700
Gasu_15690 Gasu_63200 Gasu_31650 Gasu_03880 Gasu_51100
Gasu_07080 Gasu_51130
Gasu_63590 Gasu_65050
Family #1b
Gasu_63350 Gasu_33390
Gasu_59780 Gasu_31670
Gasu_61280 Gasu_34390
Gasu_25640 Gasu_54000 Gasu_49850
Gasu_61270 Gasu_24690
Gasu_62800 Gasu_64370
Gasu_42170 Gasu_61430 Gasu_42880
Gasu_36830 Gasu_25710
Gasu_61310 Gasu_38330 Gasu_61650 Gasu_36130
Gasu_64950 Gasu_61230
Gasu_21290 Gasu_51110
Gasu_34430 Gasu_00970
Gasu_61390 Gasu_41370
Gasu_33830 Gasu_24670
Gasu_64220 Gasu_03890 Gasu_46060
Family #2
Gasu_39090 Gasu_48380
Gasu_37580 Gasu_25730 Gasu_63190 Gasu_29690
Family #19
0.5
8
0.9
0
92
97
100
0.96
0.93
0.750.75
0.75
0.75
0.75
0.750.75
0.74
0.71
0.97
99
100
0.800.820.91
0.54
0.90
0.69
0.540.51
0.50
0.2
Fig. S11.
Phylogenetic tree of G. sulphuraria protein families #1, #2, and #19. The unrooted Bayesian (52) tree calculated with a JTT+G model of protein evolution shows posterior probabilities at the branches. PhyML (75) percent bootstrap support values (using JTT+G+F) below the branches, for clarity, are only given for major branches. Thick branches indicate ≥0.99 posterior probability. The tree was constructed from all 101 complete sequences (including those >90% identical) of protein families #1, #2, and #19. Bar represents 0.2 changes per site.

21
Fig. S12.
Number of Archaeal ATPase genes per 1000 coding genes in genomes of thermophilic and hyperthermophilic organisms as function of optimum growth temperature. Genomes from 57 thermophilic and 29 hyperthermophilic archaea and bacteria were downloaded from NCBI via the “microbial genomes properties” portal (http://www.ncbi.nlm.nih.gov/genomes/lproks.cgi ). Optimum growth temperatures were obtained from NCBI. If temperatures were given as a range (58-60°C for example), the highest number was chosen (60°C in this case). In total, we obtained valid optimum growth temperatures for 38 thermophilic (including 8 archaea, in red, and 30 bacteria, in cyan) and 26 hyperthermophilic (all archaea) organisms. The HMM model of Archaeal ATPases (accession ID: PF01637.10) was downloaded from the Pfam database (76). HMMER version 3 beta (http://hmmer.janelia.org/ ) was used to score each protein sequence in each thermophilic and hyperthermophilic species against this HMM model. A protein was considered an Archaeal ATPase if the e-value of the HMM search was less than 10-5. A trend line (solid) plus correlation coefficient are given for both data sets combined. A trend line for data points from archaea only gave a similar result (dashed line; R = 0.56).
0
5
10
15
20 40 60 80 100 120
AT
Pas
es /
1000
gen
es
Optimum Growth T / °C
R = 0.72

22
Fig. S13.
Phylogenetic tree of the monovalent cation/proton antiporter-1 (CPA1, TC 2.A.36) family, indicating a high phylogenetic diversity in G. sulphuraria. The unrooted Bayesian (52) tree calculated with a Blosum62+G model of protein evolution shows posterior probabilities above branches and the PhyML (75) percent bootstrap support (using WAG+I+G+F) below the branches. Thick branches indicate ≥0.99 posterior probability. For clarity some sub-branches have been collapsed (elongated triangles), with the height of the triangles reflecting the number of taxa included (3 to 12). Curly brackets indicate different cellular locations according to TCDB annotations (38, 77). The dashed line separates the upper branch, mainly containing bacteria, from the lower two branches, mainly containing eukaryotes. Color coding: Bacteria, Streptophyta, Chlorophyta, Rhodophyta, Stramenopiles, Alveolata, Excavata, Amoebozoa, Fungi, Animals & Choanoflagellates. Bar represents 0.5 changes per site.
Gasu_24490Galdieria sulphuraria
Gasu_18700Galdieria sulphuraria
CMR382CCyanidioschyzon merolae
CHU 1783Cytophaga hutchinsonii
Noc 0159Nitrosococcus oceani
Bacteria
APJL 1022Actinobacillus pleuropneumoniae
PM0365Pasteurella multocida
GSPATP00033903001Paramecium tetraurelia
Land Plants {Endosomal}
Green Algae
Green Algae
Fungi {Vacuolar}
Bacteria
Eukaryotes
Land Plants {Vacuolar}
CHLREDRAFT 1749Chlamydomonas reinhardtii
Chlre3 206027Chlamydomonas reinhardtii
86.m00157Tetrahymena ttetraurelia
. OSTLU 1871Osterococcus ucimarinus
Ostta 3 1816Ostreococcus tauri
Stramenopiles
152.m00122Entamoeba histolytica
156.m00102Entamoeba histolytica
Naegr1 46137Naegleria gruberi
130175Phytophthora sojae
Phyra1_1_72664Phytophthora ramorum
CMN286CCyanidioschyzon merolae
Gasu_50550Galdieria sulphuraria
DDB0231789Dictyostelium discoideum
Monbr1 32693Monosiga brevicollis
Animals {Golgi / Intracellular}
LmjF23.0830Leishmania major
Gasu_00640Galdieria sulphuraria
Gasu_55230Galdieria sulphuraria
CMS152CCyanidioschyzon merolae
CMS154CCyanidioschyzon merolae
Stramenopiles
Alveolata
Monbr1 29857Monosiga brevicollis
Monbr1 38746Monosiga brevicollis
Alveolata
Auran1 22521Aureococcus anophagefferens
Ctha 1817Chloroherpeton thalassium
GI 1485395Strongylocentrotus purpuratus
ENSP00000356687Homo sapiens Green Algae
Land Plants {SOS1}
0.9
8
0.56
100
100
100 100
100
100
100
100
100
100
100
100
100
100
100
100
100
77
61
96
79
89
9271
99
100
100
82
80
65
100
77
9053
0.67
0.8
1
0.93
0.87
0.8
6
0.9
40.69
0.98
0.8
4
0.940.52
0.93
0.74
0.94
0.87
0.5
Intr
ace
llu
lar
Pla
sma
Mem
bra
ne

23
Fig. S14.
Phylogenetic tree of the S-adenosylmethionine-dependent methyltransferase (SAM) superfamily, indicating horizontal gene transfer of a sarcosine dimethylglycine methyltransferase gene from halophilic cyanobacteria to G. sulphuraria. The unrooted Bayesian (52) tree calculated with a WAG+I+G model of protein evolution shows posterior probabilities above the branches and PhyML (75) percent bootstrap support (using WAG+I+G) below the branches. Thick branches indicate ≥0.99 posterior probability. Square brackets group proteins according to their origin from the two domains of life (Bacteria, Eukaryota). Curly brackets indicate different subfamilies of the SAM superfamily according to NCBI CDD (27, 78). Color coding: Cyanobacteria, other Bacteria, Streptophyta, Chlorophyta, Rhodophyta, Stramenopiles, Alveolata, Animals. Bar represents 0.2 changes per site.
RS9917 03558Synechococcus sp.
WH7805 07371Synechococcus sp.
P9303_17021Prochlorococcus marinus
MIT9313 PMT0551Prochlorococcus marinus
Gasu_07580Galdieria sulphuraria
Gasu_07590Galdieria sulphuraria
Gasu_06500Galdieria sulphuraria
Tgr7 1180Thioalkalivibrio sp.
Ctha 2187Chloroherpeton thalassium
NB-231 10508Nitrococcus mobilis
GI 9392587Halorhodospira halochloris
Hhal 1677Halorhodospira halophila
kuste4122Candidatus Kuenenia stuttgartiensis
GI 28316392Aphanothece halophytica
L8106 04936Lyngbya sp.
M23134 00297Microscilla marina
SvirDRAFT 04Saccharomonospora viridis
SACE 3901Saccharopolyspora erythraea
GI 9392589Actinopolyspora halophila
HochDRAFT 10430Haliangium ochraceum
FP2506 12834Fulvimarina pelagi
Bac
teri
aB
act
eri
a
Phatr2_12280Phaeodactylum tricornutum
Phyra1_1_76539Phytophthora ramorum
137871Phytophthora sojae
SB234M12.18Sorghum bicolor
GI:162461873Zea mays
GI:116785181Picea sitchensis
MAL13P1.214Plasmodium falciparum
CBP02171Caenorhabditis briggsae
ENSXETP00000044432Xenopus tropicalis
Phyra1_1_71173Phytophthora ramorum
109246Phytophthora sojae
Eu
kary
ota
Thaps3_269095Thalassiosira pseudonana
Auran1_59958Aureococcus anophagefferens
MICPUCDRAFT49588Micromonas pusilla
OSTLU16375Ostreococcus lucimarinus
Ostta4_34203 0800Ostreococcus tauri
0.60
100
100
100
98
80
87
56
7899
9198
820.58
0.92
0.6
8
0.83
98
98
0.9255
0.91
0.54
99
94
7051
100
0.83
0.56
0.92
0.88
0.2
Sa
rco
sin
e-D
imet
hyl
gly
cin
e M
eth
ylt
ran
sfe
rase
Ph
osp
ho
eth
ano
lam
ine
N-M
eth
yltr
an
sfe
ras
e
Cyclopropane FattyAcid Synthase
TocopherolO-Methyltransferase
TocopherolO-Methyltransferase

24
Fig. S15. 1H-NMR spectra showing choline-O-sulfate, proline betaine, and glycine betaine accumulations in G. sulphuraria. The spectra shown were obtained from crude extracts of heterotrophic cells grown under control conditions (black line) or treated with 500 mM NaCl for 84 h (red line). Extraction and measurement were performed as described earlier (79). Abbreviations used: GB, glycine betaine; PB, proline betaine; COS, choline-O-sulfate; t-but, ter-butanol. Values in ppm assigned to NMR signals are chemical shifts of either the 9 protons of the -N+(CH3)3 group of glycine betaine or choline-O-sulfate, the 3 protons of each of the methyl group of the -N+(CH3)2 or those of the methylene group of those substances when detectable. Ter-butanol was selected as an internal standard for quantification of betaines. The 9 protons of its -C(CH3)3 group give a sole signal at 1.200 ppm. The signals at 3.181, 3.217, and 3.251 ppm were taken as specific target for quantification of choline-O-sulfate, glycine betaine and proline betaine, respectively. The spectra are presented at the same scale (standardized with ter-butanol).

25
Fig. S16.
Phylogenetic tree of the anion permease ArsB/NhaD superfamily, indicating horizontal gene transfer of an ArsB gene from bacteria to G. sulphuraria. The unrooted Bayesian (52) tree calculated with a CpREV+I+G model of protein evolution shows posterior probabilities above the branches and PhyML (75) percent bootstrap support (using LG+I+G) below the branches. Thick branches indicate 1.0 posterior probability. Square brackets group proteins according to their origin from Eukaryota, Archaea, or different phyla of Bacteria. Curly brackets indicate different subfamilies of the anion permease ArsB/NhaD superfamily (27). The label ‘Thermophilic/Acidophilic’ marks G. sulphuraria and four bacteria being thermophilic and/or acidophilic, living in similar habitats as G. sulphuraria does. Color coding of major phylogenetic groups: Bacteria, Archaea, Streptophyta, Chlorophyta, Rhodophyta, Stramenopiles, Excavata, Fungi, Animals & Choanoflagellates. Bar represents 0.5 changes per site.
FBgn0051693Drosophila melanogaster FBgn0035332melanogasterDrosophila
FBgn0036329melanogasterDrosophila FBgn0041150 melanogasterDrosophila
ENSXETP00000009004Xenopus tropicalis ENSP00000346659Homo sapiens MGI 97454Mus musculus
29712Monosiga brevicollis Ostreococcus tauri 8380
44788Phaeodactylum tricornutum T 262258halassiosira pseudonana
182280Physcomitrella patens 190982Physcomitrella patens
139294Physcomitrella patens Os03g01700Oryza sativa
Os10g39980Oryza sativa Os02g57620Oryza sativa
Os03g05390Oryza sativa GSVIVP00037686001Vitis vinifera GSVIVP00000441001Vitis vinifera GSVIVP00032514001Vitis vinifera
69397Naegleria gruberi 93857 m00324Trypanosoma vaginalis
91127m00285Trypanosoma vaginalis 91660 m00056Trypanosoma vaginalis
174287Chlamydomonas reinhardtii AAW41753Cryptococcus neoformans
CHG09358Chaetomium globosum Afu2g15090Aspergillus fumigatus AN5302Aspergillus nidulans
Eu
kary
ota
TVN0285Thermoplasma volcanium GI 16082492Thermopasma acidophilum
050500004700Ferroplasma acidarmanus PTO0083Picrophilus torridus A
rch
ae
a
ArsBListeria welshimeri SSPP115Staphylococcus saprophyticus
ArsBBacillus halodurans ArsBEscherichia coli
PROPEN_04102Proteus penneri Psyr_1503Pseudomonas syringae
ArsB-1Pseudomonas putida ArsB (Deinococcus-Thermus)Deinococcus geothermalis
Gasu_56050Galdieria sulphuraria
Th
erm
op
hili
cA
cid
op
hili
c
Ars
B,
arsen
ical
pu
mp
mem
bra
ne
pro
tein
An
ion
per
mea
seA
rsB
/Nh
aD
Pe
rme
ase
P/
P p
rote
in
Sili
con
eff
lux t
ran
sp
ort
er(a
nio
n p
erm
ease
Yb
iR)
Gasu_31570Galdieria sulphuraria ArsB (Nitrospirae)Leptospirillum ferriphilum
sp. ArsB1Thiomonas
ArsBPsychrobacter arcticus
Lferr_2479Acidithiobacillus ferrooxidans ArsB2Roseomonas cervicalis ArsBMethylobacterium extorquens Mrad2831_1380Methylobacterium radiotolerans
Pro
teo
bac
teri
a
Proteobacteria
Firmicutes
0.51
0.6
9
0.59
61
60
58
0.560.92
68
0.9
0
71
98
92
0.84
84
9396
89
78100
100100
100
100
100
100
100100
100
100
100
100
100
100
0.9
8
80
0.65
0.9
7
96
0.8880
69
0.97
58
0.98
0.9
3
0.56
92
63100
0.5

26
Fig. S17.
Phylogenetic tree of mercuric reductase. The unrooted Bayesian (52) tree calculated with a WAG+G model of protein evolution shows posterior probabilities above the branches and PhyML (75) percent bootstrap support (using WAG+G+F) below the branches. Thick branches indicate 1.0 posterior probability. For bacterial sequences the class for each species is given in abbreviated form for Gammaproteobacteria and Betaproteobacteria. Color coding of major phylogenetic groups: Bacteria, Rhodophyta. Bar represents 0.1 changes per site.
merA, Methylococcus capsulatus Gammaprot’
merA, Pseudomonas aeruginosa Gammaprot’
mer, Stenotrophomonas maltophilia Gammaprot’
Daci0483, Delftia acidovorans Betaprot’
merA, Pseudomonas fluorescens Gammaprot’
merA2, Pseudomonas aeruginosa Gammaprot’
Nhal1676, Nitrosococcus halophilus Gammaprot’
sp. MerA, Thiobacillus Betaprot’
merA, Acidithiobacillus ferrooxidans Gammaprot’
merA, Salmonella enterica Gammaprot’
sp. B1M04319, Burkholderia Betaprot’
merA, Enterobacter cloacae Gammaprot’
Neut0030, Nitrosomonas eutropha Betaprot’
sp. MerA, Bacillus Bacilli
merA, Proteus mirabilis Gammaprot’
Galf1900, Gallionella capsiferriformans Betaprot’
Tint1608, Thiomonas intermedia Betaprot’
CMJ014CCyanidioschyzon merolae
Tbd1341, Thiobacillus denitrificans Betaprot’
Gasu_60470Galdieria sulphuraria
sp. BW13 merA, Pseudomonas Gammaprot’
Sfri3488, Shewanella frigidimarina Gammaprot’
sp. Sputw3181_3208, Shewanella Gammaprot’
Sputcn32_0168, Shewanella putrefaciens Gammaprot’
sp. Shewana3_4311, Shewanella Gammaprot’
merA, Escherichia coli Gammaprot’
100
100
98
83
90
99
0.86/550.67
0.95/80
0.87
0.98100
0.64
0.9851
59
65
99
95
94
92
8968
0.90
100
0.1

27
Fig. S18.
Percent of proteome annotated as membrane transporter for 49 different eukaryotes. The red line indicates the 5% level. Total numbers of transporter proteins were taken from TransportDB (36). The TransAAP tool from TransportDB annotated 368 membrane transport proteins for the G. sulphuraria genome. After manual curration this number was corrected to 247 membrane transport proteins; for consistency, only those were considered here.
0 1 2 3 4 5 6 7
Physcomitrella patensArabidopsis thaliana
Oryza sativaOstreococcus sp.
Ostreococcus tauriMicromonas pusilla CCMP1545
Micromonas pusilla RCC299Chlamydomonas reinhardtii
Cyanidioschyzon merolaeGaldieria sulphuraria
Phytophthora infestansPhytophthora ramorum
Phytophthora sojaeEctocarpus siliculosus
Aureococcus anophagefferensPhaeodactylum tricornutumThalassiosira pseudonana
Babesia bovisBabesia equi
Cryptosporidium parvumPlasmodium falciparum 3D7
Plasmodium vivaxTheileria parva
Toxoplasma gondii B7Paramecium tetraurelia
Tetrahymena thermophilaTrichomonas vaginalis
Leishmania majorTrypanosoma brucei
Trypanosoma cruziDictyostelium discoideum
Entamoeba disparEntamoeba histolyticaEntamoeba invadensAspergillus fumigatus
Aspergillus nidulansAspergillus oryzaeNeurospora crassa
Saccharomyces cerevisiaeSchizosaccharomyces pombe
Cryptococcus neoformansEncephalitozoon cuniculi
Brugia malayiCaenorhabditis elegans
Aedes aegyptiAnopheles gambiae
Drosophila melanogasterMus musculusHomo sapiens
% of proteins
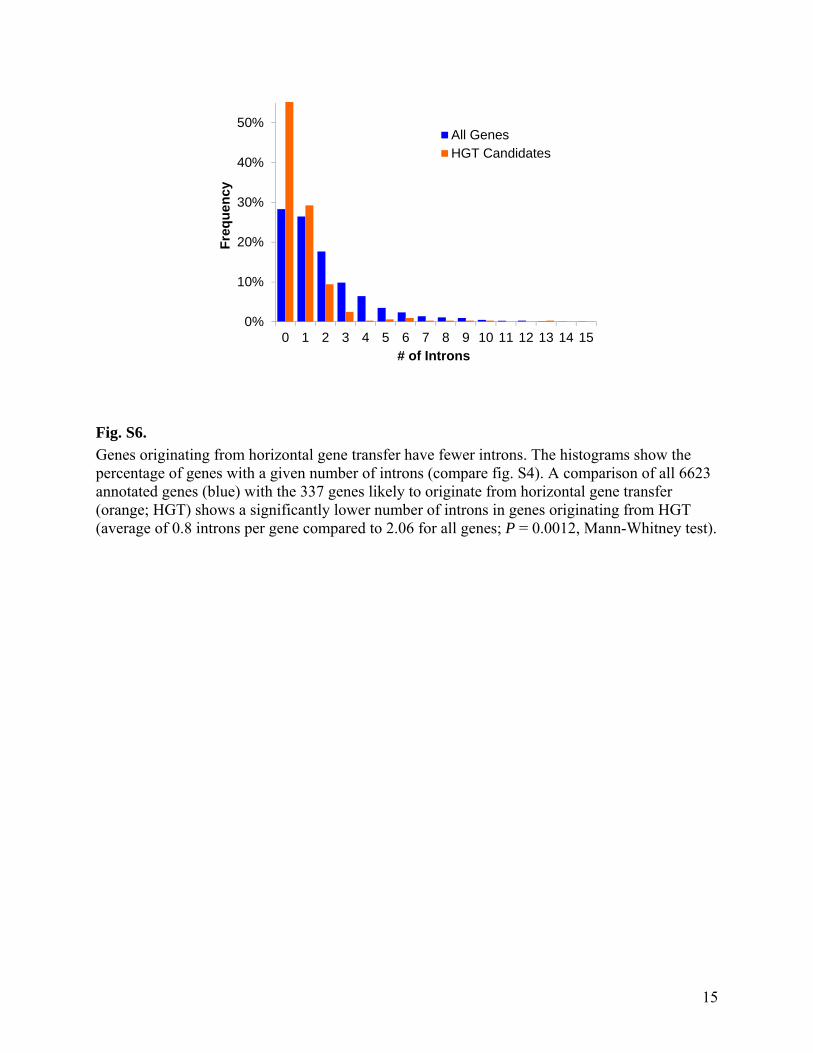
28
Animals
Monosiga brevicollis Monbr1_10586
Land Plants
Trichomonas vaginalis
DDB0238519Dictyostelium discoideum
Chlre3_196325Chlamydomonas reinhardtii
Ostta4_29494Ostreococcus tauri
SS1G_01070Sclerotinia sclerotiorum
Animals
Animals
. 136367Physcomitrella p
. 113769Physcomitrella p
Naegr1_65611Naegleria gruberi
Alveolata
Alveolata
Saccharomyces cerevisiae
Ustilago maydis UM05023
Phytophthora
Cyanidioschyzon merolae CMK066
Oryza sativa Os07g0559700
Bacteria
Bacteria
Bacteria
Haloarcula marismortui GI:55376617
sp. RHA1_ro01361Rhodococcus
TcaBSaccharopolyspora erythraea
GbCGDNIH1_1264Granulibacter bethesdensis
sp. GI:169189897Paenibacillus
Animals
Galdieria sulphuraria Gasu_04230
Ostreococcus lucimarinus OSTLU34203
Aureococcus anophagefferens Auran1_1914
Phatr2_11826Phaeodactylum tricornutum
Land Plants
Land Plants
Monbr1_8633Monosiga brevicollis
MONBRDRAFT_16319Monosiga brevicollis
Stramenopiles
Fungi
Land Plants
Excavata
Phytophthora
Aureococcus anophagefferens Auran1_71194
Phaeodactylum tricornutum Phatr2_27361
Animals
Land Plants
Fungi
Galdieria sulphuraria
Gasu_53180Galdieria sulphuraria
SPT1
VGT1
SPT2
Frt1
Galdieria sulphuraria
Gasu_59430Galdieria sulphuraria
Galdieria sulphuraria
Gasu_11560Galdieria sulphuraria
Gasu_37640Galdieria sulphuraria
Galdieria sulphuraria
Gasu_49750Galdieria sulphuraria
Gasu_57830.Galdieria sulphuraria
Ascomycota (Fungi)
100
100
100
81
100
52
0.98
0.68
0.83
0.54
0.5
8
0.84
0.5
40.
810
.95
0.62
0.94
0.9
10.94
0.8
7
0.76
0.57
0.94
0.83
57
73
0.99
100
100
100
100
9999
99
70
98
99
58
100
0.95
0.90
0.62
100
10068
86
100100
100
78
99
100
0.97
100
100
100
0.57
540.74
0.89
0.6
30.81
100
0.91
0.66
100
75
100
97
5480
100
0.75
100
82
0.70
0.72100
1000.62
99
100
0.2
TC 2.A.1.1.69
TC 2.A.1.1.45
TC 2.A.1.1.33
TC 2.A.1.1.70
29
Fig. S19.
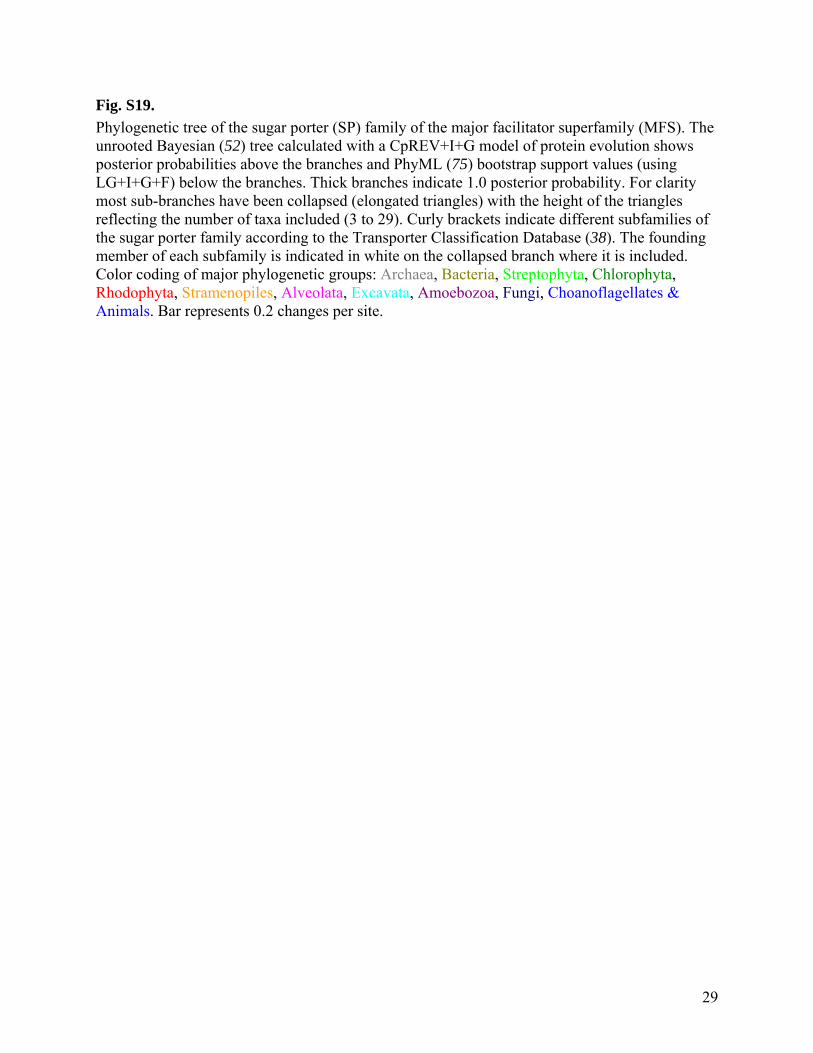
Phylogenetic tree of the sugar porter (SP) family of the major facilitator superfamily (MFS). The unrooted Bayesian (52) tree calculated with a CpREV+I+G model of protein evolution shows posterior probabilities above the branches and PhyML (75) bootstrap support values (using LG+I+G+F) below the branches. Thick branches indicate 1.0 posterior probability. For clarity most sub-branches have been collapsed (elongated triangles) with the height of the triangles reflecting the number of taxa included (3 to 29). Curly brackets indicate different subfamilies of the sugar porter family according to the Transporter Classification Database (38). The founding member of each subfamily is indicated in white on the collapsed branch where it is included. Color coding of major phylogenetic groups: Archaea, Bacteria, Streptophyta, Chlorophyta, Rhodophyta, Stramenopiles, Alveolata, Excavata, Amoebozoa, Fungi, Choanoflagellates & Animals. Bar represents 0.2 changes per site.

30
Fig. S20.
Phylogenetic tree of the amino acid / auxin permease (AAAP) family. The unrooted Bayesian (52) tree calculated with a CpREV+I+G model of protein evolution shows posterior probabilities above the branches and PhyML (75) percent bootstrap support (using LG+G+F) below the branches. Thick branches indicate 1.0 posterior probability. For clarity most sub-branches have been collapsed (elongated triangles) with the height of the triangles reflecting the number of taxa included (3 to 46). Curly bracket indicates a subfamily of fungal amino acid permeases (TC 2.A.18.4), which includes all G. sulphuraria sequences, according to best BLAST hits in the Transporter Classification Database (38). Color coding of major phylogenetic groups: Streptophyta, Chlorophyta, Rhodophyta, Stramenopiles, Excavata, Amoebozoa, Fungi, Choanoflagellates & Animals. Bar represents 0.2 changes per site.
Fungi (Ascomycota)
Gasu_01170Galdieria sulphuraria
Gasu_19710Galdieria sulphuraria
Fungi
Pyrenophora tritici-repentis GI:189189672
Fungi
Galdieria sulphuraria
Gasu_45890Galdieria sulphuraria
Gasu_62620Galdieria sulphuraria
Chlre3_206105Chlamydomonas reinhardtii
Monbr1_25158Monosiga brevicollis
MONBRDRAFT_38331Monosiga brevicollis
Auran1_62192Aureococcus anophagefferens
Ot03g02520Ostreococcus tauri
UM03049.1Ustilago maydis
Land Plants
Phytophthora
Animals
Land Plants
Phatr2_9355Phaeodactylum tricornutum
Thaps3_264537Thalassiosira pseudonana
88788.m00034Trichomonas vaginalis
93204.m00168Trichomonas vaginalis
Animals
Fungi
Entamoeba histolytica
Naegr1_71189Naegleria gruberi
Excavata
0.57500.92
100
100
100
100
100
100
100
100
100
100
100
100
98
52
73
95
94
56
58
68
99
98
90
94
63
0.53
0.95
0.53
0.99
0.93
0.51
0.94
0.53
0.51
0.66
0.59
0.57
0.83
0.5
TC
2.A
.18.
4 (
fun
gal
per
me
ases
)

31
Fig. S21.
Phylogenetic tree of acetate permeases of the YaaH family. The unrooted Bayesian (52) tree calculated with a Blosum62+G model of protein evolution shows posterior probabilities above the branches and PhyML (75) percent bootstrap support (using LG+G+F) below the branches. Thick branches indicate 1.0 posterior probability. Three subfamilies of acetate permeases according to the Transporter Classification Database (38) are indicated, with the founding member of each subfamily indicated in white on the collapsed branch where it is included. Color coding of major phylogenetic groups: Archaea, Bacteria, Streptophyta, Chlorophyta, Rhodophyta, Stramenopiles, Alveolata, Excavata, Fungi). Bar represents 0.2 changes per site.
Leishmania major LmjF03.0400
LmjF03.0380Leishmania major
Ichthyophthirius multifiliis IMG5_002930
Calditerrivibrio nitroreducens Calni_1246
Dbac_3478Desulfomicrobium baculatum
MCON_2287Methanosaeta concilii
CfE428DRAFT_126Chthoniobacter flavus
Gmet_1126Geobacter metallireducens
Mhun_0634Methanospirillum hungatei
Mboo_0065Methanoregula boonei
sp. CAT7_04262Carnobacterium
Cphy_0364Clostridium perfringens
MCP_2738Methanocella paludicola
archaeon RC-I RCIX138
TC 2.A.96.1.1
sp. PCNPT3_10676Psychromonas
Desal_0840Desulfovibrio salexigens
sp. GM18DRAFT 1497Geobacter
Gammaproteobacteria
TPY_0697Sulfobacillus acidophilus
sp. BH160DRAFT_3638Burkholderia
BuboB_01010000444Burkholderia ubonensis
GI:218289874Alicyclobacillus acidocaldarius
Euryarchaeota
Acel_1067Acidothermus cellulolyticus
Namu_0029Nakamurella multipartita
Gobs_1305Geodermatophilus obscurus
Firmicutes
Gasu_14180Galdieria sulphuraria
Gasu_35520Galdieria sulphuraria
Gasu_18410Galdieria sulphuraria
Gasu_00440Galdieria sulphuraria
Gasu_47190Galdieria sulphuraria
Gasu_62370Galdieria sulphuraria
Gasu_57190Galdieria sulphuraria
Gasu_57950Galdieria sulphuraria
Gasu_07700Galdieria sulphuraria
Gasu_07690Galdieria sulphuraria
Eukaryota
Fungi
Bacterial origin Actinobacteria
Green Algae
Thaps3_20982Thalassiosira pseudonana
Cyanidioschyzon merolae CMM079C
Leishmania major LmjF03.0370
Physcomitrella
Aspergillus oryzae Ao090701000842
GI:57227606Cryptococcus neoformans
Ustilago maydis UM00196.1
SPAC5D6.09cSchizosaccharomyces pombe
TC 2.A.96.1.3
TC 2.A.96.1.4
AcpA
YaaH
Ady2
0.83
0.87
0.690.56
0.95
0.83
0.56
0.79100
0.72
0.76
0.78
0.61
0.72
0.79
0.79
0.9493
74
59
100
10088
74
75
75
70
92
62
100
100
0.66
0.96
0.99
0.96
0.96
0.60
0.85
0.60
0.99
0.8
5
0.9292
97
78
78
75
8060
71
99
0.98
0.98
0.850.940.2

32
Fig. S22.
Phylogenetic tree of amino acid-polyamine-organocation (APC) superfamily (TC 2.A.3). The unrooted Bayesian (52) tree calculated with a Blosum62+G model of protein evolution shows posterior probabilities above the branches and PhyML (75) percent bootstrap support (using LG+G+F) below the branches. Thick branches indicate 1.0 posterior probability. Curly brackets indicate different families of the amino acid-polyamine-organocation superfamily, according to best BLAST hits in the Transporter Classification Database (38). Color coding of major phylogenetic groups: Archaea, Bacteria, Streptophyta, Chlorophyta, Rhodophyta, Stramenopiles, Alveolata, Excavata, Amoebozoa, Fungi, Animals. Bar represents 0.2 changes per site.
Land Plants
Stramenopiles
Phytophthora ramorum Phyra1_1_95019
DDB0189332Dictyostelium discoideum
138431Phytophthora sojae
Cyanidioschyzon merolae CMR055C
Gasu_23570Galdieria sulphuraria
Gasu_35110Galdieria sulphuraria
151.m00099Entamoeba histolytica
EHI 020320Entamoeba histolytica
Excavata The
Po
lya
min
e:H
Sym
port
er
(PH
S)
fam
il y (
TC
)
+
2.A
.3.1
2
Animals
Fungi
Fungi
Fungi
CHG02138.1Chaetomium globosum
Trichomonas vaginalis
AAW41080.1Cryptococcus neoformans
SSO1009Sulfolobus solfataricus
Gasu_21130Galdieria sulphuraria
Gasu_65340Galdieria sulphuraria
Gasu_34450Galdieria sulphuraria
Gasu_54580Galdieria sulphuraria
Ta0877Thermoplasma acidophilum
TVN0718Thermoplasma volcanium
Archaea
CME062CCyanidioschyzon merolae
Gasu_28250Galdieria sulphuraria
Phatr2_15324Phaeodactylum tricornutum
Thaps3_13922Thalassiosira pseudonana
Tb927.6.4660 [2.A.3.3.1]Trypanosoma brucei
Tc00.104705350683Trypanosoma cruzi
Land Plants
Bacteria
Green Algae
3386891 ctrADictyostelium discoideum
3386917 ctrCDictyostelium discoideum
Phytophthora ramorum Phyra1_1_72585
Phytophthora sojae 130075
3392553 ctrBDictyostelium discoideum
Animals
Land Plants
Ca
tion
ic A
min
o a
cid
Tra
nsp
orte
r (C
AT
)fa
mily
(T
C
)2.
A.3
.3
0.99
0.6762
9592
79
9899
99
99
53
53
92
9356
59
99
75
79
76
98
98
93
8992
97
100
100
100
100
100
100
100
100
100
100
100
100
0.50
0.92
0.59
0.87
0.610.88
0.96
0.97
0.95
0.84
0.84
0.88
0.81
0.5
70.
50
0.5
8
0.7
9
0.2

33
Fig. S23.
Phylogenetic tree of transporters from the major intrinsic protein (MIP; TC 1.A.8) family. The unrooted Bayesian (52) tree calculated with a Blosum62+I+G model of protein evolution shows posterior probabilities above the branches and PhyML (75) percent bootstrap support (using LG+I+G+F) below the branches. Thick branches indicate ≥0.99 posterior probability. The glycerol uptake facilitator (TC 1.A.8.1.1) subfamily of the MIP family according to best BLAST hits at the Transporter Classification Database (38) is indicated by a curly bracket. All other sequences shown belong to different MIP subfamilies. Color coding of major phylogenetic groups: Bacteria, Streptophyta, Chlorophyta, Rhodophyta, Stramenopiles, Alveolata, Excavata, Fungi, Animals & Choanoflagellates. Bar represents 0.2 changes per site.
Land Plants
Drosophila melanogaster FBgn0015872
ENSAPMP00000029623Apis mellifera
Naegr1_75649Naegleria gruberi
Chlre3_190851Chlamydomonas reinhardtii
Monbr1_29850Monosiga brevicollis
DDB0214915Dictyostelium discoideum
Auran1_29268Aureococcus anophagefferens
NCU08052Neurospora crassa
Cryptococcus neoformans gi:57225766
Phatr2_44871Phaeodactylum tricornutum
Bacteria
Gasu_62400Galdieria sulphuraria
Gasu_00080Galdieria sulphuraria
Gasu_64190Galdieria sulphuraria
Gasu_32620Galdieria sulphuraria
Gasu_28080Galdieria sulphuraria
Proteobacteria
Bacteria
Bacteria
gi:348669471Phytophthora sojae
gi:348669470Phytophthora sojae
gi:325188770Albugo laibachii
Phyra1_1_72236Phytophthora ramorum
Phyra1_1_72237Phytophthora ramorum
PF11_0338Plasmodium falciparum
1963.m00065Plasmodium yoelii
Animals
Tb10.61.2650Trypanosoma brucei
Tb10.61.2640Trypanosoma brucei
Tb927.6.1520Trypanosoma brucei
LmjF31.0020Leishmania major
Fungi
0.96
0.66
0.68
0.7
9
0.94
0.98
0.93
64
97
72
67
82
86
80
99
75
6390
97
55
92
100
100
100
100
100
100
100
100
100
0.65
0.58
0.2
Gly
cer
ol u
pta
ke f
acil
itat
or
(TC
1.A
.8.1
.1)

34
Fig. S24.
Phylogenetic tree of glycerol dehydrogenases (EC 1.1.1.6). The unrooted Bayesian (52) tree calculated with a WAG+I+G model of protein evolution shows posterior probabilities above the branches and PhyML (75) percent bootstrap support (using LG+I+G) below the branches. Thick branches indicate 1.0 posterior probability. The collapsed branch labeled ‘Bacteria (mostly Firmicutes)’ contains sequences from two Actinobacteria, two Synergistetes, and 15 Firmicutes. Color coding of major phylogenetic groups: Cyanobacteria, other Bacteria, Rhodophyta, Excavata, Amoebozoa, Fungi. Bar represents 0.2 changes per site.
Bacteria (mostly Firmicutes)
gi:257125507 (Fusobacteria)Leptotrichia buccalis
Dictyostelium discoideum DDB0217165
gi:330844838Dictyostelium purpureum
sp. gi:312111935 (Firmicutes)Geobacillus
gi:237808641 (Proteobacteria)Tolumonas auensis
gi:310778873 (Fusobacteria)Ilyobacter polytropus
gi:51892405 (Firmicutes)Symbiobacterium thermophilum
gi:51892405 (Firmicutes)Symbiobacterium thermophilum
sp. gi:254229761 (Proteobacteria)VibrioBacteria (Proteobacteria)
gi:289523705 (Synergistetes)Anaerobaculum hydrogeniformans
gi:357419061 (Synergistetes)Thermovirga lienii
gi:296132160 (Firmicutes)Thermincola potens
sp. gi:242133534Crithidia
gi:302391592 (Firmicutes)Acetohalobium arabaticum
gi:188587303 (Firmicutes)Natranaerobius thermophilus
Gasu_57960Galdieria sulphuraria
Gasu_03180Galdieria sulphuraria
Gasu_57980Galdieria sulphuraria
gi:81300462 Synechococcus elongatus
gi:88703938 (Proteobacteria)Congregibacter litoralis
gamma proteobacterium NOR5-3 gi:254515406
Schizophyllum commune gi:302691994
gi:302696107Schizophyllum communeFungi (Basidiomycota)
mGDHSchizosaccharomyces pombe
gi:21340879Schizosaccharomyces japonicusFungi (Ascomycota)
gi:228912388 (Firmicutes)Bacillus thuringiensisBacteria (Firmicutes)
0.98
0.6
3
0.6
4
0.96
0.83
0.98
0.9
4
0.78 75
54
6265
52
7699
88
92
62
100
100
100
100
100
100
0.9
0
0.9
0
0.9
0
0.2
35
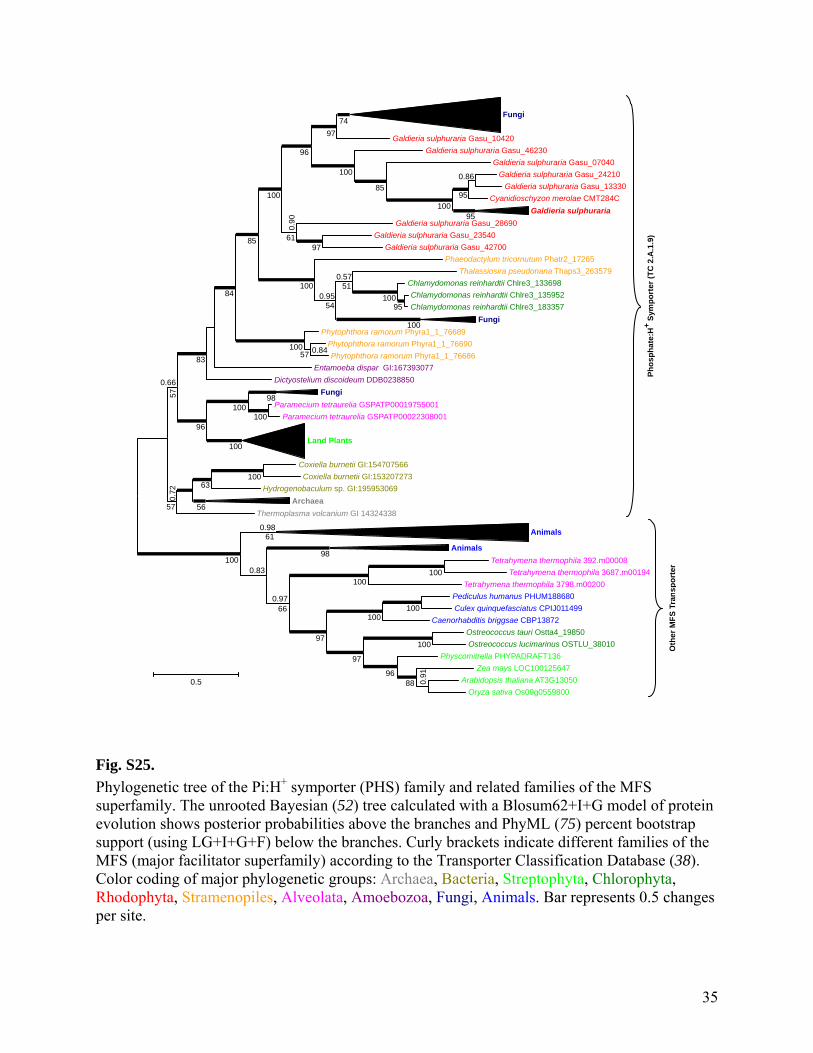
Fig. S25.
Phylogenetic tree of the Pi:H+ symporter (PHS) family and related families of the MFS superfamily. The unrooted Bayesian (52) tree calculated with a Blosum62+I+G model of protein evolution shows posterior probabilities above the branches and PhyML (75) percent bootstrap support (using LG+I+G+F) below the branches. Curly brackets indicate different families of the MFS (major facilitator superfamily) according to the Transporter Classification Database (38). Color coding of major phylogenetic groups: Archaea, Bacteria, Streptophyta, Chlorophyta, Rhodophyta, Stramenopiles, Alveolata, Amoebozoa, Fungi, Animals. Bar represents 0.5 changes per site.
GI:154707566Coxiella burnetii
GI:153207273Coxiella burnetii
sp. GI:195953069Hydrogenobaculum
Archaea
GI 14324338Thermoplasma volcanium
0.7
2
57 56
63100
Animals
Ph
osp
ha
te:H
+ S
ymp
ort
er (
TC
2.A
.1.9
)
Oth
er
MF
S T
ran
sp
ort
er
Animals
392.m00008Tetrahymena thermophila
3687.m00194Tetrahymena thermophila
3798.m00200Tetrahymena thermophila
PHUM188680Pediculus humanus
CPIJ011499Culex quinquefasciatus
CBP13872Caenorhabditis briggsae
Ostta4_19850Ostreococcus tauri
OSTLU_38010Ostreococcus lucimarinus
PHYPADRAFT136Physcomitrella
LOC100125647Zea mays
AT3G13050Arabidopsis thaliana
Os09g0559800Oryza sativa
0.98
0.9
1
0.97
0.83
61
66
98
97
97
9688
100
100
100100
100
100
Fungi
Gasu_10420Galdieria sulphuraria
Gasu_46230Galdieria sulphuraria
Gasu_07040Galdieria sulphuraria
Gasu_24210Galdieria sulphuraria
Gasu_13330Galdieria sulphuraria
CMT284CCyanidioschyzon merolae
Galdieria sulphuraria
Gasu_28690Galdieria sulphuraria
Gasu_23540Galdieria sulphuraria
Gasu_42700Galdieria sulphuraria
Phatr2_17265Phaeodactylum tricornutum
Thaps3_263579Thalassiosira pseudonana
Chlre3_133698Chlamydomonas reinhardtii
Chlre3_135952Chlamydomonas reinhardtii
Chlre3_183357Chlamydomonas reinhardtii
Fungi
Phyra1_1_76689Phytophthora ramorum
76690Phytophthora ramorum Phyra1_1_
76686Phytophthora ramorum Phyra1_1_
GI:167393077Entamoeba dispar
DDB0238850Dictyostelium discoideum
Fungi
GSPATP00019755001Paramecium tetraurelia
GSPATP00022308001Paramecium tetraurelia
Land Plants
0.66
0.84
0.57
74
97
96
6185
84
83
97
95
51
54
57
57
98
96
95
9585
100
100
100
100
100
100
100
100
100
100
0.950
.90
0.86
0.5

36
Fig. S26.
Phylogenetic tree of -galactosidases (EC 3.2.1.23; glycosyl hydrolases family 15), indicating two different subfamilies in G. sulphuraria. The unrooted Bayesian (52) tree calculated with a WAG+I+G model of protein evolution shows posterior probabilities above the branches and PhyML (75) percent bootstrap support (using LG+I+G) below the branches. Thick branches indicate 1.0 posterior probability. Numbers in brackets give number of introns for different G. sulphuraria genes; ‘SP’ indicates a secretory signal peptide according to SignalP 4.0 (39). Color coding of major phylogenetic groups: Bacteria, Streptophyta, Rhodophyta, Stramenopiles, Alveolata, Amoebozoa, Fungi, Animals & Choanoflagellates. Bar represents 0.2 changes per site.
Land Plants
DDBDRAFT_0186630Dictyostelium discoideum
PPL 03214Polysphondylium pallidum
GI:188501572Adineta vaga
Stramenopiles
CMP078CCyanidioschyzon merolae
Gasu_40850.1 (10)Galdieria sulphuraria
Gasu_03030.1 (6)Galdieria sulphuraria
Gasu_61020.1 (5)Galdieria sulphuraria
Gasu_31140.1 (1)Galdieria sulphuraria
Bacteria
Gasu_09330.1 (0)Galdieria sulphuraria
Gasu_27490.1 (1) ( )Galdieria sulphuraria SP
Gasu_27500.1 (0) ( )Galdieria sulphuraria SP
Fungi
32.m00226Tetrahymena thermophila
32.m00217Tetrahymena thermophila
Monbr1 26329Monosiga brevicollis
Bacteria
Animals
sp. GI:192814064Geobacillus
s sp. GI:197330841Streptomyce
GI:197932226Streptomyces scabies
Land Plants
Auran1_31836Aureococcus anophagefferens
CBP02650Caenorhabditis briggsae
CBP16998Caenorhabditis briggsae
Animals
0.9774
73
9784
100
100
99
100
100
100
100
100
100
100
100
100
100
100
0.960.83
0.76
96
0.6
0
0.75
0.66
0.5
8 0.99550.99
0.6
8
0.68 89
0.6
8
560.99
0.2

37
Fig. S27.
Phylogenetic tree of acid phosphatases (EC 3.1.3.2). The unrooted Bayesian (52) tree calculated with a WAG+I+G model of protein evolution shows posterior probabilities above the branches and PhyML (75) percent bootstrap support (using LG+I+G) below the branches. Thick branches indicate 1.0 posterior probability. ‘SP’ indicates a secretory signal peptide according to SignalP 4.0 (64). Curly bracket marks a group of organisms that all are acidophilic. Color coding of major phylogenetic groups: Cyanobacteria, other Bacteria, Streptophyta, Rhodophyta, Excavata, Fungi. Bar represents 0.2 changes per site.
Fungi
gi:328772443Batrachochytrium dendrobatidis
Naegr1_80092Naegleria gruberi
Phypa1_1_51671Physcomitrella
sp. gi:209517346 (Betaproteobacteria)Burkholderia
sp. gi:325521954 (Betaproteobacteria)Burkholderia
gi:225874284 (Acidobacteria)Acidobacterium capsulatum
gi:167567471 (Betaproteobacteria)Burkholderia oklahomensis
sp. gi:309779586 (Betaproteobacteria)Ralstonia
sp. gi:119717424 (Actinobacteria)Nocardioides
gi:359774813 (Actinobacteria)Arthrobacter globiformis
(Acidobacteria)Candidatus Koribacter versatilis
gi:117927441 (Actinobacteria)Acidothermus cellulolyticus
gi:388442093 (Gammaproteobacteria)Rhodanobacter thiooxydans
gi:182678150 (Alphaproteobacteria)Beijerinckia indica
gi:186682052 (Cyanobacteria)Nostoc punctiforme
gi:269839860Thermobaculum terrenum
(Nitrospirae)Leptospirillum
gi:296164862 (Actinobacteria)Mycobacterium parascrofulaceum
gi:342861237 (Actinobacteria)Mycobacterium colombiense
gi:339629066 (Firmicutes)Sulfobacillus acidophilus
gi:339626434 (Firmicutes)Sulfobacillus acidophilus
sp. gi:294341316 (Betaproteobacteria)Thiomonas
Gasu_56160 ( )Galdieria sulphuraria SP
Gasu_24940Galdieria sulphuraria ( )SP
Gasu_54390Galdieria sulphuraria
Gasu_20960Galdieria sulphuraria
Gasu_06690Galdieria sulphuraria
0.97 97
97
86
62
63
55
64
99
94
97
80
68
100
100
100
100
100
100
100
100
100
0.95
0.76
0.7
5
0.6
40.
55
0.7
40
.85
0.5
9
0.2
acid
op
hili
c
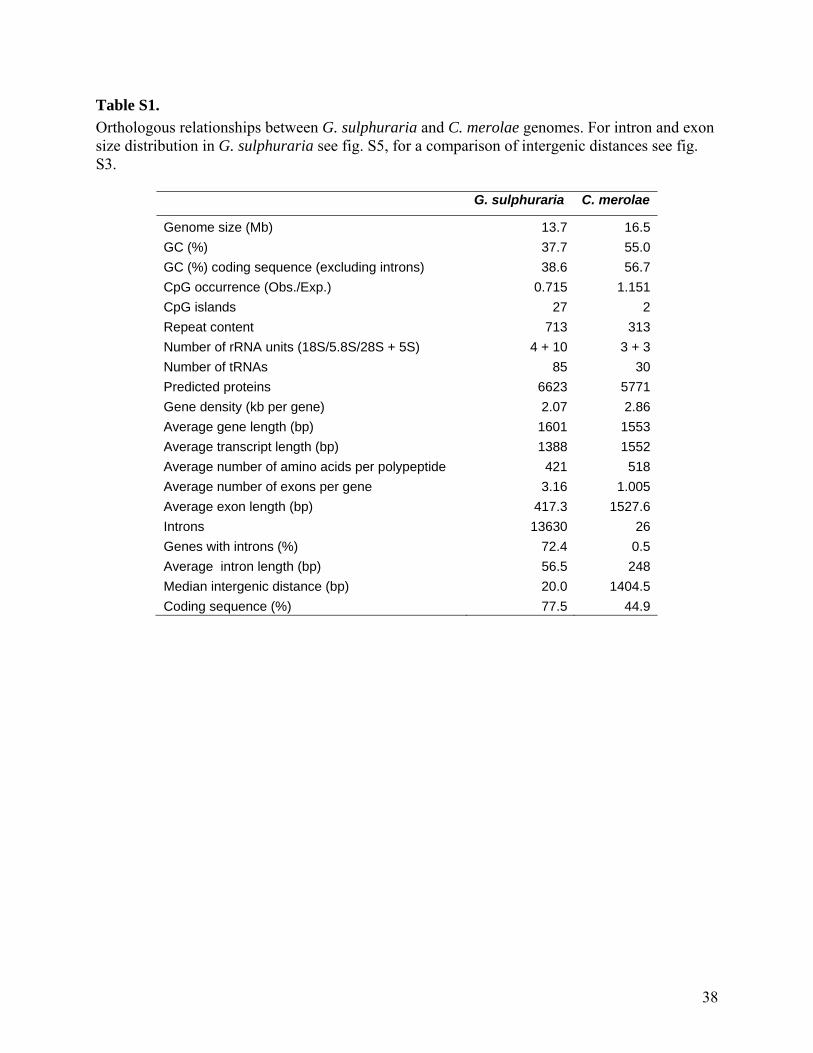
38
Table S1.
Orthologous relationships between G. sulphuraria and C. merolae genomes. For intron and exon size distribution in G. sulphuraria see fig. S5, for a comparison of intergenic distances see fig. S3.
G. sulphuraria C. merolae
Genome size (Mb) 13.7 16.5
GC (%) 37.7 55.0
GC (%) coding sequence (excluding introns) 38.6 56.7
CpG occurrence (Obs./Exp.) 0.715 1.151
CpG islands 27 2
Repeat content 713 313
Number of rRNA units (18S/5.8S/28S + 5S) 4 + 10 3 + 3
Number of tRNAs 85 30
Predicted proteins 6623 5771
Gene density (kb per gene) 2.07 2.86
Average gene length (bp) 1601 1553
Average transcript length (bp) 1388 1552
Average number of amino acids per polypeptide 421 518
Average number of exons per gene 3.16 1.005
Average exon length (bp) 417.3 1527.6
Introns 13630 26
Genes with introns (%) 72.4 0.5
Average intron length (bp) 56.5 248
Median intergenic distance (bp) 20.0 1404.5
Coding sequence (%) 77.5 44.9

39
Table S2.
Large protein families in G. sulphuraria. Families of paralogous proteins were determined by BLASTing the G. sulphuraria genome against itself, followed by MCL clustering (see Materials and Methods). Protein families were ranked by size. When annotations differed for members of one family, the annotation for the majority is given. Representative protein domains are indicated by PF numbers (76) or IPR numbers (33); brackets indicate low significance or hits in only some family members.
Rank Size Annotation Protein domains
1 131 Archaeal ATPase PF01637
2 76 Archaeal ATPase PF01637 & PF00536
3 48 Sugar Porter (SP) family of MFS superfamily PF00083
4 29 serine/threonine protein kinase IPR002290
5 26 AAA ATPase PF00004
6 25 DEAD-box RNA helicase PF00270 & PF00271
7 22 Pi:H+ symporter (PHS) family of MFS superfamily PF07690
8 15 Mitochondrial Carrier (MC) family PF00153
9 13 Amino Acid / Auxin Permease (AAAP) family PF01490
10 13 aldehyde dehydrogenase (NAD+) PF00171
11 12 cyclin-dependent serine/threonine protein kinase IPR002290
12 12 ubiquitin-conjugating enzyme E2 PF00179
13 12 kinesin family member PF00225
14 11 ABC transporter, multidrug resistance PF01061
15 11 ADP-ribosylation factor PF00025
16 11 putative acetate transporter PF01184
17 11 hypothetical protein (PF01113)
18 11 hypothetical protein (IPR008238)
19 10 Archaeal ATPase PF01637
20 10 hypothetical protein (IPR015598)

40
Table S3.
Comparison of membrane transport proteins in G. sulphuraria and C. merolae. Annotated membrane transport proteins classified as ‘ATP-Dependent’, ‘Ion Channel’, or ‘Secondary Transporter’ are listed, and the number of transporters per family is given. The classification of transporters into families follows the Transporter Classification Database (38, 77). Species and numbers of transporters per family are as in fig. S18. Transporter numbers were normalized to total number of proteins for each genome before calculating z-scores (z-scores >2.0 in bold).
z-score ATP-Dependent 60 102 0.58 2.12
The ATP-binding Cassette (ABC) Superfamily 28 49 0.24 1.42 The Arsenite-Antimonite (ArsA) Efflux Family ATP-hydrolizing Subunit 3 3 3.44 2.85
The H+- or Na+-translocating F-type, V-type and A-type ATPase (F-ATPase) 3 3 1.72 1.33 The H+-translocating Pyrophosphatase (H+-PPase) Family 1 3 0.27 1.97
The Type II (General) Secretory Pathway (IISP) Family 4 11 -0.02 1.82 The Mitochondrial Protein Translocase (MPT) Family 11 18 1.01 1.89
The P-type ATPase (P-ATPase) Superfamily 10 15 -0.24 0.52 Ion Channel 13 19 -0.61 -0.46
The Ammonia Transporter Channel (Amt) Family 2 2 0.38 0.19 The Anion Channel-forming Bestrophin (Bestrophin) Family 4 0 3.17 -0.36
The Intracellular Chloride Channel (CLIC) Family 0 4 -0.42 5.11 The Major Intrinsic Protein (MIP) Family 1 5 -0.46 0.84
The CorA Metal Ion Transporter (MIT) Family 0 3 -1.12 0.82 The Small Conductance Mechanosensitive Ion Channel (MscS) Family 2 2 0.21 0.10
The Chloroplast Envelope Anion Channel-forming Tic110 (Tic110) Family 1 1 3.03 2.57 The Voltage-gated Ion Channel (VIC) Superfamily 3 1 -0.49 -0.64
Secondary Transporter 108 225 -0.24 1.08 The ATP:ADP Antiporter (AAA) Family 1 1 0.32 0.24
The Amino Acid / Auxin Permease (AAAP) Family 1 17 -0.76 0.89 The Anion Exchanger (AE) Family 3 2 1.98 0.81
The Auxin Efflux Carrier (AEC) Family 0 1 -0.75 0.02 The Amino Acid-Polyamine-Organocation (APC) Family 2 8 -0.39 0.24
The Arsenite-Antimonite (ArsB) Efflux Family Transmembrane Subunit 0 2 -0.56 3.55 The Bile Acid:Na+ Symporter (BASS) Family 3 3 1.56 1.27
The Ca2+:Cation Antiporter (CaCA) Family 1 1 -0.70 -0.77 The Cation Diffusion Facilitator (CDF) Family 3 1 0.50 -1.23
The Chloride Carrier/Channel (ClC) Family 2 5 0.34 2.39 The Monovalent Cation:Proton Antiporter-1 (CPA1) Family 4 5 1.40 1.68 The Monovalent Cation:Proton Antiporter-2 (CPA2) Family 2 2 0.62 0.44
The Divalent Anion:Na+ Symporter (DASS) Family 2 1 0.75 -0.21 The Drug/Metabolite Transporter (DMT) Superfamily 18 20 0.79 0.72
The Folate-Biopterin Transporter (FBT) Family 1 0 -0.30 -0.72 The Glycoside-Pentoside-Hexuronide (GPH):Cation Symporter Family 1 5 -0.03 2.71
The Hydroxy/Aromatic Amino Acid Permease (HAAAP) Family 0 1 -0.51 0.97 The K+ Uptake Permease (KUP) Family 1 2 0.62 1.34
The Lysosomal Cystine Transporter (LCT) Family 2 2 1.86 1.48 The Mitochondrial Carrier (MC) Family 31 34 1.68 1.52
The Major Facilitator Superfamily (MFS) 13 83 -0.62 0.76 The Multidrug/Oligosaccharidyl-lipid/Polysaccharide (MOP) Flippase Superfamily 2 3 -0.25 -0.06
The Nucleobase:Cation Symporter-1 (NCS1) Family 0 2 -0.46 0.46 The Nucleobase:Cation Symporter-2 (NCS2) Family 0 2 -0.67 1.47
The NhaD Na+:H+ Antiporter (NhaD) Family 1 1 3.72 3.18 The Metal Ion (Mn2+-iron) Transporter (Nramp) Family 3 4 2.70 3.28
The Cytochrome Oxidase Biogenesis (Oxa1) Family 2 5 1.12 3.63 The Inorganic Phosphate Transporter (PiT) Family 2 1 1.18 -0.01
The Proton-dependent Oligopeptide Transporter (POT) Family 0 1 -0.52 -0.22 The Resistance-Nodulation-Cell Division (RND) Superfamily 0 1 -0.93 -0.54
The Solute:Sodium Symporter (SSS) Family 1 1 -0.08 -0.17 The Sulfate Permease (SulP) Family 2 2 -0.11 -0.26
The Twin Arginine Targeting (Tat) Family 0 2 -0.40 2.93 The Telurite-resistance/Dicarboxylate Transporter (TDT) Family 1 1 0.67 0.52
The K+ Transporter (Trk) Family 1 0 0.80 -0.63 The Zinc (Zn2+)-Iron (Fe2+) Permease (ZIP) Family 2 3 -0.66 -0.28

41
Additional data table S4.
Genes in G. sulphuraria probably originating from horizontal gene transfer (HGT) and possible ‘donors’ from which they descended. From left to right: gene identifiers; protein family (ranked by size); number of genes/paralogs resulting from the gene transfer (a number in brackets indicates that not all genes in this family result from HGT and gives the total number of family members); annotation of the encoded protein; for those cases where a detailed phylogenetic analysis was performed, the figure displaying the phylogenetic tree; organism that is the closest sequenced relative (or descendant) of the ‘donor’ organism from which the gene might have originated, according to best BLAST hits or phylogenetic tree; typical habitat of this ‘donor’ organism, with ‘M’ standing for mesophilic (optimum growth temperature between 15°C and 45°C), ‘T’ for thermophilic (OGT 45-80°C), ‘HT’ for hyperthermophilic (OGT > 80°C), and ‘TA’ for thermoacidophilic; systematic position of this ‘donor’ organism with domain, phylum, and order.
42
References and Notes 1. W. N. Doemel, T. D. Brock, The physiological ecology of Cyanidium caldarium. J. Gen.
Microbiol. 67, 17 (1971). doi:10.1099/00221287-67-1-17
2. L. J. Rothschild, R. L. Mancinelli, Life in extreme environments. Nature 409, 1092 (2001). doi:10.1038/35059215 Medline
3. W. Gross, C. Schnarrenberger, Heterotrophic growth of two strains of the acido-thermophilic red alga Galdieria sulphuraria. Plant Cell Physiol. 36, 633 (1995).
4. V. Reeb, D. Bhattacharya, in The thermo-acidophilic Cyanidiophyceae (Cyanidiales) in Red Algae in the Genomic Age, J. Seckbach, D. J. Chapman, Eds. (Springer, Netherlands, 2010), pp. 409–426.
5. G. Pinto, C. Ciniglia, C. Cascone, A. Pollio, Species composition of Cyanidiales assemblages in Pisciarelli (Campi Flegrei, Italy) and description of Galdieria phlegrea SP. NOV in Algae and Cyanobacteria in Extreme Environments, J. Seckbach, Ed. (Springer Netherlands, 2007), vol. 11, pp. 487-502.
6. Materials and methods are available as supplementary materials on Science Online.
7. M. Matsuzaki et al., Genome sequence of the ultrasmall unicellular red alga Cyanidioschyzon merolae 10D. Nature 428, 653 (2004). doi:10.1038/nature02398 Medline
8. H. Innan, F. Kondrashov, The evolution of gene duplications: Classifying and distinguishing between models. Nat. Rev. Genet. 11, 97 (2010). doi:10.1038/nrg2689 Medline
9. T. J. Treangen, E. P. C. Rocha, Horizontal transfer, not duplication, drives the expansion of protein families in prokaryotes. PLoS Genet. 7, e1001284 (2011). doi:10.1371/journal.pgen.1001284 Medline
10. C. Bowler et al., The Phaeodactylum genome reveals the evolutionary history of diatom genomes. Nature 456, 239 (2008). doi:10.1038/nature07410 Medline
11. P. J. Keeling, Functional and ecological impacts of horizontal gene transfer in eukaryotes. Curr. Opin. Genet. Dev. 19, 613 (2009). doi:10.1016/j.gde.2009.10.001 Medline
12. R. Overbeek et al., The subsystems approach to genome annotation and its use in the project to annotate 1000 genomes. Nucleic Acids Res. 33, 5691 (2005). doi:10.1093/nar/gki866 Medline
13. E. V. Koonin, Evidence for a family of archaeal ATPases. Science 275, 1489 (1997). doi:10.1126/science.275.5305.1489 Medline
14. J. G. McCoy et al., Discovery of sarcosine dimethylglycine methyltransferase from Galdieria sulphuraria. Proteins Struct. Funct. Bioinformatics 74, 368 (2009). doi:10.1002/prot.22147 Medline
15. I. Enami, H. Akutsu, Y. Kyogoku, Intracellular pH regulation in an acidophilic unicellular alga, Cyanidium caldarium: 31P-NMR determination of intracellular pH. Plant Cell Physiol. 27, 1351 (1986).
16. W. Gross, Ecophysiology of algae living in highly acidic environments. Hydrobiologia 433, 31 (2000). doi:10.1023/A:1004054317446
43
17. J. Ye, C. Rensing, B. P. Rosen, Y.-G. Zhu, Arsenic biomethylation by photosynthetic organisms. Trends Plant Sci. 17, 155 (2012). doi:10.1016/j.tplants.2011.12.003 Medline
18. C. Oesterhelt, S. Vogelbein, R. P. Shrestha, M. Stanke, A. P. M. Weber, The genome of the thermoacidophilic red microalga Galdieria sulphuraria encodes a small family of secreted class III peroxidases that might be involved in cell wall modification. Planta 227, 353 (2008). doi:10.1007/s00425-007-0622-z Medline
19. C. Pál, B. Papp, M. J. Lercher, Adaptive evolution of bacterial metabolic networks by horizontal gene transfer. Nat. Genet. 37, 1372 (2005). doi:10.1038/ng1686 Medline
20. D. D. Leipe, E. V. Koonin, L. Aravind, STAND, a class of P-loop NTPases including animal and plant regulators of programmed cell death: Multiple, complex domain architectures, unusual phyletic patterns, and evolution by horizontal gene transfer. J. Mol. Biol. 343, 1 (2004). doi:10.1016/j.jmb.2004.08.023 Medline
21. W. L. Chiu et al., Oenothera chloroplast DNA polymorphisms associated with plastome mutator activity. Mol. Gen. Genet. 221, 59 (1990). doi:10.1007/BF00280368
22. S. Batzoglou et al., ARACHNE: A whole-genome shotgun assembler. Genome Res. 12, 177 (2002). doi:10.1101/gr.208902 Medline
23. A. P. M. Weber, K. L. Weber, K. Carr, C. Wilkerson, J. B. Ohlrogge, Sampling the Arabidopsis transcriptome with massively parallel pyrosequencing. Plant Physiol. 144, 32 (2007). doi:10.1104/pp.107.096677 Medline
24. M. Stanke, O. Schöffmann, B. Morgenstern, S. Waack, Gene prediction in eukaryotes with a generalized hidden Markov model that uses hints from external sources. BMC Bioinformatics 7, 62 (2006). doi:10.1186/1471-2105-7-62 Medline
25. A. P. M. Weber et al., EST-analysis of the thermo-acidophilic red microalga Galdieria sulphuraria reveals potential for lipid A biosynthesis and unveils the pathway of carbon export from rhodoplasts. Plant Mol. Biol. 55, 17 (2004). doi:10.1007/s11103-004-0376-y Medline
26. K. D. Pruitt, T. Tatusova, D. R. Maglott, NCBI reference sequences (RefSeq): A curated non-redundant sequence database of genomes, transcripts and proteins. Nucleic Acids Res. 35, (Database issue), D61 (2007). doi:10.1093/nar/gkl842 Medline
27. A. Marchler-Bauer et al., CDD: A Conserved Domain Database for the functional annotation of proteins. Nucleic Acids Res. 39 (Database issue), D225 (2011). doi:10.1093/nar/gkq1189 Medline
28. The Arabidopsis Genome Initiative, Analysis of the genome sequence of the flowering plant Arabidopsis thaliana. Nature 408, 796 (2000). doi:10.1038/35048692 Medline
29. M. Kanehisa, S. Goto, M. Furumichi, M. Tanabe, M. Hirakawa, KEGG for representation and analysis of molecular networks involving diseases and drugs. Nucleic Acids Res. 38 (Database issue), D355 (2010). doi:10.1093/nar/gkp896 Medline
30. UniProt Consortium, The Universal Protein Resource (UniProt) in 2010. Nucleic Acids Res. 38 (Database issue), D142 (2010). doi:10.1093/nar/gkp846 Medline

44
31. M. Ashburner et al., Gene ontology: Tool for the unification of biology. Nat. Genet. 25, 25 (2000). doi:10.1038/75556 Medline
32. http://mapman.gabipd.org/web/guest/app/mercator
33. S. Hunter et al., InterPro: The integrative protein signature database. Nucleic Acids Res. 37 (Database issue), D211 (2009). doi:10.1093/nar/gkn785 Medline
34. J. Söding, A. Biegert, A. N. Lupas, The HHpred interactive server for protein homology detection and structure prediction. Nucleic Acids Res. 33, (Web Server issue), W244 (2005). doi:10.1093/nar/gki408 Medline
35. S. F. Altschul et al., Gapped BLAST and PSI-BLAST: A new generation of protein database search programs. Nucleic Acids Res. 25, 3389 (1997). doi:10.1093/nar/25.17.3389 Medline
36. Q. Ren, K. Chen, I. T. Paulsen, TransportDB: A comprehensive database resource for cytoplasmic membrane transport systems and outer membrane channels. Nucleic Acids Res. 35 (Database issue), D274 (2007). doi:10.1093/nar/gkl925 Medline
37. H. Li, V. A. Benedito, M. K. Udvardi, P. X. Zhao, TransportTP: A two-phase classification approach for membrane transporter prediction and characterization. BMC Bioinformatics 10, 418 (2009). doi:10.1186/1471-2105-10-418 Medline
38. M. H. Saier, Jr., M. R. Yen, K. Noto, D. G. Tamang, C. Elkan, The Transporter Classification Database: Recent advances. Nucleic Acids Res. 37 (Database issue), D274 (2009). doi:10.1093/nar/gkn862 Medline
39. T. N. Petersen, S. Brunak, G. von Heijne, H. Nielsen, SignalP 4.0: Discriminating signal peptides from transmembrane regions. Nat. Methods 8, 785 (2011). doi:10.1038/nmeth.1701 Medline
40. B. R. Zeeberg et al., High-Throughput GoMiner, an ‘industrial-strength’ integrative gene ontology tool for interpretation of multiple-microarray experiments, with application to studies of Common Variable Immune Deficiency (CVID). BMC Bioinformatics 6, 168 (2005). doi:10.1186/1471-2105-6-168 Medline
41. M. Remm, C. E. V. Storm, E. L. L. Sonnhammer, Automatic clustering of orthologs and in-paralogs from pairwise species comparisons. J. Mol. Biol. 314, 1041 (2001). doi:10.1006/jmbi.2000.5197 Medline
42. S. S. Merchant et al., The Chlamydomonas genome reveals the evolution of key animal and plant functions. Science 318, 245 (2007). doi:10.1126/science.1143609 Medline
43. R. C. Edgar, MUSCLE: A multiple sequence alignment method with reduced time and space complexity. BMC Bioinformatics 5, 113 (2004). doi:10.1186/1471-2105-5-113 Medline
44. G. Talavera, J. Castresana, Improvement of phylogenies after removing divergent and ambiguously aligned blocks from protein sequence alignments. Syst. Biol. 56, 564 (2007). doi:10.1080/10635150701472164 Medline
45. F. Abascal, R. Zardoya, D. Posada, ProtTest: Selection of best-fit models of protein evolution. Bioinformatics 21, 2104 (2005). doi:10.1093/bioinformatics/bti263 Medline

45
46. S. Guindon et al., New algorithms and methods to estimate maximum-likelihood phylogenies: Assessing the performance of PhyML 3.0. Syst. Biol. 59, 307 (2010). doi:10.1093/sysbio/syq010 Medline
47. Z. Yang, PAML 4: Phylogenetic analysis by maximum likelihood. Mol. Biol. Evol. 24, 1586 (2007). doi:10.1093/molbev/msm088 Medline
48. W.-H. Chen, M. J. Lercher, ColorTree: A batch customization tool for phylogenic trees. BMC Res. Notes 2, 155 (2009). doi:10.1186/1756-0500-2-155 Medline
49. A. Agresti, A survey of exact inference for contingency tables. Stat. Sci. 7, 131 (1992). doi:10.1214/ss/1177011454
50. K. Tamura, J. Dudley, M. Nei, S. Kumar, MEGA4: Molecular Evolutionary Genetics Analysis (MEGA) software version 4.0. Mol. Biol. Evol. 24, 1596 (2007). doi:10.1093/molbev/msm092 Medline
51. J.-F. Taly et al., Using the T-Coffee package to build multiple sequence alignments of protein, RNA, DNA sequences and 3D structures. Nat. Protoc. 6, 1669 (2011). doi:10.1038/nprot.2011.393 Medline
52. G. Altekar, S. Dwarkadas, J. P. Huelsenbeck, F. Ronquist, Parallel Metropolis coupled Markov chain Monte Carlo for Bayesian phylogenetic inference. Bioinformatics 20, 407 (2004). doi:10.1093/bioinformatics/btg427 Medline
53. D. H. Huson et al., Dendroscope: An interactive viewer for large phylogenetic trees. BMC Bioinformatics 8, 460 (2007). doi:10.1186/1471-2105-8-460 Medline
54. H. Zhang, S. Gao, M. J. Lercher, S. Hu, W.-H. Chen, EvolView, an online tool for visualizing, annotating and managing phylogenetic trees. Nucleic Acids Res. 40, (Web Server issue), W569 (2012). doi:10.1093/nar/gks576 Medline
55. J. E. Blair, Animals (Metazoa) in The Timetree of Life, S. B. Hedges, S. Kumar, Eds. (Oxford Univ. Press, New York, 2009), pp. 223-230.
56. C. Ciniglia, H. S. Yoon, A. Pollio, G. Pinto, D. Bhattacharya, Hidden biodiversity of the extremophilic Cyanidiales red algae. Mol. Ecol. 13, 1827 (2004). doi:10.1111/j.1365-294X.2004.02180.x Medline
57. H. S. Yoon, J. D. Hackett, C. Ciniglia, G. Pinto, D. Bhattacharya, A molecular timeline for the origin of photosynthetic eukaryotes. Mol. Biol. Evol. 21, 809 (2004). doi:10.1093/molbev/msh075 Medline
58. D. Bhattacharya, H. S. Yoon, S. B. Hedges, J. D. Hackett, in Eukaryotes (Eukaryota) in The Timetree of Life, S. B. Hedges, S. Kumar, Eds. (Oxford Univ. Press, New York, 2009), pp. 116–120.
59. P. J. Keeling, J. D. Palmer, Horizontal gene transfer in eukaryotic evolution. Nat. Rev. Genet. 9, 605 (2008). doi:10.1038/nrg2386 Medline
60. J. Huang, J. P. Gogarten, Concerted gene recruitment in early plant evolution. Genome Biol. 9, R109 (2008). doi:10.1186/gb-2008-9-7-r109 Medline

46
61. J. N. Timmis, M. A. Ayliffe, C. Y. Huang, W. Martin, Endosymbiotic gene transfer: Organelle genomes forge eukaryotic chromosomes. Nat. Rev. Genet. 5, 123 (2004). doi:10.1038/nrg1271 Medline
62. A. Criscuolo, S. Gribaldo, Large-scale phylogenomic analyses indicate a deep origin of primary plastids within cyanobacteria. Mol. Biol. Evol. 28, 3019 (2011). doi:10.1093/molbev/msr108 Medline
63. S. G. E. Andersson et al., The genome sequence of Rickettsia prowazekii and the origin of mitochondria. Nature 396, 133 (1998). doi:10.1038/24094 Medline
64. J. G. Lawrence, H. Ochman, Molecular archaeology of the Escherichia coli genome. Proc. Natl. Acad. Sci. U.S.A. 95, 9413 (1998). doi:10.1073/pnas.95.16.9413 Medline
65. J. Bohlin, E. Skjerve, D. W. Ussery, Reliability and applications of statistical methods based on oligonucleotide frequencies in bacterial and archaeal genomes. BMC Genomics 9, 104 (2008). doi:10.1186/1471-2164-9-104 Medline
66. C. S. Smillie et al., Ecology drives a global network of gene exchange connecting the human microbiome. Nature 480, 241 (2011). doi:10.1038/nature10571 Medline
67. R. W. Bailey, L. A. Staehelin, The chemical composition of isolated cell walls of Cyanidium caldarium. J. Gen. Microbiol. 54, 269 (1968). doi:10.1099/00221287-54-2-269 Medline
68. R. Asada, K. Tazaki, Silica biomineralization of unicellular microbes under strongly acidic conditions. Can. Mineral. 39, 1 (2001). doi:10.2113/gscanmin.39.1.1
69. R. P. Shrestha, A. P. Weber, Acidothermophilic red microalga Galdieria sulphuraria: From genome to an extracellular glucoamylase active at extreme low pH and high temperature. J. Phycol. 43 (suppl. 1), 23 (2007).
70. O. Emanuelsson, S. Brunak, G. von Heijne, H. Nielsen, Locating proteins in the cell using TargetP, SignalP and related tools. Nat. Protoc. 2, 953 (2007). doi:10.1038/nprot.2007.131 Medline
71. E. Derelle et al., Genome analysis of the smallest free-living eukaryote Ostreococcus tauri unveils many unique features. Proc. Natl. Acad. Sci. U.S.A. 103, 11647 (2006). doi:10.1073/pnas.0604795103 Medline
72. B. Palenik et al., The tiny eukaryote Ostreococcus provides genomic insights into the paradox of plankton speciation. Proc. Natl. Acad. Sci. U.S.A. 104, 7705 (2007). doi:10.1073/pnas.0611046104 Medline
73. E. V. Armbrust et al., The genome of the diatom Thalassiosira pseudonana: Ecology, evolution, and metabolism. Science 306, 79 (2004). doi:10.1126/science.1101156 Medline
74. http://genome.jgi-psf.org/Auran1/Auran1.home.html.
75. S. Guindon, O. Gascuel, A simple, fast, and accurate algorithm to estimate large phylogenies by maximum likelihood. Syst. Biol. 52, 696 (2003). doi:10.1080/10635150390235520 Medline
76. R. D. Finn et al., The Pfam protein families database. Nucleic Acids Res. 38 (Database issue), D211 (2010). doi:10.1093/nar/gkp985 Medline
47
77. M. H. Saier, Jr., C. V. Tran, R. D. Barabote, TCDB: The Transporter Classification Database for membrane transport protein analyses and information. Nucleic Acids Res. 34 (Database issue), D181 (2006). doi:10.1093/nar/gkj001 Medline
78. A. Marchler-Bauer et al., CDD: A conserved domain database for interactive domain family analysis. Nucleic Acids Res. 35 (Database issue), D237 (2007). doi:10.1093/nar/gkl951 Medline
79. D. Gagneul et al., A reassessment of the function of the so-called compatible solutes in the halophytic plumbaginaceae Limonium latifolium. Plant Physiol. 144, 1598 (2007). doi:10.1104/pp.107.099820 Medline