Supplementary Figure 1. Cross-sectional high-resolution ... · Cross-sectional high-resolution...
7
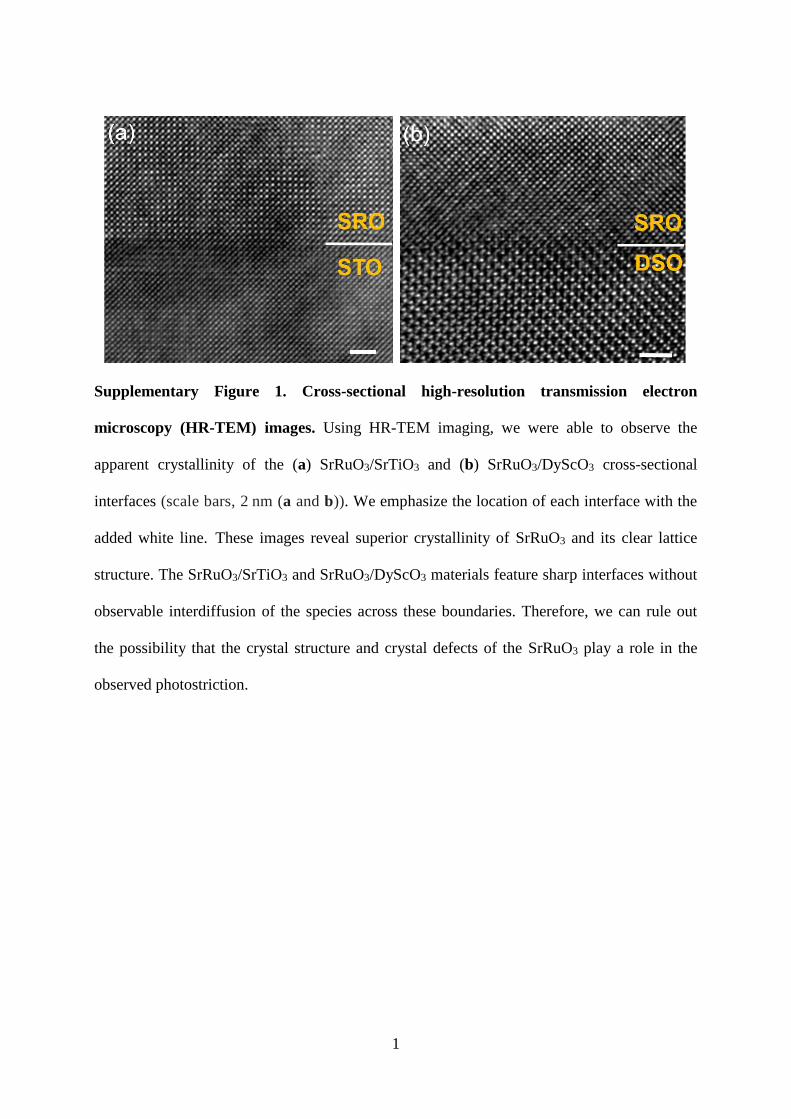
1 Supplementary Figure 1. Cross-sectional high-resolution transmission electron microscopy (HR-TEM) images. Using HR-TEM imaging, we were able to observe the apparent crystallinity of the (a) SrRuO3/SrTiO3 and (b) SrRuO3/DyScO3 cross-sectional interfaces (scale bars, 2 nm (a and b)). We emphasize the location of each interface with the added white line. These images reveal superior crystallinity of SrRuO3 and its clear lattice structure. The SrRuO3/SrTiO3 and SrRuO3/DyScO3 materials feature sharp interfaces without observable interdiffusion of the species across these boundaries. Therefore, we can rule out the possibility that the crystal structure and crystal defects of the SrRuO3 play a role in the observed photostriction.
Transcript of Supplementary Figure 1. Cross-sectional high-resolution ... · Cross-sectional high-resolution...
1
Supplementary Figure 1. Cross-sectional high-resolution transmission electron
microscopy (HR-TEM) images. Using HR-TEM imaging, we were able to observe the
apparent crystallinity of the (a) SrRuO3/SrTiO3 and (b) SrRuO3/DyScO3 cross-sectional
interfaces (scale bars, 2 nm (a and b)). We emphasize the location of each interface with the
added white line. These images reveal superior crystallinity of SrRuO3 and its clear lattice
structure. The SrRuO3/SrTiO3 and SrRuO3/DyScO3 materials feature sharp interfaces without
observable interdiffusion of the species across these boundaries. Therefore, we can rule out
the possibility that the crystal structure and crystal defects of the SrRuO3 play a role in the
observed photostriction.

2
Supplementary Figure 2. Laser intensity-dependent Raman scattering spectra. The 532
nm laser intensity-dependent (a) Raman scattering spectra and (b) phonon modes of the
SrTiO3 substrate. The 532 nm laser intensity-dependent (c) Raman scattering spectra and (d)
phonon modes of the DyScO3 substrate. The vertical dashed lines indicate the positions of the
phonon modes of the SrTiO3 and DyScO3 substrates.

3
Supplementary Figure 3. Laser intensity-dependent Stokes and anti-Stokes Raman
spectra of SrRuO3 thin films. (a) The Raman frequency of the Ag phonon mode are shown
as a function of excitation power intensity. (b) The local temperature at the laser focal point
obtained from the Stokes and anti-Stokes intensity ratio (IS/IAS) as a function of the laser
intensity.

4
Supplementary Figure 4. Non-contact temperature measurements of the SrRuO3. (a), (c)
Optical and (b), (d) thermal images of SrRuO3 on SrTiO3 substrate before and during the laser
irradiation, respectively. (e), (g) Optical and (f), (h) thermal images of the SrRuO3 thin film
on the DyScO3 substrate before and during the laser irradiation, respectively.
5
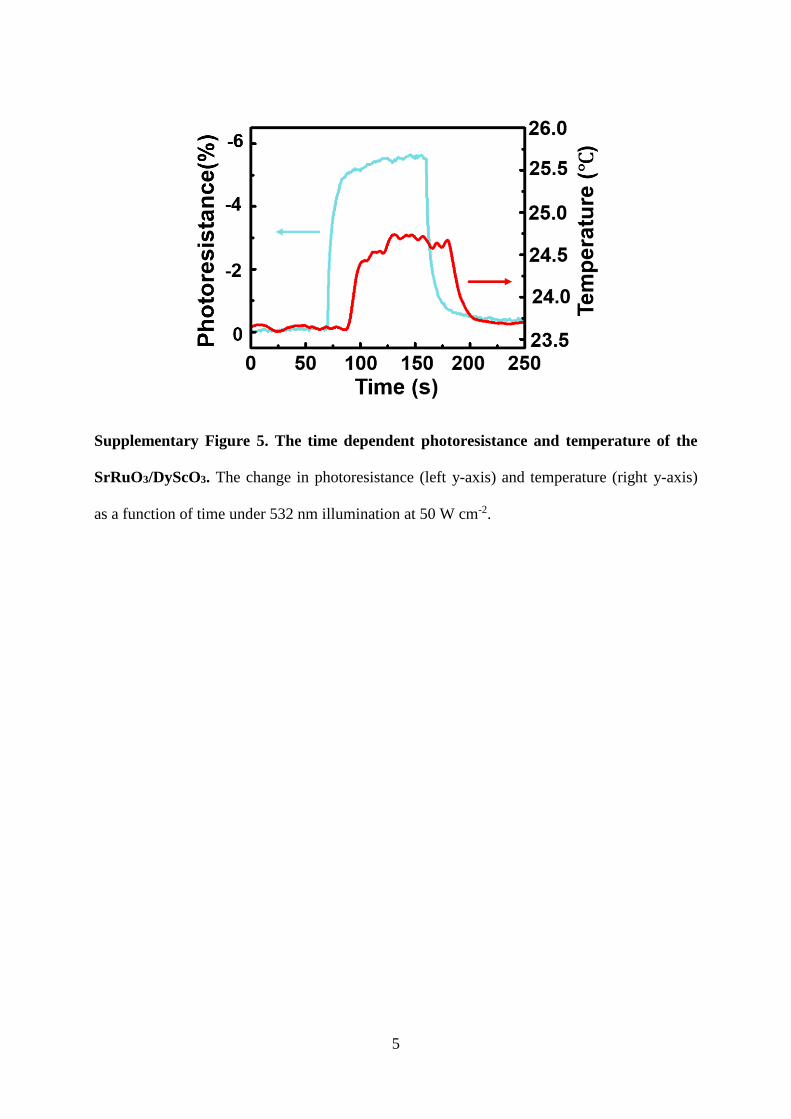
Supplementary Figure 5. The time dependent photoresistance and temperature of the
SrRuO3/DyScO3. The change in photoresistance (left y-axis) and temperature (right y-axis)
as a function of time under 532 nm illumination at 50 W cm-2.

6
Supplementary Note 1: Estimate the effective local temperature at the laser focal point.
Supplementary Figure 3a shows the laser intensity-dependent Stokes and anti-Stokes
spectra of the SrRuO3 thin films (the peaks of 372 and -372 cm-1, respectively). The frequency
shifts of the Stokes and anti-Stokes scattering were symmetric, but the scattering intensity of
the anti-Stokes transition was much lower than the Stokes transition. According to the
quantum theory, the local temperature, Teff, can be extracted by1:
Bff
S S
AS AS
1.43859
ln( ) ln( )e
kT
I I
I I
(1)
where ω is the Raman frequency, ħ is the reduced Planck constant, kB is the Boltzmann
constant, and IS and IAS are the intensities of the Stokes and anti-Stokes Raman scattering,
respectively. Teff as a function of incident laser intensity is shown in Supplementary Figure 3b.
There was no significant laser intensity dependance, demonstrating that there was no
measurable laser-induced thermal expansion in the material. In addition, the photostriction of
SRO depends nonlinearly on the light intensity and saturates beyond 50 W cm-2, which is also
inconsistent with the light-induced heating effect2.
7
Supplementary Note 2: Measured the temperature of the SRO thin films.
To further exclude laser-induced thermal expansion, we measured the temperature of the
SrRuO3 thin films using an InfReC Thermo Gear G100EXD thermal camera (Nippon
Avionics Co., Ltd.) under laser illumination for 3 min. The excitation intensity of the laser for
the thermal camera measurements was the same as that for the Raman experiments in this
study. As shown in Supplementary Figure 3a-d, the temperature in the lab was constant (25.3
ºC), while we observed that the surface temperature of the SrRuO3/SrTiO3 sample increased
by 2.2 ºC (from 25.3 ºC to 27.5 ºC) under laser illumination. Supplementary Figure 3e-h
shows the thermal image of the SrRuO3/DyScO3 sample. We observed a similar change in the
surface temperature (2.3 ºC increase) under laser illumination. This increase in temperature is
too small to result in a large lattice strain as compared to photon-induced strain demonstrated
in this study. Researchers have found that the volume change of SrRuO3 is only about 0.02%
from 200 K to 300 K3. However, we measured the photon-induced strain of SrRuO3 to be as
high as 1.12%.
Supplementary References
1. Balkanski, M., Wallis, R. F. & Haro, E. Anharmonic effects in light scattering due to
optical phonons in silicon. Phys. Rev. B 28, 1928–1934 (1983).
2. Daranciang, D. et al. Ultrafast photovoltaic response in ferroelectric nanolayers. Phys.
Rev. Lett. 108, 087601 (2012).
3. Lee, S. Large in-plane deformation of RuO6 octahedron and ferromagnetism of bulk
SrRuO3. J. Phys. Condens. Matter 25, 465201 (2013).