Supplementary Appendix -...
18
Supplementary Appendix Manuscript title Altered gut-liver axis and hepatic adiponectin expression in OSAS: novel mediators of liver injury in paediatric non-alcoholic fatty liver Authors: Valerio Nobili, Anna Alisi, Renato Cutrera, Guido Carpino, Cristiano De Stefanis, Valentina D’Oria, Rita De Vito, Salvatore Cucchiara, Eugenio Gaudio, Giovanni Musso Supplementary Appendix content: Text Tables 1-3 Figures 1-2 Supplementary Appendix Text Methods Exclusion of competing causes of steatosis. Exclusion criteria were hepatic virus infections (hepatitis A, B, C, D, E, and G; cytomegalovirus; and Epstein–Barr virus), excessive alcohol consumption (≥ 140 g/week), history of parenteral nutrition, and use of drugs known to induce steatosis (eg, valproate, amiodarone, or prednisone) or to affect body weight and carbohydrate metabolism. Autoimmune liver disease, metabolic liver disease, Wilson’s disease, celiac disease, and alpha-1-antitrypsin deficiency were ruled out using standard clinical, laboratory, and histological criteria. Proinflammatory markers and cytokines. Serum C-reactive protein (CRP) was determined via a high sensitivity latex agglutination method on HITACHI 911 Analyser (Sentinel Ch., Milan).
Transcript of Supplementary Appendix -...

Supplementary Appendix
Manuscript title Altered gut-liver axis and hepatic adiponectin expression in OSAS: novel
mediators of liver injury in paediatric non-alcoholic fatty liver
Authors: Valerio Nobili, Anna Alisi, Renato Cutrera, Guido Carpino, Cristiano De Stefanis,
Valentina D’Oria, Rita De Vito, Salvatore Cucchiara, Eugenio Gaudio, Giovanni Musso
Supplementary Appendix content:
Text
Tables 1-3
Figures 1-2
Supplementary Appendix Text
Methods
Exclusion of competing causes of steatosis. Exclusion criteria were hepatic virus infections
(hepatitis A, B, C, D, E, and G; cytomegalovirus; and Epstein–Barr virus), excessive alcohol
consumption (≥ 140 g/week), history of parenteral nutrition, and use of drugs known to induce
steatosis (eg, valproate, amiodarone, or prednisone) or to affect body weight and carbohydrate
metabolism. Autoimmune liver disease, metabolic liver disease, Wilson’s disease, celiac disease,
and alpha-1-antitrypsin deficiency were ruled out using standard clinical, laboratory, and
histological criteria.
Proinflammatory markers and cytokines. Serum C-reactive protein (CRP) was determined via a
high sensitivity latex agglutination method on HITACHI 911 Analyser (Sentinel Ch., Milan).

Serum adiponectin, TNF- and IL-6 were measured by sandwich ELISA (R&D System Europe
Ltd, Abingdon, UK). Sensitivity and intra-and inter-assay CVs of each kit are detailed in Online
Data Supplement.
Markers of hepatocyte apoptosis and of fibrogenesis. Circulating cytokeratin-18 (CK-18)
fragment levels, a validated marker of hepatocyte apoptosis in paediatric NAFLD, were measured
by the M30- Apoptosense ELISA kit (PEVIVA) purchased from Li Starfish (Milan, Italy).
Markers of extracellular matrix deposition. Serum hyaluronic acid (HA), a marker of
extracellular matrix deposition, was measured using an enzyme-linked binding protein assay
(Hyaluronan; R&D Systems, Minneapolis, Minn)(detailed in Online Data Supplement).
Proinflammatory markers and cytokines. The kit for serum C-reactive protein (CRP) had a
minimum detection of less than 0.05 mg/L, and a measurable concentration range up to 160 mg/L.
The intra-assay and inter-assay variation coefficients were, respectively, 0.8–1.3 and 1.0–1.5%.
For TNF- the kit has a sensitivity of 0.12 pg/mL in a 200-L sample size and a range of 0.5 to 32
pg/mL. The intra-and inter-assay coefficients of variation were 5.9% and 12.6%, respectively.
For IL-6, the kit has a sensitivity of 0.25 pg/mL in a 50-L sample size and a range of 3.9 to 250
ng/mL. The intra- and inter-assay coefficients of variation were 3.4% and 5.8%, respectively.
For adiponectin, the kit has a sensitivity of 2.47 ng/ml in a 200-L sample size and a range of 0.1-
1,000 ng/ml. The intra-and inter-assay coefficients of variation were 10% and 15%, respectively.
For leptin the kit has a sensitivity of 0.5 ng/ml in a 200-L sample size and intra-and inter-assay
coefficients of variation were 4.2% and 4.5%, respectively.
For resistin the kit has a sensitivity of 0.5 pg/ml in a 200-L sample size and intra-and inter-assay
coefficients of variation were 3.4% and 5.5%, respectively
For retinol binding protein(RBP)-4, the kit has a sensitivity of o.o1 mg/ml in a 100-L sample size
and a range of 0.1-1,000 mg/ml. The intra-and inter-assay coefficients of variation were 3.1% and
2.2%, respectively.

Markers of hepatocyte apoptosis. For all patients in our study, a blood sample was taken at the
time of the liver biopsy. All samples were originally processed to yield plasma and stored at − 80°
C . The samples were subsequently used for quantitative determination of CK18 levels by the M30-
Apoptosense ELISA kit (PEVIVA) purchased from Li Starfish (Milan, Italy). All assays were
performed in duplicates, and the absorbance was determined using a microplate reader (Molecular
Bio-Rad, Milan, Italy).
Markers of extracellular matrix deposition. Serum hyaluronic acid (HA), a marker of
extracellular matrix deposition, was collected at the time of liver biopsy and immediately stored at –
80C. HA was then measured using an enzyme-linked binding protein assay (Hyaluronan; R&D
Systems, Minneapolis, Minn) and is reported as ng/mL. According to our previous published data
ref 9 of main text, a value of HA≥1200 ng/mL makes the absence of fibrosis unlikely (7%, 95%
CI: 1% to 14%) and a value of HA≥ 2100 ng/mL makes significant fibrosis very likely (89%, 95%
CI: 75% to 100%).
Plasma Lipopolysacchariide (LPS) measurement.
Part of collected blood was centrifuged at 3000 RPM for 12 minutes and plasma was stored at -
80°C pending further analysis. Plasma LPS concentration was measured by a commercially
available kit (Amebocyte Lysate [LAL] LAL Chromogenic Endpoint Assay.
Cambrex Limulus kit; Hycult Biotech, Uden, The Netherlands). This assay has a sensitivity range
of 0.04–10.0 endotoxin unit (EU)/ml. All materials used for the assay were rendered LPS-free.
Intestinal permeability test. Patients followed a lactulose- and mannitol-free diet for 24 h before
the test. After an overnight fast, they voided a pre-test urine sample and ingested a solution
containing 5 g of lactulose and 1 g of mannitol in 120mL of deionised water. Urine was collected
during the next 6 h, with 1 mL of chlorhexidine (1 mg/mL) added as preservative. One hour after

the test was started, patients were encouraged to drink 50–150 mL of tap water. Total urine volume
was measured, and a 10-mL aliquot was stored at −20 °C until analysis. The fractional excretion of
lactulose was calculated from the ratio mg lactulose excreted/mg lactulose assumed. The mg
lactulose excreted were obtained from mg/L lactulose X litres of urine. The same was performed for
mannitol. The values of lactulose and mannitol calculated in the pre-test urine as mg/L were
subtracted from the same value obtained in the 6 h collected urine.
Liver histology. Liver biopsy was performed after an overnight fast, using an automatic core
biopsy 18 gauge needle (Biopince, Amedic, Sweden) under general anesthesia and ultrasound
guidance. A Sonoline Omnia ultrasound machine (Siemens, Munich, Germany) equipped with a 5-
MHz probe (5.0 C 50, Siemens) and a biopsy adaptor was employed. The length of liver specimen
was recorded: only samples with a length 15 mm and including at least 5–6 complete portal tracts
were considered adequate for the purpose of the study. Biopsies were routinely processed (ie,
formalin-fixed and paraffin-embedded) and sections of liver tissue were stained with hematoxylin-
eosin, Van Gieson, Periodic acid-Schiff diastase, and Prussian blue stain. Biopsies were evaluated
by a single hepato-pathologist, with a long-time experience in the field of liver pathology, who was
blinded to clinical and laboratory data. Steatosis, inflammation, hepatocyte ballooning and fibrosis
were scored using the NAFLD Clinical Research Network (CRN) criteria: Briefly, steatosis was
graded on a 4-point scale: grade 0 = steatosis involving <5% of hepatocytes; grade 1 = steatosis
involving up to 33% of hepatocytes; grade 2 = steatosis involving 33–66% of hepatocytes; and
grade 3 = steatosis involving >66% of hepatocytes. Lobular inflammation was graded on a 4-point
scale: grade 0 = no foci; grade 1 = <2 foci per 200×field; grade 2 = 2–4 foci per 200× field; and
grade 3 = >4 foci per 200× field. Hepatocyte ballooning was graded from 0 to 2: 0 = none; 1= few
balloon cells; and 2 =many/prominent balloon cells. The stage of fibrosis was quantified using a 5-
point scale: stage 0 = no fibrosis; stage 1 = perisinusoidal or periportal (1a = mild, zone 3,
perisinusoidal; 1b = moderate, zone 3, perisinusoidal; 1c = portal/periportal); stage 2

=perisinusoidal and portal/periportal; stage 3 = bringing; and stage 4 = cirrhosis. Additionally, the
presence of Mallory bodies and portal fibrosis were noted.
Features of steatosis, lobular inflammation, and hepatocyte ballooning were combined to obtain the
NAFLD activity score (NAS). As recently recommended by NASH CRN, a microscopic diagnosis
based on overall injury pattern (steatosis, hepatocyte ballooning, inflammation) as well as the
presence of additional lesions (e.g. zonality of lesions, portal inflammation and fibrosis) has been
assigned to each case. Accordingly, biopsies were subdivided into: not-NASH (not-NASH) and
definite NASH subcategories.
Liver Immunofluorescence (IF).and immunohistochemistry (IHC)
IF staining for TLR4 was performed with anti-TLR4 incubated for 1 h (dilution 1:50; rabbit
polyclonal, Novus Biological). After incubation with primary antibodies sections were revealed
with Alexa Fluor 555-goat anti-rabbit (1:500), Alexa Fluor 488-goat anti mouse (1:500) purchased
by Life Technologies, Carlsbad, CA, US). Nuclei were counterstained with DAPI for 5 min after
extensive washing; sections were next mounted with PBS/glycerol (1:1) and covered with a
coverslip.
The confocal microscopy imaging was performed by Olympus Fluoview FV1000 confocal
microscope equipped with FV10-ASW version 2.0 software, using 20× and 40x objective. Optical
single sections were acquired with a scanning mode format of 1024 × 1024 pixels, sampling speed
of 40 μs/pixel, and 12 bits/pixel images. Fluorochromes unmixing was performed by acquisition of
automated-sequential collection of multi-channel images, in order to reduce spectral crosstalk
between channels.
Adipokine expression by HPCs.
For IHC, samples were then incubated for 20’ at room temperature (RT) with secondary
biotinylated Abs and, successively, with streptavidin/horseradish peroxidase (LSAB+; code K0690;
Dako Cytomation,Glostrup, Denmark). Diaminobenzidine (code K3468, Dako) was used as the

substrate, and the sections were counterstained with hematoxylin(the entire procedure was
previously detailed) ref 12 of main text.
HPC compartment was evaluated by counting the number of CK7-positive cells within the
bile/reactive ductules by using a previously reported procedure ref 12 of main text. Solitary CK-7-
positive HPCs or those in small clumps that were localized in the parenchyma or at the portal
interface were included in these counts because they should be considered as a histological
sectioning of bile/reactive ductules through a transverse plane without any unique IHC markers to
distinguish them from cells within bile/reactive ductules . Cholangiocytes lining the interlobular
bile ducts were excluded from the counts.

Supplementary Appendix Tables
Table 1. Primary antibodies used for liver immunohistochemistry and immunofluorescence .
Antibody Source Vendor Catalogue # Dilution
Cytokeratin-7
Mouse
monoclonal
Dako,
Glostrup, Denmark
M7018 1:100
Adiponectin
Mouse
monoclonal
Abcam,
Cambridge, United Kingdom
AB22554 1:100
Resistin
Mouse
monoclonal
R&D Systems, Minneapolis,
MN, USA
MAB1359 1:200
p21waf1
Mouse
monoclonal
Millipore
Billerica (MA), USA,
MAB88058 1:20
Cleaved
Caspase-3,
Mouse
monoclonal
Cell Signaling Technology
Boston (MA), USA
5A1E 1:100
Table 2. Main clinical, biochemical and histological features of study population, grouped
according to obesity status (n=80).
Non-obese NAFLD Obese NAFLD Parameter Non-OSAS
subjects
(n=10)
OSAS
subjects
(n=10)
P Non-OSAS
(n=18)
OSAS
(n=42)
P
Age (yr) 11.71.4
12.01.6
0.650
11.52.3
11.22.3 0.656
Gender(% males) 60% 60% 0.999 61% 52% 0.347
BMI (kg/m2) 21.81.5† 22.11.8† 0.738 29.24.6 29.84.3 0.735
BMI z score 1.180.39† 1.180.42†
0.957
2.160.42
2.230.30 0.501
Waist
circumference
(cm)
87.55.0†
88.13.2†
0.617
89.94.9
90.13.9 0.873
Waist
circumference
z score
1.710.77† 1.550.48† 0.384 2.110.86 2.110.79 0.992
Systolic
BP(mmHg) 11318 11313
0.664 11315 11110
0.552
Diastolic
BP(mmHg) 6810 6610 0.67
1 686 687
0.632
Insulin (U/mL) 10.03.7 13.26.6 0.931
17.410.6 13.89.6 0.148
Glucose (mg/dL) 9112 9111 0.931 8616 8315 0.621
HOMA-IR 1.970.90 3.001.54 0.169 3.062.05 3.102.11 0.682
ISI 3.810.79 2.541.10
0.013
3.041.31
2.661.56 0.371
Triglyceride(mg/
dL) 10262 11965 0.843
9849 11564 0.252
Total cholesterol
(mg/dL) 15820 14831 0.430
15529 16839 0.167
HDL-cholesterol
(mg/dL) 426
409
0.706
447
427 0.469
Subjects with
diabetes(%)
0% 0% 0.999 6% 2% 0.479
Subjects with
Met Sy
(%)
10% 30% 0.371 11% 17% 0.513
Subjects with
abdominal
obesity(%)
30% 29% 0.982 88% 86% 0.712
Subjects with
hypertension(%)
20% 20% 0.999 25% 17% 0.391
Subjects with
hypertriglyceride
mia
(%)
30% 30% 0.999 30% 40% 0.479
Subjects with low
HDL-C(%)
25% 40% 0.289 47% 45% 0.876
Subjects with
IFG/diabetes(%)
20% 40% 0.275 11% 22% 0.394

Adiponectin(ng/
mL) 23.22.4 21.82.0 0.029 22.62.3 20.61.6 0.010
Resistin (pg/mL) 222945982 281966894 0.427 310241016
8
273081240
7
0.423
RBP(mg/mL) 3.20.5 3.10.8 0.704 2.81.3 3.11.2 0.214
C-reactive
protein
(mg/L)
1.40.4 1.90.3 0.028
1.60.4 1.90.4 0.028
IL-6(pg/mL) 12.24.2 11.95.7 0.875
10.46.4 11.25.8 0.695
Leptin(ng/mL) 21.45.9 19.17.9 0.389 17.78.1 20.19.5 0.406
TNF-(pg/mL) 6.72.0 7.41.9 0.476
6.92.2 7.12.3 0.585
L/M ratio 0.0210.018 0.0450.027 0.031 0.0220.022 0.0610.041 <0.001
Pathologic L/M
ratio n(%)
0 4 0.043 3 22 0.011
LPS(EU/mL) 1.780.46‡ 2.570.51 0.002 2.060.49 2.890.34 <0.001
AHI(events/hr) 0.500.27†
4.542.03
<0.001 0.550.33
5.001.13 <0.001
Oxygen
desaturation
index (ODI)
0.600.42
1.450.64§
0.019
0.600.39
1.600.44 0.001
TST (hr) 7.80.9 8.10.9 0.198 7.910.71 9.030.64 0.523
Mean SaO2(%)
95.30.8 93.50.5 0.011 95.51.0 92.51.0 0.003
Nadir SaO2 (%) 92.21.3 87.51.1 0.021 91.61.1 84.61.8 <0.001
SaO2<90% (%)
1412‡ 2918 <0.001 159 4131 <0.001
ETpCO2(mmHg) 42.42.4‡ 44.92.2 0.044 44.23.00 49.87.5 <0.001
Subjects with
severe OSAS(%) 0% 4(40%) 0.087 0% 19(45%) <0.001
AST(IU/L) 3012 3617 0.146
3019 4421 0.676
ALT(IU/L) 3016 3617 0.231
3316 4218 0.111
GGT(IU/L) 165 175 0.913
199 2218 0.328
CK18 (U/L) 17944 27066 0.009 23261 32168 <0.001
Hyaluronic acid
(ng/mL) 893479† 1003546 0.351 1102461 1532397 0.040
Subjects with
NASH
(%)
0%† 60%§ 0.004 11% 98% <0.001
NAS score 3.20.9
4.61.1
0.012 3.90.8
5.70.9 <0.001
Subjects with
fibrosis stage (%)
0
1
1a
50%
50%
0%
0%
60%
0%
0.033
0.859
0.999
34%
53%
0%
0%
44%
0%
<0.001
0.439
0.999

1b
1c
2
3
4
50%
0%
0%
0%
0%
0%
60%
40%
0%
0%
0.033
0.011
0.087
0.999
0.999
20%
33%
13%
0%
0%
5%
39%
50%
6%
0%
0.293
0.714
0.032
0.612
0.999
Fibrosis any
stage(%)
50% 100% 0.033 66% 100% 0.010
Significant (F≥2)
fibrosis
(%)
0% 40%§ 0.087 13% 50% 0.011
Portal fibrosis
n(%)
0% 100%§ <0.001 46% 89% 0.007
Data are reported as meanSD, unless otherwise specified. Differences were considered
statistically significant at p<0.05. Statistically significant differences are written in bold characters.
Abbreviations:
AHI (Apnea/hypopnea index): number of mixed/obstructive apnea/hypopneas per hour of sleep;
HOMA-IR: Homeostasis model assessment of insulin resistance;
ISI Insulin sensitivity index;
ODI (Oxygen desaturation index): number of haemoglobin desaturations (drop in Sa02 4% of
baseline value) per hour of sleep.
TST: total sleep time(min);
SaO2<90%: total duration of desaturation, expressed as percentage of total sleep time (% TST);
ETpCO2: mean end-tidal carbon dioxide pressure
CK18: cytokeratin-18 fragments
NAS: NAFLD Activity Score;
Obesity: BMI95th
percentile; abdominal obesity: waist circumference 90th percentile for age and
sex; severe OSAS: an AHI5 events/hr.
p<0.05 vs. obese subjects
†p<0.01 vs. obese subjects
§ p<0.05 vs. obese non-OSAS subjects
p<0.05 vs. obese subjects with OSAS

║p<0.01 vs. obese non-OSAS subjects
‡ p<0.01 vs. obese subjects with OSAS
Table 3. Liver immunohistochemistry and immunofluorescence parameters of study population,
grouped according to obesity status (n=80).

Non-obese NAFLD Obese NAFLD Parameter Non-OSAS
subjects
(n=10)
OSAS
subjects
(n=10)
P Non-OSAS
(n=18)
OSAS
(n=42)
P
Hepatocytes
p21waf1
index║ 4.512.13 11.005.12§ 0.002 8.135.58 15.938.12 <0.001
Apoptotic index ║ 5.895.12 12.025.31§ 0.028 9.034.02 15.896.19 <0.001
Adiponectin-positive
hepatocytes (%) 25.110.1 9.05.7§ <0.001 23.19,5 8.55.5 <0.001
Resistin-positive
hepatocytes(%) 18.912.1 16.412.1 0.412 13.312.1 15.911.4 0.782
TLR-4-positive
hepatocytes† 38.64.9 49.08.4§ 0.003 43.68.9 66.112.1 <0.001
Kupffer cells
n-Kupffer cells † 7.51.3 10.81.7§ 0.002 7.72.4 11.42.0 <0.001
TLR-4-positive
Kupffer cells
n-cells
% cells
2.11.5
27.913.4
5.81.9§
53.817.1§
<0.001
<0.001
2.61.1
33.511.5
6.62.0
58.111.7
<0.001
<0.001
Hepatic stellate cells (HSCs)
n-HSCs † 4.91.2 6.41.5§ 0.024 5.21.3 6.61.4 <0.001
TLR-4-positive
HSCs
n-HSC
% HSCs
1.51.1
27.010.2
3.51.0§
45.811.6§
<0.001
<0.001
1.51.0
27.210.3
3.61.3
50.19.9
<0.001
<0.001
Hepatic progenitor cells (HPCs)
n-HPCs ‡ 32.28.3 46.87.1§ <0.001 39.68.0 47.88.3 <0.001
Adiponectin-positive
HPCs
n-HPCs
% HPCs
5.02.0
13.46.1
3.21.8§
7.15.2§
0.032
0.022
4.21.7
9.94.1
2.91.3
6.03.7
<0.001 <0.001
Resistin-positive
HPCs
n-HPCs
% HPCs
8.14.3
22.88.1
8.73.9
21.69.7
0.450
0.712
8.84.9
21.99.1
9.35.1
22.79.0
0.775
0.812
Intermediate
Hepatocytes
(% patients)
0% 2(20%) 0.475 0% 9(21%) 0.047
Data are reported as meanSD, unless otherwise specified. Differences were considered
statistically significant at p<0.05. Statistically significant differences are written in bold characters.
Abbreviations: HSCs: hepatic stellate cells; HPC: hepatic progenitor cells; TLR-4: toll-like
receptor-4
p<0.01 vs. obese subjects
§ p<0.05 vs. obese non-OSAS subjects
p<0.05 vs. obese subjects with OSAS
† mean count in 5 different fields at a magnification of x20 under light microscopy (verificare)
‡ cells per HPF, i.e., at a magnification of x 20 under light microscopy
║at least 30 lobular fields at x40 magnification were analyzed (1,000 hepatocytes) for each section.

Supplementary Appendix Figures
Figure 1.Representative confocal immunofluorescence of TLR-4 co-receptor localization in liver-
resident cells. The representative confocal immunofluorescence was performed on liver tissue
sections. Co-staining of TLR-4 (red) with CD68, α-SMA or C8/18 (green) in children without
NASH (Not NASH) and with NASH (NASH). The nuclei are revealed by specific DAPI staining,
displayed in blue. Magnification x40.
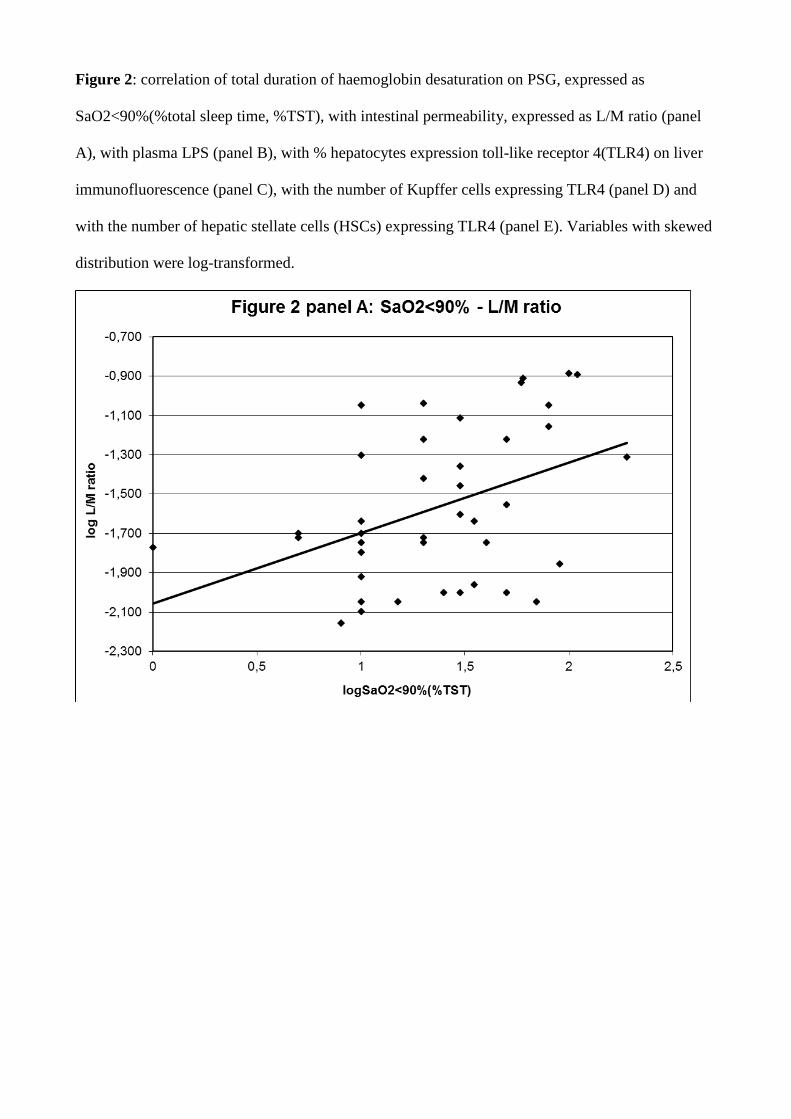
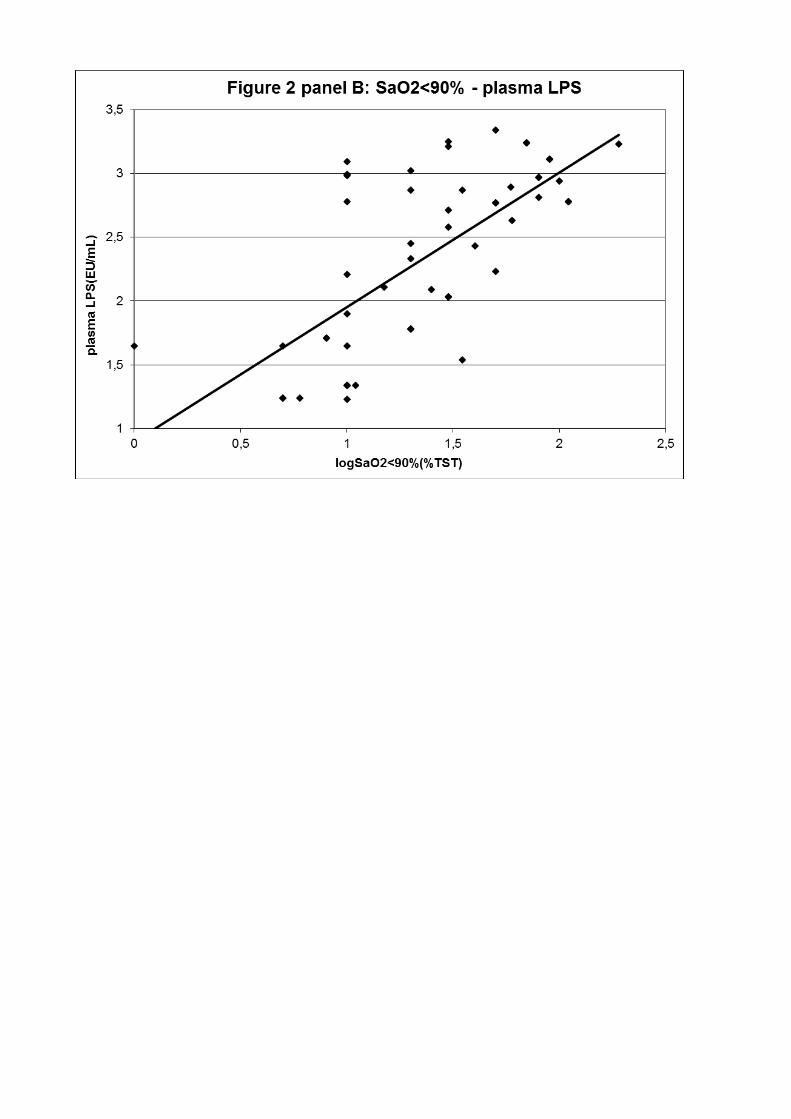
Figure 2: correlation of total duration of haemoglobin desaturation on PSG, expressed as
SaO2<90%(%total sleep time, %TST), with intestinal permeability, expressed as L/M ratio (panel
A), with plasma LPS (panel B), with % hepatocytes expression toll-like receptor 4(TLR4) on liver
immunofluorescence (panel C), with the number of Kupffer cells expressing TLR4 (panel D) and
with the number of hepatic stellate cells (HSCs) expressing TLR4 (panel E). Variables with skewed
distribution were log-transformed.