submaximal in - Thoraxthorax.bmj.com/content/thoraxjnl/30/4/415.full.pdf · performed an increasing...
11
Thorax (1975), 30, 415. An analysis of the physiological strain of submaximal exercise in patients with chronic obstructive bronchitis S. G. SPIRO, H. L. HAHN, R. H. T. EDWARDS, and N. B. PRIDE Department of Medicine, Royal Postgraduate Medical School, Hammersmith Hospital, Du Cane Road, London W12 OHS Spiro, S. G., Hahn, H. L., Edwards, R. H. T., and Pride, N. B. (1975). Thorax, 30, 415-425. An analysis of the physiological strain of submaximal exercise in patients with chronic obstructive bronchitis. An increasing work rate was performed by 40 patients with chronic obstructive bronchitis, split into two groups according to FEV1 (group M, mean FEV, 1-45 1. and group S, mean FEV1 0-62 1.), and by 20 normal, non-athletic men of similar age to the patients. Values for cardiac frequency and ventilation were interpolated to standard oxygen uptakes of 0 75, 1 0, and, where possible, 1-5 1 min-'. The tidal volume at a ventilation of 20 and 30 l min-' was also determined. The cardiac frequencies at oxygen uptakes of 0 75 and 1 01 min-' were significantly higher in the patient groups than in the normal men, and were highest in patient group S. The cardiac output when related to the oxygen uptake was in the normal range in all three groups of subjects, so that the patients had smaller stroke volumes than the normal men. Ventilation at oxygen uptakes of 0 75 and 1 0 1 min-' was significantly higher in both patient groups than in the normal subjects; there were no significant differences between the two patient groups. Values for dead space/tidal volume ratio, alveolar-arterial oxygen gradient, and the percent venous admixture measured during a constant work rate test were significantly greater than normal in the patient groups. Possible factors limiting exercise tolerance in these patients were assessed by extending the increasing work rate test from submaximum to maximum exercise. Changes in blood gas tensions and blood lactate concentrations from resting levels were small, and probably did not limit exercise performance. Measurements at maximum exercise did not add appreciably to the analysis of the disturbed cardiopulmonary function. This study has shown that major disturbances in cardiopulmonary function can be demonstrated without the need for stressing a patient to the limit of his effort tolerance. INTRODUCTION Although the working capacity of patients with chronic obstructive bronchitis has been studied by many authors, no simple way of comparing the capacity of these patients with that of normal subjects has been developed. Working capacity in normal subjects is assessed by measuring maximum oxygen uptake (Vo2 max) (Robinson, 1938, Astrand, 1952; Astrand, I, 1960) but this requires several exercise tests carried to exhaustion and is obviously impractical, and possibly hazardous, in clinical practice. A simpler and less exhausting method is to predict V02 max from the relationship between cardiac frequency and oxygen consumption during progressive submaximal exercise by a linear ex- trapolation of oxygen consumption to a theoretical maximum cardiac frequency (Shephard et al., 1968). However, this prediction does not take into account the curvilinearity of the relation between cardiac frequency and oxygen consumption as maximum values are approached and tends to underestimate Vo2 max (Davies, 1968). Furthermore, the working capacity of patients with chronic obstructive bron- chitis usually is limited by their impaired ventilatory capacity so that their cardiac frequencies on exercise do not approach the expected maximum values for their age (Armstrong et al., 1966; Gabriel, 1973). Recently, because of these difficulties in obtaining V02 max, Cotes et al. (1969) have suggested com- paring measurements obtained during submaximal 415 on 18 May 2018 by guest. Protected by copyright. http://thorax.bmj.com/ Thorax: first published as 10.1136/thx.30.4.415 on 1 August 1975. Downloaded from
Transcript of submaximal in - Thoraxthorax.bmj.com/content/thoraxjnl/30/4/415.full.pdf · performed an increasing...
Thorax (1975), 30, 415.
An analysis of the physiological strain of submaximalexercise in patients with chronic obstructive bronchitis
S. G. SPIRO, H. L. HAHN, R. H. T. EDWARDS,and N. B. PRIDE
Department of Medicine, Royal Postgraduate Medical School, Hammersmith Hospital,Du Cane Road, London W12 OHS
Spiro, S. G., Hahn, H. L., Edwards, R. H. T., and Pride, N. B. (1975). Thorax, 30, 415-425.An analysis ofthe physiological strain ofsubmaximal exercise in patients with chronic obstructivebronchitis. An increasing work rate was performed by 40 patients with chronic obstructivebronchitis, split into two groups according to FEV1 (group M, mean FEV, 1-45 1. and group
S, mean FEV1 0-62 1.), and by 20 normal, non-athletic men of similar age to the patients.Values for cardiac frequency and ventilation were interpolated to standard oxygen uptakesof 0 75, 1 0, and, where possible, 1-5 1 min-'. The tidal volume at a ventilation of 20 and 30l min-' was also determined.The cardiac frequencies at oxygen uptakes of 0 75 and 1 01 min-' were significantly higher
in the patient groups than in the normal men, and were highest in patient group S. The cardiacoutput when related to the oxygen uptake was in the normal range in all three groups ofsubjects, so that the patients had smaller stroke volumes than the normal men. Ventilationat oxygen uptakes of 0 75 and 1 0 1 min-' was significantly higher in both patient groups
than in the normal subjects; there were no significant differences between the two patientgroups. Values for dead space/tidal volume ratio, alveolar-arterial oxygen gradient, and thepercent venous admixture measured during a constant work rate test were significantly greaterthan normal in the patient groups.
Possible factors limiting exercise tolerance in these patients were assessed by extending theincreasing work rate test from submaximum to maximum exercise. Changes in blood gas
tensions and blood lactate concentrations from resting levels were small, and probably didnot limit exercise performance. Measurements at maximum exercise did not add appreciablyto the analysis of the disturbed cardiopulmonary function. This study has shown that major
disturbances in cardiopulmonary function can be demonstrated without the need for stressinga patient to the limit of his effort tolerance.
INTRODUCTION
Although the working capacity of patients withchronic obstructive bronchitis has been studied bymany authors, no simple way of comparing thecapacity of these patients with that of normalsubjects has been developed. Working capacity innormal subjects is assessed by measuring maximumoxygen uptake (Vo2 max) (Robinson, 1938, Astrand,1952; Astrand, I, 1960) but this requires severalexercise tests carried to exhaustion and is obviouslyimpractical, and possibly hazardous, in clinicalpractice. A simpler and less exhausting method isto predict V02 max from the relationship betweencardiac frequency and oxygen consumption duringprogressive submaximal exercise by a linear ex-
trapolation of oxygen consumption to a theoreticalmaximum cardiac frequency (Shephard et al., 1968).However, this prediction does not take into accountthe curvilinearity of the relation between cardiacfrequency and oxygen consumption as maximumvalues are approached and tends to underestimateVo2 max (Davies, 1968). Furthermore, the workingcapacity of patients with chronic obstructive bron-chitis usually is limited by their impaired ventilatorycapacity so that their cardiac frequencies on exercisedo not approach the expected maximum values fortheir age (Armstrong et al., 1966; Gabriel, 1973).Recently, because of these difficulties in obtainingV02 max, Cotes et al. (1969) have suggested com-paring measurements obtained during submaximal
415
on 18 May 2018 by guest. P
rotected by copyright.http://thorax.bm
j.com/
Thorax: first published as 10.1136/thx.30.4.415 on 1 A
ugust 1975. Dow
nloaded from

S. G. Spiro, H. L. Hahn, R. H. T. Edwards, and N. B. Pride
exercise at a standard oxygen uptake (Vo2). Innormal populations they have used a Vo2 of 1-5l min-.1 This Vo2 is too high for older women andfor many patients; furthermore, values at a singleV02 provide no information on the evolution of theexercise response or of the overall capacity forexercise. For these reasons we have suggested analternative approach in which measurements aremade throughout an increasing work rate test and theresults expressed, not only at suitable levels of Vo2(0 75, 1-0, and, where possible, 1-5 1 min-'), butalso in terms of the slope of the relationship ofcardiac frequency (fH) and ventilation (V) with V02.From these slopes and a knowledge of the maximumventilation and heart rate a measure of 'physiologicalstrain' can be obtained, which can be applied toboth normal populations and patients (Spiro et al.,1974).
In this paper we describe the changes in cardiacfrequency and in ventilation in 40 patients withchronic obstructive bronchitis and in 20 normalmiddle-aged men during a constant work rateexercise test. Some additional measurements of gasexchange and cardiac output were also made in allthe subjects during a constant work rate test.
SUBJECTS AND METHODS
Forty men (aged 47 to 72 years) attending theBronchitis Clinic at Hammersmith Hospital agreedto take part in the study. The criteria of chronicobstructive bronchitis were the same as those ofJones, Jones, and Edwards (1971). All the men hadbeen cigarette smokers and 25 were still smokingat the time of the study. None gave a history ofasthma or showed more than a 20% increase in theforced expiratory volume in 1 second (FEV1) afterbronchodilator. For analysis the patients weredivided into two groups according to their FEV1-a group M, with moderate airways obstruction,mean FEV1 145 1. (range 1-02-2 1.), and a groupS with severe airways obstruction, mean FEV10-62 1. (range 0-2-0-9 1.). Bronchodilator therapywas omitted on the day of the study. All the subjectswere in sinus rhythm and none was taking digoxin;two had a previous history of oedema and fourhad electrocardiographic evidence of right ventricularhypertrophy.Twenty normal, sedentary, middle-aged men
volunteered to take part in the study. A detailedmedical history was taken on the day of the study.No subject had a history of abnormal exertionaldyspnoea, angina or any other systemic illness.Dyspnoea grade was assessed as set out by the MedicalResearch Council (1965).
Height and weight were measured, and the lean
body mass (LBM) calculated with the formulae ofDurnin and Rahaman (1967) from the sum of fourskinfold thicknesses measured over the tricepsand biceps muscles and in the subscapular andsuprailiac regions. A resting venous blood samplewas taken from each subject for haemoglobinestimation. Vital capacity (VC) and FEV1 weremeasured with a waterless bellows spirometer(McDermott, McDermott, and Collins, 1968)Three attempts were made and the highest valuewas recorded. Lung volumes and specific airwaysconductance were measured in the patients using abody plethysmograph (DuBois et al., 1956; DuBois,Botelho, and Comroe, 1956). The transfer factorfor carbon monoxide (CO) was also measured inthe patients using the single breath technique(Ogilvie et al., 1957), and expressed as the ratioof CO transfer per litre alveolar lung volume STPD(Kco). The personal details of the subjects aresummarized in Table I.The subjects exercised while seated on an electric-
ally braked cycle ergometer (ELEMA). They firstperformed an increasing work rate test. Afterreaching a steady resting state, as judged by thecontinuous tracings of fH, V, and mixed expiredgas concentrations, exercise was begun at a poweroutput of 100 kpm min-' (16-7 watts) and increasedby 100 kpm min-' each minute. The patients wereencouraged to continue for as long as possible, andin every case exercise was stopped because ofdyspnoea. The normal subjects were asked to stop,for safety reasons, when the cardiac frequencyreached 85% of the maximum predicted for theirage (Astrand, 1960). When it appeared that thepatients were approaching their maximum exercisecapacity, blood samples were taken from a vaso-dilated ear lobe (Godfrey, et al., 1971) for measure-ment of oxygen tension (Po2) and carbon dioxidetension (Pco2) during the last minute of exercise.In preliminary experiments we found no significantdifferences in blood gas tensions in simultaneoussamples taken from the brachial artery and ear lobein 12 patients, so we have taken the blood gastensions of capillary blood from the ear as equivalentto the tensions in arterial blood (Pao2, Paco2).Measurement of blood gas tensions in 34 duplicatesamples of ear lobe blood gave a coefficient ofvariation of 2-7% for Pao2 and 3 8 % for Paco2.A further sample for blood lactate concentration
was taken from the ear lobe 5 minutes after the endof exercise. Blood lactate concentration was mea-sured from five drops of blood collected into a tubecontaining a weighed amount (0 5 ml) of 0-86 mol1-1 perchlorate solution. The tubes were shakenand stored before being analysed by an enzymatic
416
on 18 May 2018 by guest. P
rotected by copyright.http://thorax.bm
j.com/
Thorax: first published as 10.1136/thx.30.4.415 on 1 A
ugust 1975. Dow
nloaded from
Physiological strain of submaximal exercise in chronic obstructive bronchitis
TABLE IPERSONAL DETAILS OF SUBJECTS (MEAN ± SEM SHOWN)
Normal PatientsSubjects Group M Group S
FEV, (range, 1.) 2-8-4-7 1-0-2-2 0 2-0 9n 20 20 20
Age (years) 541±1I1 60*0±l10 62-0±1*7Height (cm) 173-4±1 5 172-8±i14 166-4+1±3Weight (kg) 76-2±2-3 72-9±2 8 68-6±2:9Lean body mass (kg) 62-3±i16 60-2+1*8 56-6±2-0FEV1 (1.) 3-44±0 1 145±0*1 0-62±0l1VC (.) 4-48±0-1 2-92±0-1 2-01±0-1FEV Y. normal1 115 0±2i8 49 2±229 24 0±1*7Resting Pvco, (mmHg) 46-2±1-1 56-6±1-6Dyspnoea grade' 2-2±0 2 3-0±0-2Total lung capacity (L.) 758±0-2 7-72±0 4Total lung capacity %/0 normal' 123 ±5 8 130±2-7Residual volume (1.) 4-3±0-2 52±0'3Kco (ml min-I mmHg-'I -l) 3 71±0 3 3-37±0 3SGaw (sec-1 cmH2O-') 0-071 ±0007 0 043 ±0-006
K0o = transfer factor for carbon monoxide per unit of alveolar volume (STPD).SGaw = specific airways conductance.'Normal value predicted from age and height according to Cotes (1968).2MRC instructions for the use of the questionnaire on respiratory symptoms, Medical Research Council (1965).
method (Hohorst, 1957). The coefficient of variationfor 40 analyses of duplicate samples was 8 '6% overthe range of 0 5-4 mmol l-1 (mean 1-4 mmol 1-1).
Following a rest of at least 30 minutes the subjectsperformed a constant work rate test for 6 minutes.The power output selected for the patients wasapproximately 50% of the final work rate achievedduring the progressive exercise test, and for thenormal subjects was approximately 60% of theirfinal work rate. Duplicate resting ear lobe bloodsamples were taken for measurement of Pao2,Paco2, and blood lactate. Constant work rateexercise then began and during the sixth minute afurther ear lobe sample was taken for blood gastensions and lactate concentration. The mixedvenous C02 tension (Pvco2) was measured at restand at the end of the sixth minute of exercise by therebreathing method of Jones et al. (1967). Cardiacfrequency, ventilation, and oxygen uptake werecalculated from the Mingograf recordings in theresting period and at the end of each minute ofexercise. The apparatus used, together with detailsof its accuracy, and the measurements made for thecalculation of gas exchange have been describedpreviously (Spiro et al., 1974).The slope of the relationship of cardiac frequency
and oxygen uptake (SfH1) was measured from a'least squares' regression line (fH against VO2)automatically calculated and drawn by an Eliott 4100digital computer. The slope for ventilation and oxy-gen uptake (SV) was drawn by eye through the linear(submaximal) range and did not include the inflexionthat is often seen in normal subjects at high poweroutputs (Cotes, 1968). The slopes (SfH, SV) wereexpressed as the increases in fH or in V required foran increase in V02 of 1 I min-'. The range over
which fH or V could potentially be increased duringexercise (that is, the difference between restingand maximum values) was taken as the 'adaptationcapacity' (ACfH, ACV). Resting values for calcu-lating ACfH and ACV were obtained from measure-ments made with the subject seated at rest on thecycle ergometer. In the normal subjects maximumventilation was taken as the FEV1 x 35 (Gandeviaand Hugh-Jones, 1957). In the patients, becauseof the relatively poor accuracy of existing predictions,the actual ventilation reached at the end of theexercise test was used. In all subjects the maximumheart rate was predicted from their age using theformula of Astrand (1960). By relating the absoluteincrease in ventilation or cardiac frequency (SV,SfH) for a standard stress (an increase in V02 of 11 min-') to an estimate of the individual's capacityto increase fH or V (ACfH, ACV), the 'physiologicalstrain' for ventilation or heart rate can be obtained(Spiro et al., 1974).The pattern of breathing for each group was
assessed by plotting ventilation against tidal volumeafter the method of Hey et al. (1966). The sub-maximal tidal volumes at a ventilation of 20 and30 1 'mmn-1 were interpolated from the individualplots.The dead space/tidal volume ratio (VD/VT%) was
calculated using the Bohr equation, from which thedead space (VD) was derived, allowing 60 ml forthe valve box dead space. Alveolar Po2 was derivedwith the alveolar air equation, and the measuredPao2 subtracted to obtain the alveolar-arterial Po2gradient (PA-ao2). The cardiac output (4)) wascalculated by the indirect Fick equation for CO2,incorporating the 'downstream' correction (Jonesetal., 1967). The percent venous admixture ((OS/OT %)
417
on 18 May 2018 by guest. P
rotected by copyright.http://thorax.bm
j.com/
Thorax: first published as 10.1136/thx.30.4.415 on 1 A
ugust 1975. Dow
nloaded from

S. G. Spiro, H. L. Hahn, R. H. T. Edwards, and N. B. Pride
was estimated by use of the classical 'shunt' equation.Calculations were performed with the Eliott 4100digital computer, using a programme based on themanipulation of the indirect Fick principle (Godfrey,1970).
In the text and tables all gas volumes, except theKco, are given corrected to BTPS, and values forVO2 are corrected to STPD.
RESULTS
The two patient groups were on average 6 to 8years older than the normal subjects. The patientsin group M were smaller and lighter and had a lowerlean body mass than the normal men (Table I);these anthropometric differences were only significantbetween group S and the normal men (t =2 05;0 025 >p>0 01). The dyspnoea grade (MRC, 1965)was significantly greater in patient group S than inpatient group M (t =2-63; 0-025>P>0-01). Themean total lung capacity was above the predictedvalue in both patient groups but there was nosignificant difference between the two groups. Theresidual volume was significantly greater in patientgroup S than in group M (t= 292; 0 01 >p>0 005).The transfer factor for CO related to alveolar volume(Kco) was considerably lower in the patient groups,than for normal middle-aged men (van GanseFerris, and Cotes, 1972). Specific airways con-ductance was significantly lower in patient groupS than in patient group M (t=3-13; 0-005>p>0-001). These pulmonary function tests were notcarried out on the normal men, but measurementsof these variables in other normal subjects studiedin this laboratory agree with published values(Cotes, 1968).The interpolated responses of cardiac frequency
at the submaximal levels of exercise (fH 0.75, fH 1.0,
fH1.5) are summarized in Table II and in Figure 1.Only two of the group S patients achieved an oxygen
uptake of 1-5 1 min-1 and these data have not beenincluded. As half of the group M subjects exceeded1-5 1 VO2 min-', the mean value for this submaximalindex was included. Only six subjects in group Sfailed to reach an oxygen uptake of 10 I min-'.The submaximal values for cardiac frequency weresignificantly higher in both the patient groups thanthe normal men at 0 75 and 1 0 I min-' V02 (t =3-318;P<0-001). The differences between the two patientgroups did not reach statistical significance. Theslope (SfH) was similar for all three groups ofsubjects, but the ACfH was smaller in both thepatient groups than in the normal men, as thepatients were older and also had higher restingcardiac frequencies (Table II). However, the physio-logical strain index showed no significant differencebetween the three groups studied.
Ventilation at 075, 1 0, and 1 5 1 min-1 VO2 washigher in the patients than in the normal men(t =-277; 0-01 >p> 0 005), but there were no signifi-cant differences in ventilation between group M andgroup S patients (Table III and Fig. 1). The slope ofventilation on oxygen uptake was slightly increased(compared to the normal subjects) in the group Mpatients Q=2-03; 0 05>P>0 025) but there wasno significant change in the severely obstructedpatients.The ACV was significantly smaller in patient
group M than in the normal subjects (t=9-1;P<0-001) and smaller still in patient group S thanin patient group M (t=49; P<0-001). The physio-logical strain index for ventilation was much greaterin both the patient groups than in the normal men,and was significantly larger in patient group Sthan in group M (t=2-82; 0-01>P>0005). Theinfluence of differences of somatic muscle mass wascorrected for by multiplying the physiologicalstrain index by the LBM. This did not cause anysignificant change in physiological strain for V orfH between any of the groups.
TABLE IISUBMAXIMAL INDICES AND ESTIMATION OF ADAPTATION CAPACITY AND RELATED 'PHYSIOLOGICAL STRAIN'
FOR CARDIAC FREQUENCY (MEAN ± SEM SHOWN)
Normal PatientsSubjects Group M Group S
FEV, (I.) 2-84-7 10-2 2 0*2-0 9n 20 20 20
fH rest (beats min- ') 81 4±3*5 85 9±2-9 85-0±2-6fH,.,, (beats min-') 95 0±3*1 102*9±3t5 109*5i2±9fH,.o (beatsmin-1) 105*6±3-1 113-2±3-5 120-1±3*8fH,.5 (beats min-') 126-9±3-4 127.6±5.92PredictedfH max (beats min- ') 175'1±0-8 171-0±0-7 169-8±1-1Adaptation capacity forfH (ACfH; beats min- ') 93-6±3-5 85-2±3-3 84*9±2-6'Slope' for fH(SfH; beats I Vo- ') 42 5±A19 40 9±2 1 43-3 ±4 9Physiological strain' for fH
SfH x 100 46 3±2l1 49*1±2*9 52 1±6i9'Pysolgialstai' orfH ACfH
'14 patienits.210 patients.
418
on 18 May 2018 by guest. P
rotected by copyright.http://thorax.bm
j.com/
Thorax: first published as 10.1136/thx.30.4.415 on 1 A
ugust 1975. Dow
nloaded from

Physiological strain of submaximal exercise in chronic obstructive bronchitis
TABLE IIISUBMAXIMAL INDICES AND ESTIMATIONS OF ADAPTATION CAPACITY AND RELATED 'PHYSIOLOGICAL STRAIN'
FOR VENTILATION (MEAN ± SEM SHOWN)
Normal PatientsSubjects Group M Group S
FEV5(LI) 2-8-4-7 1-02-2 02-0-9n 20 20 20
V rest (1 min- 1) 13 9±i13 13-8±10 11-4±0-5V,.7, (I min-1) 18q7±1 0 24*4±1*1 23-0±0*9V1. (I min- 1) 25 0±1i0 32-0±1-4 29-5±1 21V,, (Imin-') 36-6±1 5 43-3 ±2*4'FEVL x 35 (1 min-') 121-1±3-9 50-8±2-9 21-9±16Max observed ventilation (lmin-) 49 4±24 48-6±2*1 30*0±2*1Adaptation capacity for V (AVC; I min- 1) 108*0±4*1 34*8 ±2*63 19'0± 1 93Slope for V (SV) 23X8±14 31*5±1-8 25 6±P14*SV x 100 225i1497 2±i7'50' 152*7±:t18*7''Physiological strain' for V AC
x I 225±4
114 patients.210 patients.'Adaptation capacity and physiological strain in patient groups calculated from the maximum observed ventilation.
:Predicted Maximum'-.0.........
0
60
50P-
E
aj
1-
40
30
20
. o Normal subjectsA &Patient Group M 10. oPatient Group S
I I I ~0
0 0.5 1.0 1.5 2.0
COYGEN UPTAKE t STPD minm10 0.5 1.0 1.5 2.0
MYGEN UPTAKE tSTPD minm1FIG. 1. Mean values for cardiac frequency and ventilation at rest and at the submaximal levels of J02 (O 75, 1 -0, and1-5 1 min-') for all three groups of subjects (open symbols). The values during the last minute of constant work rateexercise (closed symbols) are also shown. The submaximal indices for cardiac frequency are higher in the patient groupsthan in the normal subjects andare higher inpatientgroup S thangroup M. There is no increase in the submaximal ventilatoryindices in group Sfrom group M.
Plots of VT against V (Hey et al., 1966) for 24 ofthe patients and for half of the normal men who wereselected at random are summarized in Figure 2a.Of the other 16 patients, four showed no increase inVT but only in frequency during exercise, and 12were unable to achieve a ventilation of 30 1 min-'.
The mean values of VT2o and VT30 were significantlysmaller in both the patient groups than in the normalmen (t=3 5; P<0 001) as were the maximum tidalvolumes recorded (VT max) (t =4-4; P< 0 001). Whenthe tidal volumes were expressed as a percentageof the VC, the submaximal and maximal tidal volume
180
160
140 1-
120 _
100 _-
80 -
-',
419
on 18 May 2018 by guest. P
rotected by copyright.http://thorax.bm
j.com/
Thorax: first published as 10.1136/thx.30.4.415 on 1 A
ugust 1975. Dow
nloaded from

S. G. Spiro, H. L. Hahn, R. H. T. Edwards, and N. B. Pride
NORMALSUBJECTS
GROUP
/ ,I ,-II.1
1-0 2.0TIDAL VOLUME [l]
3.0
FIG. 2(a). Mean relationships ofexercise tidal volume andventilation illustrating the patterns in the two patient groupsand the normal subjects. The maximum tidal volumesreached are indicated by the inflexions.
VII NORMAL
SU BJECTS
_i240 - GROUP M
z vtGOUP S
0
20 -
z
01-.
0 20 40 60TIDAL VOLUME %VITAL CAPACITY
(b). Mean relationships between the tidal volume as apercentage of the vital capacity, and ventilation.
TABLE IVMEASUREMENTS DURING LAST MINUTE OF INCREASING WORK RATE TEST (MEAN ± SEM SHOWN)
Normal PatientsSubjects Group M Group S
FEV1 (1.) 2*8-4*7 1-0-2-2 0 2-0 9n 20 20 20
Power output (kpm min 1) 900±54-7 595 ±32-8 385 ±33-5Maximum V02 (ml min- 1) 2012±104 1511±83 1034±85Maximum cardiac frequency (beats min- 1) 152-4±2-6 140-0±42 120-9±3 6Maximum cardiac frequency as % predicted max fH(%) 86-7±19 82-0±2-4 71 0± 1 9Maximum ventilation (I mnin l) 54-4±26 48 6±2-1 30 0±221Maximum ventilation as °/ predicted MVV (°/) 455±2-1 99 0±4 7 146-0±10-6Lactate rest (mmol 1-1) - 0*80±0*1 0-82±0-1Lactate maximum (mmol I') - 3-63±0-3 2 56±0-2Pao, (rest) mmHg 91 5±t17 76-3±21 69-7±A14Pao, (last mnin of exercise) mmHg _ 76-2±30 60 9 ±2-3Paco, (rest) mmHg 37-6±1*1 365±0 8 44-6±1-5Paco2 (last min of exercise) mmHg 410±1-3 490+ 18
measurements became similar in all three groups(Fig. 2b). Complete details ofthe mean and individualdata are available elsewhere (Spiro, 1975).The slope (m) of each Hey plot was similar in
group M and the normal subjects but was signifi-cantly steeper in group S (t =2 15; 0 05>p> 0 025).The intercept (k) was similar in all three groups.Data relating to the last minute of the increasing
work rate test are summarized in Table IV. Theblood lactate concentration after exercise wassignificantly higher in group M than in group S(t=2-71; P<0 01). The resting Pao2 was signifi-cantly lower in patient group M than in the normalsubjects (t=7.1; P<0'001) and was significantlylower in group S than in group M (t=2 28; 0-05>p> 0 025). The resting Paco2 was significantly raisedin group S from that in the normal subjects (t =4-24;
p< 0)001). In the last minute of exercise, a significantfall in Pao2 had occurred only in patient group S(t=2.97; 0-005>P>0-001). The Paco2 showed aslight increase in both patient groups which was notsignificant.The resting Pao2 was found to correlate well with
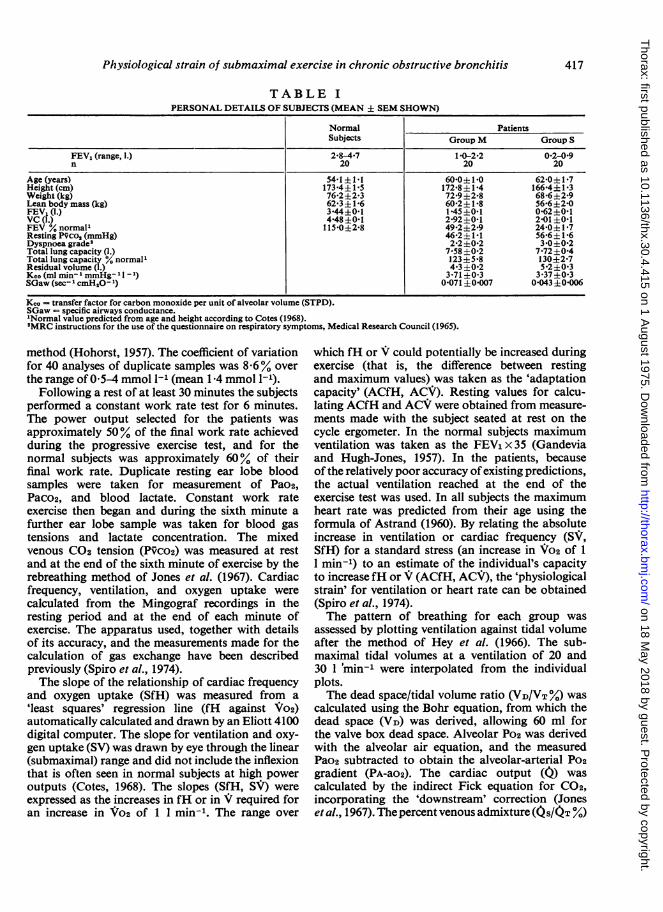
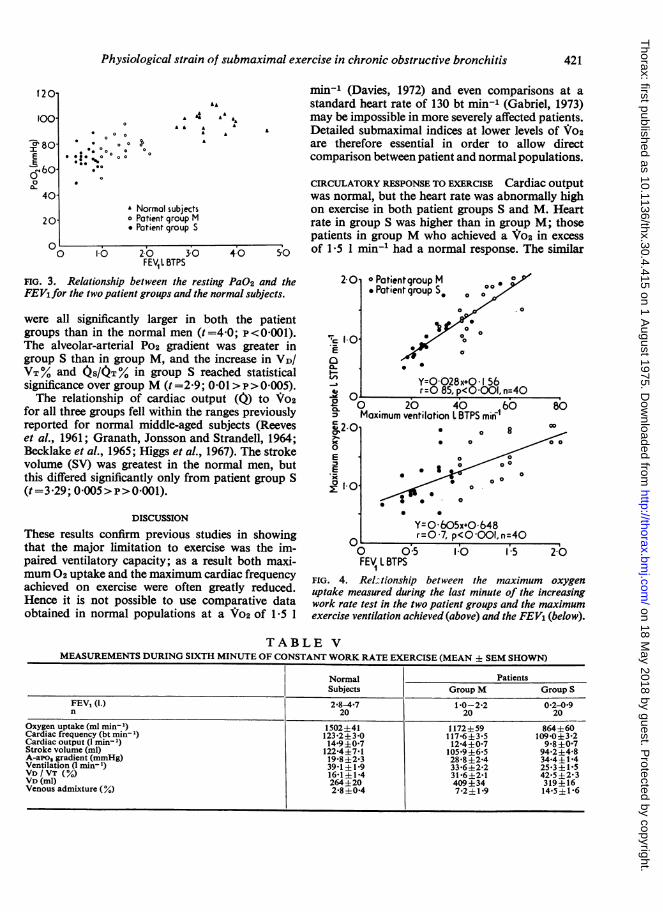
the FEV1 (r =0-78; p< 0-001; Fig. 3). The maximumventilation reached during the last minute of exercisewas significantly correlated with the measuredV02 max (r=0'85; P<0-001) and there was also asignificant relationship between FEV1 and themeasured Vo2 max in the patients (r =0 70; P<0 001;Fig. 4).Data obtained in the constant work rate test are
summarized in Table V. All subjects exercised inapproximately the middle of their working capacity.The VD/VT%, VD, A-a PO2 gradient, and S/4T%0
420
60
EIC
a.I~-go_
zw
0 11 -1-- -1II I a
on 18 May 2018 by guest. P
rotected by copyright.http://thorax.bm
j.com/
Thorax: first published as 10.1136/thx.30.4.415 on 1 A
ugust 1975. Dow
nloaded from
Physiological strain of submaximal exercise in chronic obstructive bronchitis
min-' (Davies, 1972) and even comparisons at astandard heart rate of 130 bt min-' (Gabriel, 1973)may be impossible in more severely affected patients.
AL Detailed submaximal indices at lower levels of Vo2are therefore essential in order to allow directcomparison between patient and normal populations.
CIRCULATORY RESPONSE TO EXERCISE Cardiac outputwas normal, but the heart rate was abnormally highon exercise in both patient groups S and M. Heartrate in group S was higher than in group M; thosepatients in group M who achieved a Vo2 in excess
40 50 of 1P5 1 min-' had a normal response. The similar
FIG. 3. Relationship between the resting PaO2 and theFEVifor the two patient groups and the normal subjects.
were all significantly larger in both the patientgroups than in the normal men (t=4-0; P<0 001).The alveolar-arterial Po2 gradient was greater ingroup S than in group M, and the increase in VD/VT% and OS/4T% in group S reached statisticalsignificance over group M (t =2-9; 0 01 >p>0-005).The relationship of cardiac output (0) to Vo2
for all three groups fell within the ranges previouslyreported for normal middle-aged subjects (Reeveset al., 1961; Granath, Jonsson and Strandell, 1964;Becklake et al., 1965; Higgs et al., 1967). The strokevolume (SV) was greatest in the normal men, butthis differed significantly only from patient group S(t=3-29; 0005>P>0001).
DISCUSSION
These results confirm previous studies in showingthat the major limitation to exercise was the im-paired ventilatory capacity; as a result both maxi-mum 02 uptake and the maximum cardiac frequencyachieved on exercise were often greatly reduced.Hence it is not possible to use comparative dataobtained in normal populations at a Vo2 of 1-5 1
o Patientqroup M 0 0. PatientqroupS5 0 00
0 .0
% 0
0 00 00
0
0o
Y=0028x.0156r-0 85, p<0 001, n=40
2-0
-'c 10E
e 0..-
W2-0-x0E
vEx
01o 0FEV l BTPS
0 20 40 60Maximum ventilation l BTPS miff1
a 8c
a 0
0 0
* 0
Y=0 605x+0 648r=0 7, p<000l,n=40
.5 [0 1I5 2-0
FIG. 4. ReL^tionship between the maximum oxygenuptake measured during the last minute of the increasingwork rate test in the two patient groups and the maximumexercise ventilation achieved (above) and the FEV1 (below).
TABLE VMEASUREMENTS DURING SIXTH MINUTE OF CONSTANT WORK RATE EXERCISE (MEAN± SEM SHOWN)
Normal PatientsSubjects Group M Group S
FEV1 (1.) 2*8-4*7 10-2*2 0-20-9n 20 20 20
Oxygen uptake (ml min 1) 1502±41 1172±59 864±60Cardiac frequency (bt min-) 123*2±3*0 117*6±3-5 109*0±3-2Cardiac output (1 min 1) 14*9±0*7 12-4±0*7 9-8±0-7Stroke volume (ml) 122-4±7'1 105-9±6 5 94-2±4-8A-apo1 gradient (mmHg) 19*8±2*3 28*8±2-4 34-4±1*4Ventilation (I mirin) 391l±19 33-6±2 2 253±i15VD / VT (%) 16-1±14 31-6±2*1 42 5±2 3VD (ml) 264±20 409±34 319±16Venous admixture (%) 2*8±0*4 7*2±1 9 14*5±1-6
1201
100
ca 80-EE
osouCL
40
.A
A AA4a A.
A
0
AA0* A A* a a
a
20
0 10
A Normal subjectso Patient group M* Patient group S
20 3.0FEV,L BTPS
a0I
L
421
on 18 May 2018 by guest. P
rotected by copyright.http://thorax.bm
j.com/
Thorax: first published as 10.1136/thx.30.4.415 on 1 A
ugust 1975. Dow
nloaded from
S. G. Spiro, H. L. Hahn, R. H. T. Edwards, and N. B. Pride
slope (SfH) in all three groups indicated that thepatients, despite a high resting cardiac frequency,had their greatest increase at the start of exercise(Fig. 1). While normal subjects commencing seatedexercise increase their stroke volume by approxi-mately 30% (Astrand and Rodahl, 1970), Gabriel(1973) measured only an 800 increase in SV in agroup of subjects with chronic obstructive bronchitisand a mean FEV1 similar to that of patient group M.Marcus et al. (1970) also found a low SV with nochange on exercise and a normal cardiac output inpatients with chronic airways obstruction. Whetherthe impaired SV response is due to raised pulmonaryartery pressure (Gabriel, 1973) or to features of leftventricular dysfunction (Baum et al., 1971) isuncertain.
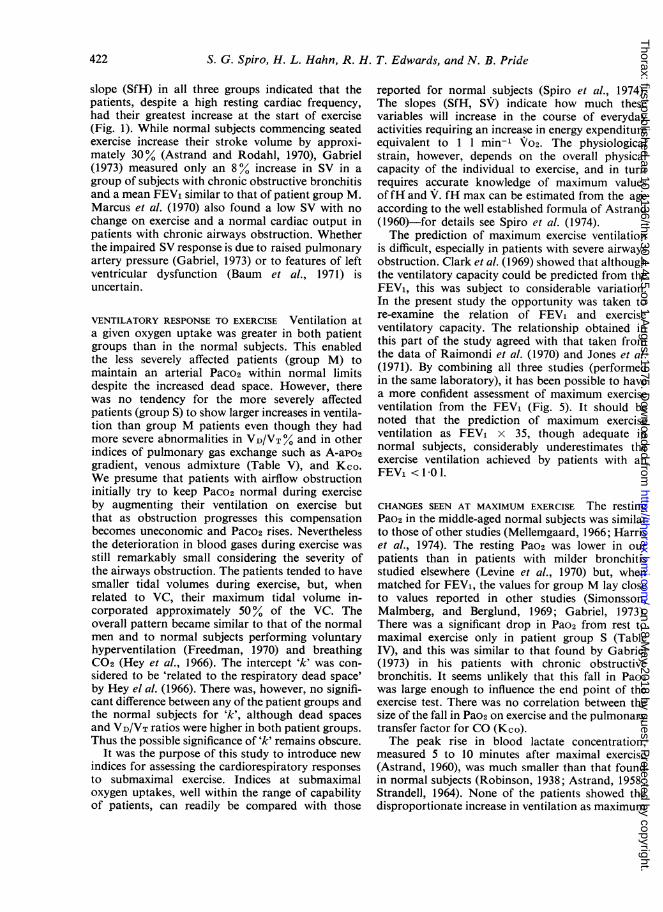
VENTILATORY RESPONSE TO EXERCISE Ventilation ata given oxygen uptake was greater in both patientgroups than in the normal subjects. This enabledthe less severely affected patients (group M) tomaintain an arterial Paco2 within normal limitsdespite the increased dead space. However, therewas no tendency for the more severely affectedpatients (group S) to show larger increases in ventila-tion than group M patients even though they hadmore severe abnormalities in VD/VT% and in otherindices of pulmonary gas exchange such as A-aPo2gradient, venous admixture (Table V), and Kco.We presume that patients with airflow obstructioninitially try to keep Paco2 normal during exerciseby augmenting their ventilation on exercise butthat as obstruction progresses this compensationbecomes uneconomic and Paco2 rises. Neverthelessthe deterioration in blood gases during exercise wasstill remarkably small considering the severity ofthe airways obstruction. The patients tended to havesmaller tidal volumes during exercise, but, whenrelated to VC, their maximum tidal volume in-corporated approximately 50% of the VC. Theoverall pattern became similar to that of the normalmen and to normal subjects performing voluntaryhyperventilation (Freedman, 1970) and breathingCO2 (Hey et al., 1966). The intercept 'k' was con-sidered to be 'related to the respiratory dead space'by Hey el al. (1966). There was, however, no signifi-cant difference between any of the patient groups andthe normal subjects for 'k', although dead spacesand VD/VT ratios were higher in both patient groups.Thus the possible significance of 'k' remains obscure.
It was the purpose of this study to introduce newindices for assessing the cardiorespiratory responsesto submaximal exercise. Indices at submaximaloxygen uptakes, well within the range of capabilityof patients, can readily be compared with those
reported for normal subjects (Spiro et al., 1974).The slopes (SfH, SV) indicate how much thesevariables will increase in the course of everydayactivities requiring an increase in energy expenditureequivalent to 1 1 min-1 V02. The physiologicalstrain, however, depends on the overall physicalcapacity of the individual to exercise, and in turnrequires accurate knowledge of maximum valuesoffH and V. fH max can be estimated from the ageaccording to the well established formula of Astrand(1960)-for details see Spiro et al. (1974).The prediction of maximum exercise ventilation
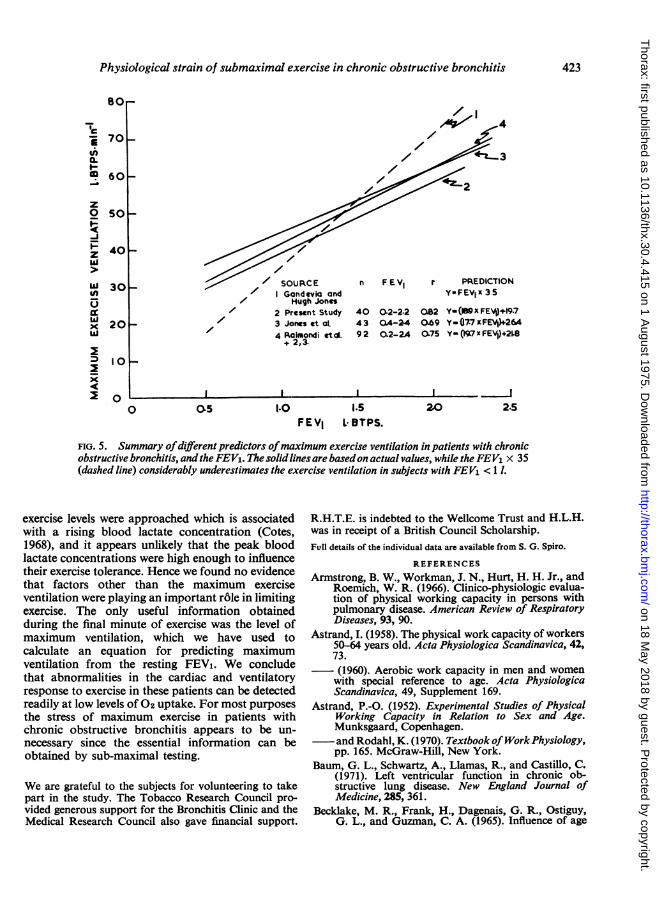
is difficult, especially in patients with severe airwaysobstruction. Clark et al. (1969) showed that althoughthe ventilatory capacity could be predicted from theFEV1, this was subject to considerable variation.In the present study the opportunity was taken tore-examine the relation of FEV1 and exerciseventilatory capacity. The relationship obtained inthis part of the study agreed with that taken fromthe data of Raimondi et al. (1970) and Jones et al.(1971). By combining all three studies (performedin the same laboratory), it has been possible to havea more confident assessment of maximum exerciseventilation from the FEV1 (Fig. 5). It should benoted that the prediction of maximum exerciseventilation as FEV1 x 35, though adequate innormal subjects, considerably underestimates theexercise ventilation achieved by patients with anFEV1 <1 01.
CHANGES SEEN AT MAXIMUM EXERCISE The restingPao2 in the middle-aged normal subjects was similarto those of other studies (Mellemgaard, 1966; Harriset al., 1974). The resting Pao2 was lower in ourpatients than in patients with milder bronchitisstudied elsewhere (Levine et al., 1970) but, whenmatched for FEV1, the values for group M lay closeto values reported in other studies (Simonsson,Malmberg, and Berglund, 1969; Gabriel, 1973).There was a significant drop in Pao2 from rest tomaximal exercise only in patient group S (TableIV), and this was similar to that found by Gabriel(1973) in his patients with chronic obstructivebronchitis. It seems unlikely that this fall in Pao2was large enough to influence the end point of theexercise test. There was no correlation between thesize of the fall in Pao2 on exercise and the pulmonarytransfer factor for CO (Kco).The peak rise in blood lactate concentration,
measured 5 to 10 minutes after maximal exercise(Astrand, 1960), was much smaller than that foundin normal subjects (Robinson, 1938; Astrand, 1958;Strandell, 1964). None of the patients showed thedisproportionate increase in ventilation as maximum
422
on 18 May 2018 by guest. P
rotected by copyright.http://thorax.bm
j.com/
Thorax: first published as 10.1136/thx.30.4.415 on 1 A
ugust 1975. Dow
nloaded from
Physiological strain of submaximal exercise in chronic obstructive bronchitis
/
/ SOUPCEI Gandevia and
x Hugh Jones- 2 Present Study
3 Jones et al4 Ralmondi etd.+ 2,3.
1.0
./
n F.E VI r PREDICTIONY-FEVIx 35
40 0.2-2.2 082 Y-(BQXFEV)+19.743 OA-2.4 0.69 Y-077 XFEV9)26492 O02-2A 0.75 Y--97xFEVj)+2I.8
FIG. 5. Summary ofdifferent predictors ofmaximum exercise ventilation in patients with chronicobstructive bronchitis, and the FEVI. The solid lines are basedon actual values, while the FEV1 x 35(dashed line) considerably underestimates the exercise ventilation in subjects with FEV1 < 1 .
exercise levels were approached which is associatedwith a rising blood lactate concentration (Cotes,1968), and it appears unlikely that the peak bloodlactate concentrations were high enough to influencetheir exercise tolerance. Hence we found no evidencethat factors other than the maximum exerciseventilation were playing an important role in limitingexercise. The only useful information obtainedduring the final minute of exercise was the level ofmaximum ventilation, which we have used tocalculate an equation for predicting maximumventilation from the resting FEV1. We concludethat abnormalities in the cardiac and ventilatoryresponse to exercise in these patients can be detectedreadily at low levels of 02 uptake. For most purposesthe stress of maximum exercise in patients withchronic obstructive bronchitis appears to be un-necessary since the essential information can beobtained by sub-maximal testing.
We are grateful to the subjects for volunteering to takepart in the study. The Tobacco Research Council pro-vided generous support for the Bronchitis Clinic and theMedical Research Council also gave financial support.
R.H.T.E. is indebted to the Wellcome Trust and H.L.H.was in receipt of a British Council Scholarship.Full details of the individual data are available from S. G. Spiro.
REFERENCES
Armstrong, B. W., Workman, J. N., Hurt, H. H. Jr., andRoemich, W. R. (1966). Clinico-physiologic evalua-tion of physical working capacity in persons withpulmonary disease. American Review of RespiratoryDiseases, 93, 90.
Astrand, I. (1958). The physical work capacity of workers50-64 years old. Acta Physiologica Scandinavica, 42,73.(1960). Aerobic work capacity in men and womenwith special reference to age. Acta PhysiologicaScandinavica, 49, Supplement 169.
Astrand, P.-O. (1952). Experimental Studies of PhysicalWorking Capacity in Relation to Sex and Age.Munksgaard, Copenhagen.and Rodahl, K. (1970). Textbook of WorkPhysiology,pp. 165. McGraw-Hill, New York.
Baum, G. L., Schwartz, A., Llamas, R., and Castillo, C.(1971). Left ventricular function in chronic ob-structive lung disease. New England Journal ofMedicine, 285, 361.
Becklake, M. R., Frank, H., Dagenais, G. R., Ostiguy,G. L., and Guzman, C. A. (1965). Influence of age
8Or
70k
60k
50k
40h
Ic
-rI0.-
z0
-Jz
wU)13cc
'a
30k
20k /
10k
00 05 1.5
FEVI L- BTPS.2.5
I
423
I II
on 18 May 2018 by guest. P
rotected by copyright.http://thorax.bm
j.com/
Thorax: first published as 10.1136/thx.30.4.415 on 1 A
ugust 1975. Dow
nloaded from
S. G. Spiro, H. L. Hahn, R. H. T. Edwards, and N. B. Pride
and sex on exercise cardiac output. Journal ofApplied Physiology, 20, 938.
Clark, T. J. H., Freedman, S., Campbell, E. J. M., andWinn, R. R. (1969). The ventilatory capacity ofpatients with chronic airways obstruction. ClinicalScience, 36, 307.
Cotes, J. E. (1968). Lung Function. Assessment andApplication in Medicine, 2nd edition, pp. 356 and374. Blackwell Scientific Publications, Oxford., Davies, C. T. M., Edholm, 0. G., Healy, M. J. R.,and Tanner, J. M. (1969). Factors relating to theaerobic capacity of 46 healthy British males andfemales, aged 18 to 28 years. Proceedings ofthe RoyalSociety, Series B, Biological Sciences, 174, 91.
Davies, C. T. M. (1968). Limitations to the predictionof maximum oxygen intake from cardiac frequencymeasurements. Journal ofAppliedPhysiology, 24, 700.(1972). The oxygen-transporting system in relationto age. Clinical Science, 42, 1.
DuBois, A. B., Botelho, S. Y., Bedell, G. N., Marshall,R., and Comroe, J. H. Jr. (1956). A rapid plethysmo-graphic method for measuring thoracic gas volume:A comparison with a nitrogen washout method formeasuring functional residual capacity in normalsubjects. Journal of Clinical Investigation, 35, 322.
and Comroe, J. H. Jr. (1956). A new methodfor measuring airway resistance in man using a bodyplethysmograph: Values in normal subjects and inpatients with respiratory disease. Journal of ClinicalInvestigation, 35, 327.
Durnin, J. V. G. A. and Rahaman, M. M. (1967). Theassessment of the amount of fat in the human bodyfrom measurements of skinfold thickness. BritishJournal ofNutrition, 21, 681.
Freedman, S. (1970). Sustained maximum voluntaryventilation. Respiration Physiology, 8, 230.
Gabriel, S. K. (1973). Respiratory and circulatoryinvestigations in obstructive and restrictive lungdiseases. Acta Medica Scandinavica, Supplement546.
Gandevia, B. and Hugh-Jones, P. (1957). Terminologyfor measurements of ventilatory capacity. Thorax,12, 290.
Godfrey, S. (1970). Manipulation of the indirect Fickprinciple by a digital computer program for thecalculation of exercise physiology results. Respiration,27, 513.Wozniak, E. R., Courtenay-Evans, R. J., and
Samuels, C. S. (1971). Ear lobe blood samples forblood gas analysis at rest and during exercise.British Journal of Diseases of the Chest, 65, 58.
Granath, A., Jonsson, B., and Strandell, T. (1964).Circulation in healthy old men, studied by rightheart catheterization at rest and during exercise insupine and sitting position. Acta Medica Scandi-navica, 176, 425.
Harris, E. A., Kenyon, A. M., Nisbet, H. D., Seelye,E. R., and Whitlock, R. M. L. (1974). The normalalveolar-arterial oxygen-tension gradient in man.Clinical Science and Molecular Medicine, 46, 89.
Hey, E. N., Lloyd, B. B., Cunningham, D. J. C., Jukes,M. G. M., and Bolton, D. P. G. (1966). Effects ofvarious respiratory stimuli on the depth and frequencyof breathing in man. Respiration Physiology, 1, 193.
Higgs, B. E., Clode, M., McHardy, G. J. R., Jones, N. L.,and Campbell, E. J. M (1967). Changes in ventila-tion, gas exchange and circulation during exercisein normal subjects. Clinical Science, 32, 329.
Hohorst, H. J. (1957). Enzymatische bestimmung von L(+)Milch Saure. Biochemische Zeitschrift, 328, 509.
Jones, N. L., Campbell, E. J. M., McHardy, G. J. R.,Higgs, B. E., and Clode, M. (1967). The estimationof carbon dioxide pressure of mixed venous bloodduring exercise. Clinical Science, 32, 311., Jones, G., and Edwards, R. H. T. (1971). Exercisetolerance in chronic airways obstruction. AmericanReview of Respiratory Disease, 103, 477.
Levine, G., Housley, E., MacLeod, P., and Macklem,P. T. (1970). Gas exchange abnormalities in mildbronchitis and asymptomatic asthma. New EnglandJournal of Medicine, 282, 1277.
Marcus, J. H., McLean, R. L., Duffell, G. M., andIngram, R. H. Jr. (1970). Exercise performance inrelation to the pathophysiologic type of chronicobstructive pulmonary disease. American Journal ofMedicine, 49, 14.
McDermott, M., McDermott, T. J., and Collins, M. M.(1968). A portable bellows spirometer and timingunit for the measurement of respiratory function.Medical and Biological Engineering, 6, 291.
Medical Research Council (1965). Definition and classifi-cation of chronic bronchitis for clinical and epide-mological purposes. Lancet 1, 775.
Mellemgaard, K. (1966). The alveolar-arterial oxygendifference: its size and components in normal man.Acta Physiologica Scandinavica, 67, 10.
Ogilvie, C. M., Forster, R. E., Blakemore, W. S., andMorton, J. W. (1957). A standardized breathholdingtechnique for the clinical measurement of the diffus-ing capacity of the lung for carbon monoxide.Journal of Clinical Investigation, 36, 1.
Raimondi, A. C., Edwards, R. H. T., Denison, D. M.,Leaver, D. G., Spencer, R. G., and Siddorn, J. A.(1970). Exercise tolerance breathing a low densitygas mixture, 35% oxygen and air in patients withchronic obstructive bronchitis. Clinical Science, 39,675.
Reeves, J. T., Grover, R. F., Blount, S. G., and Filley,G. F. (1961). Cardiac output response to standingand treadmill walking. Journal ofApplied Physiology,16, 283.
Robinson, S. (1938). Experimental studies of physicalfitness in relation to age. Arbeitsphysiologie, 10, 251.
Shephard, R. J., Allen, C., Benade, A. J. S., Davies,C. T. M., Di Prampero, P. E., Hedman, R., MerrimanJ. E., Myhre, K., and Simmons, R. (1968). Themaximum oxygen intake. An international referencestandard of cardio-respiratory fitness. Bulletin ofthe World Health Organisation, 38, 757.
Simonsson, B. G., Malmberg, R., and Berglund, E. (1969).Pulmonary gas exchange at rest and during exercisein chronic bronchitis. Scandinavian Journal ofRespiratory Disease, 50, 245.
Spiro, S. G. (1975). Cardiorespiratory adaptations toexercise in patients with chronic obstructive bron-chitis. M.D. Thesis, Manchester University.
424
on 18 May 2018 by guest. P
rotected by copyright.http://thorax.bm
j.com/
Thorax: first published as 10.1136/thx.30.4.415 on 1 A
ugust 1975. Dow
nloaded from

Physiological strain of submaximal exercise in chronic obstructive bronchitis
~,Juniper, E., Bowman, P., and Edwards, R. H. T.
(1974). An increasing work rate test for assessingthe physiological strain of submaximal exercise.Clinical Science and Molecular Medicine, 46, 191.
Strandell, T. (1964). Heart rate and work load at maximal
working intensity in old men. Acta Medica Scandi-navica, 176, 301.
van Ganse, W. F., Ferris, B. G. Jr., and Cotes, J. E.
(1972). Cigarette smoking and pulmonary diffusing
capacity (Transfer factor). American Review ofRespiratory Disease, 105, 30.
Requests for reprints to: Dr. R. H. T. Edwards, Depart-ment of Medicine, Royal Postgraduate Medical School,Hammersmith Hospital, Du Cane Road, LondonW12 OHS.
425
on 18 May 2018 by guest. P
rotected by copyright.http://thorax.bm
j.com/
Thorax: first published as 10.1136/thx.30.4.415 on 1 A
ugust 1975. Dow
nloaded from