
Supplemental Study Report Final edited
31
BALTIMORE CITY’S HIGH SCHOOL REFORM INITIATIVE: SCHOOLS, STUDENTS, AND OUTCOMES DECEMBER 2007 Prepared by: Education Policy Center The Urban Institute THE URBAN INSTITUTE EDUCATION POLICY CENTER EPC
Transcript of Supplemental Study Report Final edited

BALTIMORE CITY’S HIGH SCHOOL REFORM INITIATIVE:
SCHOOLS, STUDENTS, AND OUTCOMES
DECEMBER 2007
Prepared by:
Education Policy Center
The Urban Institute
THE URBAN INSTITUTE EDUCATION POLICY CENTER EPC

The Urban Institute / Education Policy Center SCHOOLS, STUDENTS, AND OUTCOMES 2007
2
THE URBAN INSTITUTE 2100 M STREET NW, WASHINGTON, DC 20037
ABOUT THE URBAN INSTITUTE AND THE EDUCATION POLICY CENTER The Urban Institute is a nonprofit, nonpartisan policy research and educational organization that examines the social, economic, and governance problems facing the nation. The views expressed are those of the authors and should not be attributed to the Urban Institute, its trustees, or its funders. The Urban Institute’s Education Policy Center (EPC) is composed of a multi-disciplinary team of researchers who conduct original investigations and program evaluations on a broad range of topics including educational accountability, school vouchers, the effectiveness of federal policies, school finance reform, urban high school initiatives, education technology, and teacher quality. The EPC’s goal is to provide objective and nonpartisan information and analysis in order to promote informed policy deliberation and public debate. Principal Investigator
Dr. Becky Smerdon Senior Research Associate, Education Policy Center Project Staff
Jennifer Cohen Research Associate, Education Policy Center
For More Information, Contact
Jennifer Cohen [email protected] or 202-261-5515

The Urban Institute / Education Policy Center SCHOOLS, STUDENTS, AND OUTCOMES 2007
3
EXECUTIVE SUMMARY In 2001, the Baltimore City Public School System (BCPSS) released its blueprint for reforming the city’s high schools. Central to the blueprint were plans to create eight innovation high schools and to convert all nine large, comprehensive high schools into smaller neighborhood schools. The innovation and neighborhood high schools were expected to reflect three guiding principles: (1) strong academic rigor, (2) small supportive structures, and (3) effective, accountable instruction and leadership. Neighborhood schools are small schools created by breaking up large comprehensive high schools. Innovation schools are new, independent small schools developed by or with outsider operators or technical assistance providers. Unlike neighborhood schools, innovation schools are given autonomy in hiring staff and selecting and implementing curriculum. Student enrollment in innovation schools is, and always has been, based on student interest. Student enrollment in neighborhood schools was originally determined first by geography, and then by student interest as space allowed. By 2005, however, BCPSS had instituted a citywide system of choice and neighborhood school enrollment that was no longer assigned by geographic boundaries. The creation of both innovation and neighborhood schools has unfolded more slowly than expected. As of 2007, only four of the nine comprehensive schools have been broken into smaller schools and only six of the eight planned innovation schools are underway. Since May 2003, the Urban Institute has been conducting a five-year evaluation of the implementation of Baltimore’s high school reform efforts. During this time, we administered annual surveys to all students and teachers in each of the reforming high schools and analyzed data provided by the Maryland State Department of Education (e.g., standardized test scores, attendance rates). The evaluation reports described the academic and social environments in the district’s innovation, neighborhood, and remaining comprehensive high schools. While BCPSS also has selective and “other” (i.e., alternative high schools for special populations), these schools were not included in previous evaluation reports. Over the course of the evaluation, conversations with school personnel and key stakeholders suggested concerns that reform efforts in Baltimore had further stratified the city’s high schools. Specifically, some stakeholders voiced apprehension that, for a variety of reasons, the innovation high schools were attracting and admitting more academically promising students and, perhaps, discouraging more challenging students. In short, a process of student sorting was possibly taking place. In a system of school choice a variety of factors—student motivation and interest, parent involvement, peer influence, geography, and encouragement from school personnel—can affect which students attend which schools. As a consequence, more academically successful students or more academically challenging students, for example, may end up in some schools than would be expected if students were randomly assigned to schools. The extent of sorting raises valid questions about the value added of schools that enroll more academically motivated students and how the performance of such schools should be compared to schools that enroll less motivated or able students. Additionally, stakeholders voiced concern that because innovation high schools were small in number and enrollments, only a minority of Baltimore's students would have the opportunity to attend them. Absent an expansion of innovation high schools or similar choice options, those interviewed raised questions about educational opportunity and equity for secondary students in the city.

The Urban Institute / Education Policy Center SCHOOLS, STUDENTS, AND OUTCOMES 2007
4
In this report, we address such questions using student-level administrative data and the survey data collected by the Urban Institute. Specifically, we answered the following questions:
1. a) Are students enrolled in innovation high schools more socially and academically advantaged than students enrolled in other BCPSS high schools (i.e., neighborhood, comprehensive, selective and “other”/alternative)?
b) Are the social and academic characteristics of students enrolled in the neighborhood high
schools significantly different from students enrolled in the original comprehensive high schools or from one another?
2. Do students in innovation high schools perform better (i.e., test scores, attendance) than students
in other BCPSS high schools (i.e., neighborhood, comprehensive, selective and “other”/alternative)? Are these differences due to the characteristics of the students enrolled in these new high schools?
3. Do reforming high schools (i.e., innovation, neighborhood, and comprehensive) differ from one another on their implementation of the guiding principles (e.g., support, effective instruction and leadership)? Are any differences related to the characteristics of the students they enroll? Do the levels of implementation relate to student outcomes?
Data and Methods To address these questions we used administrative data provided by BCPSS’ Division of Research, Evaluation, Assessment, and Accountability (DREAA). These data included student-level information on school enrollment, grade level, race/ethnicity, gender, age, special education and limited English proficient (LEP) status, free and reduced price lunch (FRPL) enrollment, previous achievement scores (TerraNova in mathematics and reading), high school attendance, and High School Assessment (HSA) scores for Algebra and English for all BCPSS high school students from 2002 through 2006. For the final question, we also used teacher and student survey responses collected during the 2005-06 administration of our school climate survey. For our analyses, we grouped students in BCPSS high schools into five categories. Those attending:
1. Innovation high schools (i.e., new small schools) 2. Neighborhood high schools (i.e., small schools created from large, comprehensive
schools) 3. Comprehensive high schools (i.e., non-selective, traditional schools) 4. Selective high schools (i.e., schools with admission requirements) 5. “Other” high schools (i.e., alternative schools for special populations, such as pregnant
teenagers)
We used both descriptive (e.g., t-test, chi-square) and inferential (e.g., multiple regression and hierarchical linear modeling) statistical techniques to answer our research questions. In many of our analyses, we controlled for student characteristics (e.g., previous achievement) to estimate the relationship between school type and student outcomes. However, there are a number of important factors that we were unable to include in our models, such as student motivation, parent involvement and access to information, and teacher quality and these omissions should be considered when interpreting the findings.
The Urban Institute / Education Policy Center SCHOOLS, STUDENTS, AND OUTCOMES 2007
5
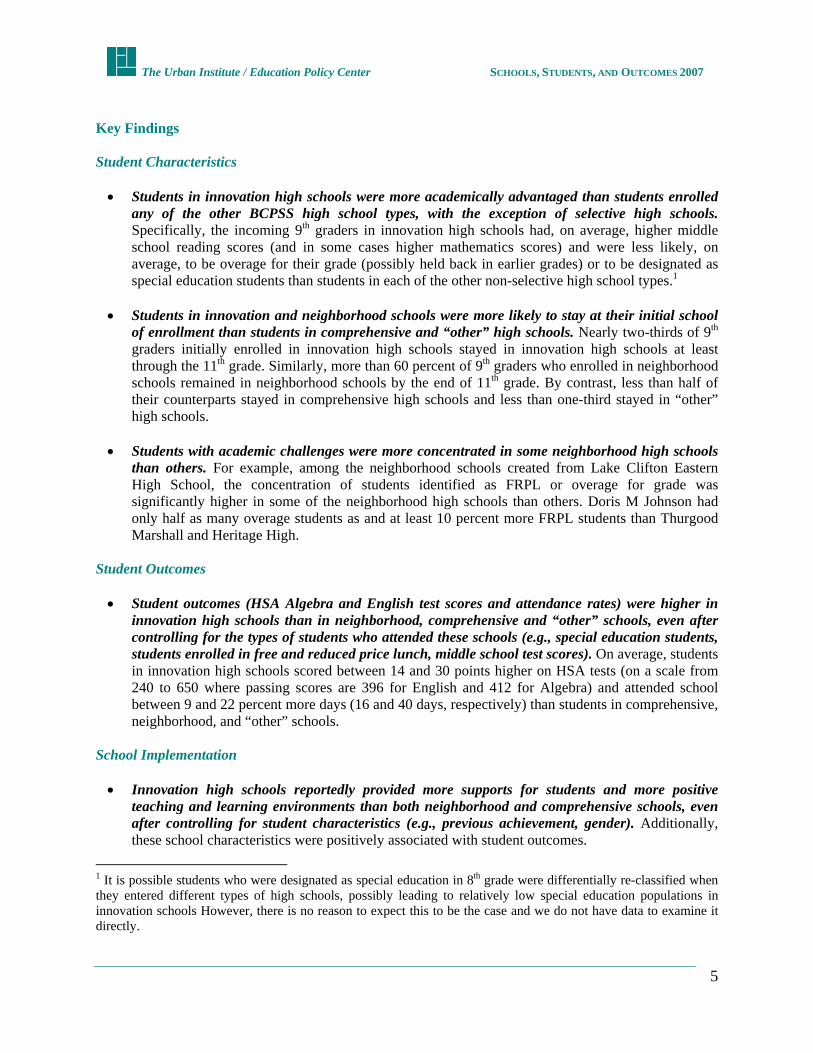
Key Findings Student Characteristics • Students in innovation high schools were more academically advantaged than students enrolled
any of the other BCPSS high school types, with the exception of selective high schools. Specifically, the incoming 9th graders in innovation high schools had, on average, higher middle school reading scores (and in some cases higher mathematics scores) and were less likely, on average, to be overage for their grade (possibly held back in earlier grades) or to be designated as special education students than students in each of the other non-selective high school types.1
• Students in innovation and neighborhood schools were more likely to stay at their initial school of enrollment than students in comprehensive and “other” high schools. Nearly two-thirds of 9th graders initially enrolled in innovation high schools stayed in innovation high schools at least through the 11th grade. Similarly, more than 60 percent of 9th graders who enrolled in neighborhood schools remained in neighborhood schools by the end of 11th grade. By contrast, less than half of their counterparts stayed in comprehensive high schools and less than one-third stayed in “other” high schools.
• Students with academic challenges were more concentrated in some neighborhood high schools than others. For example, among the neighborhood schools created from Lake Clifton Eastern High School, the concentration of students identified as FRPL or overage for grade was significantly higher in some of the neighborhood high schools than others. Doris M Johnson had only half as many overage students as and at least 10 percent more FRPL students than Thurgood Marshall and Heritage High.
Student Outcomes • Student outcomes (HSA Algebra and English test scores and attendance rates) were higher in
innovation high schools than in neighborhood, comprehensive and “other” schools, even after controlling for the types of students who attended these schools (e.g., special education students, students enrolled in free and reduced price lunch, middle school test scores). On average, students in innovation high schools scored between 14 and 30 points higher on HSA tests (on a scale from 240 to 650 where passing scores are 396 for English and 412 for Algebra) and attended school between 9 and 22 percent more days (16 and 40 days, respectively) than students in comprehensive, neighborhood, and “other” schools.
School Implementation • Innovation high schools reportedly provided more supports for students and more positive
teaching and learning environments than both neighborhood and comprehensive schools, even after controlling for student characteristics (e.g., previous achievement, gender). Additionally, these school characteristics were positively associated with student outcomes.
1 It is possible students who were designated as special education in 8th grade were differentially re-classified when they entered different types of high schools, possibly leading to relatively low special education populations in innovation schools However, there is no reason to expect this to be the case and we do not have data to examine it directly.

The Urban Institute / Education Policy Center SCHOOLS, STUDENTS, AND OUTCOMES 2007
6
Conclusions The Urban Institute’s previous evaluation reports have suggested that while the reform initiative was never fully implemented, there have been some promising signs across the system and within the reforming high schools. For example, a majority of the city’s high schools has shown some improvement in English and Algebra scores, attendance, and graduation rates since 2002-03, though these outcomes remain low overall (e.g., approximately 75 percent of students in reforming high schools did not pass the HSA English test in 2005-06). Similarly, most reforming high schools (i.e., innovation and neighborhood schools) have improved their social and academic environments, with students and staff reporting more safety, personalization, and administrative leadership over time. Relatively speaking, the reforming high schools, particularly innovation high schools, were serving their students reasonably well. The results presented in this report provide more rigorous findings to support these earlier conclusions. Additionally, the findings presented in this report indicate that innovation high schools had more positive academic environments and higher test scores and attendance than neighborhood, comprehensive, and “other” high schools, even after controlling for student characteristics such as previous achievement. Unlike other schools in the city, innovation high schools had advantages that include autonomy in hiring staff and selecting and implementing curricula and a student body that chose to be there. While we are not able to estimate the effects of these advantages directly, it is likely that they had a beneficial effect. The results here also confirm some of the concerns raised about equal opportunity and equity. Innovation high schools enrolled more academically successful students than other non-selective high schools in the city and successfully retained those students at higher rates than other school types over the initial years of high school. Additionally, some neighborhood high schools had higher concentrations of academically challenging students than other neighborhood high schools (e.g., a greater percentage of overage students in one school than another), providing further evidence of possible increased stratification. Questions about equal opportunity and equity in education are critical for stakeholders and reformers in Baltimore and across the country. However, these concerns should be put into context when examining the Baltimore high school reform initiative. The students attending innovation high schools in Baltimore are not students from advantaged families who sail through Algebra in the 8th grade. They are, by and large, high-poverty, African-American students who score much lower on middle school reading and mathematics tests than students attending the city’s selective high schools. BCPSS has found a way to improve educational opportunities and outcomes for some fraction of this population. The next step is to learn from this experience and to expand opportunities for more students.

The Urban Institute / Education Policy Center SCHOOLS, STUDENTS, AND OUTCOMES 2007
7
INTRODUCTION In 2001, the Baltimore City Public School System (BCPSS) released its blueprint for reforming the city’s high schools. Guided by a report prepared by the city’s High School Steering Committee and adopted by the New Board of School Commissioners, the blueprint described plans to create eight innovation high schools and to convert all nine large, comprehensive high schools into smaller neighborhood schools. The reform efforts outlined in the blueprint were supported by the Bill & Melinda Gates Foundation, as well as a number of local philanthropic organizations, including the Abell Foundation, Annie E. Casey Foundation, American Trading and Production Corporation (ATAPCO), Baltimore Community Foundation, Blaustein Philanthropic Fund, Clayton Baker Trust, Lockhart Vaughn, Open Society Institute, Straus Foundation, and Thalheimer Foundation. Innovation and neighborhood high schools were expected to reflect three guiding principles: strong academic rigor, small supportive structures, and effective, accountable instruction and leadership. Neighborhood schools are small schools created from breaking up large comprehensive high schools. Innovation schools are new, independent, small schools developed by or with outsider operators or technical assistance providers. Unlike neighborhood schools, innovation schools are given autonomy in hiring staff and selecting and implementing curriculum. Student enrollment in innovation schools is, and always has been, based on student interest. Student enrollment in neighborhood schools was originally determined first by geography, and then by student interest as space allowed. By 2005, however, BCPSS had instituted a citywide system of choice and neighborhood school enrollment was no longer assigned by geographic boundaries. Since May 2003, we have administered annual surveys to all students and teachers in the reforming high schools and analyzed data provided by the Maryland State Department of Education (e.g., standardized test scores, attendance, and credit accrual). The evaluation reports described the academic and social environments in the innovation, neighborhood, and remaining comprehensive high schools. In addition, we conducted a qualitative study of the reform effort through site visits to 20 innovation, neighborhood, and comprehensive high schools during the 2004–05 academic year. While BCPSS also has selective and “other,” or alternative, high schools for special populations, these schools were not included in previous evaluation reports. Over the course of the evaluation, conversations with school personnel and key stakeholders suggested concerns that reform efforts in Baltimore had further stratified the city’s high schools. Specifically, some stakeholders voiced apprehension that, for a variety of reasons, the innovation high schools were attracting and admitting more academically promising students and, perhaps, discouraging more challenging students. In short, a process of student sorting was possibly taking place. In a system of school choice a variety of factors—student motivation and interest, parent involvement, peer influence, geography, and encouragement from school personnel—can affect which students attend which schools. As a consequence, more academically successful students or more academically challenging students, for example, may end up in some schools than would be expected if students were randomly assigned to schools. The extent of sorting raises valid questions about the value added of schools that enroll more academically motivated students and how the performance of such schools should be compared with schools that enroll less motivated or able students. Additionally, stakeholders voiced concern that innovation high schools were providing their students with better academic experiences than those experienced by their peers in neighborhood or comprehensive high schools. These perceptions raised serious questions about educational opportunity and equity among secondary schools in the city.

The Urban Institute / Education Policy Center SCHOOLS, STUDENTS, AND OUTCOMES 2007
8
Until this year, the research team at the Urban Institute has not had the data needed to address questions about student sorting and the impact of the reforms on student outcomes. This spring, BCPSS’s Division of Research, Evaluation, Assessment, and Accountability (DREAA) provided us the student-level, longitudinal data needed to answer these questions. In this report, we present our findings, beginning with the research questions and a description of the schools, moving to a description of the data and methods, and ending with findings and conclusions. RESEARCH QUESTIONS This report answers three research questions:
1. (a) Are students enrolled in innovation high schools more socially and academically advantaged
than students enrolled in other BCPSS high schools (i.e., neighborhood, comprehensive, selective and “other”/alternative)?
(b) Are the social and academic characteristics of students enrolled in the neighborhood high schools significantly different from students enrolled in the original comprehensive high schools or from one another?
2. Do students in innovation high schools perform better (i.e., test scores, attendance) than students in other BCPSS high schools (i.e., neighborhood, comprehensive, selective and “other”/alternative)? Are these differences due to the characteristics of the students enrolled in these new high schools?
3. Do reforming high schools (i.e., innovation, neighborhood, and comprehensive) differ from one another on their implementation of the guiding principles (e.g., rigor, support, effective instruction and leadership)? Are any differences related to the characteristics of the students they enroll? Do the levels of implementation relate to student outcomes?
SCHOOL POPULATION AND SAMPLE For our analyses, we grouped students in BCPSS high schools into five categories. Those attending
1. Innovation high schools (i.e., new small schools) 2. Neighborhood high schools (i.e., small schools created from large, comprehensive
schools) 3. Comprehensive high schools (i.e., non-selective, traditional schools) 4. Selective high schools (i.e., schools with admission requirements) 5. “Other” high schools (i.e., alternative schools for special populations, such as pregnant
teenagers)
Exhibit 1 provides school counts by school type from the beginning of the reform initiative through the 2006–07 school year.

The Urban Institute / Education Policy Center SCHOOLS, STUDENTS, AND OUTCOMES 2007
9
Exhibit 1. School and student counts by school type, 2002–2007 School Type Year 1
2002–03 Year 2
2003–04 Year 3
2004–05 Year 4
2005–06 Year 5
2006–07 Innovation 0
(n=0) 2
(n=153) 4
(n=550) 6
(n=1052) 6
Neighborhood 4 (n=1861)
7 (n=3072)
10 (n=4540)
13 (n=6907)
13
Comprehensive 7 (n=10453)
7 (n=9185)
7 (n=7080)
5 (n=4942)
5
Selective 8 (n=7977)
8 (n=7710)
8 (n=7473)
8 (n=7313)
8
Other 3 (n=1200)
3 (n=2041)
3 (n=2349)
3 (n=1912)
3
Year 1: 2002–03 Year 1 was a planning year for the innovation high schools. Four neighborhood high schools existed from previous reform efforts, Digital Harbor High School, Samuel Banks, Reginald F Lewis, and WEB Dubois. Digital Harbor was created in 2001 as a stand-alone school, but shares many of the same features as neighborhood schools and was placed into that category for this study.2 The latter three neighborhood schools were created from Northern High School, which closed in 2002. Another comprehensive school, Southern High School, also closed in 2002. By 2003, seven of the nine BCPSS comprehensive high schools remained open. During the first year and across all four subsequent years, BCPSS had eight selective and three “other” high schools. Year 2: 2003–04 In the second year, the first two innovation schools opened, New Era Academy and Baltimore Freedom Academy. Additionally, three neighborhood schools were created from Lake Clifton-Eastern High School: Thurgood Marshall, Fairmont Hartford (currently called Heritage High), and School 426 (currently called Doris M Johnson). The innovation high schools started with 9th graders and added a grade each year. Neighborhood schools opened with students in all grades. Year 3: 2004–05 In year three, two innovation high schools opened, Academy for College and Career Development (ACCE) and Baltimore Talent Development. Three additional neighborhood schools were created from large, comprehensive high schools: Medical Arts Academy and the Augusta Fells Savage Institute for Visual Arts from Southwestern High School and Maritime Academy from Walbrook High School. The seven comprehensive high schools remained open but three of them, Walbrook, Lake Clifton-Eastern and Southwestern, were phasing out at this time. Year 4: 2005–06 In year four, two innovation schools opened, Coppin Academy and Renaissance Academy. Three neighborhood schools were created from Walbrook High School: Liberal Arts Academy, Homeland Security High, and Business and Entrepreneurship Academy. Lake Clifton-Eastern and Walbrook closed in 2005. Southwestern High School remained open but was scheduled to close in 2007.
2 For the purposes of this study, Digital Harbor High School was categorized as a neighborhood high school. Like neighborhood high schools, Digital Harbor was not created by an outside model developer or technical assistance provider and the school developers were required to submit and receive approval for a school plan outlining their mission and procedures. Although Digital Harbor students were more academically advantaged than students in other neighborhood schools (see Exhibit C-9, Appendix C), excluding Digital Harbor from the analyses did not alter the findings. In 2005–06, only 12 percent of the neighborhood school sample was Digital Harbor students.

The Urban Institute / Education Policy Center SCHOOLS, STUDENTS, AND OUTCOMES 2007
10
Year 5: 2006–07 There were no new innovation or neighborhood schools in year five. The creation of innovation and neighborhood schools unfolded slower than expected and resulted in the breakdown of four of the nine comprehensive schools and the creation of six innovation schools rather than the eight planned. School Sample For research questions 1a and 2, we analyzed administrative data from students in all BCPSS high schools that existed in 2005–06 (i.e., six innovation, 13 neighborhood, five comprehensive, eight selective, and three “other” high schools), unless otherwise noted, as well as the two comprehensive schools that closed in 2005, Walbrook and Lake Clifton-Eastern. Northern and Southern High Schools are the only BCPSS high schools not included in our analyses because they closed prior to 2002. For question 1b, we examined the nine neighborhood schools that were created over the course of the evaluation and the three comprehensive high schools from which they were formed. For research question 3, we limited our sample to the 23 schools for which we had survey data in 2005–06. These schools include the six innovation, 12 neighborhood (Digital Harbor was not included in this analysis), and five comprehensive high schools. DATA AND MEASURES Two data sources were used in this report. BCPSS’ DREAA provided individual, student-level administrative records for students enrolled in all BCPSS high schools from 2002 to 2006. The student-level data include information on high school enrollment, such as the identification number of every high school each student attended at each grade level and in every year. The data also include information such as race/ethnicity, age, gender, Limited English Proficiency (LEP)3 and special education status, free and reduced price lunch (FRPL) enrollment,4 previous achievement (i.e., TerraNova in reading and mathematics taken in middle school), High School Assessment (HSA) test scores in English and Algebra, and high school attendance.5 We examined student characteristics and outcomes for three cohorts of students to determine if findings remained consistent over time (see Exhibit 2). Cohort 1 begins with 9th graders in 2003 and follows them through the end of the 11th grade in 2006. Cohort 2 begins with 9th graders in 2004 and follows them through the end of 10th grade in 2006. Finally, Cohort 3 consists of 9th graders in 2005. As illustrated in Exhibit 2, we examined three cohorts of 9th graders, two cohorts of 10th graders, and one cohort of 11th graders.
3 Because so few BCPSS students were identified as LEP (fewer than 10 high school students in 2005-06), LEP was not included in the analyses. 4 Special Education and Free and Reduced Price Lunch Status are determined by assignment and/or enrollment and may vary by year and school. 5 We created an attendance rate for each student by summing the total number of days they attended any school in a given year and dividing it by 180, the total number of days in the school year. This attendance rate was then assigned to the school the student attended the most days in a given year; we were unable to determine how many days students were absent from each school they attended in a given year with the data DREAA provided us. The attendance rates that we report do not match the attendance rates that the state reports because the state report cards calculate attendance rates for each school differently [days of attendance/(days of attendance + days of absence)].

The Urban Institute / Education Policy Center SCHOOLS, STUDENTS, AND OUTCOMES 2007
11
Exhibit 2. Cohort map of study sample Academic Year 2002-03 2003-04 2004-05 2005-06
Cohort 1 9th Grade 10th Grade 11th Grade
Cohort 2 9th Grade 10th Grade
Cohort 3 9th Grade
The second data source came from climate surveys created and administered by the Urban Institute. We used survey responses from the fourth year of the reform effort (2005-06) and created two implementation measures: (1) support for students, which is a combination of student-reported feelings of school safety and personalization (correlation=.78), and (2) teaching and learning environment, which is a combination of teacher-reported perceptions of teacher collaboration, teacher accountability for student outcomes, and administrative leadership (alpha=.67). These measures were aggregated to the school level. (See Appendix B for details on all of the variables used in this study.) METHODS We used a combination of descriptive and inferential statistical methods to answer the three research questions. Here we describe those methods, organized by research question. Research Question 1: (a) Are students enrolled in innovation high schools more socially and academically advantaged than students enrolled in other BCPSS high schools (i.e., neighborhood, comprehensive, selective and “other”/alternative)? We started with initial 9th grade enrollment for each of the three cohorts of 9th graders, examining students’ prior achievement, gender, race/ethnicity,6 FRPL status, special education status, and whether they were overage for their grade (often used as a proxy for grade retention). Testing differences by school type (using t-tests), we determined if student characteristics at the beginning of the 9th grade varied significantly among innovation and neighborhood, comprehensive, selective, and “other” high schools. We used data for all of the BCPSS high schools and students in each of the three cohorts. Next, we conducted a logistic regression to examine the probability of attending an innovation high school for students with different social and academic characteristics. In this model, the dependent variable was coded 1 to indicate 9th grade enrollment in an innovation school and 0 to indicate enrollment in the non-innovation schools. The independent variables were gender, FRPL status, special education status, TerraNova reading scores,7 and a measure indicating if the student was overage for his or her grade level. We created separate regression models for 9th graders in each of the three cohorts and excluded selective and “other” high schools because these schools enroll a unique student population and are inappropriate to combine with neighborhood and comprehensive schools as comparisons for innovation schools.
6 We dropped race/ethnicity from our subsequent analyses because there is not enough variation in the BCPSS high school population to support comparative analyses; in 2005–06, 9 out of 10 students were African-American and the remaining students were a combination of white, Latino, Asian, and American Indian. 7 When modeling algebra, we used TerraNova mathematics scores as our measure of previous achievement. Otherwise, we used TerraNova reading as our previous achievement measure.
The Urban Institute / Education Policy Center SCHOOLS, STUDENTS, AND OUTCOMES 2007
12
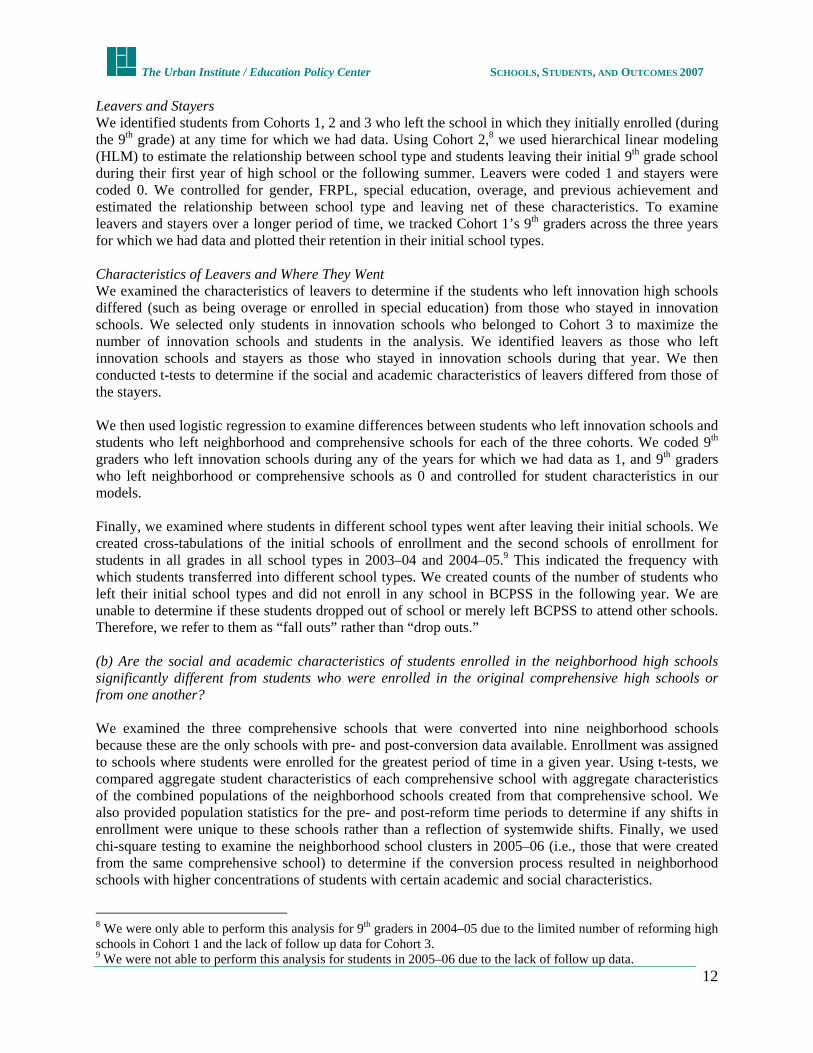
Leavers and Stayers We identified students from Cohorts 1, 2 and 3 who left the school in which they initially enrolled (during the 9th grade) at any time for which we had data. Using Cohort 2,8 we used hierarchical linear modeling (HLM) to estimate the relationship between school type and students leaving their initial 9th grade school during their first year of high school or the following summer. Leavers were coded 1 and stayers were coded 0. We controlled for gender, FRPL, special education, overage, and previous achievement and estimated the relationship between school type and leaving net of these characteristics. To examine leavers and stayers over a longer period of time, we tracked Cohort 1’s 9th graders across the three years for which we had data and plotted their retention in their initial school types. Characteristics of Leavers and Where They Went We examined the characteristics of leavers to determine if the students who left innovation high schools differed (such as being overage or enrolled in special education) from those who stayed in innovation schools. We selected only students in innovation schools who belonged to Cohort 3 to maximize the number of innovation schools and students in the analysis. We identified leavers as those who left innovation schools and stayers as those who stayed in innovation schools during that year. We then conducted t-tests to determine if the social and academic characteristics of leavers differed from those of the stayers. We then used logistic regression to examine differences between students who left innovation schools and students who left neighborhood and comprehensive schools for each of the three cohorts. We coded 9th graders who left innovation schools during any of the years for which we had data as 1, and 9th graders who left neighborhood or comprehensive schools as 0 and controlled for student characteristics in our models. Finally, we examined where students in different school types went after leaving their initial schools. We created cross-tabulations of the initial schools of enrollment and the second schools of enrollment for students in all grades in all school types in 2003–04 and 2004–05.9 This indicated the frequency with which students transferred into different school types. We created counts of the number of students who left their initial school types and did not enroll in any school in BCPSS in the following year. We are unable to determine if these students dropped out of school or merely left BCPSS to attend other schools. Therefore, we refer to them as “fall outs” rather than “drop outs.” (b) Are the social and academic characteristics of students enrolled in the neighborhood high schools significantly different from students who were enrolled in the original comprehensive high schools or from one another? We examined the three comprehensive schools that were converted into nine neighborhood schools because these are the only schools with pre- and post-conversion data available. Enrollment was assigned to schools where students were enrolled for the greatest period of time in a given year. Using t-tests, we compared aggregate student characteristics of each comprehensive school with aggregate characteristics of the combined populations of the neighborhood schools created from that comprehensive school. We also provided population statistics for the pre- and post-reform time periods to determine if any shifts in enrollment were unique to these schools rather than a reflection of systemwide shifts. Finally, we used chi-square testing to examine the neighborhood school clusters in 2005–06 (i.e., those that were created from the same comprehensive school) to determine if the conversion process resulted in neighborhood schools with higher concentrations of students with certain academic and social characteristics.
8 We were only able to perform this analysis for 9th graders in 2004–05 due to the limited number of reforming high schools in Cohort 1 and the lack of follow up data for Cohort 3. 9 We were not able to perform this analysis for students in 2005–06 due to the lack of follow up data.

The Urban Institute / Education Policy Center SCHOOLS, STUDENTS, AND OUTCOMES 2007
13
Research Question 2: Do students in innovation high schools perform better (i.e., test scores, attendance) than students in other BCPSS high schools (i.e., neighborhood, comprehensive, selective and “other”/alternative)? Are these differences due to the characteristics of the students enrolled in these new high schools? We used HLM to determine if school type was related to students’ academic outcomes (i.e., attendance and HSA English and Algebra scores), after controlling for student characteristics. The independent variables at level one of the equation included students’ TerraNova mathematics or reading scores, gender, FRPL, overage, and special education. At level 2, we included variables indicating the type of school students attended, neighborhood, comprehensive, selective, or “other.” The comparison group was innovation high schools. We used data from 2005-06 for all BCPSS students that took HSA tests or had information on attendance rates. The school sample is small (n=35), so we used a more liberal interpretation of the significance tests (i.e., p< .10 level). Research Question 3: Do reforming high schools (i.e., innovation, neighborhood, and comprehensive) differ from one another on their implementation of the guiding principles (e.g., support, effective instruction and leadership)? Are any differences related to the characteristics of the students they enroll? Do the levels of implementation relate to student outcomes? We created two implementation measures from the Urban Institute’s climate surveys: (1) support for students, and (2) teaching and learning environment. We modeled these as outcomes using two-step multiple regression. Step one included school type as the only predictor and step two added student characteristics to determine if the relationships between school type and the implementation measures were influenced by student characteristics. We were exploring whether innovation high schools had more supportive environments because they enrolled students who were more academically advantaged. In the first set of regression analyses, we used innovation schools as the comparison group to estimate differences between these schools and neighborhood and comprehensive high schools. In a second set of regression analyses (provided in Appendix C), we used neighborhood schools as the comparison group. The school sample (n=23) is too small for multi-level analyses, so we used multiple regression. Multiple regression does not take into account the nested nature of the data (students nested within schools) and therefore overestimates the standard errors, reducing the likelihood of detecting significant school effects. Therefore, the estimates from these analyses should be considered conservative. Because our sample size in the multiple regression models is large (n=8,346 students),10 we used the standard interpretation of significance tests (i.e., p < .05). Finally, we used multiple regression to model the three academic outcomes (i.e., HSA English and Algebra scores and attendance rates), using the implementation measures as predictors. Because the implementation measures are highly correlated (.38), we did not include them in the same regression models. The regression models estimate the independent relationship between implementation and academic outcomes, net of student characteristics. FINDINGS In this section, we summarize key results by research question. Information detailing the statistical models can be found in Appendix C. In many of our analyses, we controlled for student characteristics (e.g., previous achievement) to estimate the relationship between school type and student outcomes. However, there are a number of important factors that we are unable to include in our models, such as
10 This number represents 65 percent of the population of BCPSS students included in the study sample who attended innovation, neighborhood, and comprehensive schools in 2005-06.

The Urban Institute / Education Policy Center SCHOOLS, STUDENTS, AND OUTCOMES 2007
14
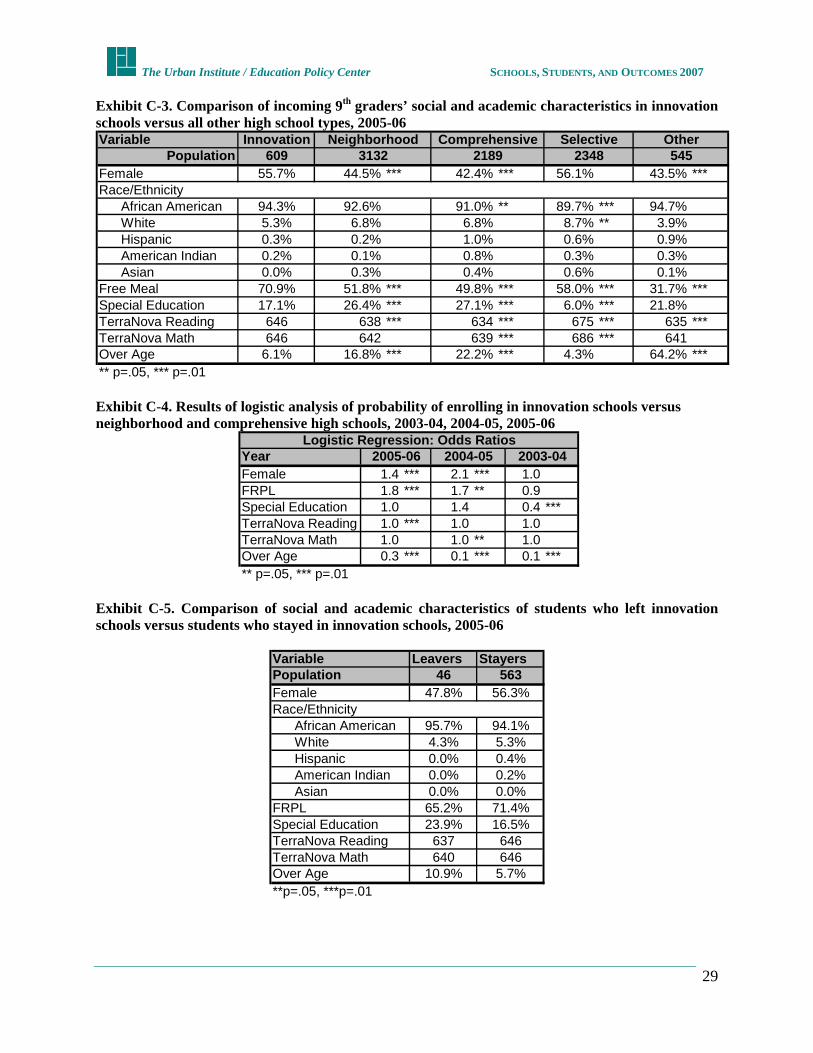
student motivation, parent involvement and access to information, and teacher quality and these omissions should be considered when interpreting the findings. Research Question 1: a) Are students enrolled in innovation high schools more socially and academically advantaged than students enrolled in other BCPSS high schools (i.e., neighborhood, comprehensive, selective and “other”/alternative)? Students in innovation high schools were more academically advantaged than students enrolled in any of the other school types, with the exception of selective high schools (see Exhibit 3). Specifically, the incoming 9th graders in innovation high schools had higher middle school reading scores (and in some cases higher mathematics scores) and were less likely to be overage for their grade (and possibly held back) or be designated as special education students than their peers in comprehensive, neighborhood, and “other” high schools.11 These findings were consistent across all three cohorts. (See Exhibits C-1 through C-3, Appendix C for details.) Additionally, more female students enrolled in innovation high schools than in the non-selective high schools in the city, and more students receiving FRPL enrolled in innovation high schools than all of the other high schools in the city. Finally, more African-American students enrolled in innovation schools than comprehensive and selective high schools. Exhibit 3. Comparison of incoming 9th graders’ social and academic characteristics in innovation schools and all other high school types, 2005-06
School Type Innovation Neighborhood Comprehensive Selective OtherStudent N = 609 3132 2189 2348 545
Female 55.7% - - + -
African American 94.3% - - - +White 5.3% + + + -Hispanic 0.3% - + + +American Indian 0.2% - + + +Asian 0.0% + + + +
FRPL 70.9% - - - -Special Education 17.1% + + - +TerraNova Reading 646 - - + -TerraNova Math 646 - - + -Over Age 6.1% + + - +
Race/Ethnicity
+ Significantly more than innovative schools- Significantly less then innovative schools
+/- No significant difference Not surprisingly, the logistic regression modeling the likelihood of enrollment in innovation high schools showed similar results. In 2005–06, students in the FRPL program were nearly twice as likely as their counterparts to enroll in innovation high schools. By contrast, students who were overage for their grade were one-third as likely as their counterparts to enroll in an innovation school. Differences for special education students were not significant after controlling for other student characteristics. (Exhibit C-4, 11 It is possible students who were designated as special education in 8th grade were differentially re-classified when they entered different types of high schools, possibly leading to a relatively low special education populations in innovation schools However, there is no reason to expect this to be the case and we do not have data to examine it directly.
Students in innovation high schools were, on average, more academically advantaged than students enrolled in other school types, with the exception of selective high schools.

The Urban Institute / Education Policy Center SCHOOLS, STUDENTS, AND OUTCOMES 2007
15
Appendix C provides the results of these analyses for each cohort of 9th graders). Leavers and Stayers After controlling for student characteristics, students in innovation and neighborhood schools were less likely to leave and more likely to stay at their initial school of enrollment than students in comprehensive and “other” high schools (see Exhibit 4). In fact, students in neighborhood schools were more than twice as likely as innovation high school students to leave their initial school types. Similarly, students in comprehensive and “other” high schools were three and five times as likely as innovation high school students to leave their school types. In addition, the small percentage of students who left innovation high schools (8 percent in 2005-06), were slightly less academically advantaged (e.g., overage, lower reading scores) than the students who stayed. However, the differences were not statistically significant. (See Exhibit C-5, Appendix C.) Exhibit 4. Results of HLM model examining likelihood 9th graders left innovation high schools during 9th grade or the following summer, compared with neighborhood, comprehensive, selective, and “other” high schools, 2004-0512
VariableSchool Type
Neighborhood 2.3 *Comprehensive 3.1 **Selective 1.4Other 5.0 **** p=.10, ** p=.05, ** p=.01
Odds of Leaving Compared to Average Innovation School Student
Exhibit 5 tracks Cohort 1 over three years. The exhibit shows the percentage of students who remained in their initial high school type, during and between grades, broken out by school type. (Exhibit 6 provides the number and percent of students who remained in their initial high school type at the end of 11th grade by school type.) These findings indicate that innovation and neighborhood high schools had relatively high retention among their incoming 9th grade classes. Nearly two-thirds of 9th graders who enrolled in innovation high schools at the beginning of their high school careers stayed in innovation high schools at least through the 11th grade. Similarly, more than 60 percent of 9th graders who enrolled in neighborhood schools remained in neighborhood schools by the end of 11th grade. By contrast, less than half of their peers stayed in comprehensive high schools and less than one-third stayed in “other” high schools. The exhibit also indicates that leaving, across all school types, was highest during grade transitions, peaking between 9th and 10th grade.
12 This analysis controlled for the following student characteristics: gender, FRPL, special education, previous reading achievement, and overage. Details can be found in Exhibit C-6, Appendix C. This analysis could not be replicated for the other cohorts due to the small number of schools in the previous year and the lack of student fall-out data in the subsequent year.
Students in innovation and neighborhood schools were more likely to stay at their initial school of enrollment than students in comprehensive and “other” high schools.

The Urban Institute / Education Policy Center SCHOOLS, STUDENTS, AND OUTCOMES 2007
16
Exhibit 5. Percent of 9th grade students who remained in their initial high school type over time and by school type, 2003-04 through 2005-06
0%
10%
20%
30%
40%
50%
60%
70%
80%
90%
100%
Start of9th Grade
9th Grade Between9th and
10th
10thGrade
Between10th and
11th
11thGrade
Rem
aini
ng S
tude
nts Selective
Innovation
Neighborhood
Comprehensive
Other
Exhibit 6. Number and percent of students who remained in their initial high school type at the end of 11th grade by school type, 2003–04 through 2005–06
School Type Innovation Neighborhood Comprehensive Selective OtherFreshman Class Size 166 1617 3372 2243 794N Stayers 106 991 1593 1633 206% Stayers 63.9% 61.3% 47.2% 72.8% 25.9%
Characteristics of Leavers and Where They Went We compared the characteristics of leavers from innovation high schools with leavers from all other school types for each cohort and tracked where leavers went. While there were fewer leavers in innovation high schools, we wanted to determine if those who left were more behaviorally or academically challenging than those leaving other high schools in the city. Our analyses suggest that students who left innovation schools were no different from students who left neighborhood, comprehensive, selective, or “other” high schools. (See Exhibit C-7, Appendix C.) In addition, we examined where students went after leaving their initial school, following students in all grade levels who left each of the five school types. Exhibit 7 depicts the total number of students in every grade who left each school type during the 2004–05 school year and the percentages of these students that either transferred to other school types or fell out of BCPSS entirely.13
13 Results for the 2003-04 school year can be found in Exhibit C-8, Appendix C. It is not possible to produce fall out information for the 2005-06 school year because we do not have enrollment data for the 2006-07 school year.
The Urban Institute / Education Policy Center SCHOOLS, STUDENTS, AND OUTCOMES 2007
17
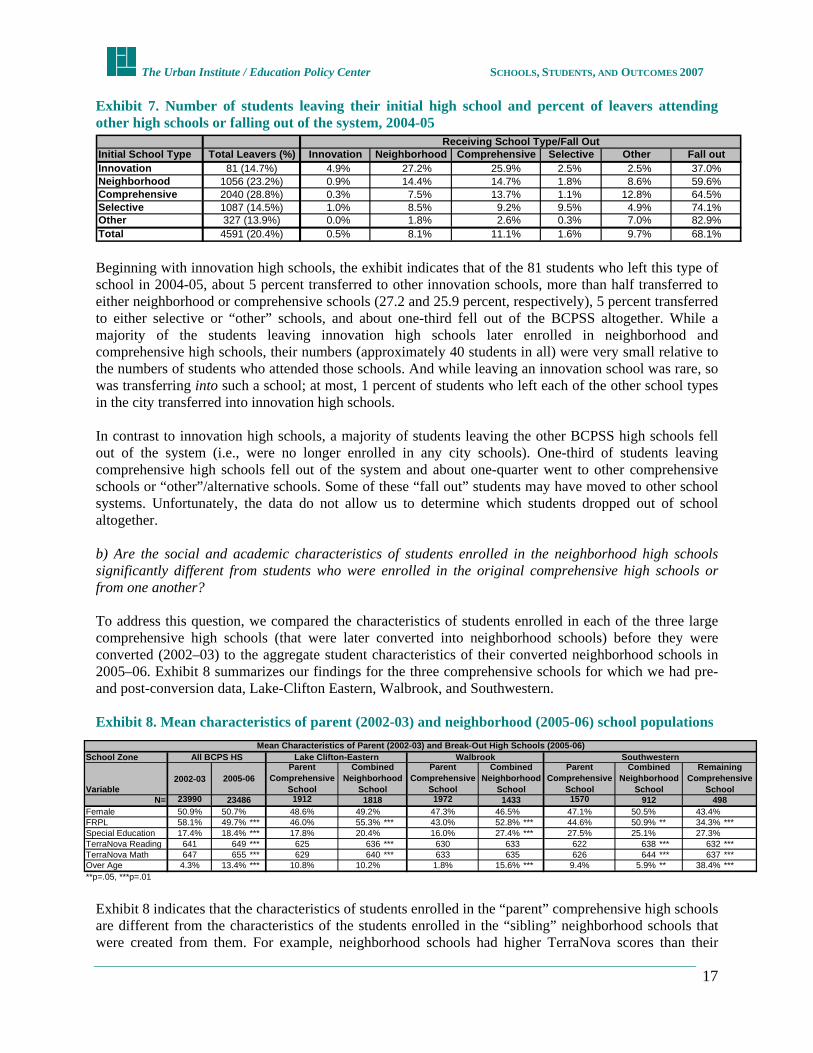
Exhibit 7. Number of students leaving their initial high school and percent of leavers attending other high schools or falling out of the system, 2004-05
Initial School Type Total Leavers (%) Innovation Neighborhood Comprehensive Selective Other Fall outInnovation 81 (14.7%) 4.9% 27.2% 25.9% 2.5% 2.5% 37.0%Neighborhood 1056 (23.2%) 0.9% 14.4% 14.7% 1.8% 8.6% 59.6%Comprehensive 2040 (28.8%) 0.3% 7.5% 13.7% 1.1% 12.8% 64.5%Selective 1087 (14.5%) 1.0% 8.5% 9.2% 9.5% 4.9% 74.1%Other 327 (13.9%) 0.0% 1.8% 2.6% 0.3% 7.0% 82.9%Total 4591 (20.4%) 0.5% 8.1% 11.1% 1.6% 9.7% 68.1%
Receiving School Type/Fall Out
Beginning with innovation high schools, the exhibit indicates that of the 81 students who left this type of school in 2004-05, about 5 percent transferred to other innovation schools, more than half transferred to either neighborhood or comprehensive schools (27.2 and 25.9 percent, respectively), 5 percent transferred to either selective or “other” schools, and about one-third fell out of the BCPSS altogether. While a majority of the students leaving innovation high schools later enrolled in neighborhood and comprehensive high schools, their numbers (approximately 40 students in all) were very small relative to the numbers of students who attended those schools. And while leaving an innovation school was rare, so was transferring into such a school; at most, 1 percent of students who left each of the other school types in the city transferred into innovation high schools. In contrast to innovation high schools, a majority of students leaving the other BCPSS high schools fell out of the system (i.e., were no longer enrolled in any city schools). One-third of students leaving comprehensive high schools fell out of the system and about one-quarter went to other comprehensive schools or “other”/alternative schools. Some of these “fall out” students may have moved to other school systems. Unfortunately, the data do not allow us to determine which students dropped out of school altogether. b) Are the social and academic characteristics of students enrolled in the neighborhood high schools significantly different from students who were enrolled in the original comprehensive high schools or from one another? To address this question, we compared the characteristics of students enrolled in each of the three large comprehensive high schools (that were later converted into neighborhood schools) before they were converted (2002–03) to the aggregate student characteristics of their converted neighborhood schools in 2005–06. Exhibit 8 summarizes our findings for the three comprehensive schools for which we had pre- and post-conversion data, Lake-Clifton Eastern, Walbrook, and Southwestern. Exhibit 8. Mean characteristics of parent (2002-03) and neighborhood (2005-06) school populations
Exhibit 8 indicates that the characteristics of students enrolled in the “parent” comprehensive high schools are different from the characteristics of the students enrolled in the “sibling” neighborhood schools that were created from them. For example, neighborhood schools had higher TerraNova scores than their
School Zone
Variable2002-03
Parent Comprehensive
School
Parent Comprehensive
School
Parent Comprehensive
SchoolN= 23990 1912 1972 1570
Female 50.9% 50.7% 48.6% 49.2% 47.3% 46.5% 47.1% 50.5% 43.4%FRPL 58.1% 49.7% *** 46.0% 55.3% *** 43.0% 52.8% *** 44.6% 50.9% ** 34.3% ***Special Education 17.4% 18.4% *** 17.8% 20.4% 16.0% 27.4% *** 27.5% 25.1% 27.3%TerraNova Reading 641 649 *** 625 636 *** 630 633 622 638 *** 632 ***TerraNova Math 647 655 *** 629 640 *** 633 635 626 644 *** 637 ***Over Age 4.3% 13.4% *** 10.8% 10.2% 1.8% 15.6% *** 9.4% 5.9% ** 38.4% *****p=.05, ***p=.01
Mean Characteristics of Parent (2002-03) and Break-Out High Schools (2005-06)
23486
All BCPS HS
2005-06
Lake Clifton-Eastern Walbrook SouthwesternCombined
Neighborhood School
Combined Neighborhood
School
Combined Neighborhood
School
Remaining Comprehensive
School1818 1433 912 498

The Urban Institute / Education Policy Center SCHOOLS, STUDENTS, AND OUTCOMES 2007
18
original comprehensive schools. However, the population data indicate that these scores increased across the system during this time period and are not unique to neighborhood schools. Interestingly, all of the neighborhood schools had higher FRPL enrollments than their parent comprehensive schools. Across the system, however, the percentage of students receiving this benefit decreased from 2002-03 to 2005-06. While it is possible that neighborhood and innovation high schools enrolled the lowest income students, it is also possible that these schools were more successful enrolling students in the FRPL program than other school types. We found significant differences when we compared student characteristics at each of the sibling neighborhood schools that were created from the same parent comprehensive high school. Some neighborhood high schools had higher concentrations of academically challenging students than others. For example, among the neighborhood schools created from Lake Clifton-Eastern, Doris M Johnson had only half as many overage students as and at least 10 percent more FRPL students than Thurgood Marshall and Heritage High (see Exhibit 9). Exhibit 9. Mean student characteristics of total neighborhood school population and individual neighborhood schools, Lake Clifton-Eastern 2005-06
School TypeCombined
Neighborhood Population
Variable AllThurgood Marshall Heritage High Doris M Johnson
Population 1818 694 735 389Female 49.2% 47.3% 48.6% 53.7%FRPL*** 55.3% 51.2% 54.3% 64.5%Special Education 20.4% 18.3% 20.5% 23.9%Reading TerraNova 636 638 632 641Math TerraNova 640 642 636 644Over Age** 10.2% 11.0% 11.4% 6.7%Academic OutcomesAttendance Rate*** 68.0% 66.9% 63.4% 78.6%English HSA 371 371 375 366Algebra HSA 376 369 379 381**p=.05, ***p=.01
Neighborhood Schools
An interesting finding on the Southwestern campus is the characteristics of the students in the remaining comprehensive school. More than one-third of these students were overage compared to about 8 and 4 percent in the respective neighborhood schools (see Exhibit 10). This aligns with the implementation plan for the school; the larger campus was designated as a phase out school for students with academic challenges.
Students with academic challenges were more concentrated in some neighborhood high schools than others.

The Urban Institute / Education Policy Center SCHOOLS, STUDENTS, AND OUTCOMES 2007
19
Exhibit 10. Mean student characteristics of total neighborhood school population and individual neighborhood schools, Southwestern 2005-06
School TypeCombined
Neighborhood Population
Remaining Comprehensive
Variable AllMedical
ArtsArts Industry
Academy SouthwesternPopulation 912 470 442 498Female*** 50.5% 54.5% 46.4% 43.4%FRPL*** 50.9% 48.5% 53.4% 34.3%Special Education 25.1% 22.6% 27.8% 27.3%Reading TerraNova*** 638 641 635 632Math TerraNova*** 644 646 642 637Over Age*** 5.9% 7.9% 3.8% 38.4%Academic OutcomesAttendance Rate*** 64.3% 65.1% 63.4% 49.6%English HSA 371 375 368 333Algebra HSA 374 375 372 350**p=.05, ***p=.01
Neighborhood Schools
When we examined Walbrook High School and the schools created from it (see Exhibit 11), we discovered that one of the neighborhood schools, Liberal Arts, enrolled a higher concentration of academically challenging students (i.e., special education, overage, low middle school test scores) than the other schools. Liberal Arts Academy was designed as a school for students who are overage and struggling in school. Surprisingly, however, Liberal Arts did not have lower HSA test scores compared to Walbrook’s other neighborhood schools. Exhibit 11. Mean student characteristics of total neighborhood school population and individual neighborhood schools, Walbrook 2005-06
School TypeCombined
Neighborhood Population
Variable AllMaritime Academy
Homeland Security
Business and Entrepreneurship
Liberal Arts
Population 1433 254 387 371 421Female 46.5% 49.6% 48.6% 47.7% 41.8%FRPL*** 52.8% 57.5% 58.7% 58.0% 40.1%Special Education*** 27.4% 18.1% 29.2% 25.1% 33.5%Reading TerraNova*** 633 640 633 637 624Math TerraNova 635 640 638 640 625Over Age*** 15.6% 15.7% 7.5% 7.0% 30.4%Academic OutcomesAttendance Rate*** 62.4% 66.2% 73.3% 74.0% 39.8%English HSA 362 362 365 367 358Algebra HSA 356 365 351 359 347**p=.05, ***p=.01
Neighborhood Schools
(See Exhibit C-9, Appendix C for comparisons of the mean characteristics of the total neighborhood school population and the characteristics of students at each neighborhood school in 2005-06.)

The Urban Institute / Education Policy Center SCHOOLS, STUDENTS, AND OUTCOMES 2007
20
Research Question 2: Do students in innovation high schools perform better (i.e., test scores, attendance) than students in other BCPSS high schools (i.e., neighborhood, comprehensive, selective and “other”/alternative)? Are these differences due to the characteristics of the students enrolled in these new high schools? HSA Algebra and English test scores and attendance rates were higher in innovation high schools than in neighborhood, comprehensive and “other” schools, even after controlling for the characteristics of students who attended these schools (see Exhibit 12 and Exhibit C-10, Appendix C). Exhibit 12. Comparison of HSA Algebra14 and English15 scores16 in innovation high schools and other high school types, 2005-0617
-18 points***
-14 points**
+2 points
-25 points***
-15 points*** -14 points**
-1 point
-30 points**
HSAAlgebra
HSAEnglish
Innovation High Schools
NeighborhoodComprehensive
Selective
"Other"
14 The algebra scores represent 37.0 percent of students in innovation high schools, 24.5 percent of students in neighborhood high schools, 22.3 percent of students in comprehensive high schools, 23.4 percent of students in selective high schools and 15.0 percent of students in “other” high schools. The scores also represent 52.1 percent of 9th graders, 2.0 percent of 10th graders, 1.5 percent of 11th graders and 5.2 percent of 12th graders in BCPSS. Overall, roughly 25 percent of the BCPSS high school population in 2005-06 is represented, a reasonable percentage given that this is a grade-specific test (9th grade). 15 The English scores represent 29.5 percent of students in innovation high schools, 18.3 percent of students in neighborhood high schools, 13.0 percent of students in comprehensive high schools, 23.5 percent of students in selective high schools, and 10.7 percent of students in “other” high schools. The scores also represent 4.5 percent of 9th graders, 62.7 percent of 10th graders, 1.5 percent of 11th graders, and 6.3 percent of 12th graders. Overall, roughly 20 percent of the BCPSS high school population in 2005–06 is represented, a reasonable percentage given that this is a grade-specific test (10th grade). 16 Attendance results can be found in Exhibit C-10 in Appendix C. 17 This analysis controlled for student characteristics including gender, FRPL, special education, previous achievement, and overage status. Details can be found in Exhibit C-10, Appendix C.

The Urban Institute / Education Policy Center SCHOOLS, STUDENTS, AND OUTCOMES 2007
21
Innovation high schools reportedly provided more supports for students and more positive teaching and learning environments than both neighborhood and comprehensive schools, even after controlling for student characteristics (e.g., previous achievement, gender).
On average, students in innovation schools scored between 14 and 30 points higher on HSA tests (on a scale from 240 to 650 where passing scores are 396 for English and 412 for Algebra) and attended school between 9 and 22 percent more days (16 and 40 days, respectively) than students in comprehensive, neighborhood, and “other” high schools. There were no differences between innovation and selective high schools in terms of test scores, although attendance was a little better in selective schools. Thus, while it is the case that innovation high schools enrolled students who were somewhat more academically advantaged than other non-selective schools, innovation high schools exhibited higher test scores and better attendance rates even after controlling for these initial differences. While we do control for certain student characteristics, we are not able to control for important unobserved differences such as student motivation or parent involvement. Research Question 3: Do reforming high schools (i.e., innovation, neighborhood, and comprehensive) differ from one another on their implementation of the guiding principles (e.g., support, effective instruction and leadership)? Are any differences related to the characteristics of the students they enroll? Do the levels of implementation relate to student outcomes? Students and teachers in both neighborhood and comprehensive high schools reported fewer supports for students and less positive teaching and learning environments than their peers in innovation schools (see Exhibit 13). This finding holds even after controlling for the social and academic characteristics of students enrolled in these schools. Students in the free and reduced price lunch program attended schools where students reported higher perceptions of support than students who were not in the program, and overage students attended schools where students reported lower perceptions of support than their peers. Finally, overage students attended high schools with reportedly more positive teaching and learning environments than their peers. Similar analyses using neighborhood schools as the comparison indicate that neighborhood schools had reportedly lower support than both innovation and comprehensive schools. However, neighborhood schools reportedly had more positive teaching and learning environments than comprehensive schools. (See Exhibit C-11, Appendix C.)
Student outcomes (HSA Algebra and English test scores and attendance rates) were higher in innovation high schools than in neighborhood, comprehensive and “other” schools, even after controlling for the types of students who attended these schools (e.g., special education students, students enrolled in free and reduced price lunch, middle school test scores).

The Urban Institute / Education Policy Center SCHOOLS, STUDENTS, AND OUTCOMES 2007
22
Students performed better in schools where students and teachers reported more positive social and academic environments, even after controlling for student characteristics.
Exhibit 13. Regression results estimating relationships between school type, student characteristics and implementation measures, 2005-06
VariableSchool Type
Neighborhood -1.00 *** -1.02 *** -1.15 *** -1.13 ***Comprehensive -0.98 *** -1.00 *** -1.44 *** -1.42 ***
Student CharacteristicsFemale -- 0.01 -- 0.00FRPL -- 0.03 *** -- -0.03 **Special Education -- 0.00 -- 0.00TerraNova Reading -- 0.00 -- 0.00Over Age -- -0.02 ** -- 0.21 ***** p=.05, ***p=.01
Support for Students Teaching and Learning Step 1 Step 2 Step 1 Step 2
Next, we examined the relationship between the implementation measures and student outcomes. Students in schools with higher levels of support also exhibited significantly higher HSA English and Algebra scores and attendance rates (see Exhibit 14). Additionally, students in schools where teachers reported more positive teaching and learning environments also had significantly higher HSA Algebra scores. Exhibit 14. Relationship between implementation measures and high school achievement, controlling for student characteristics, 2005-0618
+9 points***
+.2 points
+8 points***
+4 points***
HSAAlgebra
HSAEnglish
Average Score
Student Support
Teaching and Learning Environment
18 This analysis controlled gender, FRPL, special education, previous achievement, and overage status. Attendance results and details can be found in Exhibit C-12, Appendix C.

The Urban Institute / Education Policy Center SCHOOLS, STUDENTS, AND OUTCOMES 2007
23
CONCLUSIONS The Urban Institute’s previous evaluation reports have suggested that while the reform initiative was never fully implemented, there have been some promising signs across the system and within the reforming high schools. For example, a majority of the city’s high schools has shown some improvement in English and Algebra scores, attendance, and graduation rates since 2002-03, though these outcomes remain low overall (e.g., approximately 75 percent of students in reforming high schools did not pass the HSA English test in 2005-06). Similarly, most reforming high schools (i.e., innovation and neighborhood schools) have improved their social and academic environments, with students and staff reporting more safety, personalization, and administrative leadership over time. Relatively speaking, the reforming high schools, particularly innovation high schools, were serving their students reasonably well. The results presented in this report provide more rigorous findings to support these earlier conclusions. Additionally, the findings presented in this report indicate that innovation high schools had more positive academic environments and higher test scores and attendance than neighborhood, comprehensive, and “other” high schools, even after controlling for student characteristics such as previous achievement. Unlike other schools in the city, innovation high schools had advantages that include autonomy in hiring staff and selecting and implementing curricula and a student body that chose to be there. While we are not able to estimate the effects of these advantages directly, it is likely that they had a beneficial effect. The results presented in this report also confirm some of the concerns raised about equal opportunity and equity. Innovation high schools enrolled more academically successful students than other non-selective high schools in the city and successfully retained those students at higher rates than other school types over the initial years of high school. Additionally, some neighborhood high schools had higher concentrations of academically challenging students than other neighborhood high schools (e.g., a greater percentage of overage students in one school than another), providing further evidence of possible stratification. Questions about equal opportunity and equity in education are critical for stakeholders and reformers in Baltimore and across the country. However, these concerns should be put into context when examining the Baltimore high school reform initiative. The students attending innovation high schools in Baltimore are not wealthy, white students who are sailing through Algebra in the 8th grade. They are, by and large, high-poverty, African-American students who score much lower on middle school reading and mathematics tests than students attending the city’s selective high schools. BCPSS has found a way to improve educational opportunities and outcomes for some fraction of this population. The next step is to learn from this experience and to expand opportunities for more students.

The Urban Institute / Education Policy Center SCHOOLS, STUDENTS, AND OUTCOMES 2007
24
APPENDIX A School Types, Numbers and Names Innovation
New Era Academy-422 Baltimore Freedom Academy-423 Academy for College and Career Exploration High School-427 Baltimore Talent Development High School-428 Coppin Academy-432 Renaissance Academy-433
Neighborhood
Digital Harbor High School-416 W.E.B. Dubois High School-418 Reginald F. Lewis School for Business & Law-419 Dr. Samuel L. Banks High School-420 Thurgood Marshall High School-424 Heritage High School-425 Doris M Johnson High School-426 Vivien T. Thomas Medical Arts Academy-429 Augusta Fells Savage Institute for Visual Arts-430 Maritime Academy-431 Homeland Security High School-434 Business and Entrepreneurship Academy -435 Liberal Arts Academy-436
Comprehensive
Lake Clifton Eastern-40 Northwestern High School-401 Patterson High School-405 Forest Park Senior High-406 Walbrook High School-411 Southwestern High-412 Frederick Douglass High School-450
Selective
Edmondson Westside High School-400 Baltimore Polytechnic Institute-403 Western High School-407 Mergenthaler Vocational Technical High-410 The New Paul L Dunbar High School-414 The National Academy Foundation HS-421 Carver Vocational Technical High-454 Baltimore City College High School-480
Other
Harbor City High School-413 Central Career Academy At Briscoe-451 Laurence G. Paquin Middle/High-457

The Urban Institute / Education Policy Center SCHOOLS, STUDENTS, AND OUTCOMES 2007
25
APPENDIX B Data Variable Definitions Student ID – Individual student level identifier created by DREAA School Number (Year) – The district assigned number of the school the student attended the most days in that given school year. Initial Freshman School Number (Year) – The district assigned number of the first school the student attended in the 9th grade if that student was in the 9th grade in that given school year. Second Freshman School Number (Year) – The district assigned number of the second school the student attended in the 9th grade if that student was in the 9th grade in that given school year and attended more than one school. Initial School Number (Year) – The district assigned number of the first school the student attended that given year, regardless of grade. Second School Number (Year) - The district assigned number of the second school the student attended that given year, regardless of grade, if the student attended more than one school. School Type (Year) 19– The type of school the student attended the most days in that given school year, assigned by school number. Initial Freshman School Type (Year) – The type of the first school the student attended in the 9th grade if that student was in the 9th grade in that given school year, assigned by school number. Second Freshman School Type (Year) – The type of the second school the student attended in the 9th grade if that student was in the 9th grade in that given school year and attended more than one school. Initial School Type (Year) – The type of the first school the student attended that given year, regardless of grade, assigned by school number. Second School Type (Year) – The type of the second school the student attended that given year, regardless of grade, if the student attended more than one school, assigned by school number. Special Education (Year) – Binary (0,1) variable indicating whether the student was enrolled in special education in that given year, provided by DREAA. FRPL (Year) - Binary (0,1) variable indicating whether the student was enrolled in free and reduced price lunch in that given year, provided by DREAA. Overage (Year) – A binary (0,1) variable indicating whether the student was overage for their current grade level as of September 30th of that given school year, based on age data provided by DREAA. A student is considered overage if they are over 16 when entering 9th grade, over 17 when entering 10th grade, over 18 when entering 11th grade or over 19th when entering 12th grade.
19 For more information on School Type assignments, see Appendix A.

The Urban Institute / Education Policy Center SCHOOLS, STUDENTS, AND OUTCOMES 2007
26
Mobile (Year) – A binary (0,1) variable indicating if a student attended more than one school in that given school year. Grade (Year) – The grade level in which the student was enrolled in that given year, provided by DREAA. English HSA (Year) – The scale score the student earned on the English HSA test in that given year, if the student took the test, provided by DREAA. Algebra HSA (Year) - The scale score the student earned on the Algebra HSA test in that given year, if the student took the test, provided by DREAA. Attendance Rate (Year) – The total number of days the student attended school, at all of the schools in which he or she was enrolled in that given year, divided by the total number of days in the school year (180). TerraNova Reading – The scale score the student earned on his or her most recent TerraNova Reading test, provided by DREAA. TerraNova Math – The scale score the student earned on his or her most recent TerraNova mathematics test, provided by DREAA. Support for Students (Year) – Sum of the values of the personalization and safety Key Indicator variables.
Personalized Environment Individual survey items: Student agreement with the following …
• Most students know me by name • Most teachers know me by name • The principal knows me by name • There is at least one adult at school to talk with • Students get along with each other • Students and teachers get along • Teachers care whether students succeed in their lives outside school • There is someone at school I can talk to about personal problems • Teachers care about students
Safe Environment Individual survey items: Student responses about …
• Not feeling safe at school • Outsiders getting into the school • Fighting among students • Robbery or theft at school • Vandalism of school property • Student possession of weapons • Students picking on other students • Student drug or alcohol abuse • Fires being set at school

The Urban Institute / Education Policy Center SCHOOLS, STUDENTS, AND OUTCOMES 2007
27
Teaching and Learning Environment (Year) – Sum of the values of the teacher collegiality, teacher accountability, and administrative leadership Key Indicator variables.
Teacher Collegiality Individual survey items: How often teachers talk about…
• Curriculum and instructional materials • Effective teaching practices • Professional development activities • Behavior management strategies • Ideas for improving the school • Individual students at school
Accountability for Student Outcomes Individual survey items: Teachers agree that teachers at school …
• Set high standards for their teaching • Make expectations for meeting instructional goals clear to students • Provide extra academic help to students who need it • Encourage students to take challenging classes • Believe all students can do well in school if they try • Feel responsible for their students’ academic success • Feel responsible for their students’ social and emotional development
Administrative Leadership Individual survey items: Teachers agree that the administrative leadership team …
• Promptly responds to their concerns • Supports the staff in performing their duties • Lets staff members know what is expected of them • Knows what kind of school he/she wants and has communicated it to the staff • Is aware of problems faced by the staff • Treats teachers as colleagues, rather than employees • Enforces school rules for student conduct and backs up teachers • Acts as an advocate for the staff when dealing with people outside the school • Takes a fair share of responsibility for the school’s successes and shortcomings • Works collaboratively with teachers to solve problems • Keeps teachers informed about relevant district policies or activities • Coordinates and supports school programs that enable the school to operate efficiently
and smoothly • The principal is an instructional leader

The Urban Institute / Education Policy Center SCHOOLS, STUDENTS, AND OUTCOMES 2007
28
APPENDIX C Exhibit C-1. Comparison of incoming 9th graders’ social and academic characteristics in innovation schools versus all other high school types, 2003-04
Variable Innovation
Population 166Female 55.4% 43.7% ** 44.1% ** 59.7% 41.0% ***
African American 97.0% 90.6% ** 91.3% 89.1% ** 97.9%White 1.8% 8.3% ** 7.6% ** 9.4% *** 1.8%Hispanic 1.2% 0.3% 0.5% 0.4% 0.2%American Indian 0.0% 0.2% 0.5% 0.3% 0.1%Asian 0.0% 0.6% 0.1% 0.8% 0.0%
Free Meal 61.4% 61.4% 64.7% 56.2% 51.3%Special Education 12.7% 24.1% *** 26.9% *** 4.6% *** 22.6% **TerraNova Reading 634 638 628 674 *** 624 **TerraNova Math 639 643 633 681 *** 629Over Age 1.8% 9.7% *** 17.0% *** 1.2% 58.1% ***** p=.05, *** p=.01
Race/Ethnicity
1617 3372 2243 794OtherNeighborhood Comprehensive Selective
Exhibit C-2. Comparison of incoming 9th graders’ social and academic characteristics in innovation schools versus all other high school types, 2004-05
Variable InnovationPopulation 457
Female 63.5% 43.3% *** 42.7% *** 57.5% 40.9% ***
African American 93.9% 91.0% 90.2% 90.7% 97.2% **White 5.0% 8.2% 8.1% 7.6% 2.4%Hispanic 0.7% 0.3% 0.8% 0.5% 0.4%American Indian 0.2% 0.2% 0.7% 0.3% 0.0%Asian 0.2% 0.3% 0.3% 0.9% 0.0%
Free Meal 74.6% 64.6% *** 63.1% *** 60.2% *** 52.5% ***Special Education 20.1% 26.3% ** 29.7% *** 5.3% *** 23.6%TerraNova Reading 643 633 ** 630 *** 665 *** 621 ***TerraNova Math 650 639 *** 635 *** 672 *** 629 ***Over Age 3.5% 15.7% *** 26.0% *** 1.9% 72.6% ***** p=.05, *** p=.01
Race/Ethnicity
Neighborhood Comprehensive Selective2280 674
Means Difference Testing for Initial 9th Grade Enrollment in IHS vs All Other School Types, 2004-05Other
2141 2694
The Urban Institute / Education Policy Center SCHOOLS, STUDENTS, AND OUTCOMES 2007
29
Exhibit C-3. Comparison of incoming 9th graders’ social and academic characteristics in innovation schools versus all other high school types, 2005-06 Variable Innovation
Population 609Female 55.7% 44.5% *** 42.4% *** 56.1% 43.5% ***
African American 94.3% 92.6% 91.0% ** 89.7% *** 94.7%White 5.3% 6.8% 6.8% 8.7% ** 3.9%Hispanic 0.3% 0.2% 1.0% 0.6% 0.9%American Indian 0.2% 0.1% 0.8% 0.3% 0.3%Asian 0.0% 0.3% 0.4% 0.6% 0.1%
Free Meal 70.9% 51.8% *** 49.8% *** 58.0% *** 31.7% ***Special Education 17.1% 26.4% *** 27.1% *** 6.0% *** 21.8%TerraNova Reading 646 638 *** 634 *** 675 *** 635 ***TerraNova Math 646 642 639 *** 686 *** 641Over Age 6.1% 16.8% *** 22.2% *** 4.3% 64.2% ***** p=.05, *** p=.01
Race/Ethnicity
3132Neighborhood Comprehensive Selective Other
54523482189
Exhibit C-4. Results of logistic analysis of probability of enrolling in innovation schools versus neighborhood and comprehensive high schools, 2003-04, 2004-05, 2005-06
YearFemale 1.4 *** 2.1 *** 1.0FRPL 1.8 *** 1.7 ** 0.9Special Education 1.0 1.4 0.4 ***TerraNova Reading 1.0 *** 1.0 1.0TerraNova Math 1.0 1.0 ** 1.0Over Age 0.3 *** 0.1 *** 0.1 ***** p=.05, *** p=.01
2005-06 2004-05Logistic Regression: Odds Ratios
2003-04
Exhibit C-5. Comparison of social and academic characteristics of students who left innovation schools versus students who stayed in innovation schools, 2005-06
Variable Leavers StayersPopulation 46 563Female 47.8% 56.3%Race/Ethnicity
African American 95.7% 94.1%White 4.3% 5.3%Hispanic 0.0% 0.4%American Indian 0.0% 0.2%Asian 0.0% 0.0%
FRPL 65.2% 71.4%Special Education 23.9% 16.5%TerraNova Reading 637 646TerraNova Math 640 646Over Age 10.9% 5.7%**p=.05, ***p=.01

The Urban Institute / Education Policy Center SCHOOLS, STUDENTS, AND OUTCOMES 2007
30
Exhibit C-6. Results of HLM model examining likelihood 9th graders leave innovation high schools compared with all other high school types, 2004-05
VariableSchool Type
Neighborhood 2.3 *Comprehensive 3.1 **Selective 1.4Other 5.0 ***
Student CharacteristicsFemale 1.0FRPL 1.1Special Education 1.2TerraNova Reading 1.0 *Over Age 0.4 **** p=.10, ** p=.05, ***p=.01
Odds Ratio
Exhibit C-7. Results of logistic analysis of probability of leaving innovation schools versus neighborhood and comprehensive high schools, 2003-04, 2004-05 and 2005-06
YearFemale 1.5 1.5 1.2FRPL 0.9 1.9 0.6Special Education 0.7 1.8 0.3 **TerraNova Reading 1.0 1.0 1.0TerraNova Math 1.0 1.0 1.0Over Age 0.4 0.2 *** 0.1** p=.05, ***p=.01
Logistic Regression: Odds Ratios2005-06 2004-05 2003-04
Exhibit C-8. Number of students leaving their initial high school and percent of leavers attending other high schools or falling out of the system, 2003-04
Initial School Type Total Leavers Innovation Neighborhood Comprehensive Selective Other Fall OutInnovation 12 0.0% 33.3% 41.7% 8.3% 0.0% 16.7%Neighborhood 444 0.2% 9.9% 11.5% 0.5% 0.9% 77.0%Comprehensive 1448 0.1% 3.8% 8.8% 0.2% 0.6% 86.6%Selective 231 0.0% 9.1% 10.8% 0.4% 0.0% 79.7%Other 775 0.0% 1.3% 0.4% 0.0% 0.3% 98.1%Total 2910 0.1% 4.6% 7.3% 0.2% 0.5% 87.4%
Receiving School Type/Fall Out
Exhibit C-9. Comparisons of mean characteristics of the total neighborhood population versus characteristics of students at each neighborhood school individually, 2005-06 SchoolTotal Neighborhood Population 47.1% 50.5% 22.0% 10.9% 640 645Digital Harbor High School-416 42.1% ** 56.8% *** 8.9% *** 4.0% *** 654 *** 662 ***W.E.B. Dubois High School-418 39.8% *** 44.2% ** 31.2% *** 15.8% ** 640 642Reginald F. Lewis Sch Bus & Law-419 50.2% 39.3% *** 19.4% 14.6% 644 649Dr. Samuel L. Banks High School-420 47.8% 41.8% *** 20.3% 10.1% 644 649 **Thurgood Marshall High School-424 47.3% 51.2% 18.3% 11.0% 638 642Heritage High School-425 48.6% 54.3% 20.5% 11.4% 632 *** 636 ***Doris M Johnson Hs-426 53.7% 64.5% *** 23.9% 6.7% ** 641 644Vivien T Thomas Med Arts Aca-429 54.5% ** 48.5% 22.6% 7.9% 641 646Augusta Fells Savage Inst Vis Arts-430 46.4% 53.4% 27.8% ** 3.8% *** 635 642Maritime Academy-431 49.6% 57.5% 18.1% 15.7% 640 640Homeland Security High School-434 48.6% 58.7% ** 29.2% ** 7.5% 633 ** 638 **Business High School At Walbrook-435 47.7% 58.0% ** 25.1% 7.0% ** 637 640Liberal Arts Academy HS-436 41.8% 40.1% *** 33.5% *** 30.4% *** 624 *** 625 ***** p=.05, *** p=.01
TN Reading TN MathFemale FRPL Special Education Over Age

The Urban Institute / Education Policy Center SCHOOLS, STUDENTS, AND OUTCOMES 2007
31
Exhibit C-10. HLM model comparing HSA English and Algebra scores and attendance in innovation high schools to all other high school types, 2005-06
VariableSchool Type
Neighborhood -17.6 *** -15.2 *** -8.7% ***Comprehensive -13.6 ** -13.7 ** -18.3% **Selective 2.0 -0.6 5.5% **Other -24.8 *** -29.9 ** -21.8% ***
Student CharacteristicsFemale 4.9 *** 8.3 *** 0.8% **FRPL 1.4 1.8 17.7% ***Special Education -32.1 *** -18.7 *** -1.4%TerraNova Reading/Math 0.5 *** 0.3 *** 0.0%Over Age -3.5 -4.3 -25.3% **** p=.10, ** p=.05, ***p=.01
HSA Algebra HSA English Attendance Rate
Exhibit C-11. Regression results for relationship between high school type, student characteristics and implementation measures (neighborhood as baseline), 2005-06
VariableSchool Type
Innovation 1.00 *** 1.02 *** 1.17 *** 1.16 ***Comprehensive 0.01 *** 0.02 *** -0.19 *** -0.18 ***
Student CharacteristicsFemale -- 0.01 -- 0.00FRPL -- 0.03 *** -- -0.01Special Education -- 0.00 -- 0.00TerraNova Reading -- 0.00 -- 0.00Over Age -- -0.02 ** -- 0.17 ***** p=.05, ***p=.01
Support for StudentsTeaching and Learning
EnvironmentStep 1 Step 2 Step 1 Step 2
Exhibit C-12. Regression results for relationship between implementation measures and academic outcomes, controlling for student characteristics, 2005-06 Variable
ImplementationMeasure 9.1 *** 0.2 7.7 *** 3.5 *** 0.06 *** 0.01
Student CharacteristicsFemale 9.1 *** 9.4 *** 5.9 *** 6.0 *** 0.01 0.01 **FRPL 5.6 ** 6.1 ** 1.2 1.9 0.22 *** 0.23 ***Special Education -19.6 *** -19.8 *** -32.9 *** -33.0 *** -0.01 -0.01TerraNova Reading/Math 0.3 *** 0.3 *** 0.5 *** 0.5 *** 0.00 0.00Over Age -2.0 -3.3 -6.9 ** -7.7 ** -0.29 *** -0.29 ***** p=.05, ***p=.01
Attendance Rate
Student Support
Teaching and Learning
Environment
Student Support
Teaching and Learning
Environment
Student Support
Teaching and Learning
Environment
HSA English HSA Algebra