Supplemental Materials and methods - Genes &...
25
Supplemental Materials and methods Cell lines and culture Mel-STR and Mel-STV cell lines, immortalized primary human melanocytes expressing RasV12 or empty vector, respectively, were described previously (Gupta et al. 2005) and provided by Robert Weinberg. 67NR cells, a BALB/C mouse-derived breast cancer cell line (Aslakson and Miller 1992), were provided by Fred Miller and were grown in DMEM medium supplemented with 5% fetal bovine serum, 5% newborn calf serum, 1X non-essential amino acids (Invitrogen), L-glutamine (2 mM) and 1X penicillin/streptomycin (Invitrogen). To generate B16-F0 cell lines expressing Bcl-2, B16-F0 cells were stably transduced with a Bcl-2 retroviral vector (pME2PUROSRαBCL2; Innes et al. 1999), provided by Suzanne Cory, and puromycin selected for 4 days. Proliferation and apoptosis assays The proliferation rate of the B16-F0 cells expressing a Gas1 shRNA or non-silencing control, or B16-F10 cells ectopically expressing Gas1 or vector was determined using CyQUANT® Cell Proliferation Assay Kit according to the manufacturer (Invitrogen). To evaluate apoptosis in the above cell lines, protein extracts were prepared and the levels of cleaved and non-cleaved Parp-1 were analyzed by immunoblotting using an antibody against Parp-1 (BioMol). Transwell/Boyden invasion assays Invasion assays were performed using the CytoSelect 24-Well Cell Migration and Invasion Assay as described by the manufacturer (Cell Biolabs). In brief, B16-F0 cells expressing a Gas1 shRNA or non-silencing control, or B16-F10 cells were placed in the upper compartment of the Transwell/Boyden chamber and invasion as well as migration into the lower chamber was measured 48hrs later. Invasion percentage was determined by dividing the number of cells that invaded over the number of cells that migrated.
Transcript of Supplemental Materials and methods - Genes &...

Supplemental Materials and methods
Cell lines and culture
Mel-STR and Mel-STV cell lines, immortalized primary human melanocytes expressing RasV12
or empty vector, respectively, were described previously (Gupta et al. 2005) and provided by
Robert Weinberg. 67NR cells, a BALB/C mouse-derived breast cancer cell line (Aslakson and
Miller 1992), were provided by Fred Miller and were grown in DMEM medium supplemented
with 5% fetal bovine serum, 5% newborn calf serum, 1X non-essential amino acids (Invitrogen),
L-glutamine (2 mM) and 1X penicillin/streptomycin (Invitrogen). To generate B16-F0 cell lines
expressing Bcl-2, B16-F0 cells were stably transduced with a Bcl-2 retroviral vector
(pME2PUROSRαBCL2; Innes et al. 1999), provided by Suzanne Cory, and puromycin selected
for 4 days.
Proliferation and apoptosis assays
The proliferation rate of the B16-F0 cells expressing a Gas1 shRNA or non-silencing control, or
B16-F10 cells ectopically expressing Gas1 or vector was determined using CyQUANT® Cell
Proliferation Assay Kit according to the manufacturer (Invitrogen). To evaluate apoptosis in the
above cell lines, protein extracts were prepared and the levels of cleaved and non-cleaved Parp-1
were analyzed by immunoblotting using an antibody against Parp-1 (BioMol).
Transwell/Boyden invasion assays
Invasion assays were performed using the CytoSelect 24-Well Cell Migration and Invasion
Assay as described by the manufacturer (Cell Biolabs). In brief, B16-F0 cells expressing a Gas1
shRNA or non-silencing control, or B16-F10 cells were placed in the upper compartment of the
Transwell/Boyden chamber and invasion as well as migration into the lower chamber was
measured 48hrs later. Invasion percentage was determined by dividing the number of cells that
invaded over the number of cells that migrated.

Shh signaling assays
B16-F0 cells were transduced with a Gas1 or non-silencing shRNA and 7 days later, cell extracts
were prepared and analyzed by immunoblotting using an antibody against Gli1 (Santa Cruz) or,
as a loading control, Actin (Sigma). For B16-F10 cells, extracts were prepared 7 days following
ectopic expression of Gas1.
Oncomine database searches
The Haqq (Haqq et al. 2005) and Smith (Smith et al. 2005) melanoma microarray datasets were
accessed using the Oncomine Cancer Profiling Database (www.oncomine.org). The Haqq
melanoma dataset includes 10 normal mole, 5 primary melanoma and 17 metastatic melanoma
samples; the Smith melanoma dataset includes 6 early stage (normal, benign nevi, melanoma in
situ) and 7 advanced stage (vertical growth phase melanoma, metastatic growth phase melanoma,
melanoma positive lymph nodes) samples. Histograms depicting gene expression in each sample,
as well as a Student’s t-test giving a p value for the comparison of candidate gene expression
between the groups, were obtained directly through the Oncomine 3.0 software. Analogous
approaches were used to analyze expression of candidate genes in other cancers.

Supplemental References
Aslakson, C.J. and Miller, F.R. 1992. Selective events in the metastatic process defined by
analysis of the sequential dissemination of subpopulations of a mouse mammary tumor.
Cancer Res. 52: 1399-1405.
Gupta, P.B., Kuperwasser, C., Brunet, J.P., Ramaswamy, S., Kuo, W.L., Gray, J.W., Naber, S.P.,
and Weinberg, R.A. 2005. The melanocyte differentiation program predisposes to
metastasis after neoplastic transformation. Nat. Genet. 37: 1047-1054.
Haqq, C., Nosrati, M., Sudilovsky, D., Crothers, J., Khodabakhsh, D., Pulliam, B.L., Federman,
S., Miller, J.R., 3rd, Allen, R.E., Singer, M.I., Leong, S.P., Ljung, B.M., Sagebiel, R.W.,
and Kashani-Sabet, M. 2005. The gene expression signatures of melanoma progression.
Proc. Natl. Acad. Sci. USA 102: 6092-6097.
Innes, K.M., Szilvassy, S.J., Davidson, H.E., Gibson, L., Adams, J.M., and Cory, S. 1999.
Retroviral transduction of enriched hematopoietic stem cells allows lifelong Bcl-2
expression in multiple lineages but does not perturb hematopoiesis. Exp Hematol 27: 75-
87.
Smith, A.P., Hoek, K., and Becker, D. 2005. Whole-genome expression profiling of the
melanoma progression pathway reveals marked molecular differences between
nevi/melanoma in situ and advanced-stage melanomas. Cancer Biol. Ther. 4: 1018-1029.

Supplemental Table S1. Quantitation of satellite colony formation in the 3-D assay shown inSupplemental Figure S1
Gene Number of colonies Gene Number of coloniesB16-F0/NS -- Mipep +B16-F10 +++ Muc19 ++Acta2 ++ Nbeal2 +++Adamts16 +++ Nme7 +++Agl + N6amt1 ++Alg6 +++ Olfr198 +++Atg7 +++ Optc +++Baiap2 +++ Otud4 ++Bnip1 ++ Pclo +++B630019K06Rik +++ Pcsk6 +Cabyr +++ Pdyn +Cav2 + Phka1 +Ccdc39 +++ Ppp1r10 +++Ccna2 + Pramel3 +Cd5 ++ Prdm13 +++Cdc26 +++ Prrg3 +Centd1 +++ Ran +Cldnd2 + Rfx2 ++Col24a1 +++ Robo2 ++Cpa2 ++ Sccpdh +++Crkl +++ Setd2 ++Ctso + Slc9a3r2 +Dazl + Slc25a1 +Ddhd2 +++ Spc25 +Degs2 +++ Ss18l1 ++Dgkb ++ Thsd7b +++Dkc1 ++ Topbp1 ++Dmrta1 ++ Tomm70a +++Dnajb10 +++ Ttc17 +Dppa3 +++ Ubn1 +EG436563 + Ugt2b34 +++Fchsd1 + Uqcrc2 +++Fignl1 ++ Zadh1 +Gas1 +++ Zcchc9 +++Gimap6 + Zc3h13 +Gprasp1 + Zfp294 +++Hsd3b2 +++ 1500011H22Rik +Map2k2 ++ 4732496O08Rik +++Maz ++ 4931422A03Rik ++Mettl5 + 9630031F12Rik +
Satellite colonies were counted as scored as follows: – (0-10 colonies), + (11-25 colonies), ++ (26-50 colonies) or+++ (>50 colonies).

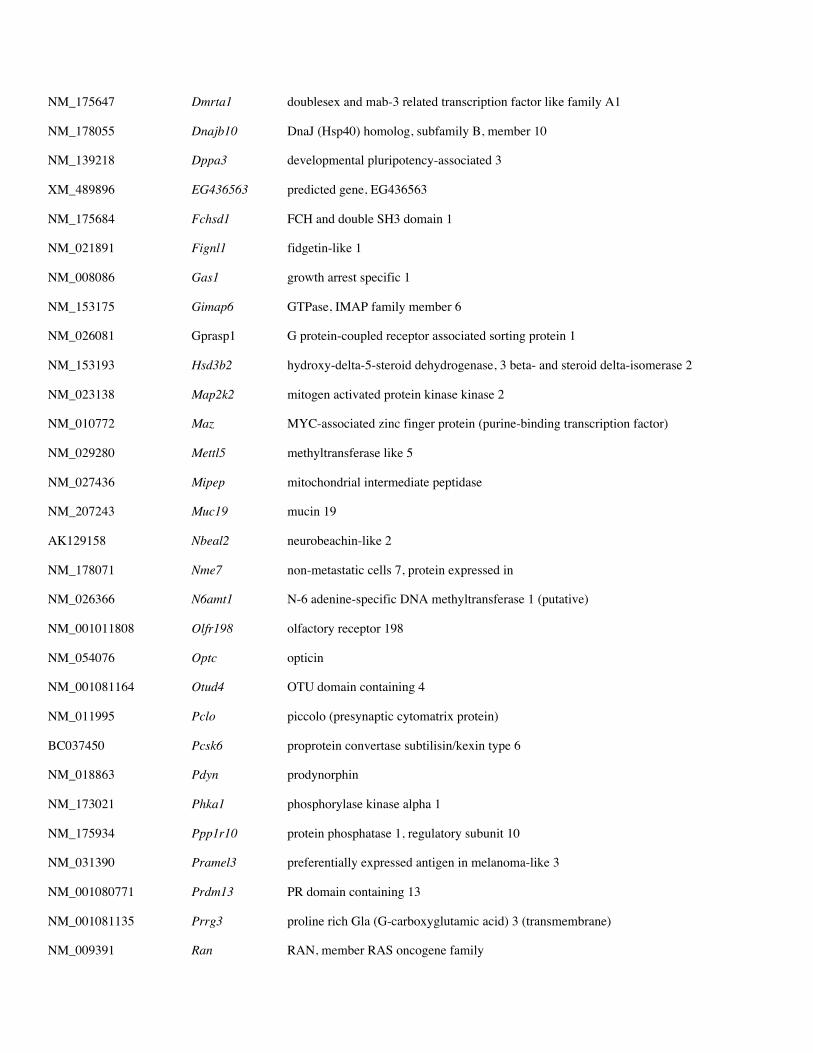
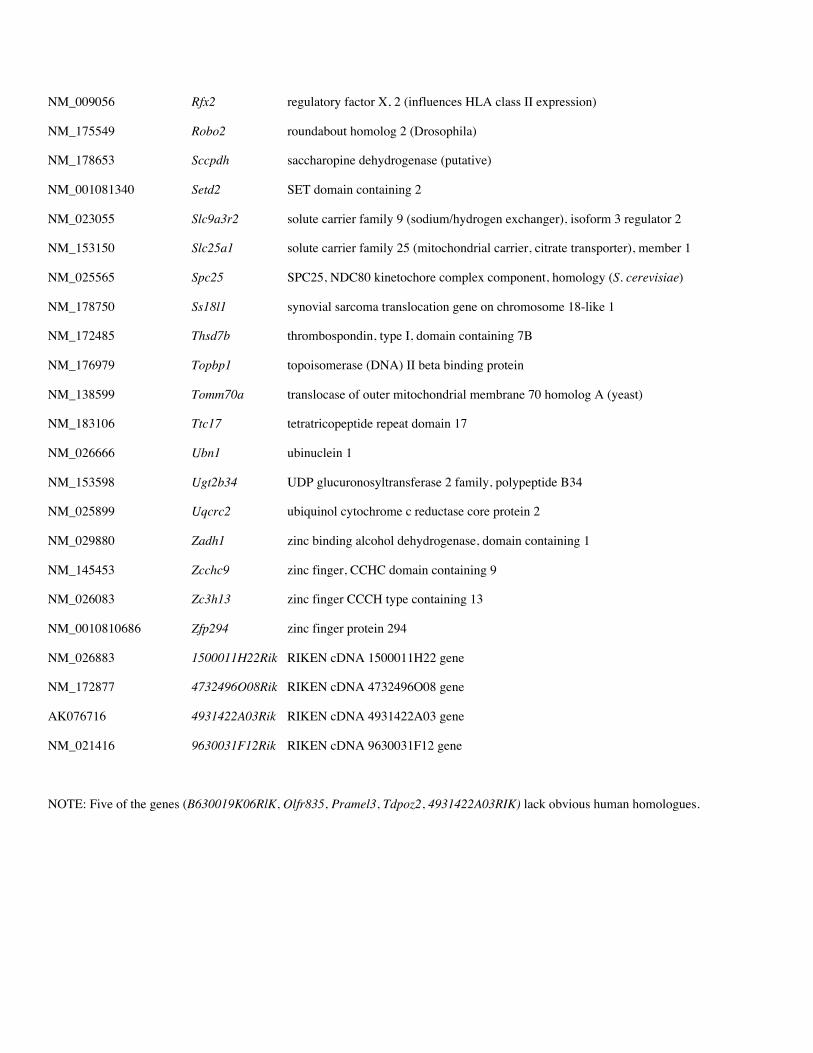
Supplemental Table S2. List of 78 candidate metastasis suppressor genes that tested positive in the 3-D cellculture assay.
Accession Gene Name
number symbol
NM_007392 Acta2 actin, alpha 2, smooth muscle, aorta
NM_172053 Adamts16 a disintegrin-like and metallopeptidase (reprolysin type) with thrombospondin type 1
motif, 16
NM_001081326 Agl amylo-1,6-glucosidase, 4-alpha-glucanotransferase
NM_001081264 Alg6 asparagine-linked glycosylation 6 homolog (yeast, alpha-1,3,-glucosyltransferase)
NM_028835 Atg7 autophagy-related 7 (yeast)
NM_130862 Baiap2 brain-specific angiogenesis inhibitor 1-asssociated protein 2
NM_172149 Bnip1 BCL2/adenovirus E1B interacting protein 1, NIP1
NM_175327 B630019K06Rik RIKEN cDNA B630019K06 gene
NM_027687 Cabyr calcium-binding tyrosine-(Y)-phosphorylation regulated (fibrousheathin 2)
NM_016900 Cav2 caveolin 2
NM_026222 Ccdc39 coiled-coil domain containing 39
NM_009828 Ccna2 cyclin A2
NM_007650 Cd5 CD5 antigen
NM_139291 Cdc26 cell division cycle 26
AK122316 Centd1 centaurin, delta 1
NM_028849 Cldnd2 claudin domain containing 2
NM_027770 Col24a1 procollagen, type XXIV, alpha 1
NM_001024698 Cpa2 carboxypeptidase A2, pancreatic
NM_007764 Crkl v-crk sarcoma virus CT10 oncogene homolog (avian)-like
NM_177662 Ctso cathepsin O
NM_010021 Dazl deleted in azoospermia-like
AK173010 Ddhd2 DDHD domain containing 2
NM_027299 Degs2 degenerative spermatocyte homolog 2 (Drosophila), lipid desaturase
NM_178681 Dgkb diacylglycerol kinase, beta
NM_001030307 Dkc1 dyskeratosis congenita 1, dyskerin homolog (human)
NM_175647 Dmrta1 doublesex and mab-3 related transcription factor like family A1
NM_178055 Dnajb10 DnaJ (Hsp40) homolog, subfamily B, member 10
NM_139218 Dppa3 developmental pluripotency-associated 3
XM_489896 EG436563 predicted gene, EG436563
NM_175684 Fchsd1 FCH and double SH3 domain 1
NM_021891 Fignl1 fidgetin-like 1
NM_008086 Gas1 growth arrest specific 1
NM_153175 Gimap6 GTPase, IMAP family member 6
NM_026081 Gprasp1 G protein-coupled receptor associated sorting protein 1
NM_153193 Hsd3b2 hydroxy-delta-5-steroid dehydrogenase, 3 beta- and steroid delta-isomerase 2
NM_023138 Map2k2 mitogen activated protein kinase kinase 2
NM_010772 Maz MYC-associated zinc finger protein (purine-binding transcription factor)
NM_029280 Mettl5 methyltransferase like 5
NM_027436 Mipep mitochondrial intermediate peptidase
NM_207243 Muc19 mucin 19
AK129158 Nbeal2 neurobeachin-like 2
NM_178071 Nme7 non-metastatic cells 7, protein expressed in
NM_026366 N6amt1 N-6 adenine-specific DNA methyltransferase 1 (putative)
NM_001011808 Olfr198 olfactory receptor 198
NM_054076 Optc opticin
NM_001081164 Otud4 OTU domain containing 4
NM_011995 Pclo piccolo (presynaptic cytomatrix protein)
BC037450 Pcsk6 proprotein convertase subtilisin/kexin type 6
NM_018863 Pdyn prodynorphin
NM_173021 Phka1 phosphorylase kinase alpha 1
NM_175934 Ppp1r10 protein phosphatase 1, regulatory subunit 10
NM_031390 Pramel3 preferentially expressed antigen in melanoma-like 3
NM_001080771 Prdm13 PR domain containing 13
NM_001081135 Prrg3 proline rich Gla (G-carboxyglutamic acid) 3 (transmembrane)
NM_009391 Ran RAN, member RAS oncogene family
NM_009056 Rfx2 regulatory factor X, 2 (influences HLA class II expression)
NM_175549 Robo2 roundabout homolog 2 (Drosophila)
NM_178653 Sccpdh saccharopine dehydrogenase (putative)
NM_001081340 Setd2 SET domain containing 2
NM_023055 Slc9a3r2 solute carrier family 9 (sodium/hydrogen exchanger), isoform 3 regulator 2
NM_153150 Slc25a1 solute carrier family 25 (mitochondrial carrier, citrate transporter), member 1
NM_025565 Spc25 SPC25, NDC80 kinetochore complex component, homology (S. cerevisiae)
NM_178750 Ss18l1 synovial sarcoma translocation gene on chromosome 18-like 1
NM_172485 Thsd7b thrombospondin, type I, domain containing 7B
NM_176979 Topbp1 topoisomerase (DNA) II beta binding protein
NM_138599 Tomm70a translocase of outer mitochondrial membrane 70 homolog A (yeast)
NM_183106 Ttc17 tetratricopeptide repeat domain 17
NM_026666 Ubn1 ubinuclein 1
NM_153598 Ugt2b34 UDP glucuronosyltransferase 2 family, polypeptide B34
NM_025899 Uqcrc2 ubiquinol cytochrome c reductase core protein 2
NM_029880 Zadh1 zinc binding alcohol dehydrogenase, domain containing 1
NM_145453 Zcchc9 zinc finger, CCHC domain containing 9
NM_026083 Zc3h13 zinc finger CCCH type containing 13
NM_0010810686 Zfp294 zinc finger protein 294
NM_026883 1500011H22Rik RIKEN cDNA 1500011H22 gene
NM_172877 4732496O08Rik RIKEN cDNA 4732496O08 gene
AK076716 4931422A03Rik RIKEN cDNA 4931422A03 gene
NM_021416 9630031F12Rik RIKEN cDNA 9630031F12 gene
NOTE: Five of the genes (B630019K06RlK, Olfr835, Pramel3, Tdpoz2, 4931422A03RIK) lack obvious human homologues.

Supplemental Table S3. List of genes that are down-regulated in metastatic versus non-metastaticsamples, or in late (stages III and IV) relative to early (stage I) disease of multiple cancer types
Gene
mel
anom
a
brea
st
pros
tate
ovar
ian
liver
sarc
oma
colo
n
lung
blad
der
gastr
ic
head
-nec
k
sem
inom
a
Ewin
g’s s
arco
ma
cerv
ical
rena
l
ACTA2
ALG6
CCDC39
CCNA2
CTSO
CPA2
DPPA3
GAS1
PDYN
PHKA1
SETD2
SLC9A3R2
THSD7B
TOMM70A
ZNF294
indicates down-regulation in metastatic versus non-metastatic samples, or in late relative toearly stages of various human cancers. ZNF294 is the human homolog of mouse Zfp294.

Supplemental Table S4. shRNA source ID numbers and clone locations
Gene Source ID Clone Location
Acta2 V2MM_62388 SM2246-B-6V2MM_65336 SM2693-F-5
Alg6 V2MM_106772 SM2309-F-12V2MM_106773 SM2504-H-4
B630019K06Rik V2MM_225897 SM2483-E-7V2MM_88141 SM2138-E-6
Ccdc39 V2MM_64393 SM2006-G-6V2MM_74034 SM2215-F-10
Ccna2 V2MM_66832 SM2249-E-4V2MM_79073 SM2690-C-6
Cpa2 V2MM_108526 SM2498-H-11V2MM_206039 SM2505-G-12
Ctso V2MM_89746 SM2138-D-6V2MM_192286 SM2264-E-1
Dppa3 V2MM_41977 SM2596-H-1V2MM_52134 SM2442-G-8
EG436563 V2MM_211026 SM2635-A-1V2MM_214895 SM2368-H-1
Gas1 V2MM_77518 SM2002-B-1V2HS_114059 SH2395-E-1
Hsd3b2 V2MM_113015 SM2503-B-8V2MM_233631 SM2509-E-3
Olfr198 V2MM_206933 SM2332-E-9V2MM_140900 SM2053-B-9
Pdyn V2MM_14195 SM2388-C-5TRCN0000108487 AAN31-D-2
Phka1 V2MM_189266 SM2185-E-3V2MM_50701 SM2442-B-11
Prdm13 V2MM_233010 SM2499-E-9V2MM_106522 SM2502-F-3
Prrg3 V2MM_121756 SM2354-A-1V2MM_241522 SM2532-E-7
Slc9a3r2 V2MM_67362 SM2005-A-7V2MM_188689 SM2177-C-10
Setd2 V2MM_110951 SM2152-A-2V2MM_110955 SM2616-G-2
Thsd7b V2MM_203844 SM2492-C-10V2MM_204528 SM2507-C-2
Tomm70a V2MM_47658 SM2409-D-10V2MM_58390 SM2442-A-3
Zfp294 V2MM_102500 SM2493-H-6V2MM_206507 SM2492-C-1
4931422A03Rik V2MM_87414 SM2469-B-12V2MM_87411 SM2461-F-6
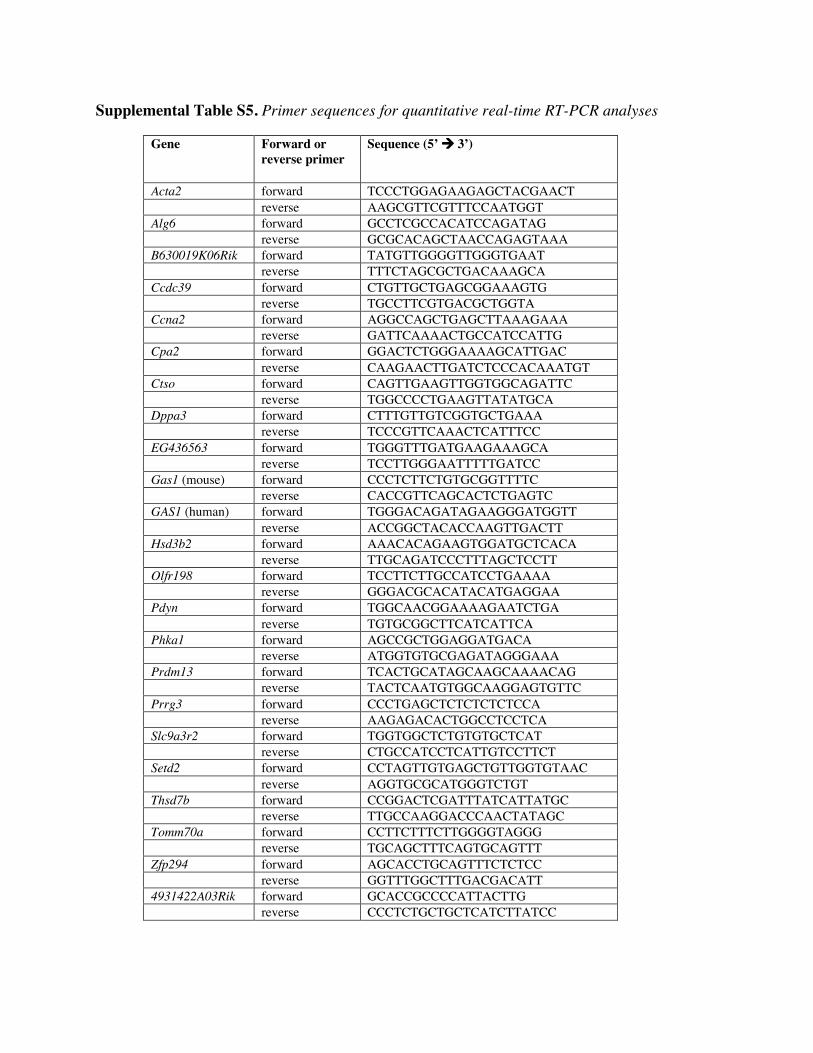
Supplemental Table S5. Primer sequences for quantitative real-time RT-PCR analyses
Gene Forward orreverse primer
Sequence (5’ 3’)
Acta2 forward TCCCTGGAGAAGAGCTACGAACTreverse AAGCGTTCGTTTCCAATGGT
Alg6 forward GCCTCGCCACATCCAGATAGreverse GCGCACAGCTAACCAGAGTAAA
B630019K06Rik forward TATGTTGGGGTTGGGTGAATreverse TTTCTAGCGCTGACAAAGCA
Ccdc39 forward CTGTTGCTGAGCGGAAAGTGreverse TGCCTTCGTGACGCTGGTA
Ccna2 forward AGGCCAGCTGAGCTTAAAGAAAreverse GATTCAAAACTGCCATCCATTG
Cpa2 forward GGACTCTGGGAAAAGCATTGACreverse CAAGAACTTGATCTCCCACAAATGT
Ctso forward CAGTTGAAGTTGGTGGCAGATTCreverse TGGCCCCTGAAGTTATATGCA
Dppa3 forward CTTTGTTGTCGGTGCTGAAAreverse TCCCGTTCAAACTCATTTCC
EG436563 forward TGGGTTTGATGAAGAAAGCAreverse TCCTTGGGAATTTTTGATCC
Gas1 (mouse) forward CCCTCTTCTGTGCGGTTTTCreverse CACCGTTCAGCACTCTGAGTC
GAS1 (human) forward TGGGACAGATAGAAGGGATGGTTreverse ACCGGCTACACCAAGTTGACTT
Hsd3b2 forward AAACACAGAAGTGGATGCTCACAreverse TTGCAGATCCCTTTAGCTCCTT
Olfr198 forward TCCTTCTTGCCATCCTGAAAAreverse GGGACGCACATACATGAGGAA
Pdyn forward TGGCAACGGAAAAGAATCTGAreverse TGTGCGGCTTCATCATTCA
Phka1 forward AGCCGCTGGAGGATGACAreverse ATGGTGTGCGAGATAGGGAAA
Prdm13 forward TCACTGCATAGCAAGCAAAACAGreverse TACTCAATGTGGCAAGGAGTGTTC
Prrg3 forward CCCTGAGCTCTCTCTCTCCAreverse AAGAGACACTGGCCTCCTCA
Slc9a3r2 forward TGGTGGCTCTGTGTGCTCATreverse CTGCCATCCTCATTGTCCTTCT
Setd2 forward CCTAGTTGTGAGCTGTTGGTGTAACreverse AGGTGCGCATGGGTCTGT
Thsd7b forward CCGGACTCGATTTATCATTATGCreverse TTGCCAAGGACCCAACTATAGC
Tomm70a forward CCTTCTTTCTTGGGGTAGGGreverse TGCAGCTTTCAGTGCAGTTT
Zfp294 forward AGCACCTGCAGTTTCTCTCCreverse GGTTTGGCTTTGACGACATT
4931422A03Rik forward GCACCGCCCCATTACTTGreverse CCCTCTGCTGCTCATCTTATCC

Supplemental Figure Legends
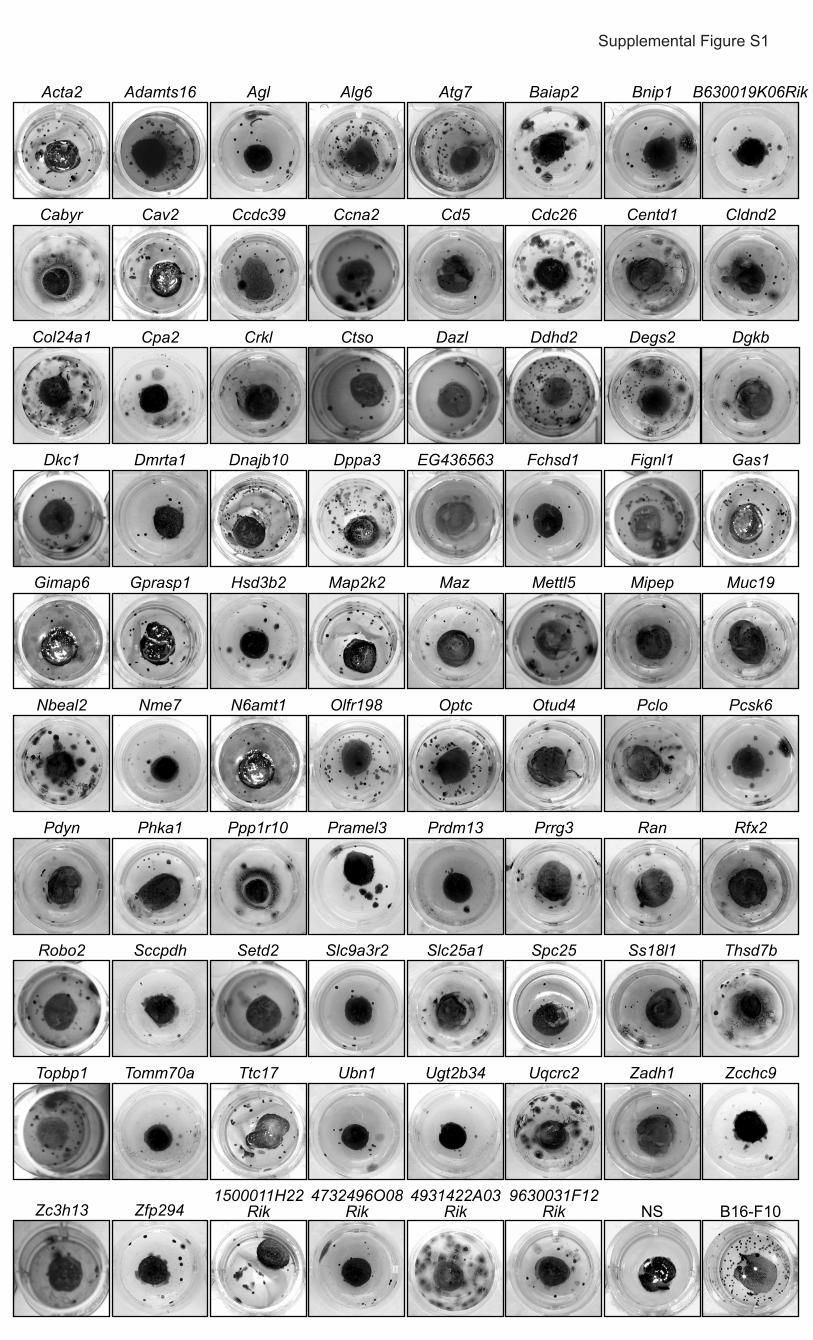
Supplemental Figure S1. Three-dimensional cell culture assays for each of the 78 B16-F0
knockdown cell lines. Collagen/MatrigelTM-embedded cells are shown in the center, surrounded
by migrating satellite colonies in the fibrin matrix. B16-F0 cells expressing a non-silencing (NS)
shRNA and B16-F10 cells are shown as controls.
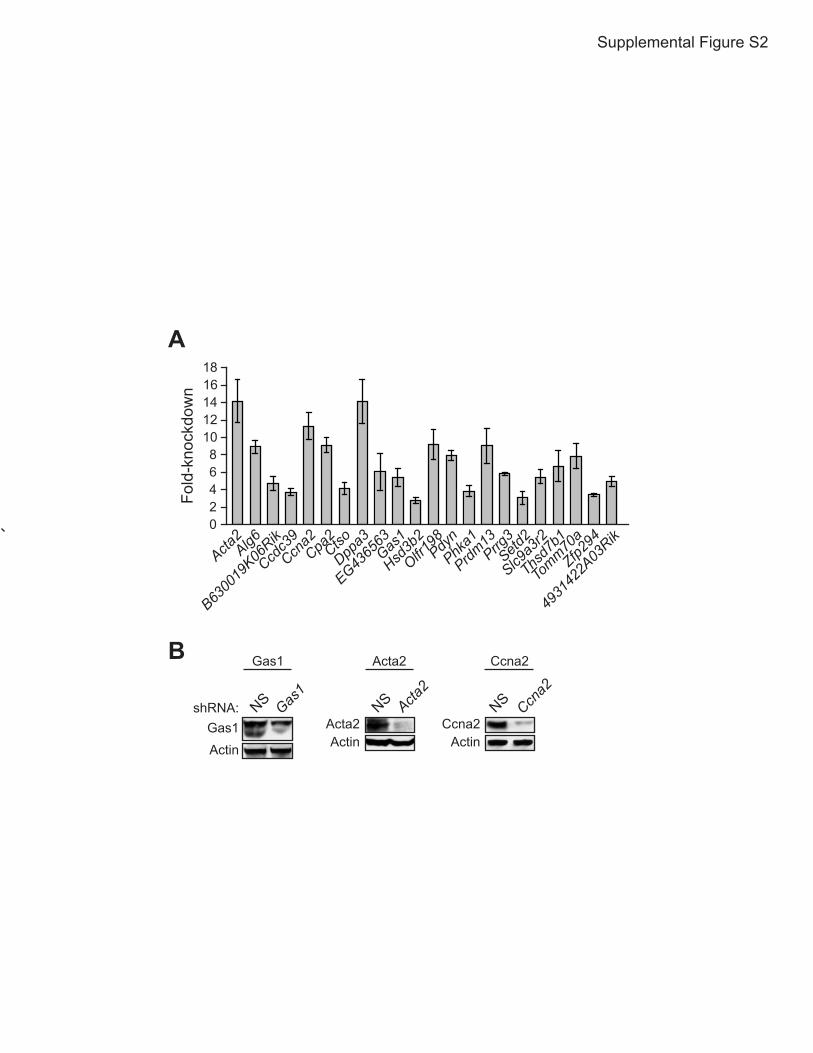
Supplemental Figure S2. Analysis of target gene expression in the B16-F0 knockdown cell
lines. (A) Quantitative real-time RT-PCR (qRT-PCR) confirmed in all cases that expression of
the target gene was decreased in each B16-F0 KD cell line. Error bars indicate SEM (n=3). (B)
Immunoblot analysis for Gas1, Acta2 and Ccna2. Actin is shown as a loading control.
Supplemental Figure S3. Three-dimensional cell culture assays and target gene analysis for
each of the candidate 22 B16-F0 knockdown cell lines using a second, unrelated shRNA. For all
22 genes, a second, unrelated shRNA directed against the same target also resulted in increased
formation of satellite colonies in the three-dimensional assay (A) and knockdown of target gene
expression (B). Error bars indicate SD (n=3).
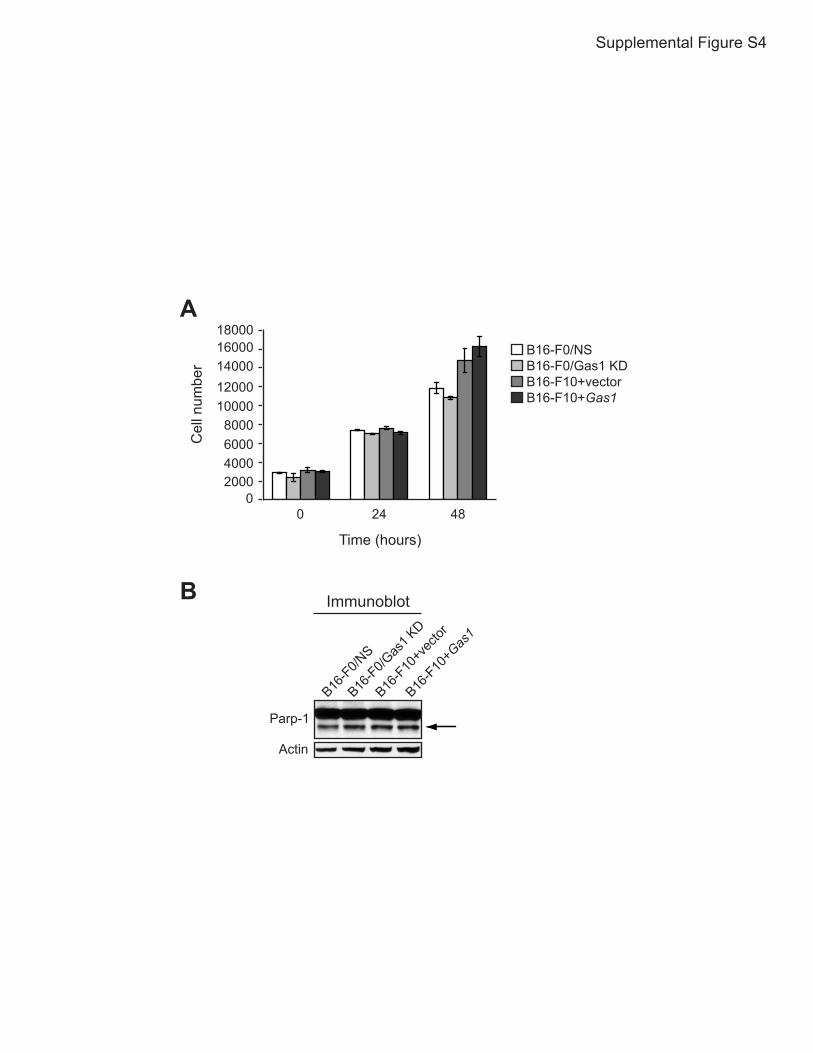
Supplemental Figure S4. Gas1 does not affect proliferation or apoptosis in cultured B16-F0 or
B16-F10 cells. (A) Proliferation of B16-F0 cells expressing a Gas1 or non-silencing (NS)
shRNA, and B16-F10 cells ectopically expressing Gas1 or empty vector was assessed at 24 and
48 hours. Error bars indicate SEM (n=3). (B) Levels of apoptosis in the indicated cultured cells
lines were determined by immunoblotting for Parp-1. Cleaved Parp-1, a marker of apoptosis, is
indicated by an arrow.

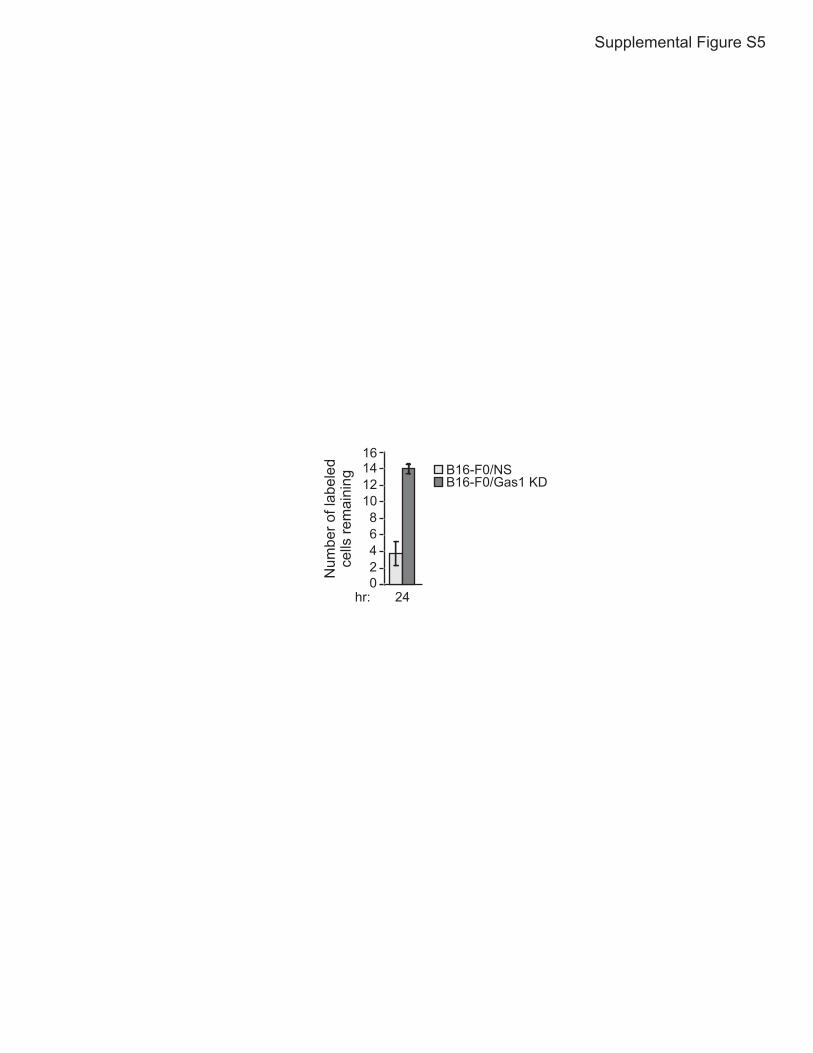
Supplemental Figure S5. Gas1 suppresses metastasis by promoting apoptosis of cells following
dissemination to secondary sites (24 hour time point). Quantitation of in vivo single-cell
fluorescence imaging of the lung 24 hours following tail vein injection of fluorescently labeled
B16-F0 cells stably expressing a Gas1 or NS shRNA. Error bars represent SEM (n=3 mice);
p=0.0027.
Supplemental Figure S6. Ectopic expression of the anti-apoptotic protein Bcl-2 increases
satellite colony formation in the 3-D cell culture assay. B16-F0 cells stably expressing Bcl-2 or
vector were grown for 8 days in the 3-D cell culture system. Satellite colonies were counted
under 100X magnification. Error bars indicate SEM (n=3).
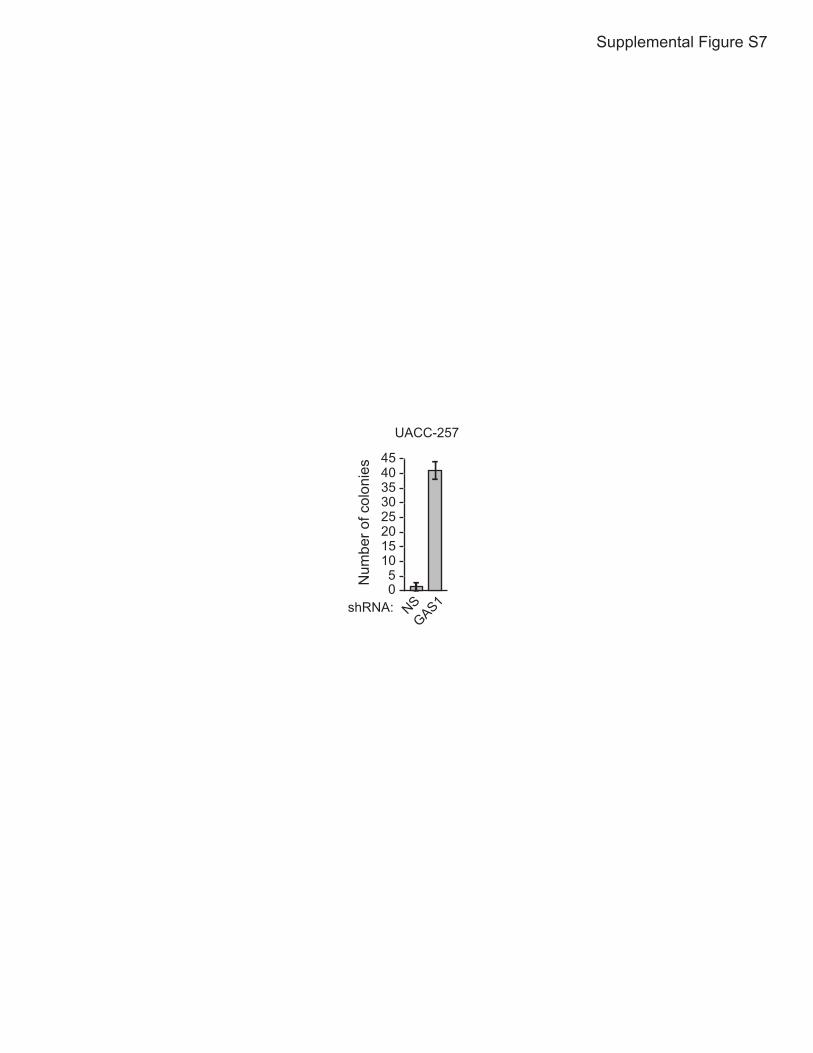
Supplemental Figure S7. Knockdown of GAS1 in UACC-257 cells increases their ability to
form satellite colonies in the 3-D cell culture assay. Human melanoma UACC-257 cells stably
expressing a GAS1 or NS shRNA were grown for 8 days in the 3-D cell culture system. Error
bars indicate SEM (n=3).
Supplemental Figure S8. GAS1 expression is reduced in Mel-STR cells relative to Mel-STV
cells. qRT-PCR analysis of Gas1 expression in immortalized human melanocyte Mel-STV
(vector) cells relative to Mel-STR (Ras-expressing) cells. Error bars represent SD (n=3). The
results show that GAS1 expression is reduced ~6-fold in Mel-STR cells relative to Mel-STV
cells.
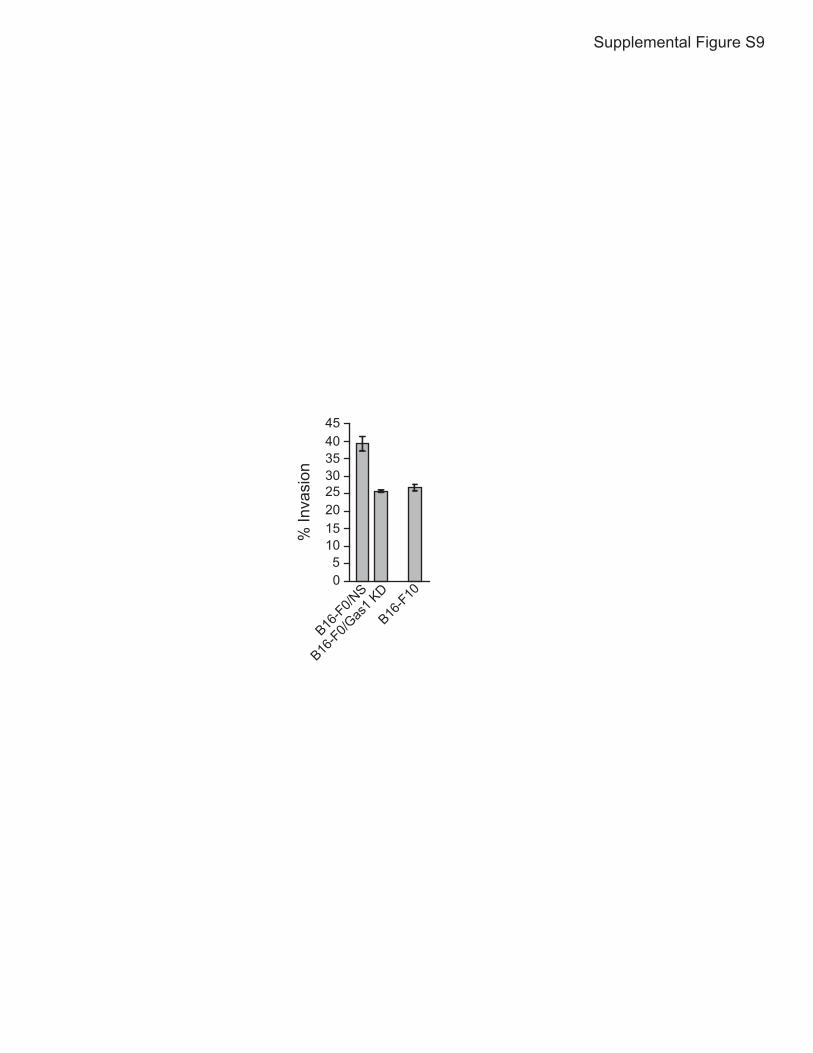
Supplemental Figure S9. Knockdown of Gas1 does not increase the invasion of B16-F0 cells.
Transwell/Boyden chamber assays comparing the invasion of B16-F0/Gas1 KD, B16-F0/NS, and
B16-F10 cells. Cells were placed in the upper compartment of the Transwell/Boyden chamber
and invasion and migration into the lower chamber was measured 48 hours later. Invasion

percentage was determined by dividing the number of cells that invaded by the number of cells
that migrated. Error bars indicate SEM (n=3).
Supplemental Figure S10. Gas1 does not affect expression of Gli1, a marker of Sonic
hedgehog signaling, in B16 mouse melanoma cells. Immunoblot analysis monitoring Gli1
expression in B16-F0 cells expressing a Gas1 or non-silencing (NS) shRNA, and in B16-F10
cells ectopically expressing Gas1 or empty vector. Actin was monitored as a loading control.
The results show that Gas1 knockdown in B16-F0 cells or Gas1 over-expression in B16-F10
cells does not affect Shh signaling.
Supplemental Figure S11. Down-regulation of ACTA2, CTSO, SLC9A3R2 and DPPA3 in
human metastatic melanoma cell lines and tissue samples. (A) ACTA2, CTSO and SLC9A3R2
expression in benign nevi (blue), primary melanoma (yellow) and metastatic melanoma (red).
(B) DPPA3 expression in advanced (red) versus early (blue) stage melanoma. Data were
obtained through the Oncomine database; a Student’s t-test, performed directly though the
Oncomine 3.0 software, showed the difference in gene expression between the samples was
significant.
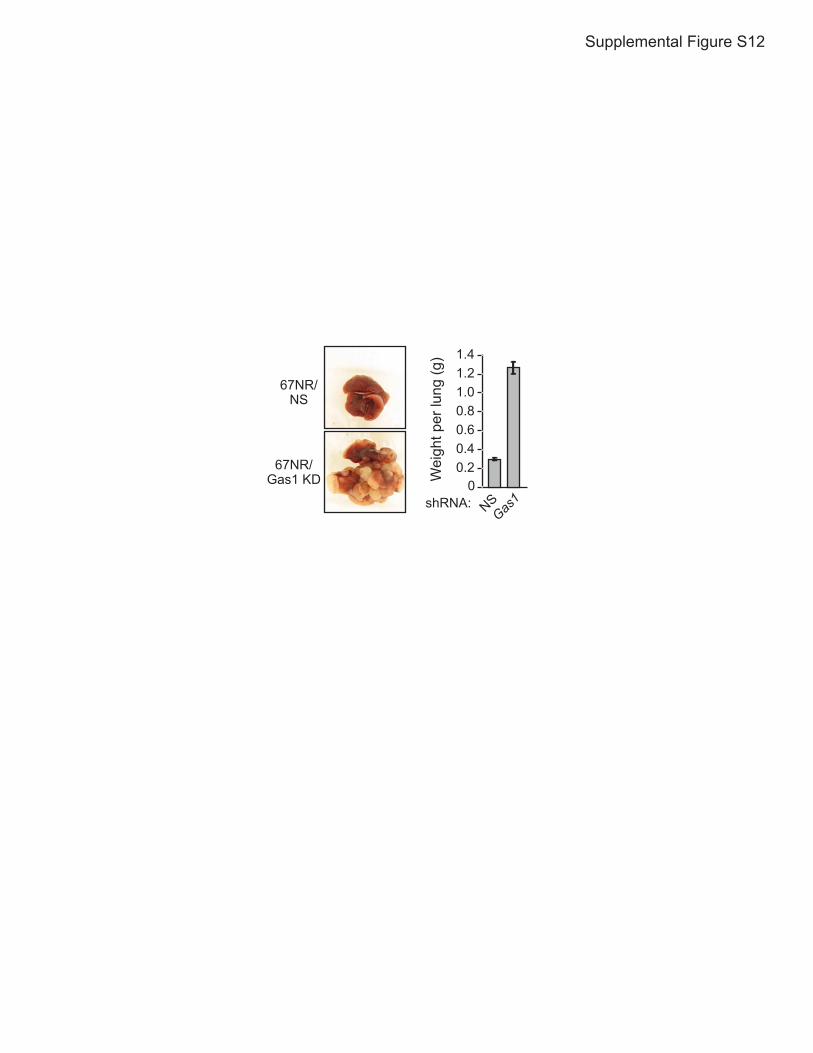
Supplemental Figure S12. Knockdown of Gas1 in the mouse breast cancer cell line 67NR
increases lung metastasis. Left, mouse tail vein metastasis assay showing lungs from mice
injected with 67NR cells stably expressing a Gas1 or NS shRNA. Right, quantitation of lung
weight. In contrast to the experiments performed with B16 cells, in which the number of
metastases could be directly counted, here metastasis was quantified by weighing the lungs;
direct counting was not possible due to the large number of metastases, the large size of the
metastatic nodules, and the lack of pigmentation. Error bars represent SEM (67NR/NS, n=9
mice; 67NR/Gas1 KD, n=12 mice).
Acta2 Adamts16 Agl Alg6 Atg7 Baiap2 Bnip1 B630019K06Rik
Cabyr Cav2 Ccdc39 Cdc26 Centd1 Cldnd2Cd5
Dkc1
Col24a1 Cpa2 Crkl Ctso Dazl Ddhd2 Degs2 Dgkb
Gimap6
Nbeal2
Dmrta1 Dnajb10 Dppa3 Gas1
Gprasp1 Hsd3b2 Map2k2 Maz Mettl5 Mipep Muc19
Nme7
EG436563
Ccna2
Fchsd1 Fignl1
N6amt1 Olfr198 Optc Otud4 Pclo Pcsk6
Pdyn Phka1 Pramel3 Prdm13Ppp1r10 Prrg3 Ran Rfx2
Ss18l1 Thsd7b
Zadh1 Zcchc9
9630031F12Rik
1500011H22Rik
4732496O08Rik
4931422A03RikZc3h13 Zfp294
Uqcrc2Topbp1 Tomm70a Ttc17 Ubn1 Ugt2b34
Robo2 Sccpdh Setd2 Slc9a3r2 Slc25a1 Spc25
Supplemental Figure S1
NS B16-F10
14
18
12108
4
0
Fold
-kno
ckdo
wn
6
2
Acta2Alg6
B6300
19K06
Rik
Ccdc3
9
Ccna2
Ctso
Dppa3
Gas1
Hsd3b
2
4931
422A
03Rik
Olfr198Pdy
nPhk
a1Prrg
3Setd
2
Slc9a3
r2
EG4365
63
Thsd7
b1
Tomm70
a
Zfp294
Prdm13
Cpa2
16
Supplemental Figure S2
B
A
Gas1 Acta2 Ccna2
NS NS NSGas1
Acta2
Ccna2
Gas1Actin
Acta2Actin
Ccna2Actin
shRNA:

Supplemental Figure S3
Zfp294
Ctso
4931422A03Rik
Phka1
Ccna2Alg6 Cpa2B630019K06Rik Ccdc39Acta2
EG436563Dppa3 Olfr198Gas1 PdynHsd3b2
Prrg3 Thsd7b Tomm70aSetd2 Slc9a3r2Prdm13
A
B
14
18
12108
4
0
Fold
-kno
ckdo
wn
6
2
Acta2Alg6
B6300
19K06
Rik
Ccdc3
9
Ccna2
Ctso
Dppa3
Hsd3b
2
Tomm70
a
Olfr198Pdy
nPhk
a1Prrg
3Setd
2
Slc9a3
r2Gas
1
Tdpoz
2Ths
d Zfp
Prdm13
Cpa2
16
NS
4931
422A
03Rik
Supplemental Figure S4
Cel
l num
ber
0
A
2000400060008000
1000012000
1600014000
18000B16-F0/NSB16-F0/Gas1 KDB16-F10+vectorB16-F10+Gas1
Time (hours)
Immunoblot
Parp-1
Actin
B16-F
0/NS
B16-F
0/Gas
1 KD
B16-F
10+v
ector
B16-F
10+G
as1
B
240 48
Num
ber o
f lab
eled
cells
rem
aini
ng
16
10
0hr: 24
1214
Supplemental Figure S5
8
246
B16-F0/NSB16-F0/Gas1 KD

Supplemental Figure S6
Num
ber o
f col
onie
s
16
101214
8
246
Bcl-2
vecto
r0
18
B16-F0
Supplemental Figure S7
Num
ber o
f col
onie
s
40
253035
20
51015
0
45
UACC-257
GAS1NSshRNA:

GAS1
Rat
io o
f nor
mal
ized
mR
NA
leve
ls (M
el-S
TV/M
el-S
TR)
9
45
3210
678
Supplemental Figure S8
0
% In
vasi
on
Supplemental Figure S9
B16-F
0/NS
B16-F
0/Gas
1 KD
B16-F
10
51015202530354045

Gli1
Actin
B16-F
0/NS
B16-F
0/Gas
1 KD
B16-F
10+v
ector
B16-F
10+G
as1
Supplemental Figure S10

A ACTA2
T-test: 4.363 P-value: 1.4E-4
-3.0
2.01.00.0
-2.0-1.0
-4.0
CTSO
T-test: 3.026 P-value: 0.006
3.02.01.00.0
-2.0-1.0
BSLC9A3R2
T-test: 4.827 P-value: 3.7E-4
3.02.01.00.0
-2.0-1.0
DPPA3
T-test: 2.95 P-value: 0.014-2.5
-0.5
-1.5
0.0
-2.0
-1.0
0.51.0
Nor
mal
ized
expr
essi
on u
nits
Nor
mal
ized
expr
essi
on u
nits
Nor
mal
ized
expr
essi
on u
nits
Nor
mal
ized
expr
essi
on u
nits
Supplemental Figure S11
https://mail.umassmed.edu/Judy.Mondor/Inbox/No%20Subject-2734.EML/1_multipart_xF8FF_1_MSG.9:3.doc/C58EA28C-18C0-4a97-9AF2-036E93DDAFB3/MSG.9_3.doc?attach=1
67NR/NS
67NR/Gas1 KD W
eigh
t per
lung
(g)
1.2
0.8
0.4
0
1.4
1.0
0.6
0.2
Gas1NSshRNA:
Supplemental Figure S12