Supplementary Materials for -...
22
www.sciencemag.org/content/362/6418/1025/suppl/DC1 Supplementary Materials for Cultural flies: Conformist social learning in fruit flies predicts long-lasting mate-choice traditions Etienne Danchin*†, Sabine Nöbel*, Arnaud Pocheville*, Anne-Cecile Dagaeff, Léa Demay, Mathilde Alphand, Sarah Ranty-Roby, Lara van Renssen, Magdalena Monier, Eva Gazagne, Mélanie Allain, Guillaume Isabel *These authors contributed equally to this work. †Corresponding author. Email: [email protected] Published 30 November 2018, Science 362, 1025 (2018) DOI: 10.1126/science.aat1590 This PDF file includes: Materials and Methods Figs. S1 to S11 Tables S1 and S2 References
Transcript of Supplementary Materials for -...

www.sciencemag.org/content/362/6418/1025/suppl/DC1
Supplementary Materials for
Cultural flies: Conformist social learning in fruit flies predicts long-lasting mate-choice traditions
Etienne Danchin*†, Sabine Nöbel*, Arnaud Pocheville*, Anne-Cecile Dagaeff, Léa Demay, Mathilde Alphand, Sarah Ranty-Roby, Lara van Renssen, Magdalena Monier, Eva Gazagne, Mélanie Allain, Guillaume Isabel
*These authors contributed equally to this work.
†Corresponding author. Email: [email protected]
Published 30 November 2018, Science 362, 1025 (2018) DOI: 10.1126/science.aat1590
This PDF file includes:
Materials and Methods Figs. S1 to S11 Tables S1 and S2 References

2
S1 Materials and Methods
S1.1 Fly ecology, strains and maintenance
We used the common laboratory Canton-S strain of Drosophila melanogaster. Flies were raised in 30 ml vials containing standard corn flour-agar-yeast medium in a room at 25°C ± 1°C and 60% ± 5% humidity with a 12:12 h light:dark cycle. Flies were sorted without anaesthesia within 6 h after emergence and kept in unisex groups of 7 individuals for 3 days to ensure virginity (except for criterion 2 where demonstrator females of the across age-classes experimental treatment were kept for 14 days). All flies were wild type, except when specified (i.e. in Criterion 4 where we used coloured males of 2 mutant strains in a Canton-S background in some of the mate-choice tests). Fly manipulations were performed by gentle aspiration using glass pipette, tubing and gaze, allowing us to transfer copulating pairs without them to part.
All flies were 3-day old virgin males and females, except for the across age-classes treatment (Criterion 2) where demonstrator and observer females were 14- and 3-day old respectively. This 11 day age difference corresponds to a generation time at 25°C. All devices were cleaned with alcohol before reuse.
Fruit fly ecology is poorly known. For instance, the common wisdom is that adult survival in nature ranges from 3-4 days up to 2 weeks. The absence of such information is due to the fact that it is impossible to mark individual flies in order to monitor their life history traits. In the lab a small fraction of adult flies can survive up to 50 days. Emergence of new imagoes occurs every day so that natural populations are made of adults of various age classes. Males produce a sex peptide (37) that blocks their mate’s libido for several days after copulation during which females actively reject courting males.
S1.2 General experimental protocol
All experiments encompassed two phases: a demonstration that lasted for a maximum of 30 minutes during which the observer female was given the opportunity to see a demonstrator female choosing between a green and a pink male. Copulations usually occurred within 10 minutes, implying that the observer female could see the actual copulation for about 20 minutes. Demonstrations ended when the demonstrator pair separated in the tube device, or when the last demonstrator male dismounted in the hexagon device. Demonstrations were followed by a mate-choice test during which each observer female was given the choice between a new green and a new pink male. The rare replicates in which the observer female did not copulate after 30 minutes were discarded. Mate-choice tests ended at the onset of the copulation. Demonstrations unfolded either in tubes or in hexagons, while mate-choice tests were always performed in tubes.
S1.3 Specific protocols
Social long-term memory We used an experimental design inspired from the one used to study long-term memory in an olfactory aversive conditioning context (22, 40). All observer females were fed on a 1 cm x 2.5 cm piece of Whatman filter paper soaked with 125 µl of 5%-sucrose solution for 17-21 hours before demonstrations. Demonstrations consisted of a sequence of five demonstrations spaced by a 15-30 min resting periods. There were four experimental groups, the first two receiving the sucrose solution and the last two receiving the sucrose solution plus a 35 mM cycloheximide solution (94% purity; Sigma C7698, St Louis, MO, USA) diluted in mineral water (pH ¼ 7; Evian, Danone, Paris, France). The first two treatments used a transparent (informed) or opaque (uninformed controls) partition during demonstrations, and mate-choice tests unfolded 24 hours later. The third group followed exactly the same protocol as the informed group, but for the addition of the cycloheximide to the sucrose solution to block the suspected de novo protein synthesis. The fourth group comprised cycloheximide treated observer females that were allowed to watch a single demonstration and that were tested immediately after (short-term memory). Finally, we used the horizontal control of Fig. 2 as a positive control as the latter was performed with the same protocol, but the cycloheximide treatment, and at the same time.

3
Transmission chain We performed 36 transmission chains in hexagons. At each step we put 12 observer females in the central arena, which lead to similar social learning (41). At chain initiation, we introduced a trio of one already copulating pair plus an apparently rejected male of the other colour in each peripheral compartment, the six copulating males being of the same colour. After the end of the demonstrations each observer female was individually transferred into tube designs ordered from 1 to 12 and containing one male of each colour, then monitored for courting behaviour. If the tube design number one met our quality criteria (copulation initiated after the 2 males had actively courted the female with characteristic wing-flapping behaviour (39)), the trio of the copulating female plus the other male was transferred into a peripheral chamber of the next hexagon as part of the demonstration for the next set of 12 observer females; if it did not verify this quality criterion, we ignored it and skipped to tube design number 2, and so on until we were able to fill all 6 peripheral compartments of the next hexagon step. Thus, apart from the first step, demonstrations were provided by formerly observer females freely choosing between one green and one pink male. The chain ended when 3 or more of them chose the colour opposite to the one chosen at the chain initiation (preference ≤ 50%). To validate our simulation model, we further compared our experimental results to those of 4 batches of 36 simulations under these specific experimental conditions: observer population size = 6, initial preference = 1, mate-copying index of 0.68 (the observed average of 1,737 informed replicates) and a copying function as in the white curve of Fig. 7A.
S1.4 Mate-copying and social learning indices
Every replicate was scored as 1 if during the mate-choice test the observer female chose the male of the colour that was selected during the preceding demonstration, versus 0 in the opposite case. Every observer female being used only once, the Mate-Copying Index (MCI) was the mean of these scores over replicates of one experimental condition and represented the proportion of observer females of that experimental condition that copulated with the male of the colour that copulated during the demonstration. These Mate-Copying Indices are used in Fig. S7 to S11. Values significantly above 0.5 reveal mate-copying.
To illustrate the strength of social learning per se, we used a Social Learning Index (SLI) varying from -1 to +1 and quantifying the difference between observed mate-copying indices and those predicted under random choice (50%): SLI = [NbSame – NbOther] / [NbSame + NbOther] = 2*(MCI – 0.5) where NbSame and NbOther are the number of replicates with a mate-copying score of 1 or 0 respectively. By quantifying the bias relative to random choice induced by the demonstration in favour of the male colour that was preferred during the demonstration, the Social Learning Index quantifies social learning efficiency. For instance, if observer females chose the male of the colour chosen during demonstrations in 70 cases and chose the other male in 30 cases, the Social Learning Index would be (70-30)/(70+30) = 0.40. We used SLI to illustrate results in the paper but provide here figures with the mate-copying indices (Fig. S7 to S11).
S1.5 Statistical analyses
All statistical analyses and simulations were performed with the R software (version 3.3.2 2016; packages used: lme4, car, binGroup, binom, as well as DAKS for simulations).
Controlling for potential confounding effects We first built a data set of all mate-copying replicates and used it to test potential confounding effects (Table S1). In particular, in all previous experiments on social-learning in Drosophila melanogaster (18-20, 23, 24, 41) we noticed a weather effect on social-learning that we tested in (20). As in the meantime our data set greatly increased, we re-tested that effect plus all potential confounding effects on the data set pooling all data from the present paper plus that previous paper (20). That data set contained 4,167 replicates for which the observer female was in a position to choose between the green and pink males, of which 2,280 concerned replicates in which the observer female was in a position to learn, thus excluding uninformed controls. We used that data set

4
to test 18 potential confounding effects, all of which but three proved to be non-significant (Table S1). Thus, in this paper, except for binomial tests that cannot be multivariate, all statistical analyses included the Block as a random effect, as well as the Experimenter-ID (when a data sets involved more than one experimenter) and Air-pressure as fixed effects.
The Experimenter-ID effect was probably due to the fact that most experimenters participated to part of the experiments. However, one experimenter always performed replicates of all treatments of a given experiment simultaneously, implying that this effect could neither have generated some of the experimental effect. Finally, this effect was not influential as the conclusions of all statistical analyses were not affected by the fact of including it or not (compare Fig. 1 to 4 and 6 with Fig. S7 to S11).
Analyses of each criterion The departure of each treatment from random choice was tested with a binomial test. As binomial tests are univariate, these tests could not account for the Block, Experimenter-ID and Air-pressure effects. All other analyses used generalised linear mixed models with random effects (function glmer). They analysed mate-copying scores as a function of the experimental treatment, while accounting for the three significant confounding effects, Block as a random effect, and Experimenter-ID and Air-pressure as fix effects. Starting models included these effects plus interactions, and we reduced it by backward selection.
However, ignoring the three confounding effects resulted in very similar results. Fig. S7 to S11 replicate those of the paper replacing the Y axes by the mate-copying index (i.e. the proportions of flies choosing the male of the colour that was chosen during the demonstration) and provide the P values obtained without accounting for the Block, Air-pressure and Experimenter-ID effects. Results were only marginally changed (compare P values of Fig. S7 to S11 ignoring confounding effects with those of Fig. 1 to 5), revealing the robustness of our conclusions to the inclusion or exclusion of potential confounding effects.
Analyses of transmission chains
The probability Pi of one hexagon to keep the majority of the previous step under the null hypothesis that demonstrator females choose with probability p and the opposite with probability 1-p is:
Pi = C(6,4)*p4*(1-p)2 + C(6,5)*p5*(1-p)1 + C(6,6)*p6*(1-p)0 where C(n,m) = n! / (m!*(n-m)!) In our case p = 1-p = 0.5 and Pi = 0.3438. Pi was used in two types of tests. The first test considers each
step as an independent data point using a binomial test from one step to the next [Binomial test of parameters number of chains still alive after step x+1 (i.e. success) and step x respectively, tested against the null probability of Pi = 0.3438; these tests are reported in Fig. 6A and Table S2.1]. The second test considers each chain as a whole in Binomial tests with the first parameter being the number of chains still alive after step x+1 (i.e. success) and the initial number of chains (i.e. 36), and testing against the probability of (0.3438)x (reported in Fig. 6B and Table S2.2).
Using the same reasoning, the probability that at each step at least 3 (half) of 6 observer females choose the incorrect colour with a probability of choosing the colour chosen during the demonstration of 0.68 (the average mate-copying index calculated from 1737 informed replicates) is: Pi(X>3) = C(3,6)*p3*(1-p)3 + C(4,6)*p4*(1-p)2 + C(5,6)*p5*(1-p)1 + C(6,6)*p6*(1-p)0 = 0.2936
Thus, with a population of only 6 observer females the chance of ending the transmission chain at each step is fairly high (~29%). This probability drops to 0.1876, 0.0719, 0.0305, 0.0061, 0.0001 and <0.0000 with a population of 10, 20, 30, 50, 100 and 150 observer females respectively (a calculator can be found at (https://www.di-mgt.com.au/binomial-calculator.html). This is why transmission chains durations in our experiment (Fig. 6) were short compared to those simulated with populations of 75, 100 or 150 observer females (Fig. 7B and C, and S4 to S6). Nonetheless, they lasted significantly longer than under the null hypothesis of observer female having not learned to prefer males of the colour that copulated during the demonstration (Fig. 6, significance in Table S2).

5
S1.6 Modelling the emergence of arbitrary local traditions in mating preference
We modelled a population as evenly composed of two kinds of females: demonstrator females, which are currently mating, and observer females. These females are engaged in a transmission chain in which observer females of a given step become the demonstrators of the next step, and so on. Demonstrators freely choose among pink or green males (in non-limiting amounts) with a given probability according to their already acquired preference, while the observers build a preference according to the mean behaviour observed in the demonstrator population. A key parameter of the model was the number n of observer females within the population. Assuming a balanced sex-ratio, the total adult population would be of at least 4n adult flies. The setting of their preference follows the response functions given in Fig. S3. For instance, for the white line (f is the frequency of choosing pink in demonstrator females, p is the probability of choosing pink in observer females): (a) if 0 < f < 0.4 in the demonstration, then p = 0.3 in the observer population; (b) if 0.6 < f < 1 in the demonstration, then p = 0.7 in the observer population; (c) if 0.4 < f < 0.6 in the demonstration, then p in the observer population conservatively follows a straight line joining the two plateaus.
At the following transmission step, the formerly observer females become demonstrator females, and now freely choose among pink or green males according to their learned preference, while a new batch of observer females can watch them and build their preference on the demonstrator choices. The process is repeated. All females belonging to the same category (demonstrator vs observer) at a given time step have the same probability to choose pink or green. The number of individuals is assumed to be constant through time. At the beginning of one simulation, the population of mating females is composed of demonstrator females with no preference, that is, with a probability f of choosing pink equal to 0.5, except for simulations of the transmission chains that initiated with f = 1.
We performed a graphical analysis to single out stable and unstable equilibria in the case where the dynamics is assumed to be deterministic (i.e. infinite population). To account for stochastic processes (finite populations) we simulated the dynamics in an individual-based model using the R software.
As observed in this study, the white line of Fig. S3 models the mate-copying response function of the probability that an observer female chooses pink in function of the frequency of demonstrator females choosing pink at the previous transmission step. We also assumed it to be symmetrical and continuous. As observed in this study (Fig. 5), for frequencies of choosing pink in the demonstrator population below 0.4 (and symmetrically above 0.6), the probability that an observing female chooses pink is constant (first plateau). Between 0.4 and 0.6, the response is conservatively assumed to increase linearly. Under these assumptions, the response function is defined by two parameters, the height of the first plateau π and the threshold φ beyond which the response quits the plateau. To match results of Fig. 5, in all of our simulation we fixed π = 0.3 and φ = 0.4, except in simulations of Fig. 7 where we fixed π = 0.32, i.e. 1-0.68, the latter value being the average mate-copying index calculated from 1737 informed replicates to match the specific conditions of transmission chains. In Fig. S3 note that the threshold φ corresponds to the fraction closest to 0.5 that is attainable with our 6 compartment experimental device, i.e. φ = 2/5 = 0.4.
In infinite populations, the dynamics is deterministic. A graphical analysis shows that with a mate-copying strategy corresponding to the white line of Fig. S3 (where π < φ), the dynamics of the frequency of choice f has two stable equilibria (f = π and f = 1 - π, the two white dots on Fig. S3) and one unstable equilibrium corresponding to no preference (f = 0.5, black dot of Fig. S3).
We also simulate a situation without conformity corresponding to the blue line of Fig. S3 where φ < π < 0.5, which leads to a single stable equilibrium (no preference, f = 0.5, black dot of Fig. S3) as we found in the thin blue line of Fig.7C.
Impact of population size In finite populations, at every step the choice of demonstrator females represents a sample of the preference in the population. Simulations of an individual-based model using the R software (version 3.3.2 2016; packages used: lme4, car, binGroup, binom and DAKS) shows how the dynamics has periods of population mate-choice preference of different durations, with sampling effects leading preferences to sometimes randomly shift from pink to green preference and vice-versa. All other parameters being equal, the mean duration of such population

6
preferences greatly increased with population size, except in the absence of conformity (Fig. 7B). These periods of mate-choice traditions correspond to the stable equilibria of the infinite population size model. We also simulated a situation without conformity corresponding to the blue line of Fig. S3 where φ < π < 0.5, which leads to a single stable equilibrium (no preference, f = 0.5, black dot of Fig. S3) as we document in the thin blue line of Fig 7C.
Impact of copying rate The parameter π provides a measure of the copying rate. For a given population size the duration of episodes of population preference was positively related to π. For instance, with π = 0.2 we obtained situations similar to that of Fig. S6 (i.e. 150 observer females when π = 0.32 leading traditions to last for more than 100,000 transmission steps) with a population of only 50 observer females (pink and circle curve of Fig. 7B).
Examples of dynamics obtained in our simulations Here are more results using different parameter settings to illustrate the importance of population size. While the ecology of Drosophila melanogaster in the field is poorly known, we performed a quick field estimation of the fruit fly population exploiting a single average size fig tree (Toulouse, South of France). The number of flies per fig varied from 0 to 14 at a time. As there were at least 500 figs in that tree this led to a minimum of 1,000 flies in that single tree, well above the population sizes used in these simulations.
Based on Criterion 3, we can consider that transmission steps can occur every day, one generation thus corresponding to 11 transmission steps in our simulation model. Note however, that all the extrapolations to estimate the durations of traditions in all the following simulations are purely theoretical and rest on the assumption that transmission steps occur in infinite and uninterrupted sequences. They are only meant to illustrate the potential of the documented social learning function to lead to the emergence of traditions.

7
A B
Figure S1: The experimental devices. A) The tube device used in most experiments. Informed females could watch through a transparent partition a demonstration in the other compartment. Uninformed females (controls) could not because the partition was opaque. B) The hexagon device used to test for conformity and transmission chains.
1.1 cm
Transparent or opaque partition
Transparent plastic tube
3 cm
Sliding door
Opaque or transparent
partition
Access to peripheral
compartments
Peripheralcompartments
Central arena

8
Fig. S2: Origin of the high mate-copying index observed in long-term memory. The left treatment replicates the usual experiment (except that in the 3 treatments here, flies did not receive sucrose before experiment) of a single demonstration immediately followed by a mate-choice. The two other treatment received 5 demonstrations spaced by 15-30 min resting periods. The middle treatment was spaced trained and mate-choice test followed immediately. The right bar duplicated the informed treatment of Fig3A and gave similar result. Thus, the high mate-copying index of Fig. 3 is observed again only in this condition, suggesting that the high index is observed only when spaced training is followed by a long delay during which de novo protein synthesis allows the establishment of long-term memory.

9
Fig. S3: Areas representing the set of possible response functions. X-axis: the frequency of choosing pink as shown by the population at transmission step t. Y-axis: mating preference acquired by observer females after watching demonstrator females; this preference will translate into a probability that an observer female chooses pink at the next transmission step. The line y = x corresponds to situations where the probability p that an individual chooses pink is equal to the frequency f of choosing pink in the demonstrator female population. In grey areas, (p > f), observer females copy the population choice with attenuation (their preference is closer to the mean), thus the preference in the population tends to regress towards the mean (black dot). In red areas (p < f), individuals copy the population choice with exaggeration (conformity), thus the preference in the population tends to go further away from the mean. In white areas, individuals do the reverse of the majority (ignored here). Blue line: without conformity.

10
A
B
Fig. S4: Simulations with conformity. Simulations as in the white line of Fig. 7A and thick dark-red line of Fig. 7C with a population of 75 observer females. A) Typical dynamics. Horizontal dotted line: mean expected value under random choice. B) Distribution of population preference durations obtained over one sequence of 100,000 transmission steps. Periods of tradition readily emerge (top: preference for pink males, bottom: preference for green males). Accepting that transmission steps occur every day (Fig. 3), 4,000 transmission steps would potentially represent almost 11 years, corresponding to about 350 generations.
Prop
ortio
n ch
oosi
ng P
ink
Dynamics of population mate-choice with conformity in a population of 75 observer females and a mate-copying index of 0.68
1 25,000 50,000 75,000 100,000
Transmission-step number
Distribution of durations of population preferences before preference change
Observed population preference durations (in number of transmission steps)
Freq
uenc
y
0 1,000 2,000 3,000 4,000
0
1
0
20
30
4
0
5
0

11
A
B
Fig. S5: Simulations with conformity. Simulations as in the white line of Fig. 7A with a population of 100 observer females. A) Typical dynamics. Horizontal dash line: mean expected value under random choice. B) Distribution of population preference durations obtained over one sequence of 100,000 transmission steps. Under these conditions, traditions lasted for very long periods, and mean maximum traditions duration over 5 simulations was of over 16,000 transmission steps. Accepting that transmission steps occur every day (Fig. 3), 25,000 transmission steps would potentially represent some 68 years, corresponding to about 2,200 generations.
Prop
ortio
n ch
oosi
ng P
ink
1 25,000 50,000 75,000 100,000
Transmission-step number
Distribution of durations of population preferences before preference change
Freq
uenc
y
0 5,000 10,000 15,000 20,000 25,000
0
2
4
6
8
10
12
Observed population preference durations (in number of transmission-steps)

12
Fig. S6: Simulations with conformity. Simulations as in the white line of Fig. 7A with a population of 150 observer females. Typical dynamics obtained over a sequence of 100,000 transmission steps. Note that the horizontal grey dash line that represents the mean expected value under random choice is situated at the bottom of the figure, meaning that in this specific simulation a tradition for pink emerged at the beginning of the simulation and remained unchanged over the 100,000 transmission steps of the simulation. This kind of dynamics was obtained in 4 of the 5 performed simulations with these parameters. In the fifth one we observed only one tradition change. Accepting that transmission steps occur every day (Fig. 3), 100,000 transmission steps would theoretically represent almost 275 years, corresponding to about 9,000 generations.
Prop
ortio
n ch
oosi
ng P
ink
Dynamics of population mate-choice with conformism in a population of 150 observer females and a mate-copying index of 0.68
1 25,000 50,000 75,000 100,000
Transmission-step number

13
Fig. S7: Criterion 1 of social learning. Figure equivalent to Fig. 1C but replacing the Y axis by the mate-copying index. Vertical bars: Agresti-Coull-intervals.
14
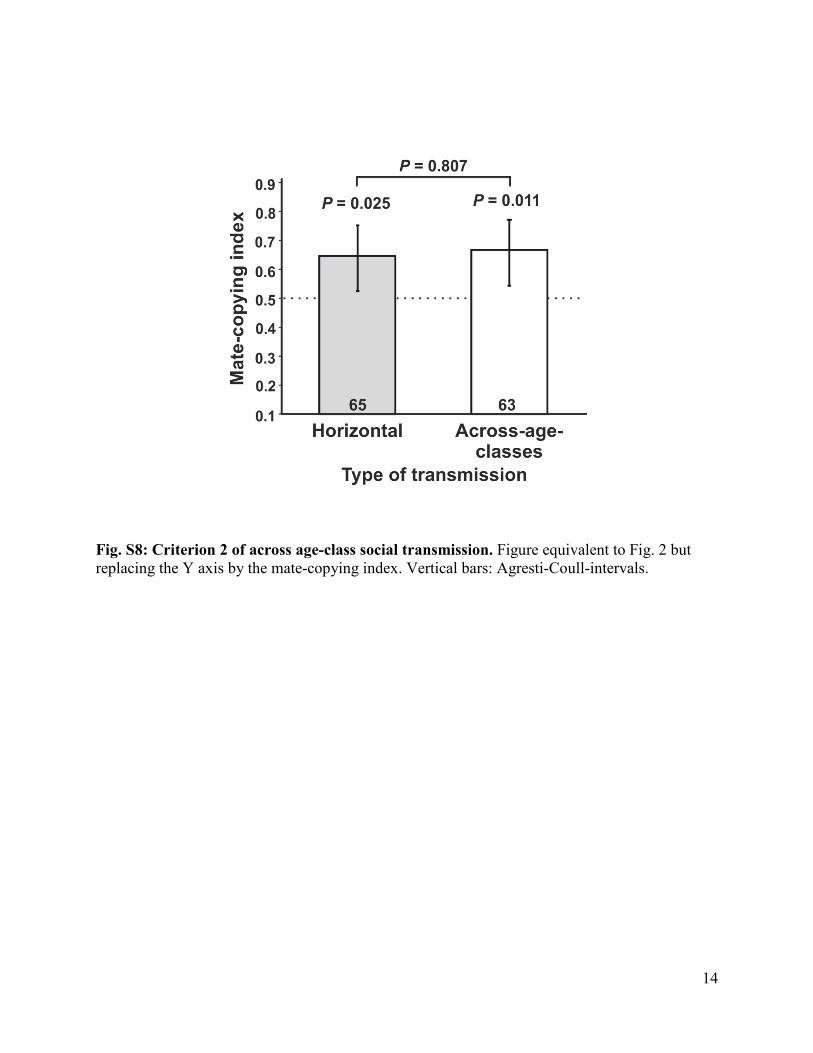
Fig. S8: Criterion 2 of across age-class social transmission. Figure equivalent to Fig. 2 but replacing the Y axis by the mate-copying index. Vertical bars: Agresti-Coull-intervals.

15
Fig. S9: Criterion 3 of durability of socially acquired mating-preferences. Figure equivalent to Fig. 3 but replacing the Y axis by the mate-copying index. Vertical bars: Agresti-Coull-intervals.

16
Fig. S10: Criterion 4 of trait-based copying. Figure equivalent to Fig. 4 but replacing the Y axis by the mate-copying index. Vertical bars: Agresti-Coull-intervals

17
Fig. S11: Criterion 5 of conformity is mate-copying. Figure equivalent to Fig. 5 but replacing the Y axis by the mate-copying index. Vertical bars: Agresti-Coull-intervals.

18
Table S1: Significance of potential confounding effects. As sample size is rather big (n = 2,280), for model selection we used a strict 0.05 threshold or the BIC information criterion, which is more suitable than AIC when using big data sets. These methods always led to the same conclusion. Bold: significant effects. The experimenter effect was largely due to the fact that different experimenters participated to different experiments. In all statistical analyses the three significant confounding effects were introduced either as random effects (Block) or as a fixed effect (Experimenter ID and Air pressure). However, note that accounting or ignoring them did not change any of our conclusions.
Potential confounding effect P value Time of demonstration 0.116 Quadratic regression: Time of demonstration + (time of demonstration)2 0.886 0.778 Room temperature at the onset of experiment 0.484 Room humidity at the onset of experiment 0.361 Type of medium used to raise flies 0.071 Year 0.404 Tube position in a batch of 6 simultaneously run tube devices 0.569 Actual tube device used (each device had an ID) 0.19 Fly strain (Rovers and sitter versus wild type Canton-S) 0.857 Experimental question: the five criteria of this paper, and those of previous papers
0.611
Demonstration device: tubes versus hexagons 0.761 Type of demonstration (free choice versus already formed copulating pairs) 0.579 Colour shown during demonstration 0.151 Day (may capture part of the Air-pressure effect) 0.31 Demonstration duration 0.823 Experimenter-ID effect 0.00049 Block 0.0001 Air pressure 0.0053

19
Table S2: Description of the binomial tests comparing observed transmission-chain durations to the ones that would be expected if all females selected randomly during the successive mate-choice tests. The purple left part compares for each step the observed proportion of chains that kept the initial population preference from one step to the next. This is thus a pairwise comparison that just tests the departure from random at each step independently from the previous transmission steps. In the blue right part, binomial tests take into account the fact that each step is part of a chain by comparing the observed frequency of surviving transmission chains since the beginning until step x to the theoretical one of (0.3438)x.
Step
x Observed number
of Chains
Success over N
Threshold under
random
Binomial test: P-value
Success over N
Threshold under
random(0.3438)^x
Expected Number
Observedover
Expected
Binomial test: P-value
0 36 36/36 36/36 36 1.001 25 25/36 0.3438 2.41E-05 25/36 0.34380 12.377 2.02 2.41E-052 16 16/25 0.3438 0.002758 16/36 0.11820 4.255 3.76 1.01E-063 11 11/16 0.3438 0.006484 11/36 0.04064 1.463 7.52 1.17E-074 8 8/11 0.3438 0.01086 8/36 0.01397 0.503 15.91 3.10E-085 5 5/8 0.3438 0.1335 5/36 0.00480 0.173 28.92 8.49E-076 5 5/5 0.3438 0.004803 5/36 0.00165 0.059 84.11 4.42E-097 2 2/5 0.3438 1.0000 2/36 0.00057 0.020 97.86 0.00028 1 1/2 0.3438 1.0000 1/36 0.00020 0.007 142.31 0.00718
1. Test (Fig. 7.A) 2.Test (Fig. 7.B)

20
References and Notes 1. A. Whiten, Culture extends the scope of evolutionary biology in the great apes. Proc. Natl. Acad.
Sci. U.S.A. 114, 7790–7797 (2017). doi:10.1073/pnas.1620733114 Medline
2. C. P. van Schaik, M. Ancrenaz, G. Borgen, B. Galdikas, C. D. Knott, I. Singleton, A. Suzuki, S. S. Utami, M. Merrill, Orangutan cultures and the evolution of material culture. Science 299, 102–105 (2003). doi:10.1126/science.1078004 Medline
3. H. Whitehead, Gene-culture coevolution in whales and dolphins. Proc. Natl. Acad. Sci. U.S.A. 114, 7814–7821 (2017). doi:10.1073/pnas.1620736114 Medline
4. A. Thornton, J. Samson, T. Clutton-Brock, Multi-generational persistence of traditions in neigh-bouring meerkat groups. Proc. R. Soc. London Ser. B 277, 3623–3629 (2010). doi:10.1098/rspb.2010.0611 Medline
5. L. M. Aplin, D. R. Farine, J. Morand-Ferron, A. Cockburn, A. Thornton, B. C. Sheldon, Experi-mentally induced innovations lead to persistent culture via conformity in wild birds. Nature 518, 538–541 (2015). doi:10.1038/nature13998 Medline
6. A. Mesoudi, Pursuing Darwin’s curious parallel: Prospects for a science of cultural evolution. Proc. Natl. Acad. Sci. U.S.A. 114, 7853–7860 (2017). doi:10.1073/pnas.1620741114 Medline
7. E. Danchin, L. A. Giraldeau, T. J. Valone, R. H. Wagner, Public information: From nosy neigh-bors to cultural evolution. Science 305, 487–491 (2004). doi:10.1126/science.1098254 Med-line
8. É. Danchin, A. Charmantier, F. A. Champagne, A. Mesoudi, B. Pujol, S. Blanchet, Beyond DNA: Integrating inclusive inheritance into an extended theory of evolution. Nat. Rev. Genet. 12, 475–486 (2011). doi:10.1038/nrg3028 Medline
9. É. Danchin, R. H. Wagner, Inclusive heritability: Combining genetic and nongenetic information to study animal behavior and culture. Oikos 119, 210–218 (2010). doi:10.1111/j.1600-0706.2009.17640.x
10. E. Avital, E. Jablonka, Animal Traditions: Behavioural Inheritance in Evolution (Cambridge Univ., 2000).
11. R. Brooks, The importance of mate copying and cultural inheritance of mating preferences. Trends Ecol. Evol. 13, 45–46 (1998). doi:10.1016/S0169-5347(97)01253-6 Medline
12. R. I. Bowers, S. S. Place, P. M. Todd, L. Penke, J. B. Asendorpf, Generalization in mate-choice copying in humans. Behav. Ecol. 23, 112–124 (2012). doi:10.1093/beheco/arr164
13. R. Boyd, P. J. Richerson, Culture and the evolution of human cooperation. Philos. Trans. R. Soc. London Ser. B 364, 3281–3288 (2009). doi:10.1098/rstb.2009.0134 Medline
14. J. Henrich, R. Boyd, The evolution of conformist transmission and the emergence of between-group differences. Evol. Hum. Behav. 19, 215–241 (1998). doi:10.1016/S1090-5138(98)00018-X
15. A. Kandler, K. N. Laland, Tradeoffs between the strength of conformity and number of conform-ists in variable environments. J. Theor. Biol. 332, 191–202 (2013). doi:10.1016/j.jtbi.2013.04.023 Medline
16. H. P. Yockey, Information Theory, Evolution, and the Origin of Life (Cambridge Univ., 2005).

21
17. A. Whiten, J. Goodall, W. C. McGrew, T. Nishida, V. Reynolds, Y. Sugiyama, C. E. G. Tutin, R. W. Wrangham, C. Boesch, Cultures in chimpanzees. Nature 399, 682–685 (1999). doi:10.1038/21415 Medline
18. F. Mery, S. A. M. Varela, E. Danchin, S. Blanchet, D. Parejo, I. Coolen, R. H. Wagner, Public versus personal information for mate copying in an invertebrate. Curr. Biol. 19, 730–734 (2009). doi:10.1016/j.cub.2009.02.064 Medline
19. A. Loyau, S. Blanchet, P. Van Laere, J. Clobert, E. Danchin, When not to copy: Female fruit flies use sophisticated public information to avoid mated males. Sci. Rep. 2, 768 (2012). doi:10.1038/srep00768 Medline
20. A.-C. Dagaeff, A. Pocheville, S. Nöbel, A. Loyau, G. Isabel, E. Danchin, Drosophila mate copy-ing correlates with atmospheric pressure in a speed learning situation. Anim. Behav. 121, 163–174 (2016). doi:10.1016/j.anbehav.2016.08.022
21. T. Tully, T. Preat, S. C. Boynton, M. Del Vecchio, Genetic dissection of consolidated memory in Drosophila. Cell 79, 35–47 (1994). doi:10.1016/0092-8674(94)90398-0 Medline
22. P. Smolen, Y. Zhang, J. H. Byrne, The right time to learn: Mechanisms and optimization of spaced learning. Nat. Rev. Neurosci. 17, 77–88 (2016). doi:10.1038/nrn.2015.18 Medline
23. P. Y. Plaçais, S. Trannoy, G. Isabel, Y. Aso, I. Siwanowicz, G. Belliart-Guérin, P. Vernier, S. Birman, H. Tanimoto, T. Preat, Slow oscillations in two pairs of dopaminergic neurons gate long-term memory formation in Drosophila. Nat. Neurosci. 15, 592–599 (2012). doi:10.1038/nn.3055 Medline
24. A. Loyau, J. H. Cornuau, J. Clobert, E. Danchin, Incestuous sisters: Mate preference for brothers over unrelated males in Drosophila melanogaster. PLOS ONE 7, e51293 (2012). doi:10.1371/journal.pone.0051293 Medline
25. M. Germain, S. Blanchet, A. Loyau, É. Danchin, Mate-choice copying in Drosophila melano-gaster: Impact of demonstration conditions and male-male competition. Behav. Processes 125, 76–84 (2016). doi:10.1016/j.beproc.2016.02.002 Medline
26. S. Nöbel, E. Danchin, G. Isabel, Mate-copying of a costly variant in Drosophila melanogaster females. Behav. Ecol. 29, 1150–1156 (2018). doi:10.1093/beheco/ary095
27. C. Efferson, R. Lalive, P. J. Richerson, R. McElreath, M. Lubell, Conformists and mavericks: The empirics of frequency-dependent cultural transmission. Evol. Hum. Behav. 29, 56–64 (2008). doi:10.1016/j.evolhumbehav.2007.08.003
28. E. J. C. van Leeuwen, R. L. Kendal, C. Tennie, D. B. M. Haun, Conformity and its look-a-likes. Anim. Behav. 110, e1–e4 (2015). doi:10.1016/j.anbehav.2015.07.030
29. R. A. Fisher, The Genetical Theory of Natural Selection (Clarendon Press, 1930).
30. A. Mesoudi, Cultural evolution: A review of theory, findings and controversies. Evol. Biol. 43, 481–497 (2015). doi:10.1007/s11692-015-9320-0
31. N. Creanza, O. Kolodny, M. W. Feldman, Cultural evolutionary theory: How culture evolves and why it matters. Proc. Natl. Acad. Sci. U.S.A. 114, 7782–7789 (2017). doi:10.1073/pnas.1620732114 Medline

22
32. L. M. Aplin, B. C. Sheldon, R. McElreath, Conformity does not perpetuate suboptimal traditions in a wild population of songbirds. Proc. Natl. Acad. Sci. U.S.A. 114, 7830–7837 (2017). doi:10.1073/pnas.1621067114 Medline
33. R. Lande, Models of speciation by sexual selection on polygenic traits. Proc. Natl. Acad. Sci. U.S.A. 78, 3721–3725 (1981). doi:10.1073/pnas.78.6.3721 Medline
34. K. N. Laland, Sexual selection with a culturally transmitted mating preference. Theor. Popul. Biol. 45, 1–15 (1994). doi:10.1006/tpbi.1994.1001 Medline
35. M. Andersson, Sexual Selection (Monographs in Behavior and Ecology, Princeton Univ., 1994).
36. R. F. Lachlan, M. R. Servedio, Song learning accelerates allopatric speciation. Evolution 58, 2049–2063 (2004). doi:10.1111/j.0014-3820.2004.tb00489.x Medline
37. L. Rendell, R. Boyd, D. Cownden, M. Enquist, K. Eriksson, M. W. Feldman, L. Fogarty, S. Ghir-landa, T. Lillicrap, K. N. Laland, Why copy others? Insights from the social learning strate-gies tournament. Science 328, 208–213 (2010). doi:10.1126/science.1184719 Medline
38. E. Danchin, S. Nöbel, A. Pocheville, A.-C. Dagaeff, L. Demay, M. Alphand, S. Ranty-Roby, L. van Renssen, M. Monier, E. Gazagne, M. Allain, G. Isabel, Dataset for “Cultural flies: Con-formist social learning in fruit flies predicts long-lasting mate-choice traditions,” Dryad (2018); doi:10.5061/dryad.683870h.
39. T. Chapman, L. F. Liddle, J. M. Kalb, M. F. Wolfner, L. Partridge, Cost of mating in Drosophila melanogaster females is mediated by male accessory gland products. Nature 373, 241–244 (1995). doi:10.1038/373241a0 Medline
40. M. Monier, S. Nöbel, G. Isabel, É. Danchin, Effects of a sex ratio gradient on female mate-copy-ing and choosiness in Drosophila melanogaster. Curr. Zool. 64, 251–258 (2018). doi:10.1093/cz/zoy014
41. M. B. Sokolowski, Drosophila: Genetics meets behaviour. Nat. Rev. Genet. 2, 879–890 (2001). doi:10.1038/35098592 Medline
http://www.ncbi.nlm.nih.gov/entrez/query.fcgi?cmd=Retrieve&db=PubMed&list_uids=8023313&dopt=Abstract