Superelevation Calculation - Tennessee...Superelevation Calculation . The alignment starts out at...
16
Superelevation Calculation Roadway Design Division Website www.tn.gov/tdot/roadway-design/training.html Email [email protected]
Transcript of Superelevation Calculation - Tennessee...Superelevation Calculation . The alignment starts out at...
Superelevation Calculation
Roadway Design Division Website www.tn.gov/tdot/roadway-design/training.html
Email [email protected]
The purpose of this tutorial is to demonstrate the calculation of superelevation rates at critical points along a roadway alignment according to the standards specified in the Standard Drawings:
RD11-SE-1
RD11-SE-2
RD11-SE-2A
RD11-SE-3
RD11-SE-3A
RD11-LR-1
RD11-LR-2
Superelevation Calculation
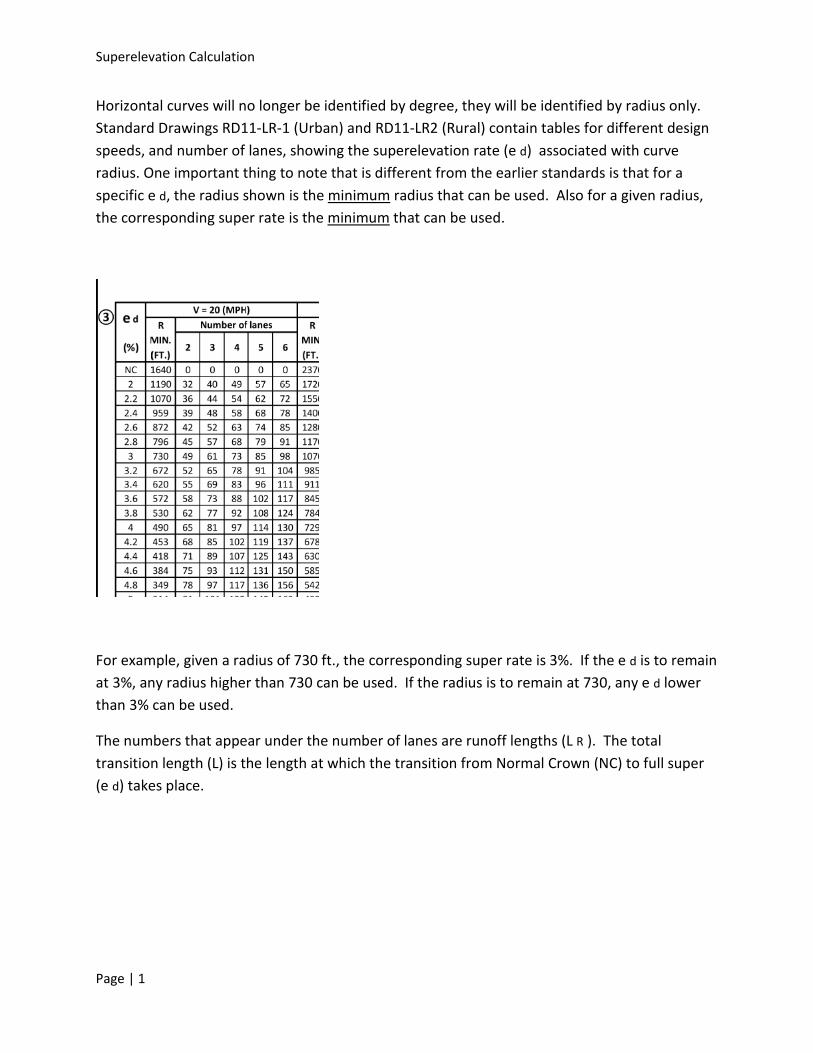
Horizontal curves will no longer be identified by degree, they will be identified by radius only. Standard Drawings RD11-LR-1 (Urban) and RD11-LR2 (Rural) contain tables for different design speeds, and number of lanes, showing the superelevation rate (e d) associated with curve radius. One important thing to note that is different from the earlier standards is that for a specific e d, the radius shown is the minimum radius that can be used. Also for a given radius, the corresponding super rate is the minimum that can be used.
For example, given a radius of 730 ft., the corresponding super rate is 3%. If the e d is to remain at 3%, any radius higher than 730 can be used. If the radius is to remain at 730, any e d lower than 3% can be used.
The numbers that appear under the number of lanes are runoff lengths (L R ). The total transition length (L) is the length at which the transition from Normal Crown (NC) to full super (e d) takes place.
Page | 1
Superelevation Calculation
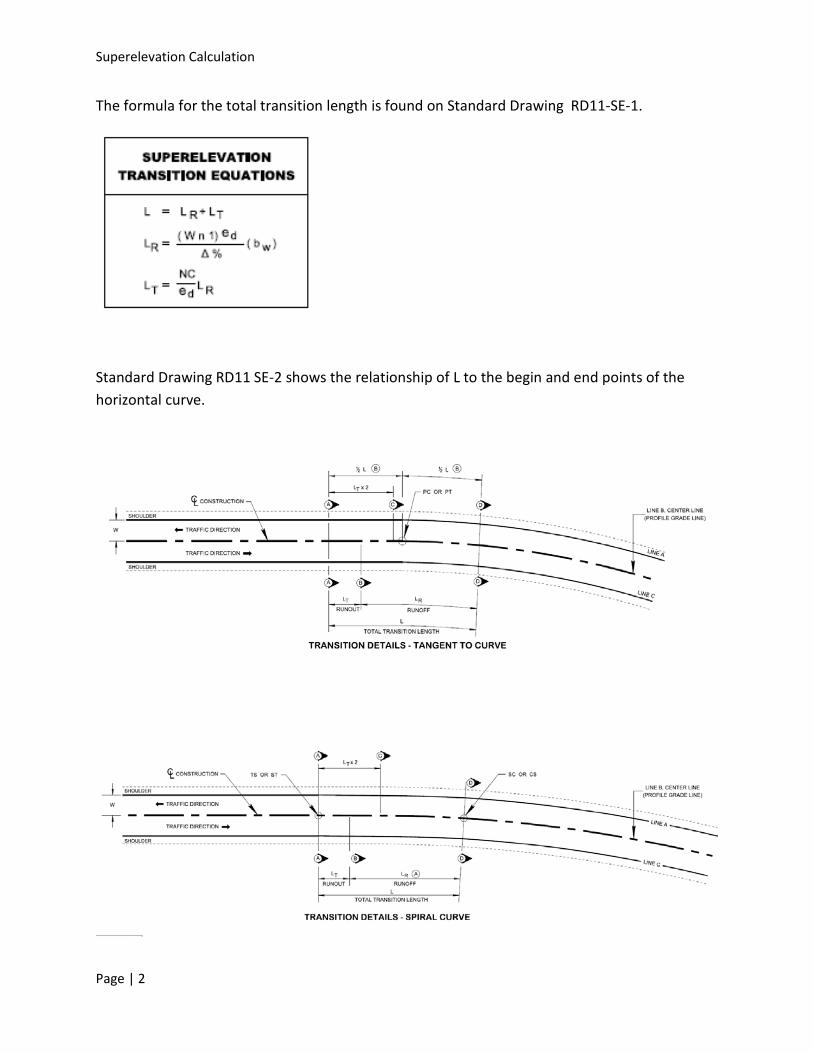
The formula for the total transition length is found on Standard Drawing RD11-SE-1.
Standard Drawing RD11 SE-2 shows the relationship of L to the begin and end points of the horizontal curve.
Page | 2
Superelevation Calculation
For a simple curve half of the transition length is before and half after the P.C. or P.T.
For a spiral curve L is the same as the length of the spiral.
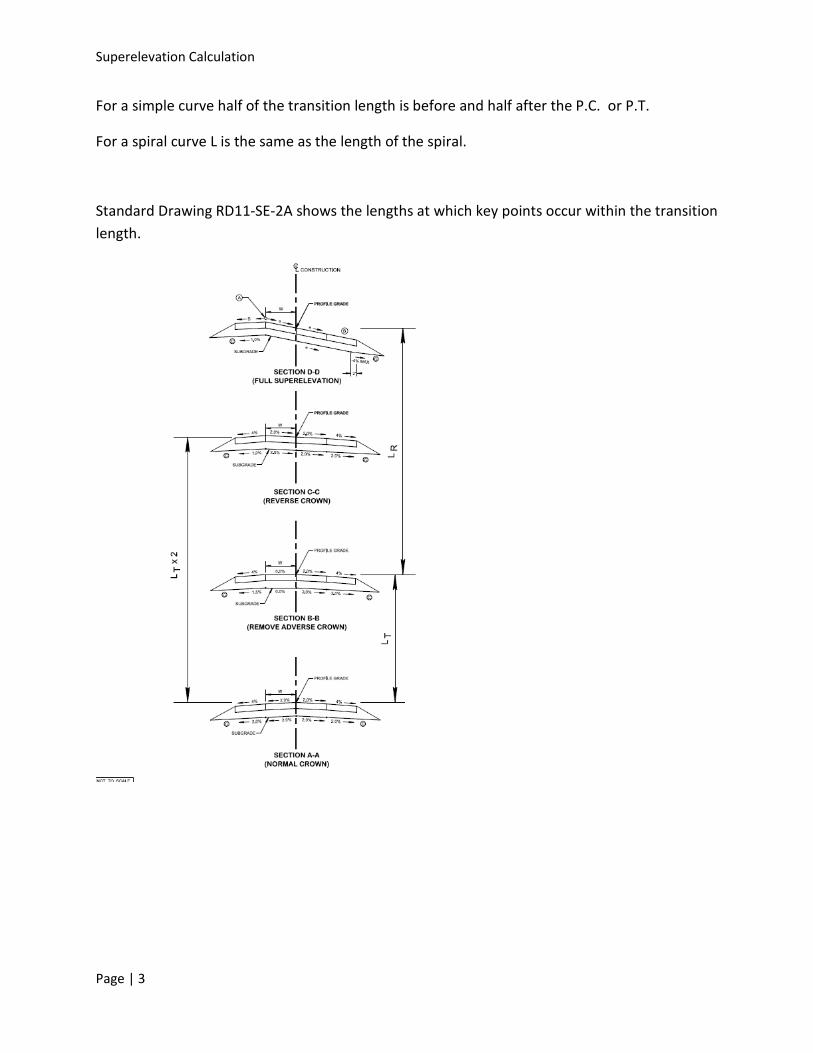
Standard Drawing RD11-SE-2A shows the lengths at which key points occur within the transition length.
Page | 3
Superelevation Calculation
Standard Drawings RD11-SE-3 and 3A contain the same information as RD11-SE-2 and 2A, except for divided highways.
Page | 4
Superelevation Calculation
Example 1
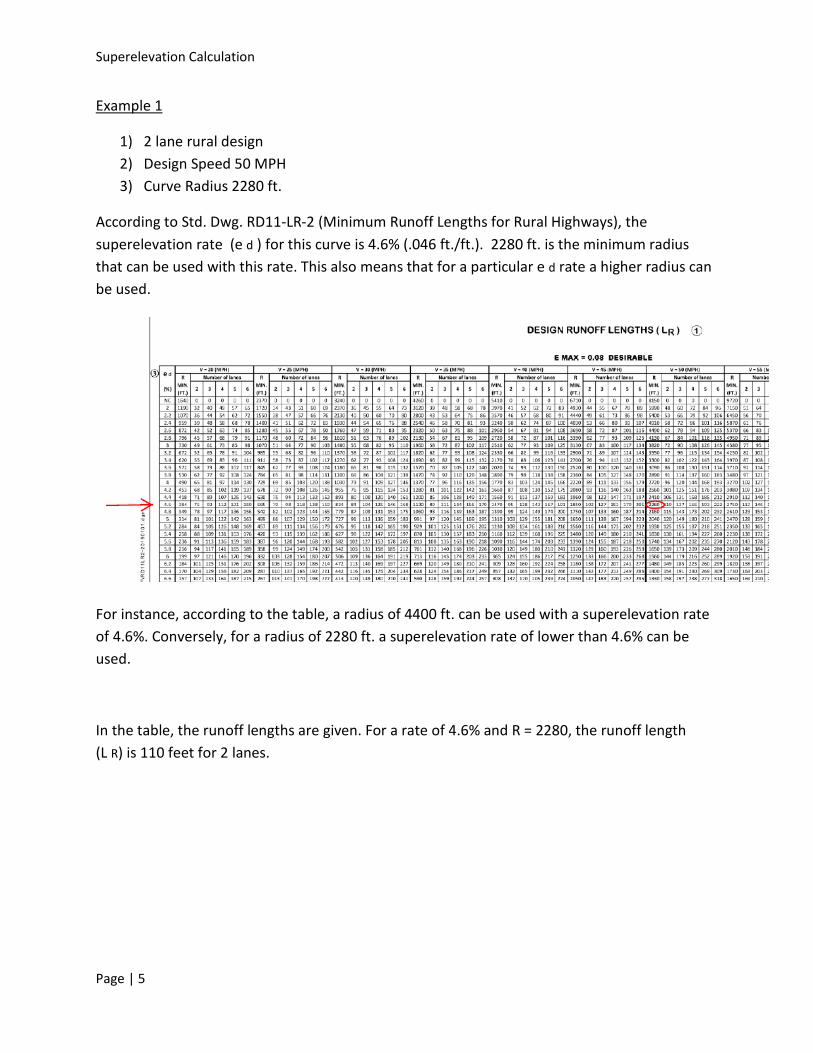
1) 2 lane rural design 2) Design Speed 50 MPH 3) Curve Radius 2280 ft.
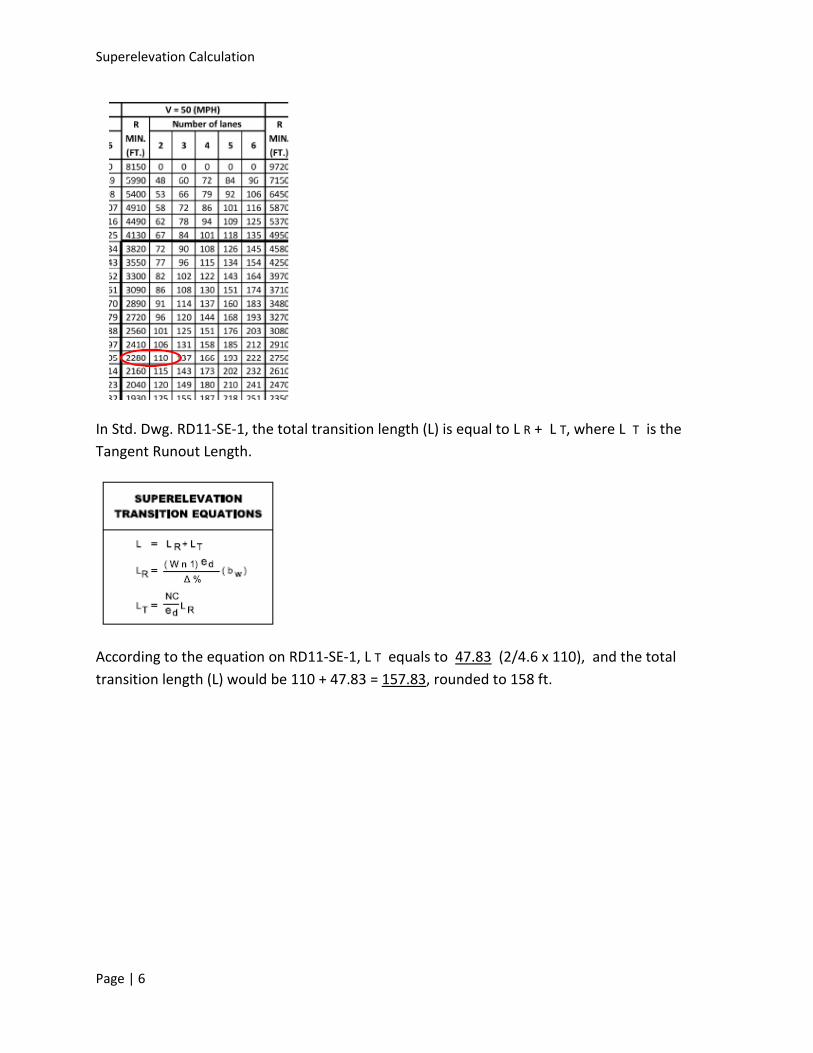
According to Std. Dwg. RD11-LR-2 (Minimum Runoff Lengths for Rural Highways), the superelevation rate (e d ) for this curve is 4.6% (.046 ft./ft.). 2280 ft. is the minimum radius that can be used with this rate. This also means that for a particular e d rate a higher radius can be used.
For instance, according to the table, a radius of 4400 ft. can be used with a superelevation rate of 4.6%. Conversely, for a radius of 2280 ft. a superelevation rate of lower than 4.6% can be used.
In the table, the runoff lengths are given. For a rate of 4.6% and R = 2280, the runoff length (L R) is 110 feet for 2 lanes.
Page | 5
Superelevation Calculation
In Std. Dwg. RD11-SE-1, the total transition length (L) is equal to L R + L T, where L T is the Tangent Runout Length.
According to the equation on RD11-SE-1, L T equals to 47.83 (2/4.6 x 110), and the total transition length (L) would be 110 + 47.83 = 157.83, rounded to 158 ft.
Page | 6
Superelevation Calculation
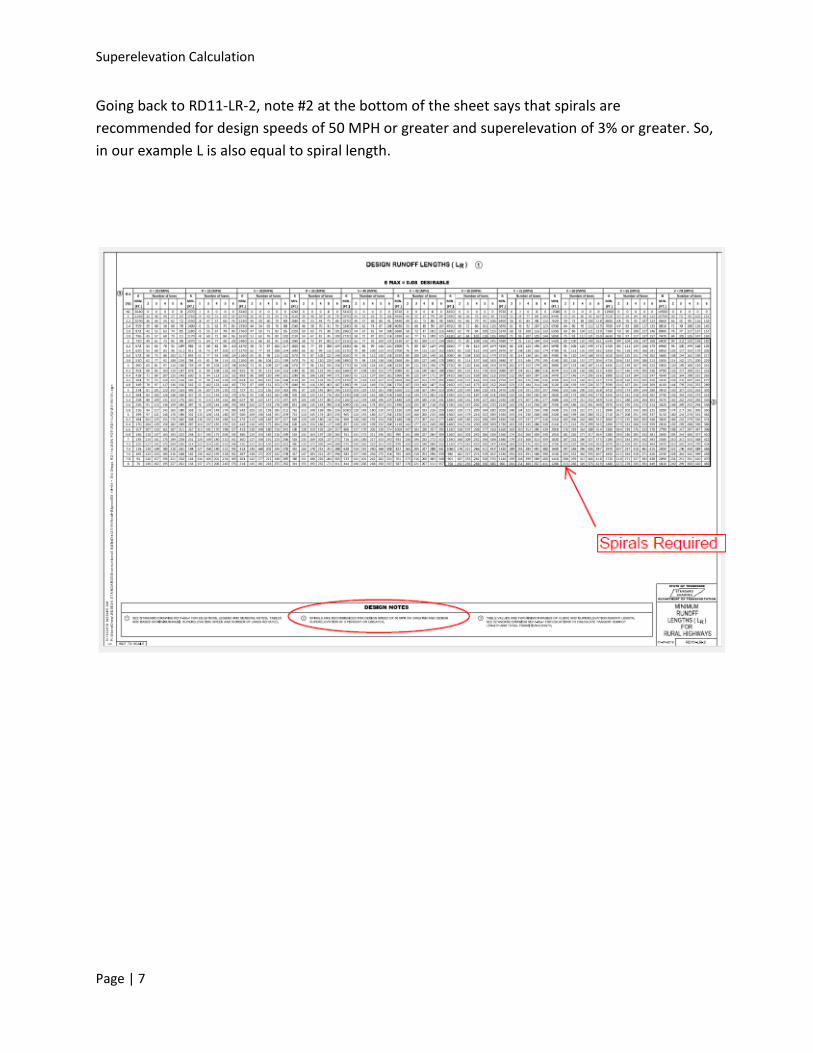
Going back to RD11-LR-2, note #2 at the bottom of the sheet says that spirals are recommended for design speeds of 50 MPH or greater and superelevation of 3% or greater. So, in our example L is also equal to spiral length.
Page | 7
Superelevation Calculation
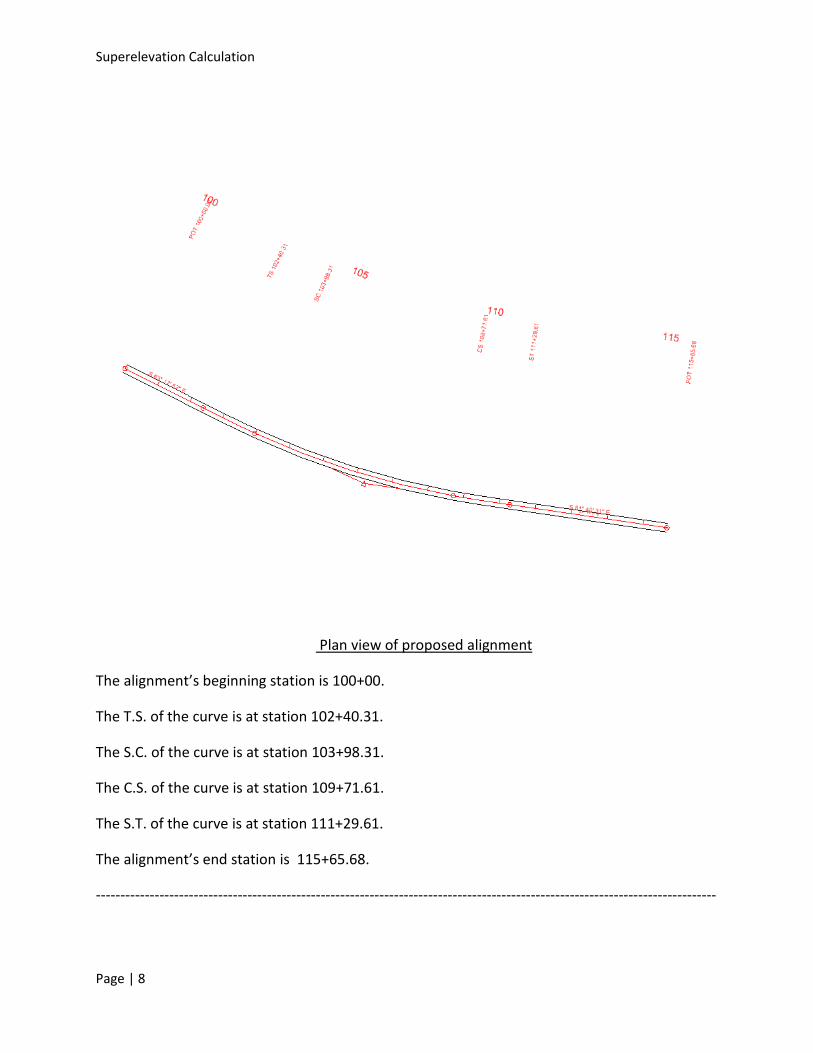
Plan view of proposed alignment
The alignment’s beginning station is 100+00.
The T.S. of the curve is at station 102+40.31.
The S.C. of the curve is at station 103+98.31.
The C.S. of the curve is at station 109+71.61.
The S.T. of the curve is at station 111+29.61.
The alignment’s end station is 115+65.68.
-------------------------------------------------------------------------------------------------------------------------------
Page | 8
Superelevation Calculation
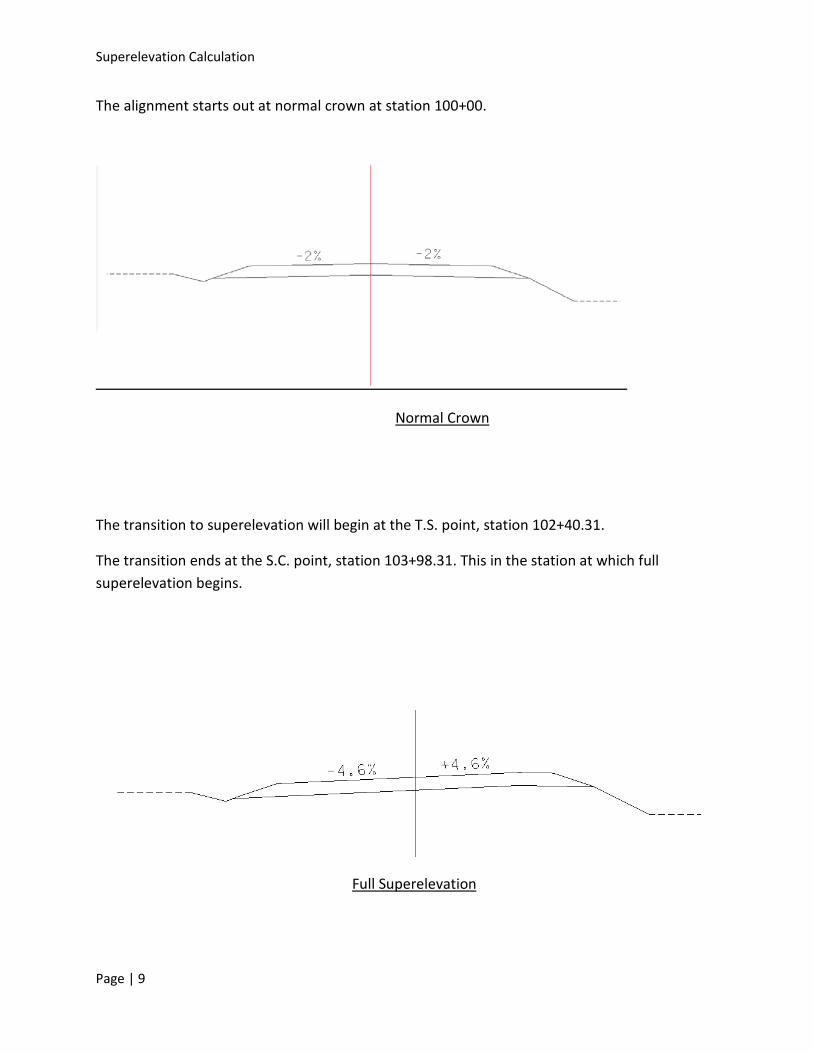
The alignment starts out at normal crown at station 100+00.
Normal Crown
The transition to superelevation will begin at the T.S. point, station 102+40.31.
The transition ends at the S.C. point, station 103+98.31. This in the station at which full superelevation begins.
Full Superelevation
Page | 9
Superelevation Calculation
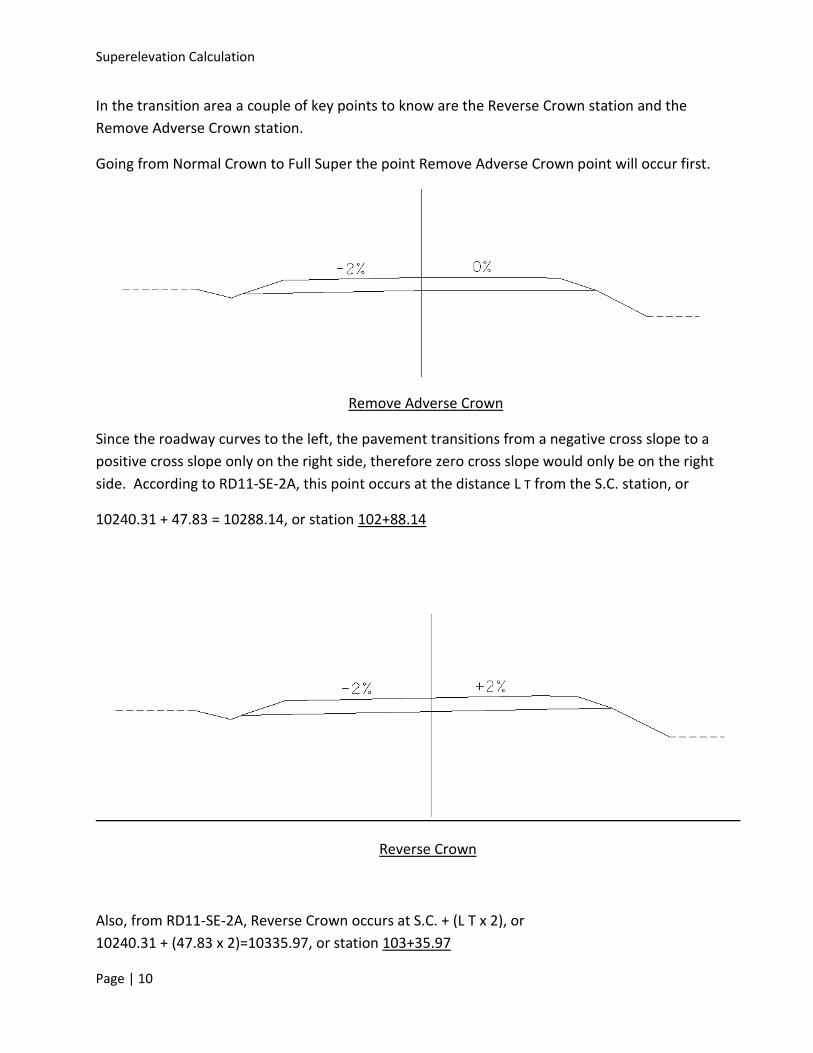
In the transition area a couple of key points to know are the Reverse Crown station and the Remove Adverse Crown station.
Going from Normal Crown to Full Super the point Remove Adverse Crown point will occur first.
Remove Adverse Crown
Since the roadway curves to the left, the pavement transitions from a negative cross slope to a positive cross slope only on the right side, therefore zero cross slope would only be on the right side. According to RD11-SE-2A, this point occurs at the distance L T from the S.C. station, or
10240.31 + 47.83 = 10288.14, or station 102+88.14
Reverse Crown
Also, from RD11-SE-2A, Reverse Crown occurs at S.C. + (L T x 2), or 10240.31 + (47.83 x 2)=10335.97, or station 103+35.97
Page | 10
Superelevation Calculation
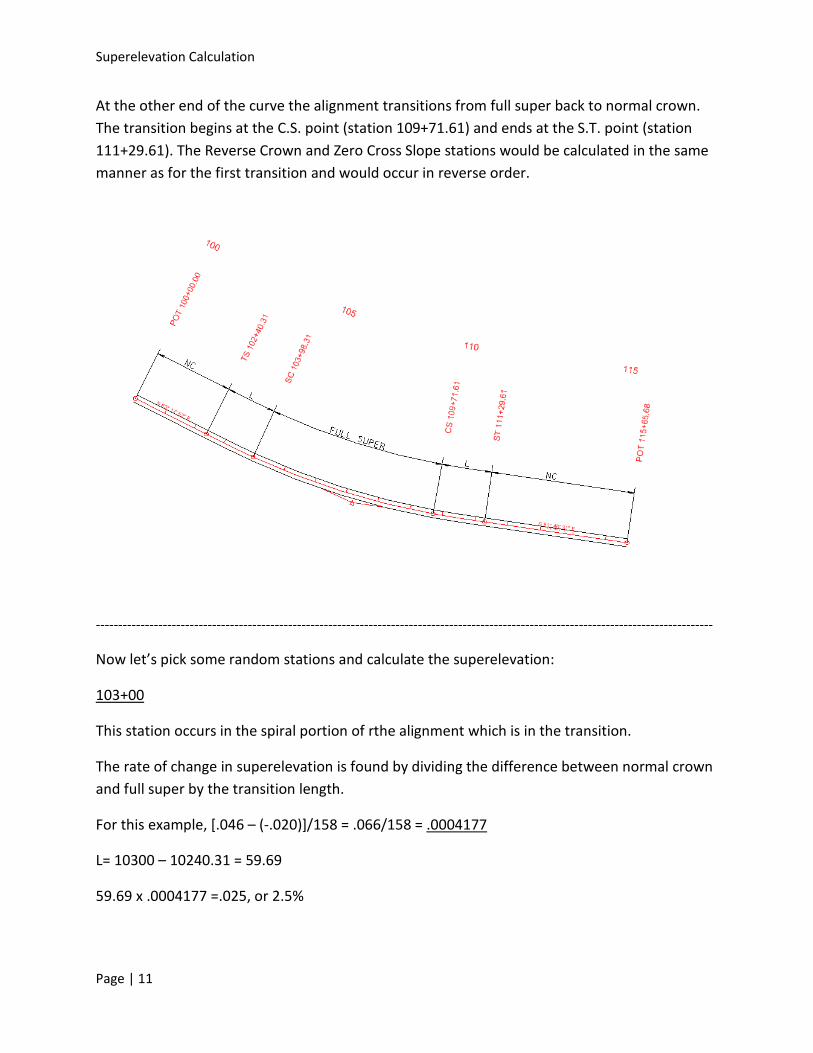
At the other end of the curve the alignment transitions from full super back to normal crown. The transition begins at the C.S. point (station 109+71.61) and ends at the S.T. point (station 111+29.61). The Reverse Crown and Zero Cross Slope stations would be calculated in the same manner as for the first transition and would occur in reverse order.
------------------------------------------------------------------------------------------------------------------------------------------
Now let’s pick some random stations and calculate the superelevation:
103+00
This station occurs in the spiral portion of rthe alignment which is in the transition.
The rate of change in superelevation is found by dividing the difference between normal crown and full super by the transition length.
For this example, [.046 – (-.020)]/158 = .066/158 = .0004177
L= 10300 – 10240.31 = 59.69
59.69 x .0004177 =.025, or 2.5%
Page | 11
Superelevation Calculation
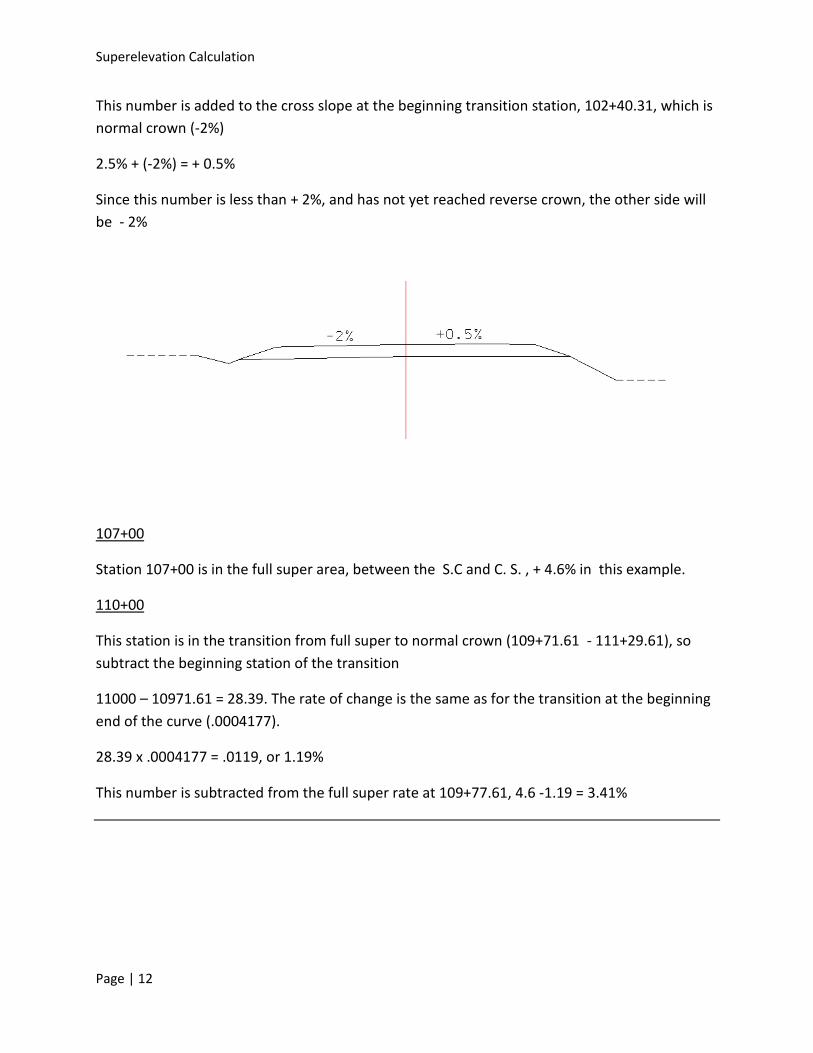
This number is added to the cross slope at the beginning transition station, 102+40.31, which is normal crown (-2%)
2.5% + (-2%) = + 0.5%
Since this number is less than + 2%, and has not yet reached reverse crown, the other side will be - 2%
107+00
Station 107+00 is in the full super area, between the S.C and C. S. , + 4.6% in this example.
110+00
This station is in the transition from full super to normal crown (109+71.61 - 111+29.61), so subtract the beginning station of the transition
11000 – 10971.61 = 28.39. The rate of change is the same as for the transition at the beginning end of the curve (.0004177).
28.39 x .0004177 = .0119, or 1.19%
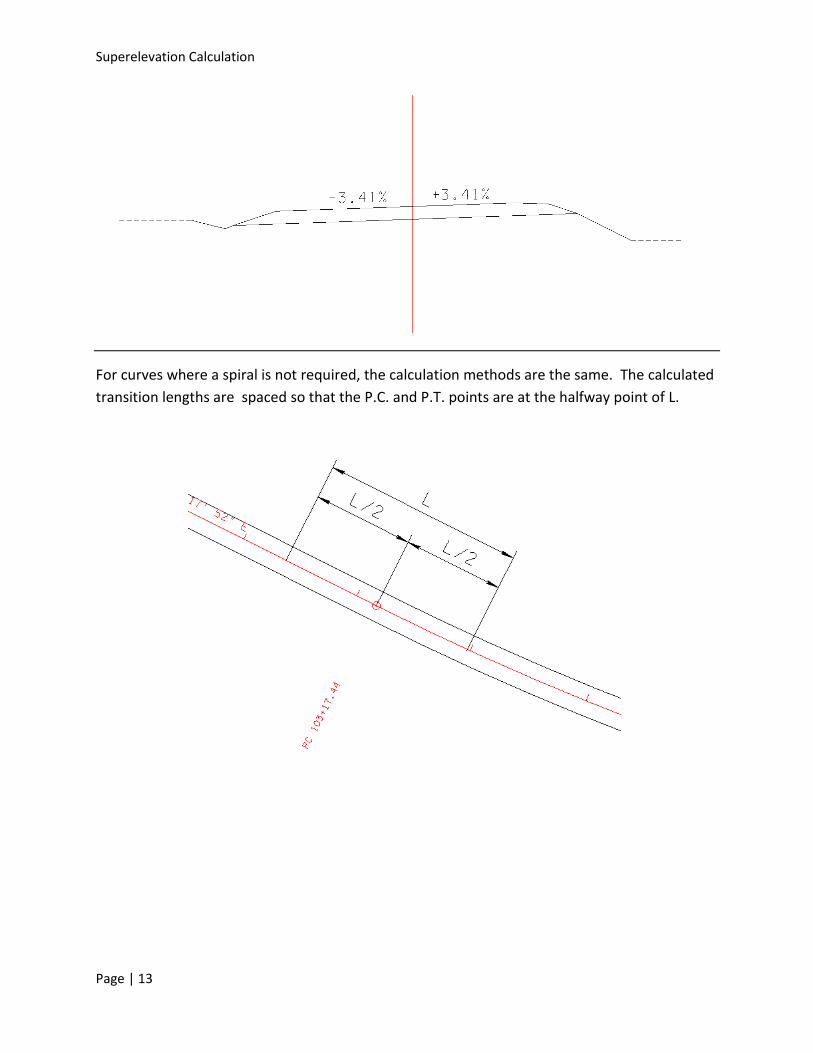
This number is subtracted from the full super rate at 109+77.61, 4.6 -1.19 = 3.41%
Page | 12
Superelevation Calculation
For curves where a spiral is not required, the calculation methods are the same. The calculated transition lengths are spaced so that the P.C. and P.T. points are at the halfway point of L.
Page | 13
Superelevation Calculation
Example 2
1) 4 lane rural design
2) Design Speed 30 MPH
3) Curve Radius 261 ft.
Find L
Use Std. Dwg. RD11-LR-1, Minimum Runoff Lengths for Urban Highways, E max = 0.04.
From the Table, e d =3%. This is the minimum superelevation rate for this radius.
According to the table on RD11-LR-1, L R is 82 feet.
According to the Superelevation Transition equation on RD11-SE-1, L T is 54.67
L = L R + L T = 82 + 54.67 = 136.67, rounded to 137 feet
A spiral curve is not required for this design speed so half of L is on either side of the P.C. or P. T. as shown on page 10.
If the P.C. is at station 103+17.44:
Transition begins at 10317.44 – (137/2)= 10248.94, station 102+48.94
Remove Adverse Crown is 10248.94+ L T = 10248.94 + 54.67 = 10303.61, station 103+03.61
Reverse Crown is 10248.94+ 2x L T = 10248.94 + 109.34 = 10358.28, station 103+58.28
Page | 14