Suitability location for inclusive high school in Bekasi ...
13
40 e-ISSN 2597-9949 JGLITrop Vol.5, No.1, April 2021 © 2021 Department of Geography FMIPA UI Journal homepage: www.jglitrop.ui.ac.id Suitability location for inclusive high school in Bekasi City West Java Province based on school capacity Galuh Izma Hasanah, Triarko Nurlambang, Faris Zulkarnain Department of Geography, Faculty of Mathematics and Natural Science, Kampus UI Depok, 16424 E-mail: [email protected] Received: 09 October 2020; Accepted: 30 April 2021; Published: 30 April 2021 Abstract. The development of inclusive education provider school must also be supported by the provision of good and optimal education facilities. In this study an evaluation was conducted on senior high school (SMA) located in three (3) sub-district areas in Bekasi City, namely Kecamatan Medan Satria, Kecamatan Jatiasih , and Kecamatan Bekasi Utara. These three areas were selected based on the percentage of the availability of the highest educational facilities in Bekasi. The Determination of location was chosen based on consideration through the site of school capacity variables based on the quantitative method. The results showed school characteristics can be seen as quality of the capacity for each school. In this study, it can be seen that schools can accommodate 1-7 study groups on average, the proportion of facilities and infrastructure for children with special needs reaches 55.5%. The research showed that the calculation of school's capacity resulted in 20% of total number of schools in suitable criteria, 27% of schools that were in moderately suitable criteria, 50% were in less suitable criteria, and only 3% of schools were in marginally suitable criteria Keywords: School Capacity, Senior High School, Inclusive school 1. Introduction In schools that provide inclusive education, persons with disabilities still face physical barriers i.e. access to stairs, classrooms, laboratories and libraries, and non-physical barriers such as: emotional isolation and bullying from friends and parents, and discriminatory behavior from teachers (Murdianto & Jayadi, 2020; Amka, 2017; Wibowo & Muin, 2018). At the formal education level, in general, expanding access and increasing equitable distribution of education are still the main problems (Lithari & Rogers, 2017). In this case, children who need special attention (children with special needs) also have not fully received good education services (Hakim, 2016; Lithari & Rogers, 2017). As stated in Article 11 of Law Number 20 of 2003 explains that to ensure equal distribution of educational opportunities, the government is obliged to provide services and facilities as well as to ensure the implementation of quality education for every citizen without discrimination (Hakim, 2016). The existence of space use can vary according to age, condition of the child and available facilities (Elsley, 2004; Lithari & Rogers, 2017). The ease of mobility and not endangering students with special needs is a requirement for the formation of schools that provide inclusive education, which is basically the capacity of the school itself (Cousins, 2005; General Guidelines for Implementing Inclusive Education, 2011). Referring to the Special Guidelines for the Implementation of Inclusive Education at
Transcript of Suitability location for inclusive high school in Bekasi ...

40
e-ISSN 2597-9949
JGLITrop Vol.5, No.1, April 2021
© 2021 Department of Geography FMIPA UI
Journal homepage: www.jglitrop.ui.ac.id
Suitability location for inclusive high school in
Bekasi City West Java Province based on school
capacity
Galuh Izma Hasanah, Triarko Nurlambang, Faris Zulkarnain
Department of Geography, Faculty of Mathematics and Natural Science,
Kampus UI Depok, 16424
E-mail: [email protected]
Received: 09 October 2020; Accepted: 30 April 2021; Published: 30 April 2021
Abstract. The development of inclusive education provider school must also be supported by the
provision of good and optimal education facilities. In this study an evaluation was conducted on
senior high school (SMA) located in three (3) sub-district areas in Bekasi City, namely Kecamatan
Medan Satria, Kecamatan Jatiasih , and Kecamatan Bekasi Utara. These three areas were selected
based on the percentage of the availability of the highest educational facilities in Bekasi. The
Determination of location was chosen based on consideration through the site of school capacity
variables based on the quantitative method. The results showed school characteristics can be seen
as quality of the capacity for each school. In this study, it can be seen that schools can accommodate
1-7 study groups on average, the proportion of facilities and infrastructure for children with special
needs reaches 55.5%. The research showed that the calculation of school's capacity resulted in
20% of total number of schools in suitable criteria, 27% of schools that were in moderately suitable
criteria, 50% were in less suitable criteria, and only 3% of schools were in marginally suitable
criteria
Keywords: School Capacity, Senior High School, Inclusive school
1. Introduction
In schools that provide inclusive education, persons with disabilities still face physical barriers i.e.
access to stairs, classrooms, laboratories and libraries, and non-physical barriers such as: emotional
isolation and bullying from friends and parents, and discriminatory behavior from teachers (Murdianto
& Jayadi, 2020; Amka, 2017; Wibowo & Muin, 2018). At the formal education level, in general,
expanding access and increasing equitable distribution of education are still the main problems (Lithari
& Rogers, 2017). In this case, children who need special attention (children with special needs) also
have not fully received good education services (Hakim, 2016; Lithari & Rogers, 2017). As stated in
Article 11 of Law Number 20 of 2003 explains that to ensure equal distribution of educational
opportunities, the government is obliged to provide services and facilities as well as to ensure the
implementation of quality education for every citizen without discrimination (Hakim, 2016).
The existence of space use can vary according to age, condition of the child and available facilities
(Elsley, 2004; Lithari & Rogers, 2017). The ease of mobility and not endangering students with special
needs is a requirement for the formation of schools that provide inclusive education, which is basically
the capacity of the school itself (Cousins, 2005; General Guidelines for Implementing Inclusive
Education, 2011). Referring to the Special Guidelines for the Implementation of Inclusive Education at

41
Hasanah et al. (2021). Jurnal Geografi Lingkungan Tropik (Journal of Geography of Tropical Environments), 5 (1), 40-52
the Ministry of National Education, Directorate General of Management of Primary and Secondary
Education, Directorate of Special School Development in 2007, in learning at schools, the facilities and
infrastructure needed by children with disabilities include assessment tools, physical training tools, self-
development tools and motion development, orthotic and practical tools, and academic aids. Based on
the Regulation of the Minister of National Education RI Number 24-year 2007 which includes facilities
and infrastructure for SD / MI, SMP / MTs, and SMA / MA. The provisions stipulated in this standard
include educational units, land area, buildings, infrastructure and facilities. This study reviews the
educational unit in which it regulates the number of study groups and existing infrastructure at the
school. From this background, geography as a science that studies phenomena that exist on the earth's
surface and their contents takes a role in the field of education. One of them is related to the evaluation
of the suitability location of high schools (SMA) that provide inclusive education in Bekasi City.
Previous studies have already investigated the geographic perspective for assessing the general school’s
location around the globe (Thelin & Niedomysl, 2015; Pearman & Swain, 2017; He & Giuliano, 2008;
Yoon et al., 2018). However, the research about inclusive high school is quite new.
2. Research Methodology
2.1. First Sub Subject
Bekasi City has three sub-districts with the highest percentage of available educational facilities, namely
Medan Satria sub-districts, Jatiasih sub-districts, and North Bekasi sub-districts. The availability of
educational facilities is taken from the number of schools per population multiplied by one hundred
percent (Ariastita, 2017). Of the three sub-districts with the highest percentage of availability
educational facilities, there are nine (9) schools in Medan Satria District, seven (7) schools in Jatiasih
District, and fourteen (14) schools in North Bekasi sub-districts.
2.2. Process and Data Analysis
2.2.1. School’s Study Group
The capacity is taken based on the number of study groups that can be accepted by each school. With
the standard of the Ministry of Education and Culture, namely one study group (rombel) consisting of
32 children, but for schools that provide inclusive education, the presence of special needs students is
limited to only 8 people per study group. So that the more study groups each school received, the more
students will be in the school.
Table 1. School’s Study Group Assessment
Source Variable Variable Units Criteria Weight Scale
Standard
Operational
Procedure for the
Delivery of
Inclusive Education,
Ministry of National
Education, 2007
PERMENDIKNAS
Number 33, 2008
School
Capacity
31 - 37 Study Group Very Suitable
0,148
5
22 - 30 Study Group Suitable 4
14 – 21 Study Group Moderately Suitable 3
8 – 13 Study Group Less Suitable 2
1 – 7 Study Group Marginally Suitable 1
2.3. School Facilities and Infrastructure
The existence of facilities and infrastructure is illustrated through the calculation of the percentage of
educational statistics proposed by Sudidjono in 2012. Through this data analysis stage, the researcher
can describe the percentage value of the adequacy of facilities and infrastructure. These statistical
calculations can be seen in formula 1.

42
Hasanah et al. (2021). Jurnal Geografi Lingkungan Tropik (Journal of Geography of Tropical Environments), 5 (1), 40-52
(𝑃 = 𝑓
𝑁× 100%)....................................................................................................................... (1)
remarks :
P = Percentage number
f = The number of subjects in a certain category
N = amount required
If each facility and infrastructure value has been obtained, the percentage can be divided by 2
(based on the percent of facilities and infrastructure) to get an average percentage of all facilities and
infrastructure in each school, which can be seen in formula 2.
(P SarPras = P Sarana +P Prasarana
2)……………………………………………………………..(2)
Table 2. Assessment of School Facilities and Infrastructure
Source Variable Variable
Units Criteria Weight Scale
Standard Operational
Procedure for the Delivery of
Inclusive Education, Ministry
of National Education, 2007
(Elsley, 2004)
Infrastructure
>58% Very
Suitable
0,148
5
50 - 57% Suitable 4
42 - 49% Moderately
Suitable 3
35 – 41% Less Suitable 2
27 – 34 % Marginally
Suitable 1
The parameters determined in collecting data on the availability of facilities and infrastructure for
schools that provide inclusive education consist of 5 types of facilities and 7 types of infrastructure.
with the result that if the percentage calculation for facilities is included, a total of 5 n facilities and 7 n
infrastructure will form the suitability level. It should be remembered that all the existing criteria must
be met by each unit variable if the variable unit can be said to be available.
Table 3. Criteria for School Facilities and Infrastructure
Source Variable Variable Units
Standard Operational Procedure
for the Delivery of Inclusive
Education, Ministry of National
Education, 2007 (Elsley, 2004)
Facilities
Classroom
Library room
Laboratory
School's Health Clinic Room
Toilet
Playground Exercising
Self-Development and Movement
Building
Infrastructure
Movement Ability Assessment Tool
Self-Building Tools
Physical Exercise Tools
Academic props

43
Hasanah et al. (2021). Jurnal Geografi Lingkungan Tropik (Journal of Geography of Tropical Environments), 5 (1), 40-52
3. Results and Discussion
3.1. School’s Study Group
Data for study groups that can be accepted by schools is taken from the 2020 Bekasi City education
main data (DAPODIK). It can be seen that public schools are a type of school that has a higher capacity
than private schools. So that public schools can be said to be very suitable to become schools that
provide inclusive education. The capacity of each object school can be seen in table 4.
Table 4. School Capacity
Sub-District School Study Group Scoring
Medan Satria
SMAN 10 Bekasi 32 5
SMAS Attaqwa 4 1
SMAS Bina Tunggal 3 1
SMAS Cindera Mata 12 2
SMAS Galatia 6 1
SMAS Islam Al-Azhar Harapan Indah 6 1
SMAS Patriot Bekasi 9 2
SMAS Penabur 18 3
SMAS Taman Harapan 1 17 3
North Bekasi
SMAN 20 Bekasi 11 2
SMAN 14 Bekasi 35 5
SMAN 4 Bekasi 31 5
SMA Galajuara 5 1
SMA Islam Al-Azhar 8 18 3
SMA IT Al Muchtar 5 1
SMA Kristen Penabur Summarecon 11 2
SMA PGRI 2 Kota Bekasi 6 1
SMAS Darut Taubah 6 1
SMAS Flora 4 1
SMAS Islam An Nur 3 1
SMAS It Gema Nurani 6 1
SMAS Mutiara 17 Agustus 15 3
SMAS Taman Harapan 2 6 1
Jatiasih
SMAN 11 Bekasi 30 4
SMAS Ar Ridwan 6 1
SMAS Gema Islami 3 1
SMAS IT Yapidh 13 2
SMAS Malidar 6 1
SMAS Mudi Al Aziziyyah 3 1
SMAS Tulus Bhakti 17 3
There is only one public school in Jatiasih sub-district, so in this sub-district the highest capacity
is at SMAN 11 Bekasi. Followed by private schools that have less capacity than SMAN 11 Bekasi,
namely SMA Tulus Bhakti which is in moderately suitable criteria, SMAS IT Yapidh with less suitable
criteria and four other high schools with marginally suitable criteria, namely SMA Gema Islami, SMA
Mudi Al Aziziyyah , SMA Malidar, and SMA Ar Ridwan.
In Medan Satria sub-district, there is only one public school type, namely SMAN 10 Bekasi. So
that the school can accommodate more children with special need is SMAN 10 Bekasi and the least is
SMA Bina Tunggal according to the number of study groups accepted in each school. So, it can be said
that SMAN 10 Bekasi is very suitable to be developed into a school that provides inclusive education
in Medan Satria sub-district because of the large number of students accepted. Followed by private high

44
Hasanah et al. (2021). Jurnal Geografi Lingkungan Tropik (Journal of Geography of Tropical Environments), 5 (1), 40-52
schools consisting of SMA Penabur Harapan Indah and SMA Taman Harapan 1 which is classified as
moderately suitable criteria, SMA Cindera Mata and SMA Patriot Bekasi which are classified as less
suitable criteria and SMA At taqwa, SMA Al Azhar Harapan Indah, SMA Galatia, and SMA Bina
Tunggal which are classified as marginally suitable criteria.
In North Bekasi sub-district, schools that can accommodate the most children with special need
are SMAN 4 Bekasi and SMAN 14 Bekasi, while the smallest is SMA Islam An-Nur which a private
high school. However, in this sub-district there are public schools with capacities that are not that much
compared to other public schools, namely SMAN 20 Bekasi. So that for SMAN 4 Bekasi and SMAN
14 Bekasi are included in the category very suitable to be developed into schools that provide inclusive
education while other schools that are entirely private are SMA Flora, SMA Galajuara, SMA Darut
Taubah, SMA Gema Nurani, and SMA IT Al Muchtar. SMA An-Nur, SMAS Taman Harapan 2 and
SMA PGRI 2 in Bekasi City are included in the category of schools that are in marginally suitable
criteria to be developed into schools that provide inclusive education. However, in this sub-district other
private schools are in the category of schools that are moderately suitable criteria and less suitable to
be developed into schools that provide inclusive education, namely SMA Islam Al Azhar 8 and SMA
Mutiara 17 Agustus which are included in the moderately suitable criteria. SMAK Penabur
Summarecon and SMAN 20 Bekasi are also included in less suitable criteria.
3.2. School Facilities and Infrastructure
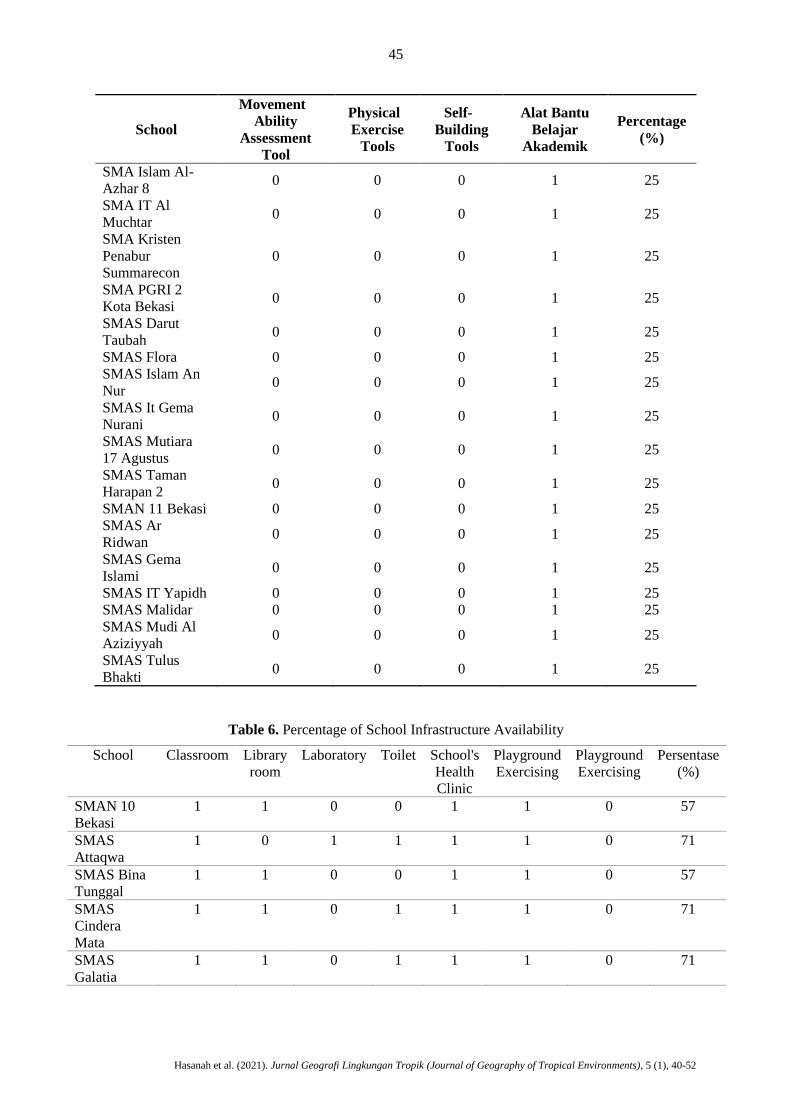
The existence of facilities and infrastructure is marked based on coding 1 (available) and 0 (not
available). The Percentage calculation of the availability of facilities at each school can be seen in table
5 and table 6. From these data it can be seen that the additional of academic learning aids are not only
specific to children with disabilities. All schools in three sub-districts that have the highest percentage
of availability of educational facilities are not available with facilities that support the existence of
children with disabilities except for one school, namely SMAS AT Taqwa, which has the status of a
private school, the school gets assistance from the government in the form of wheelchairs for children
with disabilities.
Table 5. Percentage of School Facilities Availability
School
Movement
Ability
Assessment
Tool
Physical
Exercise
Tools
Self-
Building
Tools
Alat Bantu
Belajar
Akademik
Percentage
(%)
SMAN 10 Bekasi 0 0 0 1 25
SMAS Attaqwa 0 0 1 1 50
SMAS Bina
Tunggal 0 0 0 1 25
SMAS Cindera
Mata 0 0 0 1 25
SMAS Galatia 0 0 0 1 25
SMAS Islam Al-
Azhar Harapan
Indah
0 0 0 1 25
SMAS Patriot
Bekasi 0 0 0 1 25
SMAS Penabur 0 0 0 1 25
SMAS Taman
Harapan 1 0 0 0 1 25
SMAN 20 Bekasi 0 0 0 1 25
SMAN 14 Bekasi 0 0 0 1 25
SMAN 4 Bekasi 0 0 0 1 25
SMA Galajuara 0 0 0 1 25
45
Hasanah et al. (2021). Jurnal Geografi Lingkungan Tropik (Journal of Geography of Tropical Environments), 5 (1), 40-52
School
Movement
Ability
Assessment
Tool
Physical
Exercise
Tools
Self-
Building
Tools
Alat Bantu
Belajar
Akademik
Percentage
(%)
SMA Islam Al-
Azhar 8 0 0 0 1 25
SMA IT Al
Muchtar 0 0 0 1 25
SMA Kristen
Penabur
Summarecon
0 0 0 1 25
SMA PGRI 2
Kota Bekasi 0 0 0 1 25
SMAS Darut
Taubah 0 0 0 1 25
SMAS Flora 0 0 0 1 25
SMAS Islam An
Nur 0 0 0 1 25
SMAS It Gema
Nurani 0 0 0 1 25
SMAS Mutiara
17 Agustus 0 0 0 1 25
SMAS Taman
Harapan 2 0 0 0 1 25
SMAN 11 Bekasi 0 0 0 1 25
SMAS Ar
Ridwan 0 0 0 1 25
SMAS Gema
Islami 0 0 0 1 25
SMAS IT Yapidh 0 0 0 1 25
SMAS Malidar 0 0 0 1 25
SMAS Mudi Al
Aziziyyah 0 0 0 1 25
SMAS Tulus
Bhakti 0 0 0 1 25
Table 6. Percentage of School Infrastructure Availability
School Classroom Library
room
Laboratory Toilet School's
Health
Clinic
Playground
Exercising
Playground
Exercising
Persentase
(%)
SMAN 10
Bekasi
1 1 0 0 1 1 0 57
SMAS
Attaqwa
1 0 1 1 1 1 0 71
SMAS Bina
Tunggal
1 1 0 0 1 1 0 57
SMAS
Cindera
Mata
1 1 0 1 1 1 0 71
SMAS
Galatia
1 1 0 1 1 1 0 71

46
Hasanah et al. (2021). Jurnal Geografi Lingkungan Tropik (Journal of Geography of Tropical Environments), 5 (1), 40-52
School Classroom Library
room
Laboratory Toilet School's
Health
Clinic
Playground
Exercising
Playground
Exercising
Persentase
(%)
SMAS Islam
Al-Azhar
Harapan
Indah
1 1 1 1 1 1 0 86
SMAS
Patriot
Bekasi
1 0 1 0 1 1 0 57
SMAS
Penabur
1 1 1 1 1 1 0 86
SMAS
Taman
Harapan 1
1 1 0 0 1 1 0 57
SMAS 11
Bekasi
1 1 0 0 1 1 0 57
SMAS Ar
Ridwan
1 1 1 0 1 1 0 71
SMAS
Gema Islami
1 1 0 0 1 1 0 57
SMAS IT
Yapidh
1 1 0 0 1 1 0 57
SMAS
Malidar
1 1 1 0 1 1 0 71
SMAS Mudi
Al
Aziziyyah
1 1 0 0 1 1 0 57
SMAS Tulus
Bhakti
0 0 0 0 1 1 0 29
SMAN 20
Bekasi
1 1 0 0 1 1 0 57
SMAN 14
Bekasi
1 1 0 0 1 1 0 57
SMAN 4
Bekasi
1 1 0 0 1 1 0 57
SMAS
Galajuara
1 0 0 1 1 1 0 57
SMA Islam
Al-Azhar 8
1 1 1 1 1 1 0 86
SMA IT Al
Muchtar
1 1 1 1 1 1 0 86
SMA
Kristen
Penabur
Summarecon
Bekasi
1 1 1 1 1 1 0 86
SMA PGRI
2 Kota
Bekasi
1 1 1 0 1 1 0 71
SMAS Darut
Taubah
1 1 1 1 1 1 0 86
SMAS Flora 1 0 0 0 1 1 0 43
47
Hasanah et al. (2021). Jurnal Geografi Lingkungan Tropik (Journal of Geography of Tropical Environments), 5 (1), 40-52
School Classroom Library
room
Laboratory Toilet School's
Health
Clinic
Playground
Exercising
Playground
Exercising
Persentase
(%)
SMAS Islam
An Nur
1 1 1 0 1 1 0 71
SMAS It
Gema
Nurani
1 1 0 1 1 1 0 71
SMAS
Mutiara 17
Agustus
1 1 1 1 1 1 0 86
SMAS
Taman
Harapan 2
1 1 0 0 1 1 0 57
Similar to facilities, the three sub-districts with the highest percentage of availability of educational
facilities were on infrastructure which focused not only on the presence or absence of infrastructure in
school but on whether the infrastructure was accessible to all, Especially for children with special needs.
The availability of infrastructure is also seen in the accessibility of infrastructure that can be reached by
the children with special needs. The school with the highest percentage has an elevator in school
building which allows children with special needs able to easily mobilize from one room to another.
This can be seen in SMAS Al-Azhar and SMAK Penabur. Unlike schools that have elevator
facilities, some schools facilitate the transfer of space in order to be reached by students with special
needs, namely SMA Mutiara 17 August. And the school which only consists of one floor, namely SMAS
Gema Islami which should be easily accessible, however the laboratory infrastructure is not available
and access to the toilet is difficult even though is located on the 1st floor.
So that from all the percentages of infrastructure availability, it can be seen that the schools with
highest percentage in Medan Satria sub-District are SMAS Al-Azhar Harapan Indah and SMA Penabur
with a percentage of 86% and the smallest are SMAN 10 Bekasi and SMA Taman Harapan 1 with a
percentage of 57%.
For Jatiasih Sub-district, the highest percentage are SMAS Ar Ridwan and SMA Malidar with a
percentage of 71% and the smallest percentage was at SMA Tulus Bhakti with a percentage of 57%.
Meanwhile, for North Bekasi sub-District, the highest percentage was at SMAS Al-Azhar 8, SMAK
Penabur Summarecon Bekasi, SMAS Mutiara 17 Agustus, and SMA ITAl Muchtar with 86% and the
smallest percentage was SMA Flora with 43%. To get the suitability class criteria, the average
percentage of the existing facilities and infrastructure must be found first. So that the results can be seen
in table 7.
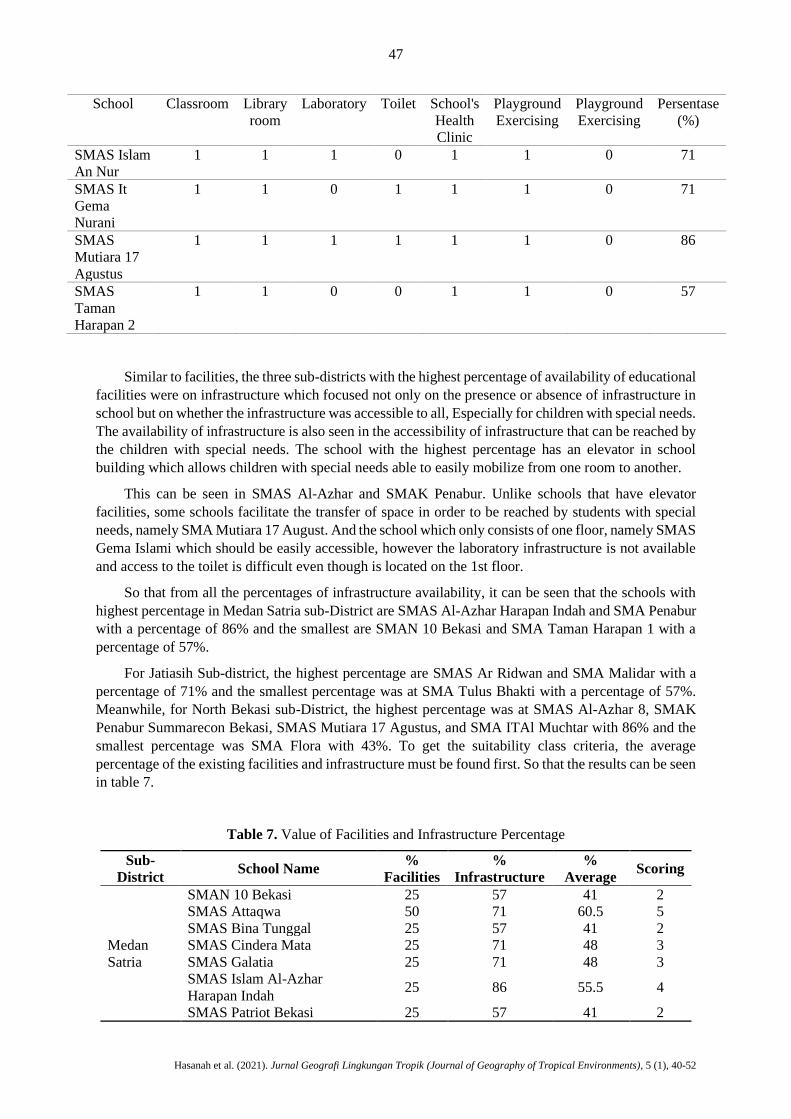
Table 7. Value of Facilities and Infrastructure Percentage
Sub-
District School Name
%
Facilities
%
Infrastructure
%
Average Scoring
Medan
Satria
SMAN 10 Bekasi 25 57 41 2
SMAS Attaqwa 50 71 60.5 5
SMAS Bina Tunggal 25 57 41 2
SMAS Cindera Mata 25 71 48 3
SMAS Galatia 25 71 48 3
SMAS Islam Al-Azhar
Harapan Indah 25 86 55.5 4
SMAS Patriot Bekasi 25 57 41 2

48
Hasanah et al. (2021). Jurnal Geografi Lingkungan Tropik (Journal of Geography of Tropical Environments), 5 (1), 40-52
Sub-
District School Name
%
Facilities
%
Infrastructure
%
Average Scoring
SMAS Penabur 25 86 55.5 4
SMAS Taman Harapan 1 25 57 41 2
Jatiasih
SMAS 11 Bekasi 25 57 41 2
SMAS Ar Ridwan 25 71 48 3
SMAS Gema Islami 25 57 41 2
SMAS IT Yapidh 25 57 41 2
SMAS Malidar 25 71 48 3
SMAS Mudi Al Aziziyyah 25 57 41 2
SMAS Tulus Bhakti 25 29 27 1
North
Bekasi
SMAN 20 Bekasi 25 57 41 2
SMAN 14 Bekasi 25 57 41 2
SMAN 4 Bekasi 25 57 41 2
SMAS Galajuara 25 57 41 2
SMA Islam Al-Azhar 8 25 86 55.5 4
SMA IT Al Muchtar 25 86 55.5 4
SMA Kristen Penabur
Summarecon Bekasi 25 86 55.5 4
SMA PGRI 2 Kota Bekasi 25 71 48 3
SMAS Darut Taubah 25 86 55.5 4
SMAS Flora 25 43 34 1
SMAS Islam An Nur 25 71 48 2
SMAS IT Gema Nurani 25 71 48 2
SMAS Mutiara 17 Agustus 25 86 55.5 4
SMAS Taman Harapan 2 25 57 41 2
After getting the average percentage of facilities and infrastructure, scoring can be determined
based on the percentage and the multiplication of results. So it can be seen based on the variables of
facilities and infrastructure for all schools in 3 districts.
In three sub-districts, the suitability for public high schools in Medan Satria Subdistrict, Jatiasih
Sub-district and North Bekasi Sub-district are less suitable criteria. Whereas for private high school,
the criteria vary from very suitable, to marginally suitable in terms of facilities and infrastructure as
schools that provide inclusive education. In Medan Satria Sub-district itself, a private school, namely
SMA At Taqwa which is included in the category very suitable by following per under the overall
percentage of 60.5%, followed by two other private high schools namely SMA Penabur Harapan Indah
and SMA Al Azhar Harapan Indah which are included in the category according to the percentage
55.5%. SMA Cindera Mata and SMA Galatia which are moderately suitable criteria according to the
percentage of 48%, but there are also private high schools with less suitable criteria in Medan Satria
sub-district, namely SMA Taman Harapan 1, SMA Bina Tunggal, and SMA Patriot Bekasi
For Jatiasih Sub-district, three categories of suitability have been formed, namely moderately
suitable criteria for private high school which are SMA Malidar and SMA Islam Ar Ridwan with a
percentage of 48% and the less suitable criteria owned by public SMA, namely SMAN 11 Bekasi as
much as 41% and private SMA namely SMA Gema Islamic, SMA Mudi Al Aziziyyah, SMAS IT
Yapidh. Meanwhile, marginally suitable criteria was at SMA Tulus Bhakti with a percentage of only
27%.
In North Bekasi sub-district, schools with the suitable criteria are in private high schools, namely
SMA IT Al Muchtar, SMA Darut Taubah, SMA Al Azhar 8, SMAK Penabur Summarecon, and SMA
49
Hasanah et al. (2021). Jurnal Geografi Lingkungan Tropik (Journal of Geography of Tropical Environments), 5 (1), 40-52
Mutiara 17 Agustus with a percentage of facilities and infrastructure for children with special needs in
schools is 55, 5%. And for the moderately suitable criteria, there is only one private high school in this
sub-district, namely SMA PGRI 2 Bekasi City as much as 48%, while for the less suitable category in
North Bekasi District, it is dominated by private high school, namely SMA Galajuara, SMA IT Gema
Nurani, and SMA Taman Harapan 2 and SMA An-Nur with a percentage of 41%. Although there are
public high schools, namely SMAN 4 Bekasi, SMAN 14 Bekasi, and SMAN 20 Bekasi, which fall into
this category.
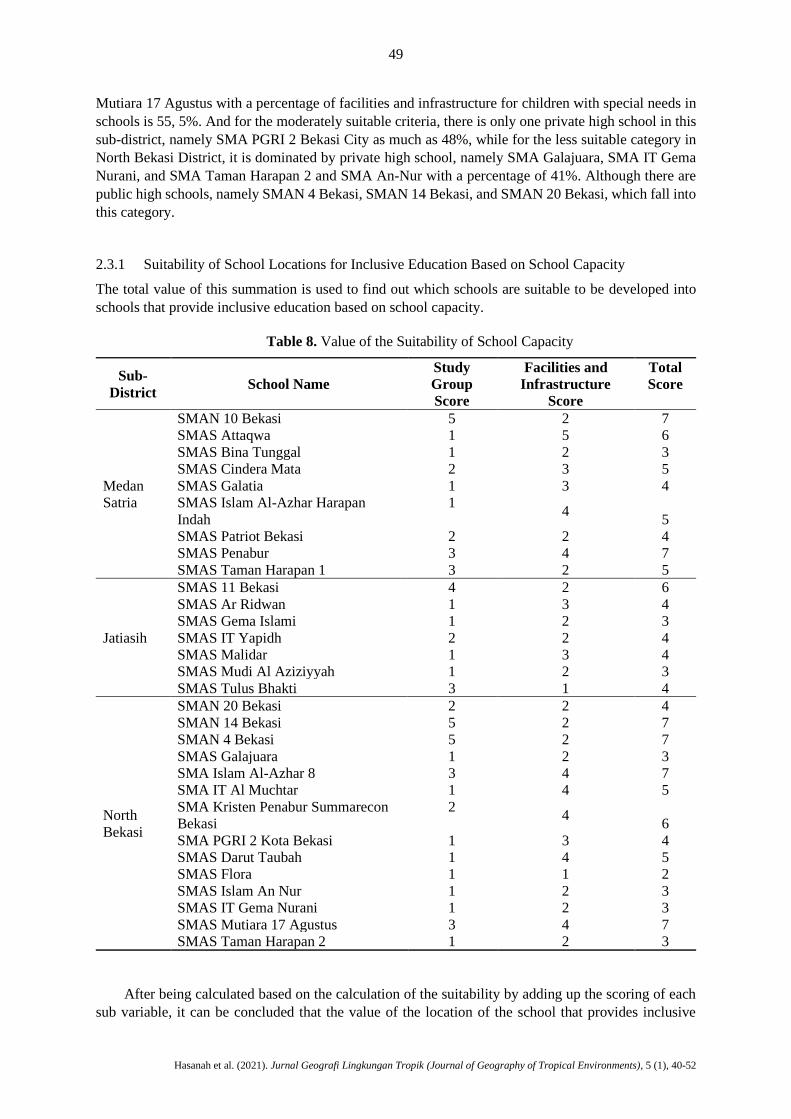
2.3.1 Suitability of School Locations for Inclusive Education Based on School Capacity
The total value of this summation is used to find out which schools are suitable to be developed into
schools that provide inclusive education based on school capacity.
Table 8. Value of the Suitability of School Capacity
Sub-
District School Name
Study
Group
Score
Facilities and
Infrastructure
Score
Total
Score
Medan
Satria
SMAN 10 Bekasi 5 2 7
SMAS Attaqwa 1 5 6
SMAS Bina Tunggal 1 2 3
SMAS Cindera Mata 2 3 5
SMAS Galatia 1 3 4
SMAS Islam Al-Azhar Harapan
Indah
1 4
5
SMAS Patriot Bekasi 2 2 4
SMAS Penabur 3 4 7
SMAS Taman Harapan 1 3 2 5
Jatiasih
SMAS 11 Bekasi 4 2 6
SMAS Ar Ridwan 1 3 4
SMAS Gema Islami 1 2 3
SMAS IT Yapidh 2 2 4
SMAS Malidar 1 3 4
SMAS Mudi Al Aziziyyah 1 2 3
SMAS Tulus Bhakti 3 1 4
North
Bekasi
SMAN 20 Bekasi 2 2 4
SMAN 14 Bekasi 5 2 7
SMAN 4 Bekasi 5 2 7
SMAS Galajuara 1 2 3
SMA Islam Al-Azhar 8 3 4 7
SMA IT Al Muchtar 1 4 5
SMA Kristen Penabur Summarecon
Bekasi
2 4
6
SMA PGRI 2 Kota Bekasi 1 3 4
SMAS Darut Taubah 1 4 5
SMAS Flora 1 1 2
SMAS Islam An Nur 1 2 3
SMAS IT Gema Nurani 1 2 3
SMAS Mutiara 17 Agustus 3 4 7
SMAS Taman Harapan 2 1 2 3
After being calculated based on the calculation of the suitability by adding up the scoring of each
sub variable, it can be concluded that the value of the location of the school that provides inclusive

50
Hasanah et al. (2021). Jurnal Geografi Lingkungan Tropik (Journal of Geography of Tropical Environments), 5 (1), 40-52
education in the city of Bekasi is based on the school layout. The number of scores generated is divided
into several criteria which have been adjusted to the existing criteria in the variable. The scoring of each
criterion can be seen in table 9.
Table 9. Value and Criteria of Capacity Conformity
Total Score Criteria
>8 Very Suitable
7 - 8 Suitable
5 – 6 Moderately Suitable
3 – 4 Less Suitable
1 – 2 Marginally Suitable
So that it can form a map to evaluate the suitability of school location that provide inclusive
education. The results showed that the calculation of school's capacity resulted in 20% of total number
of schools in Suitable category, 27% of schools that were in Moderately Suitable criteria, 50% were in
less suitable criteria, and only 3% of schools were in marginaly suitable criteria in three research sub-
districts with highest percentage of educational facilities in Bekasi City.
Figure 1. Distribution of Senior High School in North Bekasi Sub-District Based on School Capacity
Legend

51
Hasanah et al. (2021). Jurnal Geografi Lingkungan Tropik (Journal of Geography of Tropical Environments), 5 (1), 40-52
Figure 2. Distribution of Senior High School in Jatiasih Sub-District and Medan Satria Sub-District
Based on School Capacity
4. Conclusions
School characteristics can be seen as quality of the capacity for each school. In this study, it can be seen
that schools in three sub-districts with the highest percentage of educational facilities availability can
accommodate 1-7 study groups on average, the proportion of facilities and infrastructure for children
with special needs reaches 55.5%. The research showed that the calculation of school's capacity resulted
in 20% of total number of schools in suitable criteria, 27% of schools that were in moderately suitable
criteria, 50% were in less suitable criteria, and only 3% of schools were in marginally suitable criteria.
52
Hasanah et al. (2021). Jurnal Geografi Lingkungan Tropik (Journal of Geography of Tropical Environments), 5 (1), 40-52
References
Amka (2017). Problems and challenges in the implementation of inclusive education in Indonesia.
International Journal of Humanities and Social Science, 7(10), 159-167.
Ariastita, P.G. (2017). Strategi Penerapan Kota Kompak Berdasarkan Pola Urban Compactness di Kota
Bekasi.
Cousins, J. (2005). Disabled children who need permanence: Barriers to placement. Adoption &
Fostering, 29(3), 6-20. https://doi.org/10.1177/030857590502900303
Elsley, S. (2004). Children’s experience of public space. Children and Society, 18(2), 155–164.
https://doi.org/10.1002/chi.822
Hakim, L. (2016). Pemerataan akses pendidikan bagi rakyat sesuai dengan amanat Undang-Undang
Nomor 20 Tahun 2003 tentang Sistem Pendidikan Nasional. EduTech: Jurnal Ilmu Pendidikan
Dan Ilmu Sosial, 2(1), 53–64. Retrieved from:
http://jurnal.umsu.ac.id/index.php/edutech/article/view/575
He, S.Y. & Giuliano, G. (2018). School choice: understanding the trade-off between travel distance and
school quality. Transportation, 45, 1475-1498. https://doi.org/10.1007/s11116-017-9773-3
Lithari, E. & Roger, C. (2017). Care-less spaces and identity construction: transition to secondary
school for disabled children. Children’s Geographies, 15(3), 259-273.
https://doi.org/10.1080/14733285.2016.1219021
Murdianto, M. & Jayadi, S. (2020). Discriminative stigma against inclusive students in vocational high
school in Mataram, Indonesia. International Journal of Multicultural and Multireligious
Understanding, 7(1), 614-622. https://doi.org/10.1080/14733285.2016.1219021
Pearman, F.A. & Swain, W.A. (2017). School choice, gentrification, and the variable significance of
racial stratification in urban neighborhoods. Sociology of Education,90(3), 213-235.
https://doi.org/10.1177/0038040717710494
Peraturan Menteri Pendidikan Nasional Republik Indonesia (PERMENDIKNAS). 2008. Standar sarana
dan prasarana untuk Sekolah Dasar Luar Biasa (SMA PENYELENGGARA PENDIDIKAN
INKLUSIF), Sekolah Menengah Pertama Luar Biasa (SMPLB), dan Sekolah Menengah Atas
Luar Biasa (SMALB). Peraturan Menteri Pendidikan Nasional RI Nomor 33 Tahun 2008.
Thelin, M. & Niedomysl, T. (2015). The (ir)relevance of geography for school choice: Evidence from
a Swedish choice experiment. Geoforum, 67, 110-120.
https://doi.org/10.1016/j.geoforum.2015.11.003
Wibowo, S.B. & Muin, J.A. (2018). Inclusive education in Indonesia: Equality education Access for
disabilities. The 1st International Conference on South East Asia Studies, KnE Social Sciences,
484-493. https://doi.org/10.18502/kss.v3i5.2351
Yoon, E., Lubienski, C., & Lee, J. (2017). The geography of school choice in a city with growing
inequality: the case of Vancouver. Journal of Educational Policy, 33(2), 279-298.
https://doi.org/10.1080/02680939.2017.1346203