Suburban v Rural Eastern Screech Owls in Texas: Nested earlier (urban heat island) Larger clutches...
35
Suburban v Rural Eastern Screech Owls in Texas: Nested earlier (urban heat island) Larger clutches (more food) More and larger fledglings (food and low predation) More recruits into population Higher fitness
-
Upload
patience-golden -
Category
Documents
-
view
214 -
download
0
Transcript of Suburban v Rural Eastern Screech Owls in Texas: Nested earlier (urban heat island) Larger clutches...
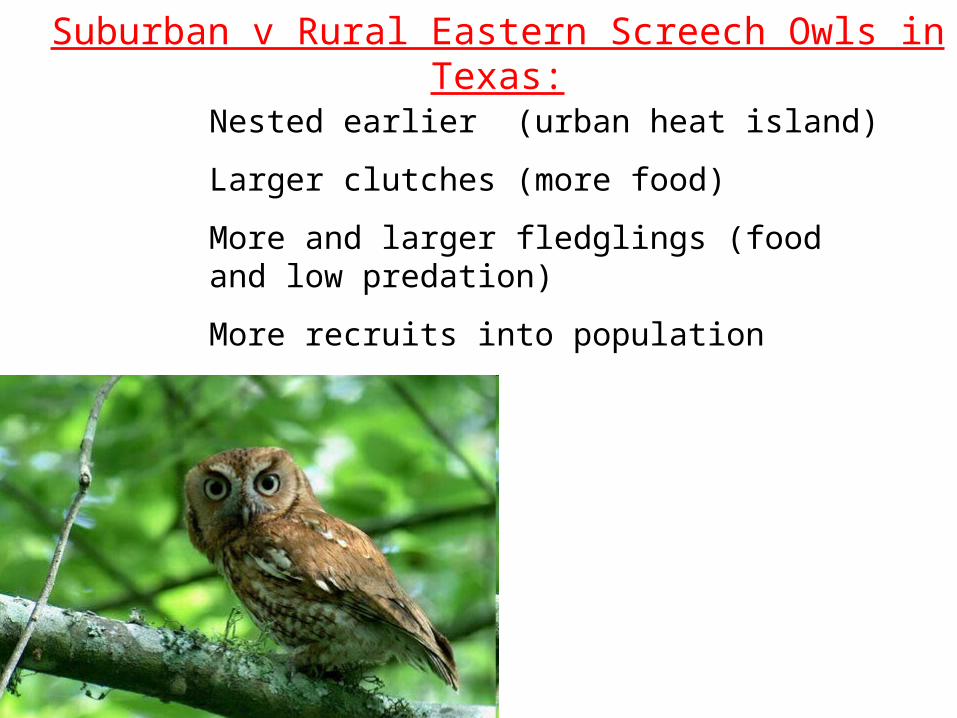
Suburban v Rural Eastern Screech Owls in Texas:
Nested earlier (urban heat island)
Larger clutches (more food)
More and larger fledglings (food and low predation)
More recruits into population
Higher fitness
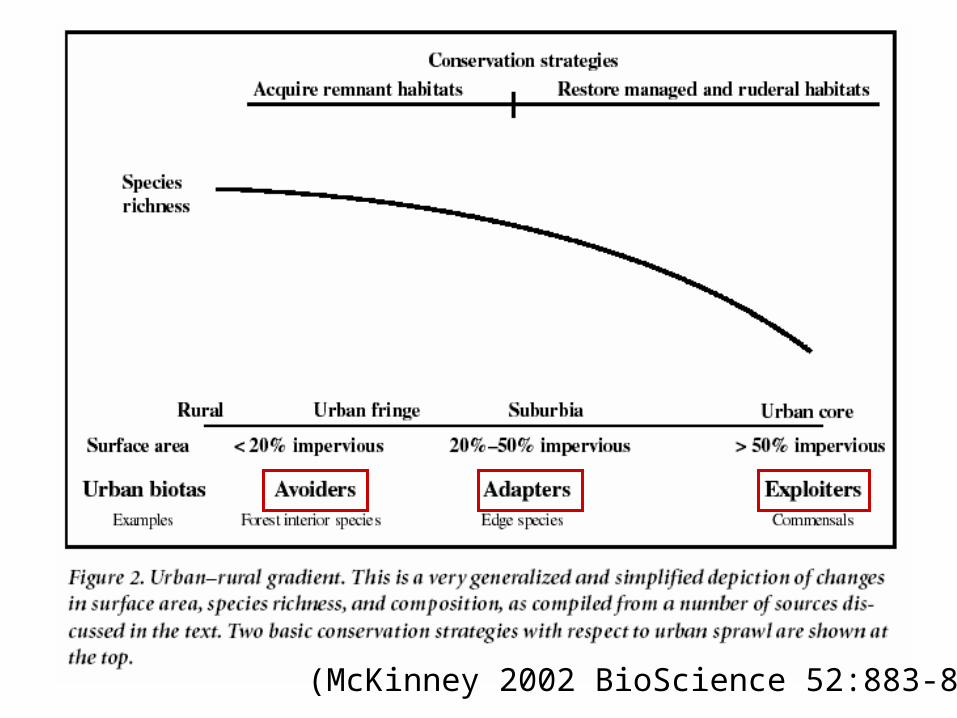
(McKinney 2002 BioScience 52:883-890)
Controlling Sprawl
• Sprawl is a strong driver of the urban footprint– results in loss, fragmentation, and degradation of
habitat– increases energy use– increases pollution from commuting
• Growth Management is needed to control it– Limits most future growth inside Urban Growth
Boundary– May just displace the problem if regional planning is
not incorporated (leapfrogging)
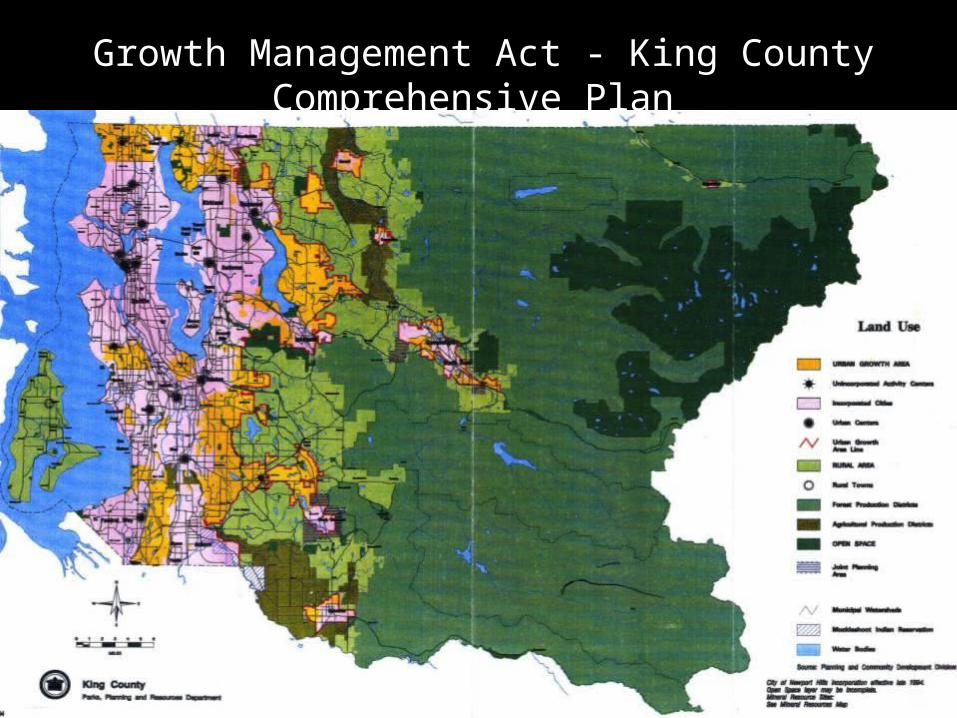
Growth Management Act - King County Comprehensive Plan
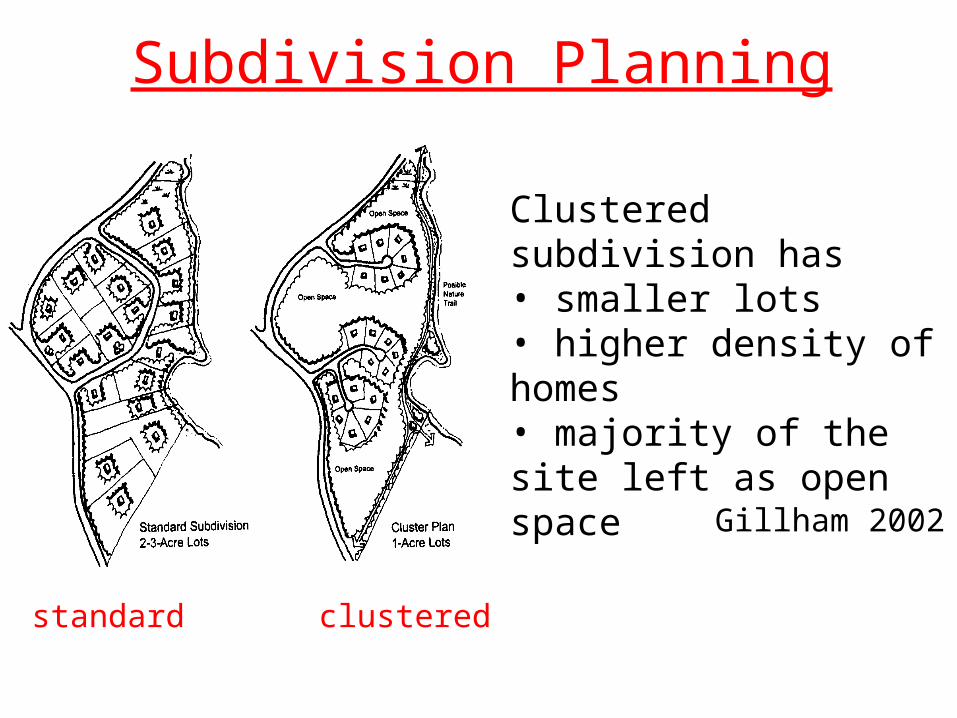
Clustered subdivision has • smaller lots• higher density of homes• majority of the site left as open space
Gillham 2002
Subdivision Planning
standard clustered

Wildlife Conservation in Urban Areas
1. Preserve large areas of habitat the area, numbers, and connectivity of reserves
should be maximized buffers should be maintained around reserves the amount of edge and degree of fragmentation
within reserves should be minimized the scale of reserve planning should be expanded
beyond the local area to include entire watersheds and bioregions
(Marzluff and Ewing 2001)
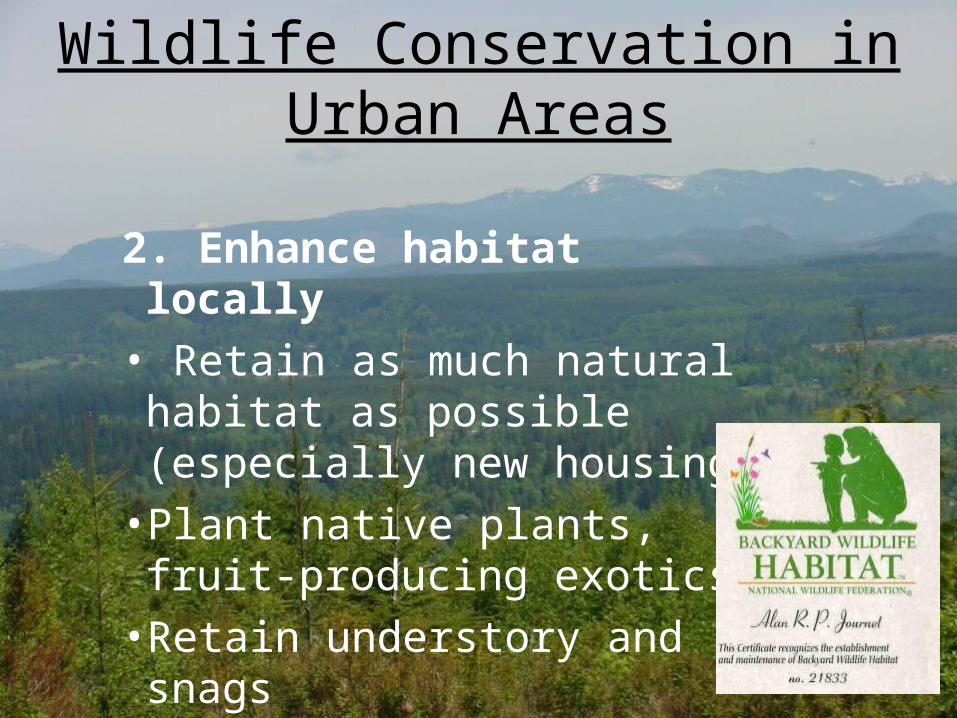
Wildlife Conservation in Urban Areas
2. Enhance habitat locally
• Retain as much natural habitat as possible (especially new housing)
• Plant native plants, fruit-producing exotics
• Retain understory and snags
• Minimize lawn cover
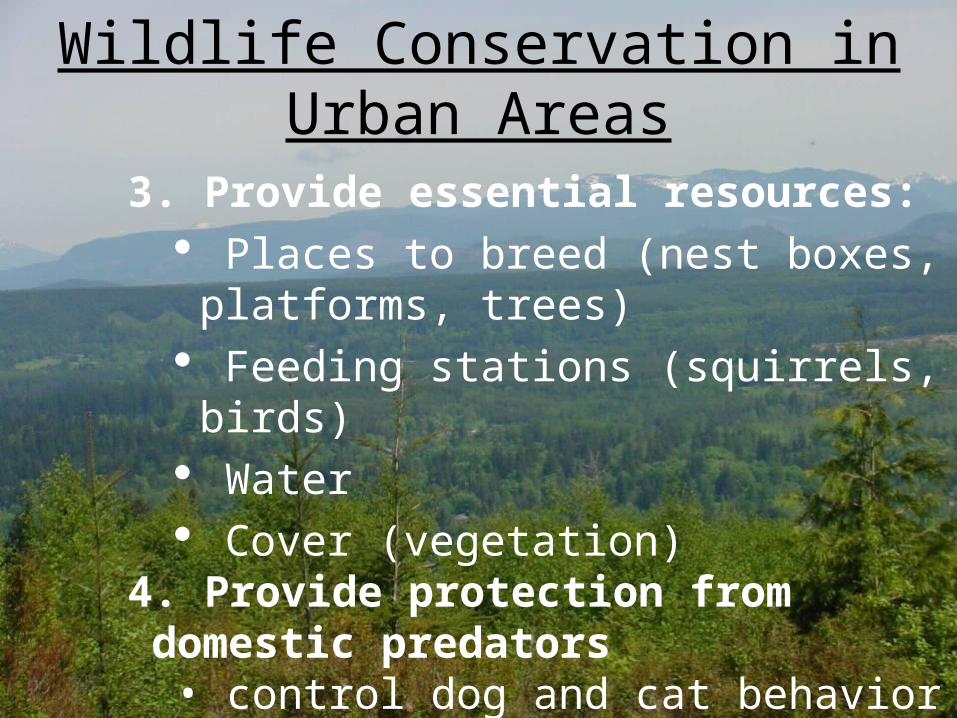
3. Provide essential resources: Places to breed (nest boxes, platforms,
trees) Feeding stations (squirrels, birds) Water Cover (vegetation)
4. Provide protection from domestic predators
• control dog and cat behavior
Wildlife Conservation in Urban Areas
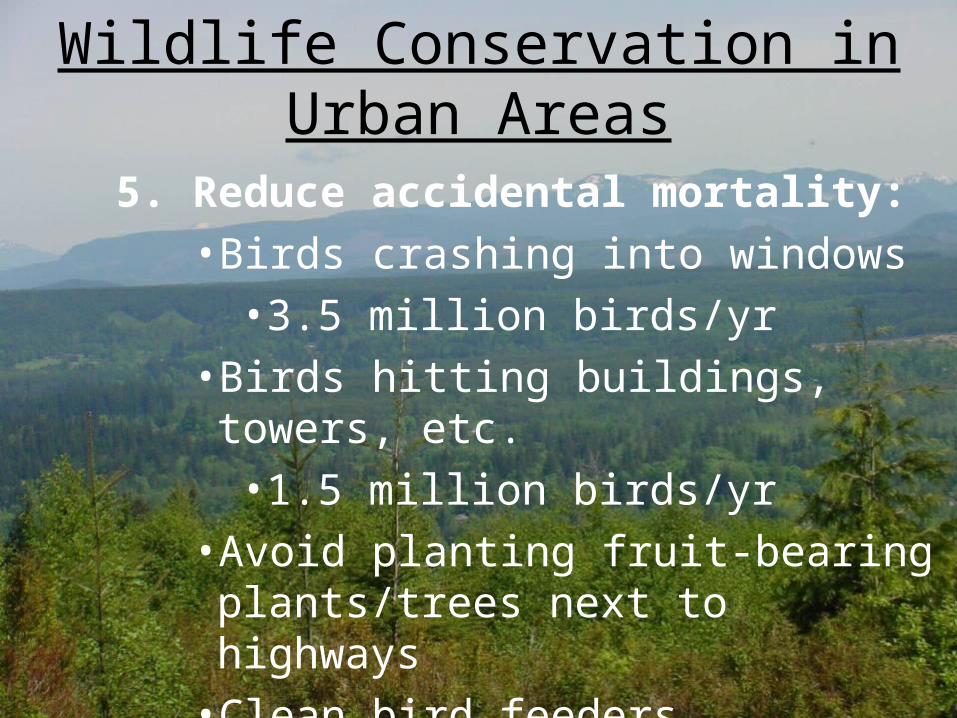
5. Reduce accidental mortality:
• Birds crashing into windows
• 3.5 million birds/yr
• Birds hitting buildings, towers, etc.
• 1.5 million birds/yr
• Avoid planting fruit-bearing plants/trees next to highways
• Clean bird feeders frequently (Salmonella)
Wildlife Conservation in Urban Areas
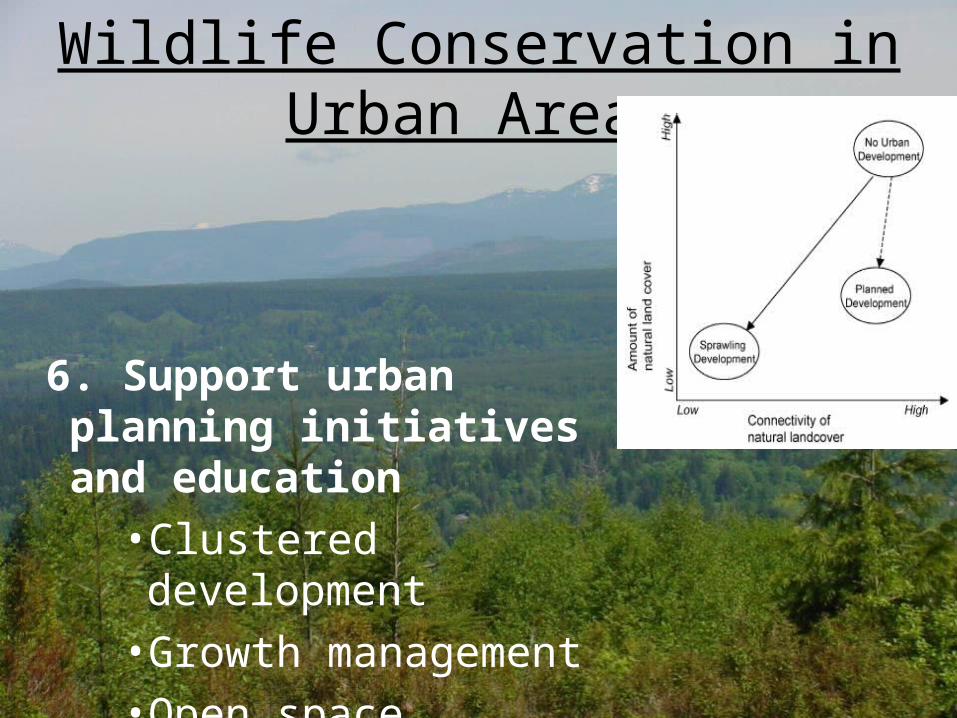
6. Support urban planning initiatives and education
• Clustered development
• Growth management
• Open space preservation
Wildlife Conservation in Urban Areas
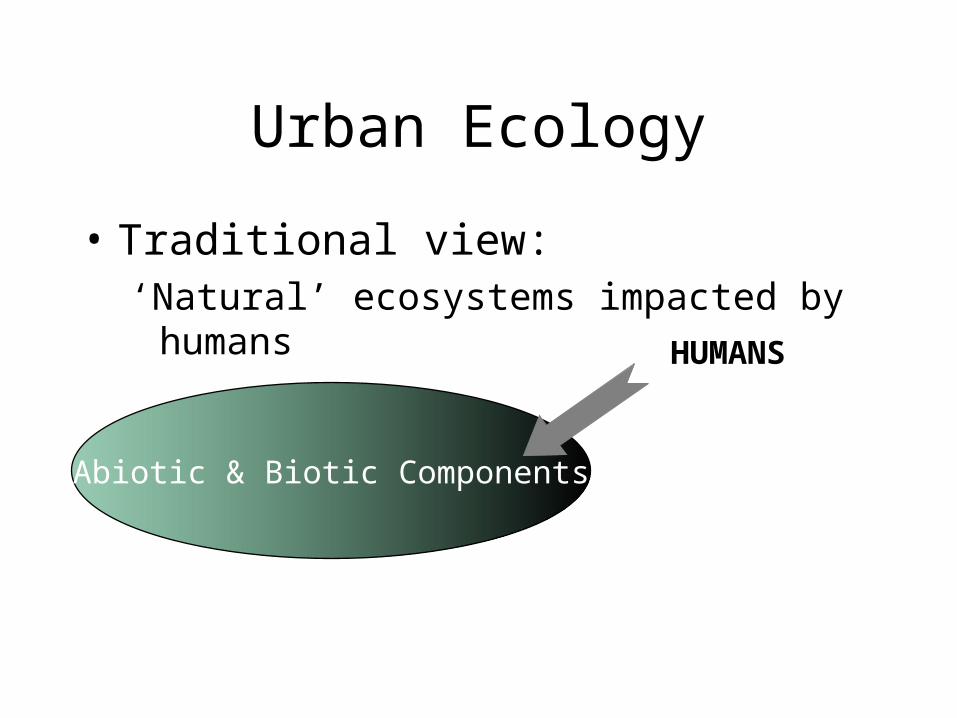
Urban Ecology
• Traditional view:‘Natural’ ecosystems impacted by humans
Abiotic & Biotic Components
HUMANS
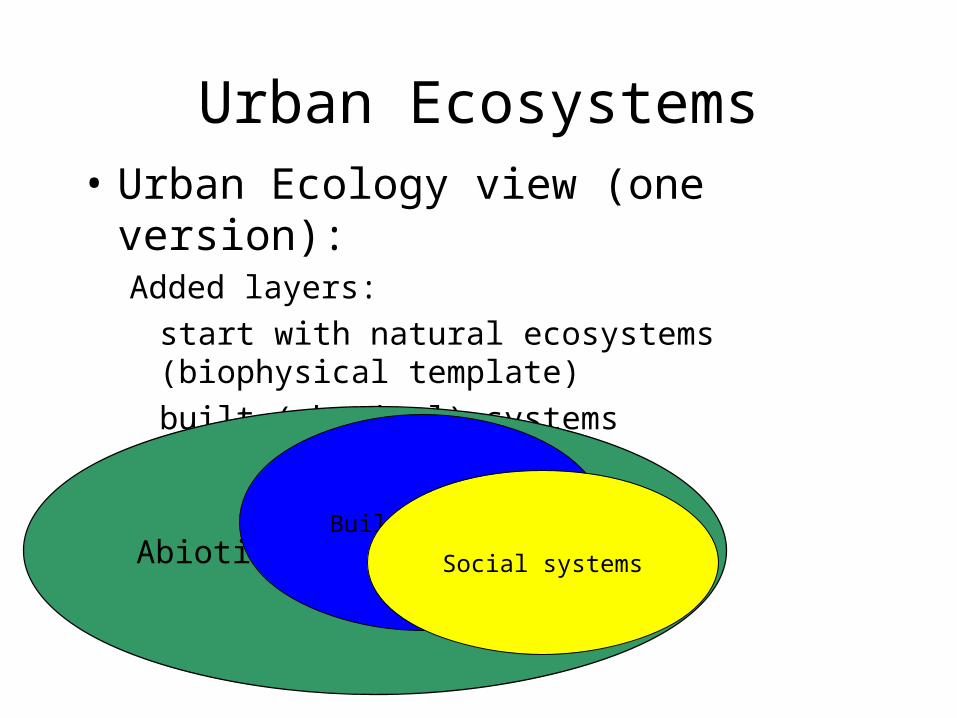
Urban Ecosystems• Urban Ecology view (one version):
Added layers:
start with natural ecosystems (biophysical template)
built (physical) systems
social systems
Abiotic & BioticBuilt systems
Social systems
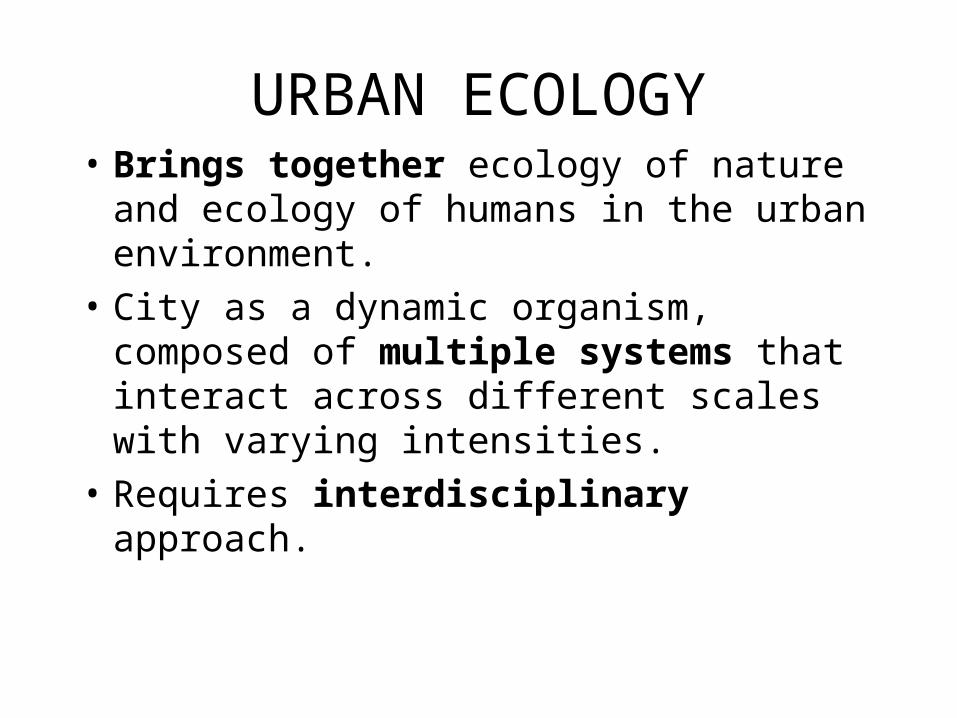
URBAN ECOLOGY• Brings together ecology of nature and
ecology of humans in the urban environment.
• City as a dynamic organism, composed of multiple systems that interact across different scales with varying intensities.
• Requires interdisciplinary approach.
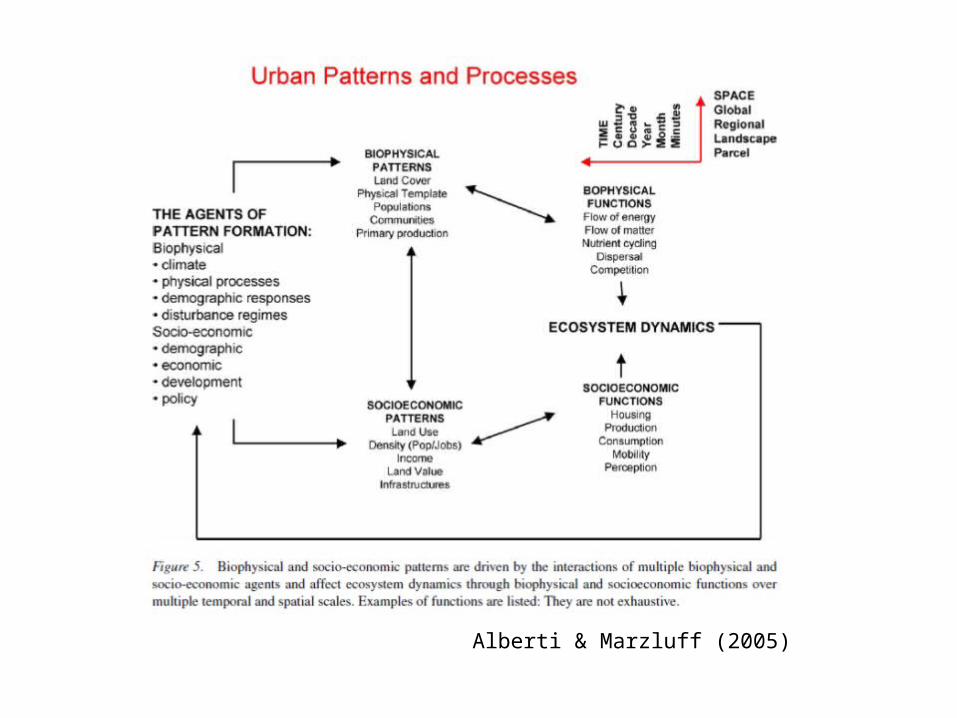
Alberti & Marzluff (2005)

Impacts of 2nd home development
M. Kondo, R. Rivera & S.Rullman • Land conversion in exurban and rural areas has
become the nation’s dominant mode of land development
• In areas with particular key natural amenities, second homes may be a significant part of this land conversion
• Much of the second home development occurs in areas that are ecologically sensitive and high in native biodiversity
• Second homes create an increase in the number of households and may lead to more complex ecological consequences than simply the space they occupy
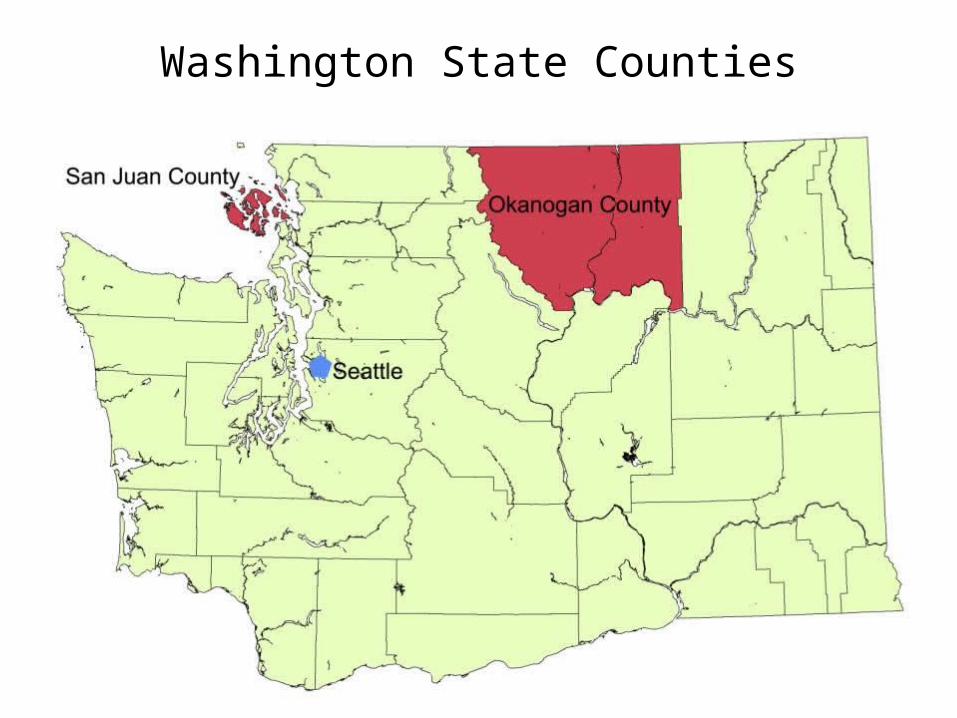
Washington State Counties

Spatial Analysis Results
Common Themes in Both Case Study Counties:• Open space resources drive second home location (shorelines,
public land)
Unique Characteristics of Case Study Counties:• Okanogan
– Small parcels more prone to second home development– Second home location driven by aesthetic rather than
recreational preferences• San Juan
– Ferry access less important to second home owners than primary
– Steep slopes prone to second home development
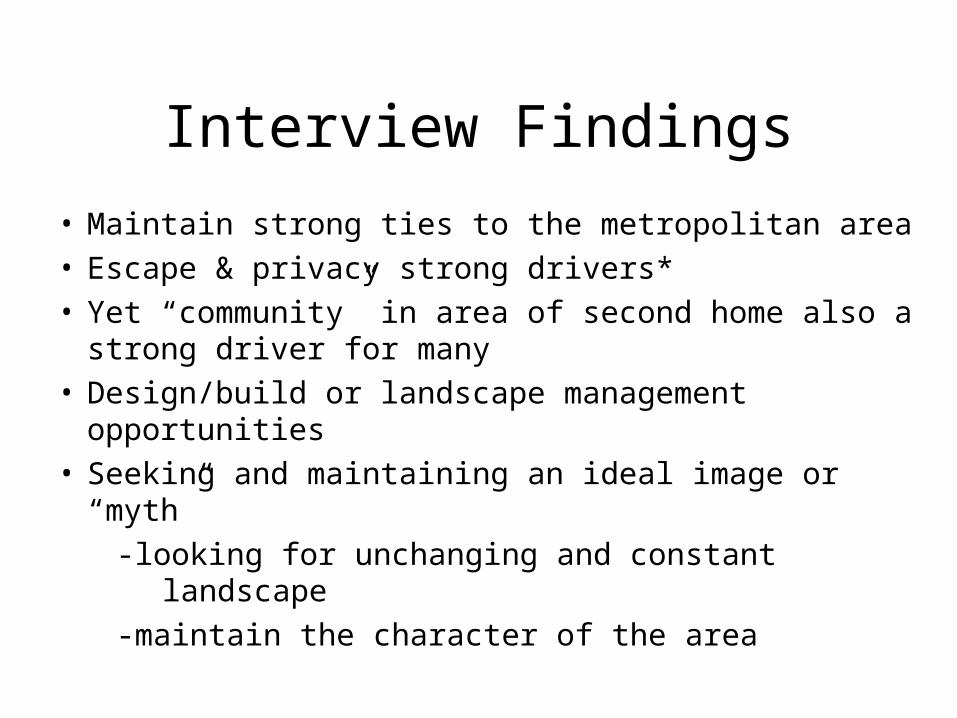
Interview Findings
• Maintain strong ties to the metropolitan area• Escape & privacy strong drivers* • Yet “community” in area of second home also a strong
driver for many• Design/build or landscape management opportunities• Seeking and maintaining an ideal image or “myth”
-looking for unchanging and constant landscape
-maintain the character of the area
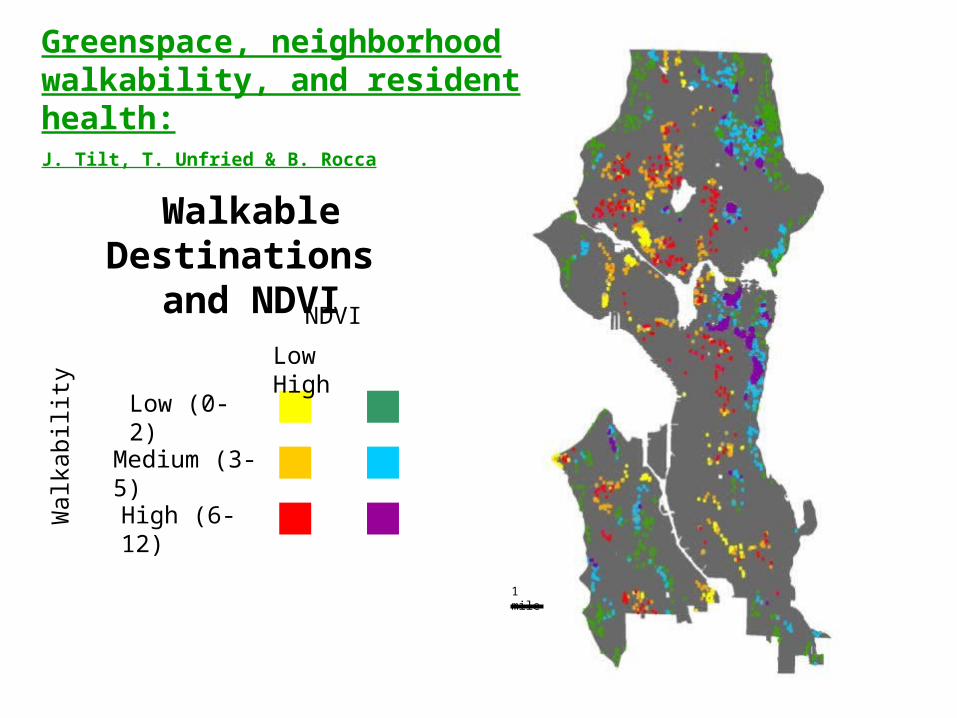
Low (0-2)
Medium (3-5)
High (6-12)Wal
kabi
lity
Low High
NDVI
Walkable Destinations and NDVI
1 mile
Greenspace, neighborhood walkability, and resident health:J. Tilt, T. Unfried & B. Rocca
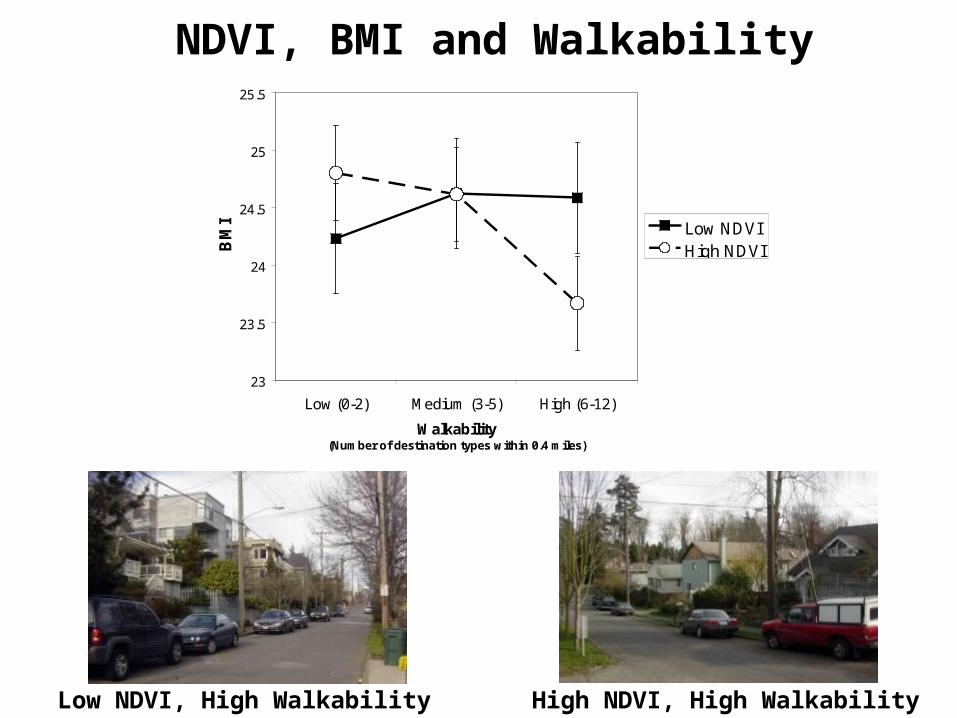
NDVI, BMI and Walkability
Low NDVI, High Walkability High NDVI, High Walkability
23
23.5
24
24.5
25
25.5
Low (0-2) Medium (3-5) High (6-12)
Walkability (Number of destination types within 0.4 miles)
BM
I Low NDVIHigh NDVI
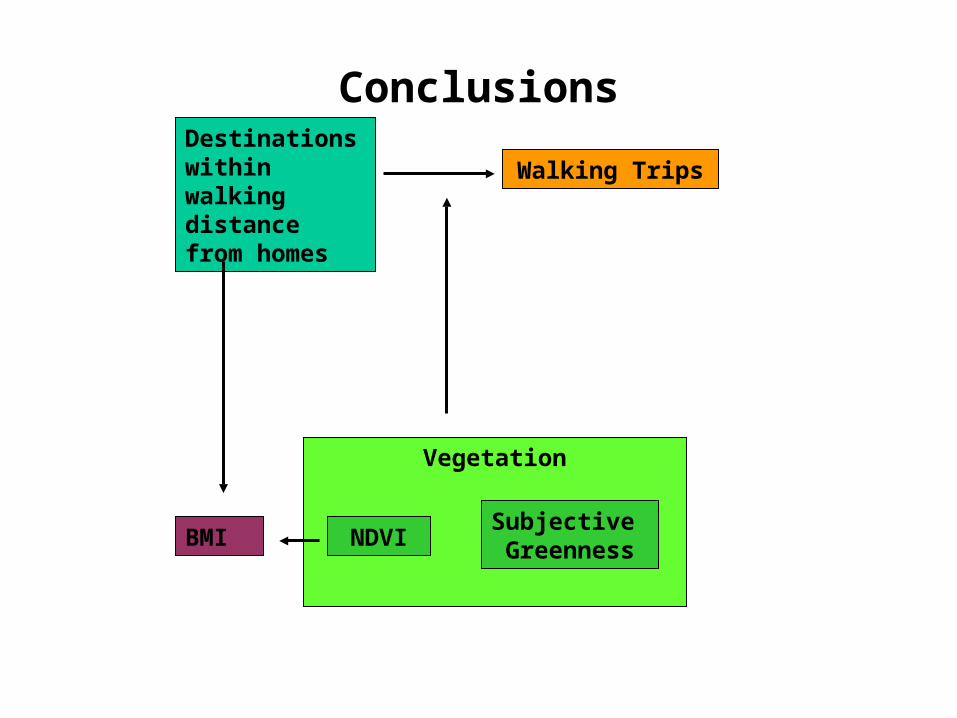
ConclusionsDestinations within walking distance from homes
Walking Trips
Vegetation
BMI NDVISubjective Greenness

Using Predicted Land Cover Change to Predict Changes in Biodiversity in the Central Puget Sound, Washington, USA
Jeffrey Hepinstall, Marina Alberti,
John MarzluffUniversity of Washington
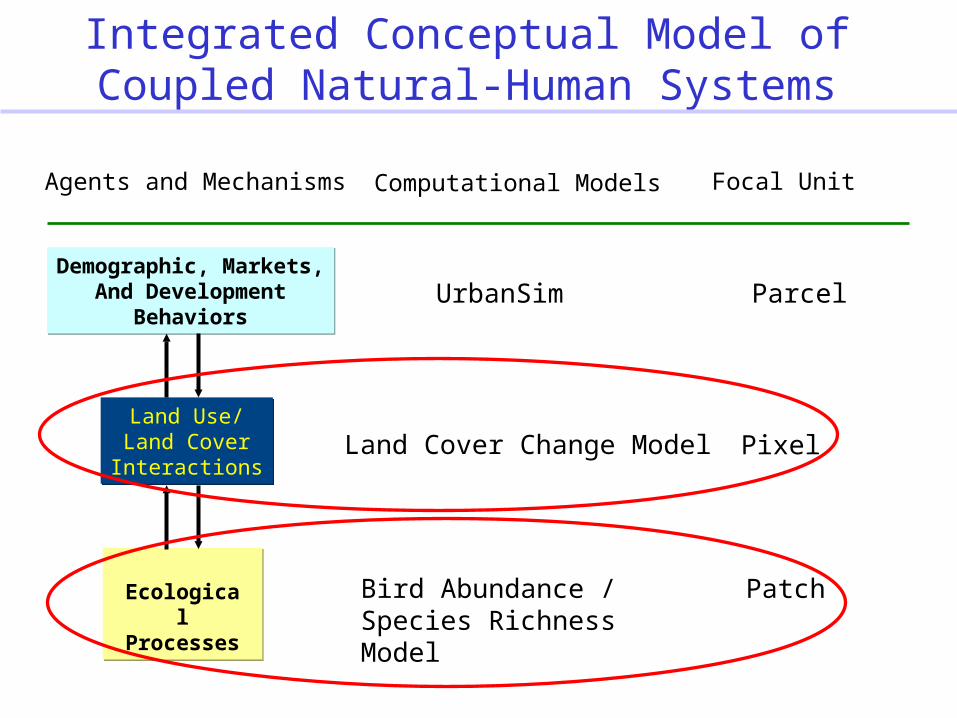
Integrated Conceptual Model of Coupled Natural-Human Systems
Demographic, Markets,And Development
Behaviors
Demographic, Markets,And Development
BehaviorsUrbanSim Parcel
Agents and Mechanisms Computational Models
Bird Abundance / Species Richness Model
Ecological Processes
Patch
Land Use/Land CoverInteractions
Land Use/Land CoverInteractions
Land Cover Change Model Pixel
Focal Unit

Pixel probabilitiesof land cover transition
Monte Carlo Simulations
Predicted Land Cover Time 3
Observed Land Cover Time 3
Predicting Landscape Change
Land Cover Time 1
Land CoverTime 2
Multinomial Logit equations of
Land cover transitions
ExplanatoryVariables (n = 68)
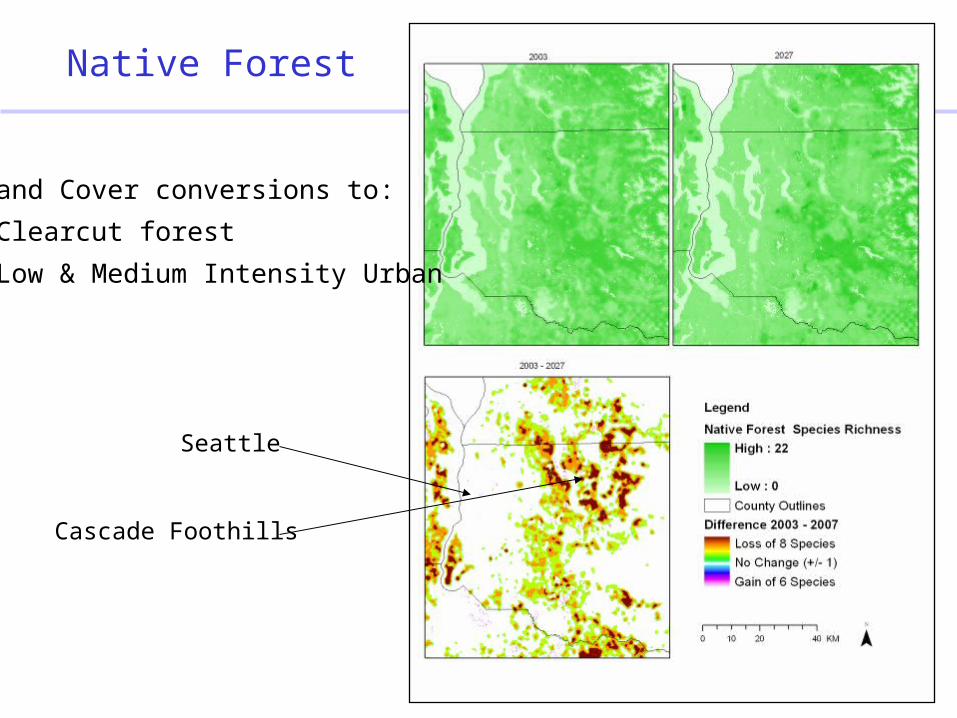
Native Forest
Seattle
Cascade Foothills
Land Cover conversions to:
-Clearcut forest
-Low & Medium Intensity Urban
Forest Functionality:A three-dimensional approach using bird
richness, home values, and resident satisfaction
Dave Oleyar*Dave Oleyar*John WitheyJohn Withey
Andrew Bjorn Andrew Bjorn Adrienne GreveAdrienne Greve

• EconomicEconomic : extraction income, increased property : extraction income, increased property valuesvalues
• SocialSocial : recreation and other direct uses, viewshed, : recreation and other direct uses, viewshed, psychological and physical health benefitspsychological and physical health benefits
• EcologicalEcological : biodiversity protection, wildlife habitat, : biodiversity protection, wildlife habitat, ecosystem servicesecosystem services
Forests are Valued in many ways….

• How do How do economic, social, economic, social, and and ecological ecological functions functions interact with each other in an urbanizing area?interact with each other in an urbanizing area?
Different Stakeholders Value Different Forest Functions
Study area is King County, WA

Urban Gradient
URBAN GRADIENT SCOREURBAN GRADIENT SCORE
Hig
hH
igh
Lo
wL
ow
Population Density (-0.817)Population Density (-0.817)
Distance to nearest forest patch (-0.753)Distance to nearest forest patch (-0.753)
% Forest (0.871)% Forest (0.871)
Size of nearest forest patch (0.709)Size of nearest forest patch (0.709)

• Linking Linking results to results to common common framework framework (gradient)(gradient)
• Examine Examine relative relative tradeoffs tradeoffs among among different different functionsfunctions
Integrating results
Gradient Score
-4 -3 -2 -1 0 1 2 3 4
Pro
port
ion
of M
axim
um F
unct
ion
Val
ue
0.0
0.2
0.4
0.6
0.8
1.0
Home sales price effects(max = 6.6% premium)
Satisfaction with neighborhood(max = 1.6 adjusted factor score)Bird species richness(max = 16 species predicted)

Gradient Score-4 -3 -2 -1 0 1 2 3 4
Pro
port
ion
of M
axim
um F
unct
ion
Val
ue
0.0
0.2
0.4
0.6
0.8
1.0
Home sales price effects(max = 6.6% premium)
Satisfaction with neighborhood(max = 1.6 adjusted factor score)Bird species richness(max = 16 species predicted)
• Identify areas of interest- divergence, convergenceIdentify areas of interest- divergence, convergence
Integrating results
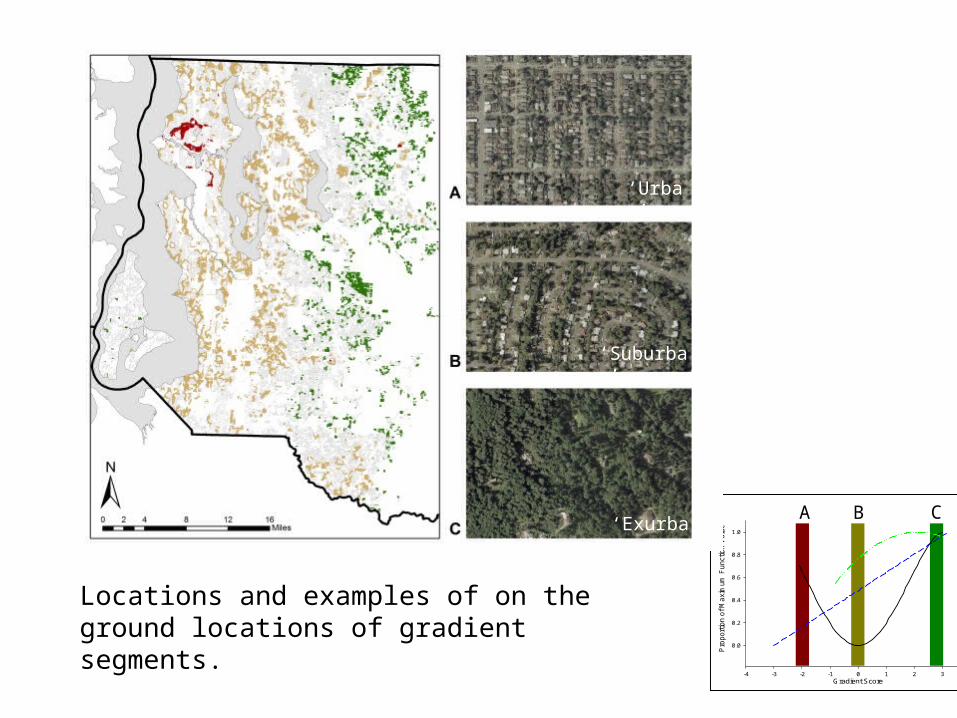
‘Urban’ ‘Suburban’ ‘Exurban’
Gradient Score-4 -3 -2 -1 0 1 2 3 4
Pro
po
rtio
n o
f M
axi
mu
m F
un
ctio
n V
alu
e
0.0
0.2
0.4
0.6
0.8
1.0
Home sales price effects(max = 6.6% premium)
Satisfaction with neighborhood(max = 1.6 adjusted factor score)Bird species richness(max = 16 species predicted)
A B C
Locations and examples of on the ground locations of gradient segments.
‘Urban’
‘Suburban’
‘Exurban’
Wildlife Science Paper:
Due next Thursday, 12 November 2009.
Questions???
In case you are interested in learning more about current studies of wolf/elk dynamics, Dr. Scott Creel from Montana State Univ. is giving a talk today at 400 in the Biology Dept Seminar:
Behavioral, Ecological, Physiological and Demographic Responses of Elk to Wolves
Location: Physics-Astronomy A102 See the below link for more details :
http://www.biology.washington.edu/index.html?navID=34&qtr=aut