Study of the Hexamethylenetetramine, Ammonia, and ...
156
Loyola University Chicago Loyola University Chicago Loyola eCommons Loyola eCommons Dissertations Theses and Dissertations 1992 Study of the Hexamethylenetetramine, Ammonia, and Study of the Hexamethylenetetramine, Ammonia, and Formaldehyde System: Quantitative Determinations Formaldehyde System: Quantitative Determinations Gary Lee Madsen Loyola University Chicago Follow this and additional works at: https://ecommons.luc.edu/luc_diss Part of the Analytical Chemistry Commons Recommended Citation Recommended Citation Madsen, Gary Lee, "Study of the Hexamethylenetetramine, Ammonia, and Formaldehyde System: Quantitative Determinations" (1992). Dissertations. 3187. https://ecommons.luc.edu/luc_diss/3187 This Dissertation is brought to you for free and open access by the Theses and Dissertations at Loyola eCommons. It has been accepted for inclusion in Dissertations by an authorized administrator of Loyola eCommons. For more information, please contact [email protected]. This work is licensed under a Creative Commons Attribution-Noncommercial-No Derivative Works 3.0 License. Copyright © 1992 Gary Lee Madsen
Transcript of Study of the Hexamethylenetetramine, Ammonia, and ...

Loyola University Chicago Loyola University Chicago
Loyola eCommons Loyola eCommons
Dissertations Theses and Dissertations
1992
Study of the Hexamethylenetetramine, Ammonia, and Study of the Hexamethylenetetramine, Ammonia, and
Formaldehyde System: Quantitative Determinations Formaldehyde System: Quantitative Determinations
Gary Lee Madsen Loyola University Chicago
Follow this and additional works at: https://ecommons.luc.edu/luc_diss
Part of the Analytical Chemistry Commons
Recommended Citation Recommended Citation Madsen, Gary Lee, "Study of the Hexamethylenetetramine, Ammonia, and Formaldehyde System: Quantitative Determinations" (1992). Dissertations. 3187. https://ecommons.luc.edu/luc_diss/3187
This Dissertation is brought to you for free and open access by the Theses and Dissertations at Loyola eCommons. It has been accepted for inclusion in Dissertations by an authorized administrator of Loyola eCommons. For more information, please contact [email protected].
This work is licensed under a Creative Commons Attribution-Noncommercial-No Derivative Works 3.0 License. Copyright © 1992 Gary Lee Madsen

LOYOLA UNIVERSITY OF CHICAGO
STUDY OF THE HEXAMETHYLENETETRAMINE,
AMMONIA, AND FORMALDEHYDE SYSTEM:
QUANTITATIVE DETERMINATIONS
A DISSERTATION SUBMITTED TO
THE FACULTY OF THE GRADUATE SCHOOL
IN CANDIDACY FOR THE DEGREE OF
DOCTOR OF PHILOSOPHY
DEPARTMENT OF CHEMISTRY
BY
GARY LEE MADSEN
CHICAGO, ILLINOIS
JANUARY 1992

Copyright, 1991, Gary Lee Madsen All Rights Reserved.

TABLE OF CONTENTS
LIST OF ILLUSTRATIONS
LIST OF TABLES
LIST OF ABBREVIATIONS
INTRODUCTION Purpose .... Background and Applications
Structure . Formation .. Hydrolysis Applications Determinations
SPECTROPHOTOMETRIC DETERMINATION OF HEXAMETHYLENETETRAMINE AND AMMONIA
Introduction Statement of Problem and Approach
Experimental Instrumentation. Reagents ....
Development of Methods Optimization of HMT Test Parameters Evaporation of Formaldehyde .. . Reduction of Formaldehyde ... . Quantitative Ammonia Condensation With Formaldehyde to
Form HMT. Urine Samples
Procedures .... Determination of Aqueous HMT Determination of HMT by USP XXII Chromotropic Acid
Method .............. . Determination of HMT-monomandelate Determination of HMT in the Presence of a Large Amount
of Formaldehyde ..... Determination of Ammonia Determination of HMT in Urine
Results and Discussion ..... . Determination of Aqueous HMT Alone Determination of HMT by the USP XXII Chromotropic Acid
Method . . . . . . . . ..... Determination of HMT in the Presence of a Large Amount
of Formaldehyde Determination of Ammonia Determination of HMT in Urine
ii
V
viii
ix
1 1 2 2 5
11 12 13
16 16 18 23 23 23 24 24 31 35
38 41 41 41
44 44
44 48 48 51 51
54
59 63 67

THE DETERMINATION OF HEXAMETHYLENETETRAMINE AND AMMONIA BY NUCLEAR MAGNETIC RESONANCE SPECTROSCOPY
Introduction ............ . Background .......... . Statement of Problem and Approach
Experimental .... Instrumentation. Reagents ....
Development of Methods Solvent Solution Reference Standard NMR Instrument Parameters Evaporation of Water Evaporation of Formaldehyde Extraction of HMT .... Reduction of Formaldehyde Urine Samples ..... .
Procedures . . . . . . . . . . Determination of Solid HMT Determination of Aqueous HMT Determination of HMT in the Presence of a Large Excess
of Formaldehyde .... . Determination of Ammonia .... . Determination of HMT in Urine .. . Determination of HMT-Monomandelate
Results and Discussion Determination of Aqueous HMT Determination of HMT in the Presence of a Large Excess
of Formaldehyde ..... Determination of Ammonia Determination of HMT in Urine
ION EXCHANGE DETERMINATION OF AMMONIA .. Introduction ......... .
Statement of Problem and Purpose of Research Experimental ....
Instrumentation Reagents
Development of Method Optimization of Exchange Parameters Optimization of Atomic Absorption Parameters
Procedure ..... Determination of Ammonia by Quantitative Lithium Ion
Exchange .................. . Determination of Ammonia by Ammonium-Lithium Ion
Exchange Equilibrium ............ . Results and Discussion ............... .
Determination of Ammonia by Quantitative Lithium Ion Exchange .....
Determination of Ammonia by Ammonium-Lithium Ion Exchange Equilibrium . . . . . . . . . . . . . . . . . . . . .
iii
70 70 70 76 79 79 79 80 80 81 82 85 86 88 93 93 98 98 98
99 103 103 104 104 105
108 112 116
118 118 121 122 122 122 123 123 127 129
130
131 131
131
134

SUMMARY AND SUGGESTIONS FOR FUTURE WORK
REFERENCES
Vita
iv
136
139
143

LIST OF ILLUSTRATIONS
Figure Page
1. Time study for hydrolysis yield of HMT at various temperatures and perchloric acid concentrations 27
2. Study of pH effects on hydrous silver oxide reaction with HMT hydrolyzed formaldehyde . . . . 29
3. Study of the amount of silver(!) required for optimum results at pH 12.8 . . . . . ...
4. Flow diagram of the optimized HMT determination parameters .
5. Study of blank residual absorbances in HMT standards following borohydride reduction. The standards were studied with formaldehyde at concentrations of Oto
29
30
0. 2 M . . . . . . . . . . . . . . . . . . . . . 37
6. Time study of ammonia condensation with formaldehyde at various temperatures and formaldehyde:ammonia ratios 40
7. Flow diagram for the HMT determination procedure 43
8. Flow diagram for formaldehyde interference removal by evaporation or reduction. . . . . . . . 47
9. Flow diagram for the removal of urine interferences 50
10. Calibration curve for the determination of pure aqueous HMT and synthetic unknown samples . . . . 53
11. Chromotropic acid calibration curve for the determination of pure aqueous HMT and synthetic unknown samples 56
12. Chromotropic acid determination of formaldehyde standards ......... .
13. Hydrous silver(!) oxide iron(III)-Ferrozine calibration curve for formaldehyde in synthetic unknowns ....
14. Calibration curve for the determination of HMT samples and CH20-HMT synthetic unknown samples after evaporation . . . . . . . . . . . . . . . . . .
V
57
57
61

15. Calibration curve for the determination of HMT samples and CH20-HMT synthetic unknown samples after
16.
borohydride reduction ............ .
Calibration curve for the determination of ammonia samples and synthetic unknown samples after evaporation . . . . . . . . . . . . .
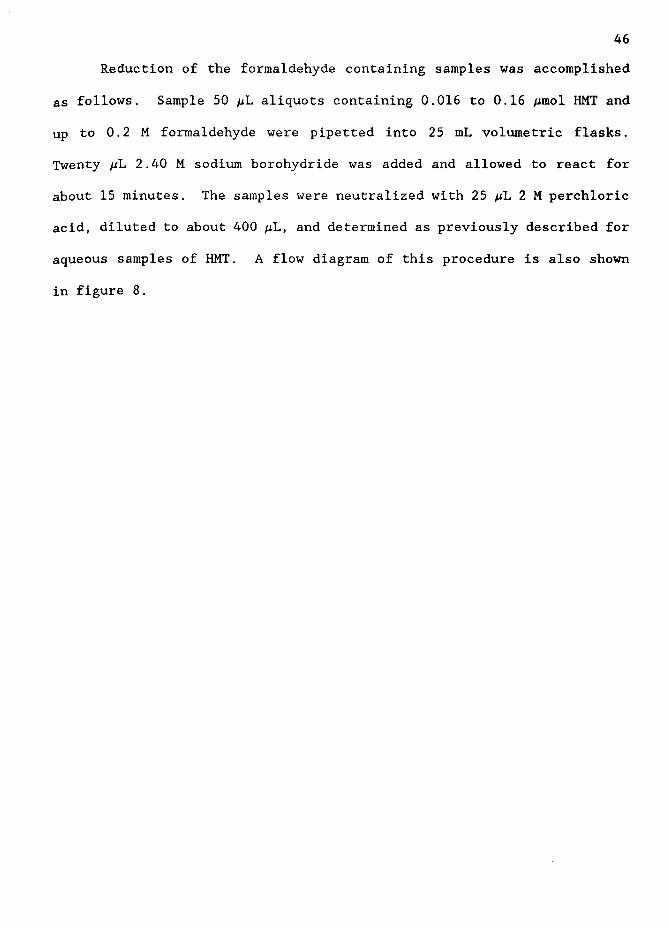
17. Calibration curve for the determination of ammonia samples and synthetic unknown samples after
62
64
borohydride reduction . . . . . . . . . . . . 65
18. Standard additions curve for the determination of HMT in urine samples . . . . . . . . . . . . . 69
19. The spin state energy separation as a function of the strength of the applied magnetic field (H
0)
20. Example of FID signal containing all proton resonance
73
signals . . . . . . . . . . . . . . . . 74
21. Transformed FT-NMR frequency domain spectrum 74
22. Example FT-NMR spectrum of HMT and anisole in d-acetonitrile solvent using the optimized instrumental parameters. The inset spectrum shows the HMT and anisole peaks integrated in the standard manner ....
23. Example of FT-NMR spectrum determination of HMT with formaldehyde residue interference remaining after
84
evaporation of formaldehyde . . . . . . . . . . . 87
24. Elution profile for break up and extraction of HMT-BCG ion pair using 0.01 M perchloric acid in acetonitrile 91
25. Flow diagram for HMT extraction from formaldehyde containing sample . . . . . . ... 92
26. NMR plot of evaporated urine sample with no pretreatment to remove interferences . . . . . . . . . . . . 95
27. NMR plot with standard integration showing broad interference remaining in sample after the extraction procedure . . . . . . . . . . 96
28. Expanded plots of HMT and anisole peaks from figure 27 using the alternate method of signal area integration 97
29. Flow diagram for extraction procedure . 102
vi

30. Calibration curve for the determination of pure aqueous HMT and synthetic unknown samples ........... 107
31. Calibration curve for the determination of HMT samples and formaldehyde-HMT synthetic unknown samples after evaporation removal of formaldehyde ........... 110
32. Calibration curve for the determination of HMT samples and formaldehyde-HMT synthetic unknown samples after HMT-BCG ion pair extraction . . . . . . . . . . . .. 111
33. Calibration curve for the determination of ammonia samples and synthetic unknown samples after evaporation removal of formaldehyde . . . . . .... 114
34. Calibration curve for the determination of ammonia samples and synthetic unknown samples after HMT-BCG ion pair extraction . . . . . . . . . . . . . . . 115
35. Standard additions curve for the determination of HMT in urine samples . . . . . . . . . . . 117
36. Solvent-Li+ exchange at various acetone-water mixtures 126
37. Determination of weight distribution coefficient (D9
) at various acetone-water mixtures . . . . . . . . . . . 126
38. Calibration curve samples in 0.1 ion exchange .
for the determination of ammonium ion M boric acid by quantitative lithium
39. Calibration curve for the determination of ammonium ion samples in 0.1 M boric acid by quantitative lithium
. .. 133
ion exchange equilibrium ................. 135
vii

LIST OF TABLES
Table Page
1. Physical properties of hexamethylenetetramine . . . . . 4
2. Various types of methods available for milligram amount determinations of HMT . . . . . . . . . . . . 13
3. Various methods reported for the determination of low microgram amounts of HMT . . . . . . . . 14
4. Time study for hydrolysis of HMT at various temperatures and perchloric acid concentrations . . . . . 26
5. Aspirator vacuum evaporation study of 150 µL samples containing metal salts to prevent sublimation of HMT 34
6. Determination of HMT in simulated pure aqueous unknown samples and formaldehyde containing unknown samples 52
7. Determination of HMT in simulated pure aqueous unknown samples by the USP chromotropic acid method 58
8.
9.
10.
Determination of ammonia in simulated unknown samples
Spin quantum numbers of some common nuclei
Instrument parameters used for FT-NMR determinations
11. Determination of HMT in aqueous samples
12. Determination of HMT in the presence of a large amount of formaldehyde by evaporation and extraction-evaporation
66
73
83
106
methods . . . . . . . . . . . . . . . . . . . . . 109
13. Determination of ammonia in synthetic unknown samples by the evaporation and extraction-evaporation methods .. 113
14. Optimized graphite furnace parameters programmed into the furnace controller . . . . . . . . . . . . . . . . . . 128
viii

AA
abs
ACS
A
BCG
oc
cm
cone
Dg
DMG
0
FID
FTNMR
g
GC
GFAA
H
HMT
HMX
HPLC
Hz
I
LIST OF ABBREVIATIONS
atomic absorption
absorbance
American Chemical Society
angstroms
bromocresol green
degrees Celsius
centimeters
concentrated
weight d.istribution coefficient
dimethylglyoxime
nuclear magnetic resonance chemical shift units
free induction decay
fourier transform nuclear magnetic resonance
grams
gas chromatography
graphite furnace atomic absorption
magnetic field strength
hexamethylenetetramine
high melting explosive
high pressure liquid chromatography
hertz
spin number
ix

i.d.
M
meq
mg
MHz
mM
mm
mmol
µg
µL
run
µsec
NMR
ppb
ppm
RDX
rf
r2
sec
USP
inside diameter
molar
milliequivalents
milligrams
megahertz
millimolar
millimeter
millimoles
micrograms
micro liters
nanometers
microseconds
nuclear magnetic resonance
parts per billion
parts per million
research division explosive
radio frequency
linear correlation coefficient squared
seconds
United States Pharmacopoeia
X

INTRODUCTION
Purpose
The goal of this study was to develop some novel techniques for the
quantitative determination of aqueous hexamethylenetetramine (HMT) in
microgram amounts in the presence of large amounts of formaldehyde. The
determination of HMT has been accomplished by many other researchers at
the milligram level but, there are relatively few methods for its
determination at the microgram level. Hexamethylenetetramine is formed
in slightly basic conditions by the condensation of ammonia and
formaldehyde. The products are HMT and water. Hexamethylenetetramine is
also quantitatively hydrolyzed to ammonia and formaldehyde in the presence
of a strong acid. Since formaldehyde is commonly present as an
interference in real life samples containing HMT, techniques to solve this
problem were developed.
The spectrophotometric portion of this study was developed for the
determination of HMT by employing a quantitative hydrolysis and subsequent
determination of the formaldehyde released. The method which uses a
technique developed for the determination of formaldehyde ultimately
measures the absorbance of an iron-Ferrozine complex. If large amounts
of formaldehyde are present in the sample, HMT determination cannot be
accomplished. Consequently, techniques to reduce this interference were
developed so that HMT can be determined in the presence of a large amount

2
of formaldehyde. Then ammonia can be indirectly determined by its
quantitative reaction with an excess of formaldehyde to form HMT.
The nuclear magnetic resonance (NMR) portion of this study was
developed to provide a direct determination of HMT. A unique property of
HMT is that it contains 12 equivalent protons that produce one single peak
in the NMR spectra. With the use of a 300 MHz fourier transforrn-NMR (FT
NMR), methods have also been developed for the quantitative determination
of microgram amounts of aqueous HMT in the presence of large amounts of
formaldehyde. For the determination, aqueous samples are evaporated to
dryness to remove water and formaldehyde and the residue is dissolved in
an NMR solvent containing a reference standard. This method can then also
be used to determine ammonia in the same manner as the spectrophotometric
method.
Since HMT is a common urinary tract antiseptic, techniques were
developed for both spectrophotometric and NMR determination of HMT in
urine samples. Urine samples containing HMT were analyzed after the
removal of interferences was accomplished.
Background and Applications
Structure:
Hexamethylenetetramine (HMT), (CH2 ) 6N4 , also known as 1,3,5,7-
tetraazatricyclo- [ 3. 3. 1. 13·7 ] -decane, metheneamine, hexamine,
hexamethyleneamine, formin, aminoform, and urotropin is a relatively old
compound. It was described in the literature as early as 1859 by
Alexander Butlerow (1). Butlerow named this compound hexarnethylenamin and

3
established the empirical formula in 1860 (2). Wilhelm Hofmann supported
Butlerow's results through molecular weight determinations in 1869 (3).
Butlerow also proposed the molecular structure I in 1860 (4) but did
not find agreement with other researchers on this proposal. Van't Hoff
in 1881 (5) and Delepine in 1893 (6) proposed structure II. Von Losekann
proposed structure III in 1890 (7) and in 1895 Duden and Scharff (8)
proposed structure IV. Other proposed structures include structure V by
Guareschi in 1897 (9), structure VI by Cohn also in 1897 (10), and
structure VII by Dominikiewicz in 1935 (11).
Proposed HMT Structures
N-N
(~) N-N
CH2
II N I CH
2 I
/N....____ _,...,Ctt 2 Cl:!._2
,.,-::N N::--,.._ H C1/ '--:CH
2 2
(I) Butlerow (II) van't Hoff (III) Losekann
(IV) Duden and Scharf
NH NH2NH2 I \ I I
H 2 c=c-c-c-c-c=NH H H H H
(VI) Cohn
CH 2 / '
H C=N-C-N N-C-N=CH 2 , / 2
H2 CH H2 2
(V) Guareschi
I\ I\ I\ N-N-N-N
vvv (VII) Dominikiewicz

4
The structure of Duden and Scharff (IV) is the generally accepted
structure. It is reinforced by X-ray crystallography data first reported
in 1923 by Roscoe Dickinson and Albert Raymond (12). Dickinson and
Raymond reported that this data showed a regular tetrahedral symmetry
arrangement with all carbon atoms equivalent and nitrogen atoms
equivalent. These results are in agreement with structure IV and not with
any other suggested structure. This work has been repeated for
verification and refinement of bond distances and angles by Gonell and
Mark, also in 1923 (13), Wyckoff and Corey in 1934 (14), and Hampson and
Stosick in 1938 (15). It is interesting to note that the structure of
Losekann (III) explains the observation of HMT when it acts as a monobasic
amine. Only one of the HMT nitrogen atoms would be expected to show
monobasic characteristics. The Losekann (III) structure obviously is not
of proper symmetry to fit the X-ray data, but it may be the structure when
one of the nitrogen atoms becomes pentavalent with the addition of a
hydrogen atom (16). The physical properties of HMT are shown in table
1 (17,18).

5
Table 1 Physical properties of hexamethylenetetramine.
Molecular formula
Molecular weight
Crystal appearance
Melting point
Flammability
Solubility 25° C
pH
pK8 (19)
Formation:
140.19 9/mole
colorless rhombic dodecahedrons
263°C sublimation without melting with partial decomposition
readily ignites
water chloroform methanol ethanol acetone
1g/ 1.5ml
19/7.Sml
1g/ 14ml
19/35ml
1g/ 150ml
8-8.5 in water
4.89 at 25°C
The formation of HMT is accomplished by the condensation of 4
ammonia molecules and 6 formaldehyde molecules to produce 1 HMT molecule
and 6 water molecules:
(1)
The mechanism of HMT formation has not been determined completely since
this reaction has been found to be very complex with many possible
byproducts and intermediates. The hypothesis of Duden and Scharff in

1895 (20) provided the main insight to the probable mechanism.
6
They
believed that formaldehyde and ammonia condensed to methyleneimine (VIII)
and then trimerized to cyclotrimethylenetriamine (IX). Methylolation of
this would then produce trimethylolcyclotrimethylenetriamine (X), which
on condensation with ammonia would form HMT (IV) as shown below. Duden
and Scharff believed the intermediate cyclotrimethylenetriamine (IX)
formed quickly but that the HMT final product formation was slower. They
showed that freshly prepared solutions containing ammonia and formaldehyde
do not produce derivatives of aqueous HMT but do produce derivatives of
the intermediate cyclotrimethylenetriamine (IX).
Duden and Scharff scheme
fast
3 N H 3 :::::====::'.'.'.~ 3 .... fast
(VIII)
(IX)
~ 3 CHzO ~
• ([1 H·N N·H HOH2C·l ;·CH20H NH 3
l ) + 3 H 20 fas I slow
~ ~ L-N✓ H H
(IX) (X) (IV)
Baur and Ruetschi in 1941 (21) agreed with this mechanism hypothesis
based on their kinetic studies on HMT formation. They also determined the

7
overall reaction order to be third order with respect to ammonia and
formaldehyde in the molar ratio of 1:2.
Boyd and Winkler in 1947 (22) studied rate curves for the reaction
formaldehyde and ammonia in aqueous solutions at 0° C and 35° C. The
reactions were performed at various mole concentrations under different
initial mole ratios ranging from an excess of formaldehyde to an excess
of ammonia. At several points during the reaction, the concentration of
formaldehyde, ammonia, and HMT were determined to see how much of the
consumed ammonia and formaldehyde had formed HMT and how much had been
tied up as intermediates. The results showed that, in general, more of
the reactants were consumed during the reaction than HMT was formed. This
fact led to the conclusion that a stable intermediate is formed. The
results indicate that different intermediates may be formed depending on
whether there is an excess of formaldehyde or ammonia. However, it is
somewhat difficult to interpret some of these determinations since they
may or may not also be including intermediates.
Richmond, Myers, and Wright in 1948 (23) re-examined the ammonia
formaldehyde system and agreed with the results of Duden and Scharf. This
work also showed that cyclotrimethylenetriamine (IX) was the main
intermediate in the eventual formation of HMT. There may also be other
intermediates in the reaction system such as methylenediamine (XII) in
equilibrium with substances having other formaldehyde-ammonia ratios as
well as l,5-endomethylene-1,3,5,7-tetrazacyclooctane (XX). It was also
determined that the final stages of the HMT synthesis from
cyclotrimethylenetriamine are not reversible in alkaline solution.

8
In 1957, Sameer Bose (24) performed half-life studies on solutions
containing stoichiometric amounts of formaldehyde and ammonia at 15° C
and 20° C. It was found that a dilute solution of acetic acid would
arrest the reaction, hydrolyze the intermediate complex within 20 minutes,
and did not have an appreciable effect on HMT in 20 minutes of standing.
The intermediate was found to decompose completely into equimolar
proportions of formaldehyde and ammonia. The half-life results obtained
here reaffirm the contention that this is a third order reaction.
Atsushi Kawasaki and Yoshiro Ogata in 1967 (25) studied the kinetics
of the reaction to form HMT in dilute aqueous solutions at 20° C in the
pH range between 6.3 and 11.9. They also found that the reaction was
first-order with respect to ammonia and second-order with respect to
formaldehyde. This may be due to a rate-determining attack of
methylolamine on free formaldehyde to form dimethylolamine (XIII). The
pH studies showed a sharp rate increase with the increasing pH to a
maximum between 9 and 10 followed by a gradual decrease. Reaction
solutions tested for intermediates by decomposition in dilute acetic acid
showed a formaldehyde to ammonia molar ratio of 2. 0 as opposed to 1. 0
reported by Bose (24). The unstable intermediates may include mono, di,
and trimylolamine, cyclotrimethylenetriamine (IX), and l,5-endomethylene-
1,3,5,7-tetrazacyclooctane (XX). Methylenediamine (XII) may also exist
but it probably does not decompose in dilute acetic acid as HMT with its
N-C-N bonds is stable.
In 1979, Nielsen et. al. (26) examined the formaldehyde-ammonia
reaction in D20 solvent with the aid of 1H and 13C NMR spectroscopy. This
reaction study at intervals at 25° C shows that there is rapid formation

of HMT and that reaction intermediates are present.
9
The 1H spectra
reveals that the reaction intermediate 1,3,5-hexahydrotriazine (IX)
(cyclotrimethylenetriamine) forms rapidly. It is initially higher in
concentration than HMT, and is the main species present other than HMT.
The l,3,5,7-tetraazabicyclo[3.3.l]nonane (XX) (1,5-endomethylene-l,3,5,7-
tetrazacyclooctane) is also determined here to be much lower in
concentration than hexahydrotriazine (IX) except in the early stages where
it appears to be nearly equal. The broad signals also present are
attributed, principally, to N-methylol-0-d derivatives. The proton-
decoupled Fourier transform 13C spectra provide data are in agreement with
that derived from the proton spectra. The main peaks shown near
completion of the reaction belong to HMT and 1,3,5-hexahydrotriazine (IX).
Since the 13C acquisition required 10-15 minutes, the early and
intermediate timed samples were very complex. The peaks were too numerous
to allow structure assignments. The spectra obtained at later times are
less complex, but also show weaker peaks which do not permit accurate
structure assignments. These results and many of the previous studies
including aldehyde-ammonia and aldehyde-amine reactions lead Nielsen et.
al. to describe an "oversimplified" mechanism as one possible route for
the reaction of formaldehyde and ammonia to form HMT.

10
Nielsen et. al. scheme
NH 3 ::;;;;,::==:::.._= CH 2 (NH 2 ) 2
(VIII) (XI) (XII)
(VIII) (XIII)
CH 2 =NH
(VIII) (XIV) (XV)
CHz=NH CHz=NH
CH 2 (NH 2 ) 2, H2 NCH 2 NHCH 2 NH 2 ---- H2 NCH 2 NHCH 2 NHCH 2 NH 2
(XII)
(XVII)
(XVIII)
(XX)
(XVI)
-NH 3.._
CH 2= NH
-
GHz= NH ... ....
(XVII)
CH 2 =NH
(IX) (XVIII)
(XX) (XIX)
(XXI) (IV)

11
Hydrolysis:
Hexamethylenetetramine is hydrolyzed in aqueous solutions when
heated in the presence of strong acids.
heat (2)
Early studies essentially determined reaction rates at pH's between 2 and
8 and concluded that the higher the H+ concentration, the faster the
reaction rate (27,28,29). In 1960, Hikoji Tada (30) determined that the
decomposition reaction occurs with HMTH+ and not HMT. HMT must first
become HMTW for decomposition to proceed. Also, in acid solution HMT gave
mainly derivatives of 1,3,5-triazocyclohexane (IX). Tada interprets his
results mechanistically as follows. The weakening of the C-N of HMTH+
(XXII) produces a carbonium ion (XXIII). With the addition of H+ to NH,
the C-N bond is broken completely by the reaction of like charge. Since
the carbonium ion (XXIII) is a derivative of l,5-endomethylene-l,3,5,7-
tetrazacyclooctane (XX) which decomposes faster than HMT, the formation
of (XXIII) must be the rate determining step.
Tada scheme
H+ H + I I
~/H++
([1 • rC1 (?Hz H+ H+ LcH2 • I N N N N L--N ✓ L--N ✓ L---N___J £-N_J
(IV) (XXII) (XXII) (XXIII)

12
The acid hydrolysis using heat and strong acid is considered to be
quantitative and is the basis for most methods of quantitative HMT
determinations (31).
Applications:
Hexamethylenetetramine is used in many reactions, generally in one
of two ways. It can be hydrolyzed, in many instances, as a source of
anhydrous formaldehyde and it also functions in many reactions as a
tertiary amine.
Commercially, HMT is usually used as a controlled source of
anhydrous formaldehyde, an advantage over the use of paraformaldehyde.
It's principal use is as a methylenating agent in the curing of phenol-
formaldehyde resins. The compound is hydrolyzed thermally during the
molding process with the methylene groups crosslinking to provide product
strength. The release of ammonia acts as a catalyst.
The second large volume use is for the manufacture of the high
explosives RDX (Dupont's "research division explosive", cyclonite, or
1,3,S-trinitro-1,3,5-triazacyclohexane) and HMX ("high melting explosive"
or 1,3,5,7-tetranitro-1,3,5,7-tetra-azacyclooctane) during wartime
operation. These nitration products are formed via reactions of
concentrated nitric acid with HMT (32).
Other commercial uses of HMT include the hardening of proteins such
as in glues, as a corrosion inhibitor, in fuel tablets for camping stoves,
and as a preservative.
Medicinally, HMT is a common urinary tract antiseptic which was used
for this purpose by Nicolaier (33) as early as 1894. This use is also

13
based on the release of the active ingredient formaldehyde, by hydrolysis
in the bladder. An enteric tablet is used to bypass gastric acidity.
Musher and Griffith (34) have reported that exposure in the urinary tract
to~ 25 µg of formaldehyde per mL for~ 2 hr. causes a measurable delay
in the growth of gram-negative bacteria. As a drug, HMT is administered
as either the mandelate (4 grams/day) or hippurate (2 grams/day) salt.
Hexamethylenetetramine is an ideal drug since it is relatively nontoxic,
bacterial resistance to formaldehyde has not been shown to develop,
significant levels of formaldehyde are not generated in the gut or body
tissues, and it is relatively inexpensive (34).
Determinations:
Many methods have been developed for the determination of milligram
(mg) amounts of HMT. This is largely due to the development of methods
to assay prescription tablets which contain at least 250 mg. Table 2
lists many of the different types of methods available for the
determination of HMT at this level and a reference example of each. The
most common methods are titration.
Contrasted to the numerous determination methods available at the
milligram level, there are relatively few methods available at the low
microgram level as shown in table 3. Spectrophotometric methods are the
most common and the chromotropic acid method is the USP XXII standard
procedure. Most of these methods also determine HMT indirectly by
quantitatively determining the formaldehyde liberated by means of acid
hydrolysis. The most sensitive methods are chromatographic since they
employ small sample sizes of 2-10 µL.

Table 2
14
Various types of methods available for milligram amount determinations of HMT.
Spectrophotometric (35)
Infrared spectroscopy (36)
Polarography (37)
Specific gravity (38)
Gravimetric (39)
Bromatometric (40)
Nuclear magnetic resonance (41)
Acid-base (42)
Amperometric (43)
Potentiometric (44)
Conductometric (45)
Complexometric (46)
Coulometric (47)
Gas liquid chromatography (48)

15
Table 3 Various methods reported for the determination of low microgram amounts of HMT.
Method/Reagent
SPECTROPHOTOMETRIC
l,2-Napthoquinone-4-sulfonate (49) (i)
Nash (50) (i) Richter (51) (i) Iodine charge transfer complex (52) (d) Chromotropic acid (53) (i) J acid (53) (i) Phenyl J acid (53) (i) Ag+ -Fe3+ -Ferrozine proposed (i)
POLAROGRAPHY
Formaldehyde-ethanolamine (54) (i)
POTENTIOMETRIC
Kinetic CN-selective electrode (55) (i)
Det. limitb HMT(ug/mL)
7
6 1. 7
1 0.49 0.26 0.11 0.04
0.14
2.6
FOURIER TRANSFORM NUCLEAR MAGNETIC RESONANCE
d-Acetonitrile solv. proposed (d) 10
HIGH PRESSURE LIQUID CHROMATOGRAPHY
CH20 2,4-dinitrophenylhydrazone (56) (i) 0.006 Ion pair (57) (i) 2
GAS CHROMATOGRAPHY
Iodine charge transfer complex (58) (d) 0.005
Final Vol(ml)
25 10 5 10 10 5 12.5
10
22
19
0.6
3
0.020
1
ai/d - indirect or direct HMT determination bDet. limit= Spectrophotometric at 0.1 Absorbance; others as reported

SPECTROPHOTOMETRIC DETERMINATION OF HEXAMETHYLENETETRAMINE
AND AMMONIA
Introduction
The most common methods used for the determination of microgram
amounts of HMT are spectrophotometric methods. Table 3 lists the
available methods. All but one of the methods listed use the indirect
method of determination, i.e., by determination of hydrolyzed
formaldehyde. Hexamethylenetetramine is completely hydrolyzed in the
presence of heat and strong acid, usually sulfuric, to form formaldehyde.
(3)
Formaldehyde is a very reactive compound. Many methods have been
developed for its determination. Filipeva, et. al. (50) used an indirect
method employing sodium 1,2-naphthoquinone-4-sulfonate. This method was
developed for the determination of various drugs, in dosage form dissolved
in an ethanol solvent. The absorbance was measured at 480 nm yielding a
detection limit of 7 µg/mL at 0.1 absorbance.
The Nash procedure for the determination of formaldehyde was
modified by Strom and Jun (51) for the determination of HMT. It is based
on the Hantzsch reaction in which formaldehyde is reacted with ammonia and
16

17
acetylacetone. The colored compound has an apparent molar absorptivity
of 2,300 L/(cm mol) measured at 412 nm. The detection limit is 6 µg/mL
at 0.1 absorbance.
Rizzoli (52) applied the Richter reaction to the determination of
HMT as the picrate in chloroform and toluene-chloroform solutions. This
HMT-picrate compound has an apparent molar absorptivity of 8,300 L/(cm
mol) measured at 410 nm. The detection limit is 1. 7 µg/mL at O .1
absorbance.
Taha, El-Rabbat, Nawal, and Fattah (53) developed a direct
determination of HMT by forming the intense charge-transfer band in the
UV spectrum of 1:1 molecular complex with iodine in 1,2-dichloroethane or
chloroform. This method was applied to prescription tablets and has an
apparent molar absorptivity of 20,000 L/(cm mol) measured at 273 nm. The
detection limit is 0.7 µg/mL at 0.1 absorbance.
The method using chromotropic acid ( 4, 5 -dihydroxynapthalene- 2, 7 -
disulfonic acid, disodium salt) is the USP standard (59) for HMT
prescription tablets and is probably the most popular spectrophotometric
method. This method has an apparent molar absorptivity of 28,800 L/(cm
mol) measured at 578 nm. The detection limit is O. 49 µg/mL at O .1
absorbance.
J acid (6-amino-1-napthol-3-sulfonic acid) and phenyl J acid (6-
anilo-l-napthol-3-sulfonic acid) were described by Sawicki, Hauser, and
McPherson (54) for the determination of formaldehyde and formaldehyde
releasing compounds. For the determination of HMT, J acid has an apparent
molar absorptivity of 54,000 L/(cm mol) at 468 nm and phenyl J acid has
an apparent molar absorptivity of 122,500 L/(cm mol) at 660 nm. The

18
detection limits for J acid and phenyl J acid are 0.26 and 0.11 µg/mL at
0.1 absorbance.
Statement of Problem and Approach:
The proposed method is based on a spectrophotometric method
developed in this laboratory by Al-Jabari and Jaselskis for the
determination of formaldehyde (60). This formaldehyde method is based on
the reduction of silver(I) by formaldehyde followed up by the oxidation
of the metallic silver produced with iron(III) in the presence of 3-(2-
pyridyl)-5,6-diphenyl-1,2,4-triazine-p,p'-disulfonicacid,monosodiumsalt
monohydrate (Ferrozine). The method for the quantitative determination
of ferric ions in the presence of Ferrozine was developed by Stookey in
1970 (61).
Ferrozine is one of the most sensitive spectrophotometric iron
reagents available. The utility of this reagent is based on the selective
reactivity of the ferroin grouping (shown below) which acts as bidentate
ligands with certain metals to form colored complexes.
-N==c-c==N-
Ferroin group
The ferroin reaction with ferrous ion was first reported in 1898 by
Blau (62) and thus has been given the trivial name of the ferroin group.
These compounds also react with other metal ions such as cuprous and
cobaltous to give colored complexes. The principal advantage of

19
Ferrozine, in respect to other ferroin compounds such as 1,10-
phenanthroline, is the good solubility of this high molecular weight
compound and its complexes in water. It also has a comparative low cost.
Ferrozine has the structure shown below.
Ferrozine
The visible absorption spectrum of the ferrous complex of Ferrozine
exhibits a single sharp peak with maximum absorbance at 562 nm. At this
wavelength, the molar absorptivity is 27,900 L/(cm mol). The complex
obeys Beer's law to approximately 4 ppm iron. The magenta colored Fe(Fz)t
species will form completely in aqueous solution between the pH values
of 4 and 9. Once the complex is formed, it is very stable (50).
This iron-Ferrozine reaction was used by Al-Jabari and Jaselskis for
the determination of micro amounts of silver(!), copper(II), and
nickel(II) (63). In this determination, the metal ions are reduced to
their metallic state and then reoxidized with added ferric ion. The
ferrous ion produced was then quantitatively complexed by Ferrozine to
produce the colored Fe(Fz)t species previously described. The amount of
Fe(Fz)t formed was then measured at 562 nm and directly related to the
amount of metal originally present in the sample.

20
Al-Jabari and Jaselskis then took this procedure one step farther
with their method for the determination of micro amounts of formaldehyde
(49). With this method, formaldehyde is quantitatively oxidized by an
excess of hydrous silver oxide to form silver metal. Silver metal is
reoxidized with added ferric ion and the ferrous ions produced are
quantitatively determined as previously described. This determination is
possible since formate ions and silver(!) ions do not produce colored
complex ions with Ferrozine.
The determination of hexamethylenetetramine is based on this
previous described work with Ferrozine. The determination is accomplished
by hydrolysing HMT in strong acid solution, with heating, to produce
formaldehyde and ammonia. The released formaldehyde is oxidized by
hydrous silver oxide and the resulting metallic silver is quantitatively
oxidized by iron(III) in the presence of Ferrozine to produce an iron(II)
Ferrozine complex as shown in the following reactions.
C6H12N4 + 6 H20 strong acid
6 CH20 + 4 NH3 (3) heat
6 CH20 + 12 Ag+ (OW) 12 Ag0 + 6 HCOO- (4)
pH 12·13
12 Ag0 + 12 Fe3+ w 12 Fe2+ + 12 Ag+ (5)
12 Fe2+ + 36 Fz2· pH 3-6
12 Fe(Fz)t (6) Fz•Ferrozine
This Fe(Fz)t complex has a molar absorptivity of 27,900 L/(cm mol) at 562
nm (50). Since each HMT molecule yields 12 Fe(Fz)/· complex ions, the
apparent molar absorptivity for HMT should be 335,000 L/(cm mol).

21
Chemical amplification occurs in this process because one equivalent of
formaldehyde reduces two equivalents of silver(I) and upon reoxidation of
metallic silver with iron(III) two equivalents of iron(II) are produced.
The development of this procedure required investigation of a number
of test parameters. Hydrolysis parameters were determined including
choice of acid used for hydrolysis, acid concentration, reaction
temperature, and time needed for completion of hydrolysis. Optimum
reaction parameters for the formaldehyde determination were investigated
including pH, silver(I) concentration, and time.
The method was also compared to the USP standard method using
chromotropic acid (59). The USP standard method is also based on the
indirect determination of HMT by the quantitative determination of
formaldehyde resulting from the hydrolysis of HMT.
Once the optimum conditions had been established for aqueous samples
of HMT alone, the method was applied to samples of HMT containing a large
amount of formaldehyde. Because this method determines released
formaldehyde from HMT, any formaldehyde present in the sample will also
react and interfere. This method and most other indirect methods can
successfully determine HMT in the presence of small amounts of
formaldehyde. However, these indirect methods fail when there is a large
amount of formaldehyde initially present, because the difference between
the formaldehyde initially present and the total formaldehyde after
hydrolysis is very small. Therefore, techniques were developed to remove
or reduce the formaldehyde interference without affecting the HMT present.
A number of procedures have been investigated to remove the formaldehyde
22
interference. The procedures found useful were evaporation and chemical
reaction.
After developing this method to determine HMT in the presence of
large amounts of formaldehyde, the procedure was used to study the
determination of ammonia. Ammonia was reacted with a large excess of
formaldehyde and heated to drive the reaction to completion and to form
HMT. The large excess of formaldehyde was removed and the HMT present was
quantitatively determined. The amount of HMT present was then related to
the amount of ammonia originally present in the sample. The development
of this procedure required optimization of the HMT formation reaction
parameters. The reaction parameters studied include effect of pH,
temperature, time, and the concentration of formaldehyde needed.
The determination of HMT in urine samples has not been accomplished
very accurately with the many other available methods. Consequently, the
feasibility of using this method to accurately determine HMT in urine was
studied. Physiological concentrations of HMT range between 0.6 and 1.7
mg/mL (34). Urine samples contain many different compounds which can
interfere with this method. Anything that reacts with the reagents used
to form a precipitate, such as chloride ion with silver(!), interfere in
the absorbance reading process. Compounds may also react to deplete or
form an equilibrium with the reagents and thus interfere with the
quantitative reaction sought. This interference would include any
compound that can react with HMT, reduce hydrous silver oxide, reduce
ferric ions, or complex with Ferrozine.

23
Experimental
Instrumentation:
All spectrophotometric measurements were obtained using a Cary 14
(Varian Instrument Group, Palo Alto) spectrophotometer with 1 cm
pathlength quartz cells. The pH measurements were made using a Fisher
Accumet model 830 pH meter. Constant temperatures were obtained using a
Cole Parmer model 1266-00 immersion circulator water bath. Small amounts
of reagents were weighed with a Sartorius semi-micro balance.
Reagents:
All chemicals used were analytical or primary standard grade.
Hexamethylenetetramine was purified by recrystalization from absolute
ethanol. Before using HMT, it was dried over phosphorous pentoxide for
4 hours as described in the USP XXII standard method (53). A 0.01 M
Ferrozine,3-(2-pyridyl)-5,6-diphenyl-1,2,4-triazine-p,p'-disulfonicacid,
monosodium salt monohydrate (Aldrich) was prepared by dissolving 0.511 g
in 100 mL distilled water. A 0.004 M iron(III) in 0.09 M sulfuric acid
solution was prepared by dissolving 1. 929 g ammonium ferric sulfate
dodecahydrate (Mallinckrodt) in 500 mL distilled water containing 5 mL
concentrated sulfuric acid and then diluting it to 1 L. A 0.075 M
silver(!) solution was prepared by dissolving 1. 274 g silver nitrate
(Fisher) in 100 mL distilled water. An acetate buffer solution of pH 3.5
was prepared by partially neutralizing a 1 L solution containing 29.4 mL
glacial acetic acid with concentrated sodium hydroxide. Solutions of
0.025 M nickel(II), zinc(II), cobalt(II), calcium(II), and magrtesium(II)

24
were prepared by dissolving the appropriate amount of nickel nitrate
hexahydrate, zinc nitrate hexahydrate, zinc acetate dihydrate, cobalt
nitrate hexahydrate, calcium nitrate tetrahydrate, and magnesium nitrate
hexahydrate in 100 mL distilled water. Formaldehyde solutions were
prepared by diluting an appropriate amount of 37 weight percent
formaldehyde ( -13. 3 M) containing 10-15% methanol (Aldrich). Sodium
borohydride solutions were prepared daily dissolving the appropriate
amount of sodium borohydride (Aldrich) in O. 2% sodium hydroxide to
decrease the decomposition rate (64). Sample evaporations were
accomplished under aspirator vacuum in a vacuum desiccator containing
Drierite. Chromotropic acid, 4,5-dihydroxynaphthalene-2,7-disulfonic
acid, disodium salt dihydrate (Aldrich), reagent solution was prepared by
mixing 100 mg chromotropic acid with 50 mL of distilled water in a 100-mL
volumetric flask. The solution was cooled in an ice bath and, while
cooling, 50 mL of concentrated sulfuric acid was added with mixing, slowly
and cautiously The solution was cooled to room temperature, and dilute
sulfuric acid (1 in 2) was added to volume. [Note-If excessive heat
generated during mixing causes a violet color to appear in the solution,
discard the solution and prepare another taking precautions to avoid
excess heat.]
Development of Methods
Optimization of HMT Test Parameters:
The development of the spectrophotometric method for the
determination of HMT required the optimization of several parameters: (i)

25
choice of the acid used for hydrolysis, (ii) acid concentration, (iii)
hydrolysis temperature, and (iv) the time needed for the completion of
hydrolysis. Once the conditions for the hydrolysis of HMT had been
established, the resulting hydrolyzed sample was analyzed for
formaldehyde. The optimized conditions for the determination of
formaldehyde have been elucidated in this laboratory by Al-Jabari and
Jaselskis, but for this application minor modifications were required.
The following parameters were optimized: (i) amount of silver ion added,
(ii) pH (the amount of sodium hydroxide added), and (iii) the amount of
iron(III) and Ferrozine added.
The choice of a strong acid for HMT hydrolysis in our method is
based on its effectiveness and noninterference during the procedure. In
the chromotropic acid method 9 M sulfuric acid is used (59). However,
sulfuric acid produces low results in this procedure. It appears that the
sulfuric acid reacts with the added silver ions to form a precipitate of
silver sulfate (Ksp -10-5), decreasing the amount of silver(I) available to
reduce the formaldehyde. Similarly, halogen acids cannot be used since
they also produce silver precipitates and turbidity. Nitric acid was not
used since its nitration reaction with HMT forms the explosives ROX and
HMX. (32). Dilute perchloric acid has been chosen as the acid of choice.
With perchloric acid, solutions remained clear and hydrolysis proceeded
smoothly.
Once the choice of acid had been established, the following
hydrolysis parameters were investigated: (i) the concentration of
perchloric acid, (ii) hydrolysis temperature, and (iii) time required to
accomplish the hydrolysis of HMT. Hydrolysis parameters were adjusted to

26
achieve maximum hydrolysis within a reasonable amount of time such as
within ten minutes. Heating the hydrolysis sample dramatically increases
the rate of hydrolysis. This step in the procedure has been carried out
by using a thermostatically controlled heated water bath and adjusting the
temperature to study its affects. In order to prevent the possible loss
of formaldehyde, temperature studies did not exceed 60° C. Table 4 and
figure 1 display the results for the time required to achieve maximum HMT
hydrolysis at varied acid concentrations and reaction temperatures. These
results show that the addition of 1.00 mL of 1.0 M perchloric acid to a
400 µL HMT sample heated at 60° C will provide quantitative results in
about 5 minutes. The acid concentration in solution is 0.71 M. Samples
larger than 400 µL can also be hydrolyzed as long as the acid
concentration is at least 0.71 M.
Table 4
TIME{min)
0
2
4
6
8
10
12
15
20
Time study for hydrolysis of HMT at various temperatures and perchloric acid concentrations.
40°1M 40°2M 50°1M 50°2M 60°0.SM 60°1M 60°2M
0% 0% 0% 0% 0% 0% 0%
17% 34% 46% 72% 46% 73% 93%
31% 58% 69% 91% 73% 90% 95%
42% 72% 81% 95% 83% 93% 94%
51% 81% 87% 95% 90% 94% 95%
58% 84% 91% 95% 91% 94% 95%
65% 89% 94% 95% 93% 93%
71% 92% 94% 95% 93%
80% 95% 94% 96% 92%
% = HMT hydrolysis yield

Q ~ ll:l i-,.,t
~ ~ i-,.,t
~ 0 ~ Q ~ =
Figure 1
100%~---------------------~
80%
60%
6 40°C 1M
* 40°C 2M
0 50°C 1M
• 50°C 2M
X 60°C 0.SM
• 60°C 1M
* 60°C 2M
0 0 2 4 6 8 10 12 14 16 18 20
TIME (min)
Time study for hydrolysis yield of HMT at various temperatures and perchloric acid concentrations.

28
Hydrous silver oxide iron(III)-Ferrozine parameters were adjusted
by working with 400 µL samples hydrolyzed with 1.00 mL 1.0 M perchloric
acid. The pH dependency of the reaction of hydrous silver oxide with
formaldehyde was studied by varying the amount of 2.1 M sodium hydroxide
added to the HMT sample after hydrolysis. The pH of the solution must be
sufficiently high to form hydrous silver oxide but must not to exceed pH
13 because the precipitate becomes difficult to dissolve upon the addition
of acidic iron(III) and the reaction of formaldehyde with hydrous silver
oxide becomes slow. The reactivity of hydrous silver oxide with HMT
hydrolyzed formaldehyde as a function of pH (OH- concentration) is shown
in figure 2. The optimum pH range is 12 to 13. The addition of silver(!)
was studied by varying the amount of 0.075 M silver nitrate added. It was
noticed that the smaller the amount of silver added, the quicker the
colored iron(II)-Ferrozine complex was formed. The amount of silver ion
added was varied between 0.005 and 0.025 millimoles (mmol). The results
are shown in figure 3. The amount of silver added was chosen to be 0.015
mmol to provide rapid quantitative results. The addition of iron(III) and
acetate buffer did not require modification and were used as described by
Al-Jabari and Jaselskis. A diagram of the test parameters is shown in
figure 4.
The expected apparent molar absorptivity of 12 x 27,900 - 335,000
(L/cm mol) was not obtained. The apparent molar absorptivity that this
investigator obtained was between 312,000 and 322,000 (L/cm mol). Because
of this slight variation, the most accurate determination results were
obtained by preparing a standard calibration curve.

Q ~ z 1-4 :s ~ ~ f"4 ~ Q
f"4 :s =
Figure 2
Q ~ z 1-4 :s ~ ~ f"4 ~ Q f"4 :s =
Figure 3
80%
60%
40%
20%
0%~--~--~--~--~--~--~---~-~ 11.8 12 12.2 12.4 12.6
pH 12.8 13 13.2 13.4
29
Study of pH effects on hydrous silver oxide reaction with HMT hydrolyzed formaldehyde.
80%
60%
40%
20%
0%~---~---~----~---~---~ 0.000 0.010 0.020 0.030 0.040 0.050
SILVER(I) mmol
Study of the amount of silver(I) required for optimum results at pH 12.8.

Figure 4
HMT DETERMINATION
HMT sample Hydrolyse
HMT add HCIO4 ; solution >0.71M heat 60°C ~5 min. chill to condense vapor
add 0.015 mmol Ag+ raise pH to 12-13 with NaOH vortex mix, react ~5 min.
Ago Reduce
Fe3+ Form
Complex
add 0.008 mmol Fe3+ add buff er pH 3.5 add 0.02 mmol Ferrozine dilute to vol., react ~5 min.
Fe(Fz):- measure abs. at 562 nm
30
Flow diagram of the optimized HMT determination parameters.

31
Evaporation of Formaldehyde:
The removal of formaldehyde from HMT samples by evaporation appeared
deceptively simple. Since formaldehyde has a boiling point of -20° C (65)
and HMT has a melting point (sublimation point) at 260° C (66),
formaldehyde should easily leave the sample with only solid HMT remaining
after complete evaporation of the sample. However, this evaporation
procedure produced two major problems. As the formaldehyde evaporated,
it mainly polymerized into paraformaldehyde (67). Paraformaldehyde
readily reacts under conditions of the determination in a manner
equivalent to formaldehyde. Therefore, it is the source of a large
interference. Also, it was found that HMT has a slight vapor pressure.
When HMT is subjected to the sample evaporation conditions, sublimation
occurs. To succeed with this method, inhibition of paraformaldehyde
formation had to be achieved during evaporation of the sample, and the
vapor pressure of the remaining HMT had to be decreased to prevent its
sublimation.
The removal of the formaldehyde could be accomplished by adding
dilute weak acid to the sample. The acid inhibits the polymerization and
formation of paraformaldehyde during evaporation. Any paraformaldehyde
formed in the weak acid is readily reconverted to formaldehyde (68).
(7)
The acid added cannot be a strong acid because a strong acid will start
to hydrolyze the HMT. Bose (24) described earlier that in a dilute
solution of acetic acid HMT did not noticeably hydrolyze over a short
period of time. Experiments confirmed that a small amount of glacial

acetic acid added to the sample did not decompose HMT.
32
A sample
containing O. 2 M formaldehyde could be evaporated when it contained
approx. 0.1 M acetic acid. However, it was found that the acetic acid
would decompose HMT if the solution was allowed to sit for long periods
of time.
To prevent the sublimation of HMT, a salt was added to the sample
before evaporation to complex and hold HMT as a less volatile complex.
Sodium bisulfate was tested and appeared to have no affect. Metal salts
were then tested. The results are shown in table 5. Zinc nitrate was
tested and the retention of HMT decreased rapidly when the zinc to HMT
ratio was greater than one. Cobalt nitrate and nickel nitrate, added in
a 2:1 or greater ratio with respect to HMT, yielded reproducible results
with HMT recovery between 97 and 103 percent. Other metals tested include
calcium nitrate and magnesium nitrate. Both calcium and magnesium
produced inconclusive results with varied ratios of the salt and HMT. All
of the salts were also tested with a large amount of formaldehyde present
and acetic acid added. All samples containing formaldehyde produced less
accurate results than those without formaldehyde. Nickel nitrate produced
the best results when the metal concentration was varied from a molar
ratio of 1:1 to 16:1 Ni(II):HMT. ~i(II) also produced low blank values
contrasted to Co(II). When the sample was evaporated to "dryness", small
droplets still remain in the bottom of the test tube. This behavior also
occurred when the sample was evaporated in a vacuum desiccator by either
water aspirator vacuum or a vacuum pump. Most of the salts tested were
chosen because of their high water of hydration which could possibly make
the HMT complex more difficult to evaporate.

33
Table 5 also indicates a problem. The samples which contained 0.2
M formaldehyde produce higher blank values than the samples with no
formaldehyde. This residual blank interference requires a correction when
determinations are made using large amounts of formaldehyde in the sample.
Fortunately, the blank increase is linear and proportional to the amount
of formaldehyde originally present in the sample. A blank formaldehyde
calibration curve must be determined along with the HMT sample
determinations.
The formaldehyde concentration in the HMT sample can be determined
using the spectrophotometric method by Al-Jabari and Jaselskis (49).
Under these conditions, HMT does not interfere. Once the formaldehyde
concentration in each sample is determined, the appropriate blank
correction can be subtracted using the blank calibration curve.

Table 5
Nickel
Zinc
Cobalt
Calcium
Magnesium
8 CH20 = 0. 20M
34
Aspirator vacuum evaporation study of 150 µL samples containing metal salts to prevent sublimation of HMT.
HMT CH 08 -2- Met:alb M:HMTC -Ams- HMT
0 lOµL 0.013 blank 0 20µL 0.013 blank LO 20µL 16:1 0.219 100% HI 20µL 4:1 0.800 99% HI lOµL 2:1 0.792 98% 0 X 20µL 0.156 blank LO X 20µL 16:1 0.367 102% HI X 20gL 4:1 0.957 101% 0 lOµL 0.011 blank 0 20µL 0.010 blank LO 20µL 16:1 0.050 19% HI 20µL 4:1 0.731 91% HI lOµL 2:1 0.781 97% 0 X 20µL 0.042 blank LO X 20µL 16:1 0.070 4% HI X 20gL 4:1 0. 716 85% 0 lOµL 0.150 blank 0 20µL 0.286 blank LO 20µL 16:1 0.499 103% HI 20µL 4:1 1.075 99% HI lOµL 2:1 0.941 99% 0 X 20µL 0.332 blank LO X 20µL 16:1 0.569 114% HI X 20gL 4:1 1.128 100% 0 lOµL 0.008 blank 0 20µL 0.008 blank LO 20µL 16:1 0.231 108% HI 20µL 4:1 0.827 103% HI lOµL 2:1 0.803 100% 0 X 20µL 0.061 blank LO X 20µL 16:1 0.259 96% HI X 20gL 4:1 0.936 110% 0 lOµL 0.008 blank 0 20µL 0.010 blank LO 20µL 16:1 0.235 109% HI 20µL 4:1 0.794 99% HI lOµL 2:1 0.793 98% 0 X 20µL 0.072 blank LO X 20µL 16:1 0.260 91% HI X 20µL 4:1 0.898 104%
solution bMetal = 0.025M

35
Reduction of Formaldehyde:
The removal of formaldehyde by reduction to methanol has many
advantages over evaporation, the main advantage being a decrease in the
amount of time needed to remove the formaldehyde. The evaporation method
requires in excess of 2 hours to remove the water and formaldehyde. The
reduction of formaldehyde to methanol reduces this time consuming step to
an elapsed time of approximately 15 minutes.
Formaldehyde is readily reduced to methanol by reaction with sodium
borohydride (69).
H20 (8)
After borohydride reduction, the solution must be slightly acidified prior
to HMT testing to destroy all remaining borohydride. Borohydride will
interfere in this spectrophotometric method, but the remaining methanol
and borate compounds do not interfere. It was found that a NaBH4 :CH20 mole
ratio of 1:1 or greater produced analytically acceptable results. Sodium
borohydride must be prepared daily in 0.2% sodium hydroxide. It remains
stable for several hours.
The borohydride reduction of various amounts of formaldehyde also
affects the spectrophotometric blank values. The residual interference
is similar, but greater, than that observed for the Ni(II) evaporated
samples previously described. As shown in figure 5, the blank absorbances
increase as the original formaldehyde concentration increases. However,
the blank increase is linear and relatively small for low formaldehyde
concentrations. For accurate determinations of HMT at high formaldehyde
concentrations, a blank calibration curve of known formaldehyde

36
concentrations must be employed as described for the Ni(II) evaporation
method.

~ u z ~ ~ 0 t:n ~ <
1.400 -----------------------~
1.200
1.000
0.800
0.600
0.400
0.200
¾ NO CH20
--B- O.OSM CH20
---¾- 0.1M CH20
4 0.2M CH20
0. 0 0 0 ...___ __ _.__ __ _,__ __ __,_ ___ __,_______ __ ___,__ __ _____,_ __ ___,
0.0 5.0 10.0 15.0 20.0 25.0 30.0 35.0 HMT CONCENTRATION (M) (lE-7)
Figure 5 Study of blank residual absorbances in HMT standards following borohydride reduction. The standards were studied with formaldehyde at concentrations of Oto 0.2 M.

38
Quantitative Ammonia Condensation With Formaldehyde to Form HMT:
The formation of HMT by the reaction of ammonia with formaldehyde
has been previously described and is shown below.
(1)
The quantitative conversion of ammonia to HMT requires optimization of the
following variables: i) pH, ii) temperature, iii) time, and iv)
formaldehyde concentration.
The pH of the reaction solution has been tested in various buffered
and unbuffered solutions. Kawasaki and Ogata (25) reported that the
maximum rate of formation occurred at a pH of 9.8. The initial pH of our
unbuffered reaction solution with a 12:1 excess of formaldehyde was 9.8
and the final pH after reaction completion dropped to approx. 8.2. The
reaction solutions were buffered at pH 8. 5, 9. 8, and 10. 5 with borax
buffers. However, the buffered solutions produced less satisfactory
results than the unbuffered solutions.
carried out in unbuffered solutions.
All subsequent reactions were
The condensation of ammonia with formaldehyde was carried out with
a sizable excess of formaldehyde. The reaction rate increased with the
excess concentration of formaldehyde, and the condensation occurred within
a reasonable amount of time. The parameters of formaldehyde
concentration, temperature, and time were varied. Formaldehyde to ammonia
mole ratios of 12:1 and 24:1 were investigated. The stoichiometric molar
ratio of formaldehyde to ammonia is 1.5:1. In our experiments this ratio
corresponds to a formaldehyde molar excess of 8 to 16 times. The mole

39
ratios CH20:NH3 of 12:1 and 24:1 were found to be acceptable and enabled
the quantitative removal of formaldehyde prior to the HMT determination.
At formaldehyde concentrations higher than the 24:1 ratio, the remaining
residual interference required additional estimation of the high blank
values. Reaction temperatures were varied from 40° to 60° C. Aliquots
from the reaction solutions were removed at timed intervals and the
reaction stopped in ice water. The reaction was followed for 8 hours
reaction time. The results of this study are shown in figure 6. These
results show that an increase in reaction temperature of 10° C, reduces
reaction completion time by about one half. The condensation of
formaldehyde with ammonia (12: 1 ratio) and the formation of HMT is
complete after about 8, 4, and 2 hours at the temperatures of 40°C, 50°C,
and 60°C respectively. When the ratio of formaldehyde to ammonia is
increased to 24:1, the condensation of ammonia to form HMT is complete in
about 4, 2, and 1 hour at 40°, 50°, and 60° C. At temperatures higher
than 60° C the control of temperature was not as accurate and furthermore
the loss of formaldehyde during hydrolysis was expected. Thus, 60° C was
used for the hydrolysis of HMT.

z 0 ""'"4
~ )1 ~ 0 ~
E-4 )1
=
Figure 6
100%~-------------------------,
90%
80% -e- 0
40 C 12:1 CH2O:NH3
-A- 40° C 24:1 CH2O:NH3
~ 50° C 12:1 CH2O:NH3 70% -B- 50° C 24:1 CH2O:NH3
~ 60° C 12:1 CH2O:NH3
~ 60° C 24:1 CH2O:NH3
60% 0 1 2 3 4 5 6 7 8 9 10
REACTION TIME (hr)
Time study of ammonia condensation with formaldehyde at various temperatures and formaldehyde:ammonia ratios.

41
Urine Samples:
Urine samples are complex and may contain many different interfering
components. Tests performed on dilute urine samples without HMT produce
colored interferences too large to subtract from samples containing
hydrolyzed HMT. It was required that these interferences be eliminated
before the HMT determination.
Removal of these interferences can be accomplished by chemical
means. Richmond, Myers, and Wright (23) reported that HMT is very stable
to hydrolysis in alkaline conditions. Thus, the interferences which are
capable of reducing silver(!) in an alkaline media, including small
amounts of formaldehyde, can be removed by "prereacting" the sample with
hydrous silver oxide. Silver(!) and hydroxide were added to the sample
and the sample heated at 60° C for 10-15 minutes to complete the reaction.
The sample was then cooled, centrifuged, and filtered to remove all
precipitated interferences. An aliquot of the alkaline supernatant was
removed and analyzed for HMT as previously described.
Procedures
Determination of Aqueous HMT:
Hexamethylenetetramine in solid or aqueous samples was determined
by hydrolysis to formaldehyde and subsequent reaction with hydrous silver
oxide, iron(III), and Ferrozine.
Solid samples were weighed and dissolved with distilled water and
treated in the same manner as aqueous samples. Sample aliquots of 400 µL
containing 0.016 to 0.16 µmol HMT were pipetted into 50 mL volumetric

42
flasks using an Eppendorf pipette. The samples were hydrolyzed by adding
1 ml of 1 M perchloric acid and heating the stoppered flasks in a 60° C
water bath for 10 minutes. After chilling in ice water for 1 minute, the
samples were neutralized and made basic with 500 µL of 2. 2 M sodium
hydroxide. Silver(!) was added by pipetting 200 µL of 0.075 M silver
nitrate into the sample to form hydrous silver oxide and allowed to react,
after vigorous mixing, for 10 minutes. Two mL of 0. 002 M acidic
iron(III), 2 mL of 0.01 M Ferrozine, and 6 mL of pH 3.5 acetate buffer
were added and the samples agitated and diluted to volume. The absorbance
of the iron(II)-Ferrozine complex was measured at 562 nm after 10 minutes
using a 1 cm pathlength cells. To obtain the high precision results, the
amount of time required for each step must be closely monitored. The
amount of time for each step was adjusted so as to allow the handling of
10 samples during a run. Each sample was given the same amount of
reaction time in each step. A flow diagram of this procedure is shown in
figure 7. Both standard samples and simulated unknown samples were
determined by analyzing the samples in the same manner.

Figure 7
HMT DETERMINATION
HMT sample
Hydrolyse HMT
add 1 mL 1 M HCIO4 heat at 60°C for 10 min. chill for 1 min.
add 200 µL 0.075 M Ag+ add 500 µL 2.2 M N aOH vortex mix, react for 10 min.
Ago
Reduce Fe3+
Form Complex
add 2 mL 0.004 M Fe3+ add 6 mL buff er pH 3.5 add 2 mL 0.01 M Ferrozine dilute to vol., react 10 min.
Fe(Fz):- measure abs. at 562 nm
Flow diagram for the HMT determination procedure.
43

44
Determination of HMT by USP XXII Chromotropic Acid Method:
Hexamethylenetetramine in synthetic aqueous samples was determined
by the USP XXII method (59). Sample aliquots of 80.0 µL containing 0.026
to 0.26 µmol HMT were pipetted into 10-mL volumetric flasks. Five mL of
dilute sulfuric acid (1 in 2) and, 2.5 mL of chromotropic acid reagent
solution were added and mixed. The 10-mL volumetric flasks were placed
in a boiling water bath for 30 minutes, accurately timed, and then
immediately cooled in ice water to room temperature. Dilute sulfuric acid
(1 in 2) was added to volume, the solution mixed, and the absorbance
measured at 570 nm against a blank.
Determination of HMT-monomandelate:
Samples of methenamine mandelate, the most common prescription form
of HMT administered for urinary tract infections, in synthetic aqueous
samples were tested by the same procedure as described for HMT. Mandelate
does not interfere with any of the HMT tests and HMT-monomandelate
produced the same results as pure HMT.
Determination of HMT in the Presence of a Large Amount of Formaldehyde:
Hexamethylenetetramine in the presence of a large excess of
formaldehyde was determined using a modification of the hydrolysis and
hydrous silver oxide iron(III)-Ferrozine method. The determination was
accomplished by eliminating the large amount of formaldehyde before the
hydrolysis of HMT. The elimination of formaldehyde was achieved by either
evaporation or chemical reduction. To obtain the most accurate results
for either method of formaldehyde elimination, a blank correction

45
calibration curve related to the original amount of formaldehyde in the
sample was made. Formaldehyde blanks were determined along with the
samples being tested. The blanks were linear and proportional to the
original amount of formaldehyde present in the samples. If the
concentration of formaldehyde in each sample was not known, the samples
were tested for formaldehyde with the hydrous silver oxide iron(III)-
Ferrozine method by Al-Jabari and Jaselskis (49). The samples were
diluted 20 fold to obtain a formaldehyde concentration of ~0.01 M. A 100
µL aliquot was introduced into a 50 mL volumetric flask containing 300 µL
0.075 M silver nitrate and was made alkaline with 100 µL 0.1 M sodium
hydroxide. After vigorous mixing and 5 minutes standing, 2 mL 0.004 M
Fe(III), 2 mL 0.01 M Ferrozine and 5 mL pH 3.5 acetate buffer were added
and the contents diluted to volume. Absorbance of the iron(II)-Ferrozine
complex was measured at 562 nm after 10 minutes.
Evaporation of formaldehyde containing samples and blanks was
accomplished as follows. Sample aliquots of 50 µL containing 0.016 to
0.16 µmol HMT were pipetted into 30 mL test tubes. Twenty µL 0.025 M
nickel nitrate and 10 µL glacial acetic acid were added and the sample was
evaporated using aspirator vacuum in a vacuum desiccator containing
Drierite. Samples were always kept to a maximum of 150 µL since larger
volumes require too much time to evaporate. After evaporation was
completed, 400 µL of distilled water were added and the samples were
determined in the same manner as previously described for aqueous samples
of HMT with a final diluted volume of 25 mL.
procedure is shown in figure 8.
A flow diagram of this
46
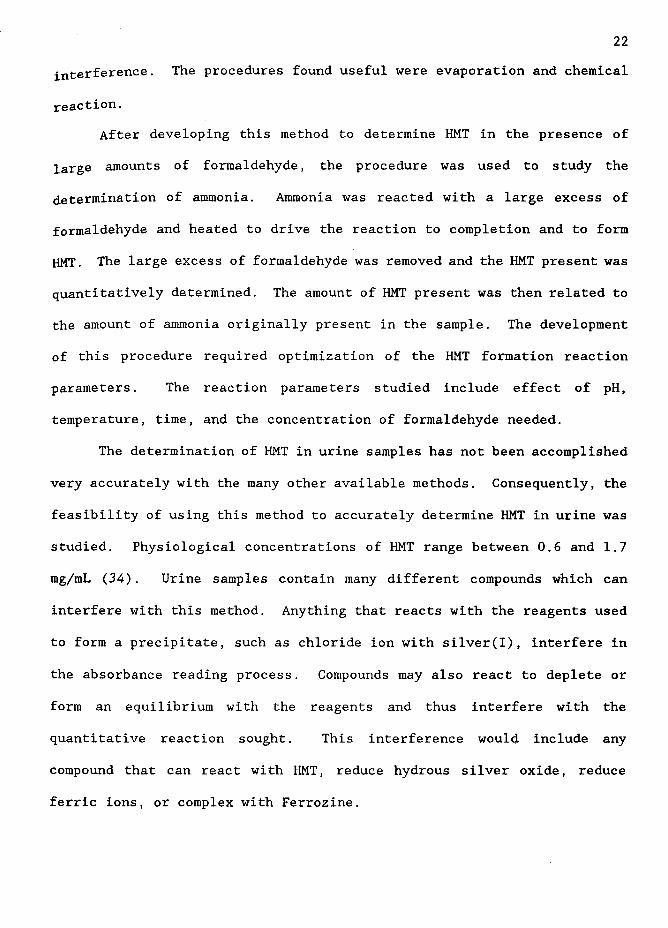
Reduction of the formaldehyde containing samples was accomplished
as follows. Sample 50 µL aliquots containing 0.016 to 0.16 µmol HMT and
up to 0. 2 M formaldehyde were pipetted into 25 mL volumetric flasks.
Twenty µL 2.40 M sodium borohydride was added and allowed to react for
about 15 minutes. The samples were neutralized with 25 µL 2 M perchloric
acid, diluted to about 400 µL, and determined as previously described for
aqueous samples of HMT. A flow diagram of this procedure is also shown
in figure 8.

Figure 8
ELIMINATION OF CH2O 50 µL HMT + CH2O
add 20 pL 0.02SM Nil+
add 10 pL glacial acetic acid
evaporate to dryness ~,$'(>-0<.,'l,
dilute to 400 pL -<t-t§I,.
400 µL HMT
add 20 pL 2.4 M BH_.
react 1S min.
~ add 2S µ,L 2 M HCIO_.
C9~ (\/1;. ~0~ dilute to 400 pL
400 µL HMT
Proceed with HMT determination
Flow diagram for formaldehyde interference removal by evaporation or reduction.

48
Determination of Ammonia:
The determination of ammonia was accomplished by first reacting the
ammonia with an excess amount of formaldehyde. Once the reaction was
complete, the formaldehyde was removed and the remaining HMT was
determined and quantitatively related to the amount of ammonia originally
present in the sample. A formaldehyde concentration of 0.1 M was used in
these tests to make its removal for the HMT determinations easier.
Ammonia samples and standards were added quantitatively to
volumetric flasks so that the final diluted ammonia concentration was in
the range between 0.5 and 8.5 mM. Formaldehyde was quantitatively added
to the flask to produce a diluted concentration of 0.10 M, the solution
was diluted to volume with distilled water, and mixed. The flask was
immersed in a 60° C water bath for 4 hours to insure complete HMT
condensation. The sample was then cooled to room temperature and a 50 µL
aliquot was removed to test for HMT formed. At this point the samples
contained HMT and a large amount of formaldehyde. The samples were
determined either using the evaporation method or the reduction method of
formaldehyde removal. Both procedures were compared and HMT was
determined as described previously for the determination of HMT in the
presence of a large excess of formaldehyde.
Determination of HMT in Urine:
Urine samples spiked with HMT were determined for HMT using a
modification of the previous methods to remove the interferences present.
The removal of these interferences was based on the stability of HMT to
hydrolysis in alkaline conditions.

49
Urine sample aliquots of 50 µL containing 0.096 to 0.48 µmol HMT
were pipetted into 10 mL test tubes containing 20 µL 2. 2 M sodium
hydroxide and 550 µL 0.09 M silver nitrate. The test tubes were stoppered
and heated at 60° C for 10 minutes to oxidize the interferences with
silver oxide. The samples were chilled in ice water, centrifuged, and
filtered through cotton plugged pasteur pipettes to remove all
precipitated interferences. Aliquots of 100 µL from each sample were
placed in 25 mL volumetric flasks containing 300 µL water and HMT was
determined in the samples as previously described for aqueous samples of
HMT.
A flow diagram of this procedure is shown in figure 9. Since
interferences in urine vary, the method of standard additions was found
to be best suited for determination of HMT present.

Figure 9
ELIMINATION OF URINE INTERFERENCE
SOµL HMT-urine
\]
add 20µ.L 2.2
add 550 µ.L 0.0
M NaOH
9M Ag+
in. heat 60° C 15 m
chill to room t emp.
centrifuge
filter supernat ant
I 620 µL HMT-urine I
\l
remove 100 µ.L aliquot
0 add 300 µ.L H2
I 400µL HMT(urine) I
Proceed with HMT determination
Flow diagram for the removal of urine interferences.
50

51
Results and Discussion
All the results of the various determinations in this study use the
hydrolysis, silver oxide, and iron(III)-Ferrozine method unless otherwise
noted. All calibration curves are shown with the 95% confidence intervals
plotted as dotted lines. The simulated unknowns are plotted on the
corresponding calibration curve as error bars of their standard
deviations. For comparative purposes the simulated unknown results are
also shown in tabular form.
Determination of Aqueous HMT Alone:
The standard calibration curve for the determination of HMT in
aqueous samples is shown in figure 10. The unknown amount of HMT in
synthetic samples is also determined using the standard calibration curve.
The results of the unknown sample determinations are shown in figure 10
and table 6.
The calibration curve, figure 10, shows that the iron(II)-Ferrozine
complex, formed after the hydrolysis of HMT, follows Beers law in the
range 3. 2 x 10⁻⁷ to 3. 2 x 10-s M HMT. This method has been found to be
linear to at least 1.6 absorbance units. The theoretical apparent molar
absorptivity should be 12 x 27,900 = 335,000 L/(cm mol) at 562 mn.
However, the obtained apparent molar absorptivities are typically between
314,000 and 322,000, or equivalent to 94 to 96 percent of the expected
335,000 value.

52
This procedure requires about 40 minutes for the determination of
10 samples. The samples are run through each step at one minute time
intervals between samples.
Table 6
Sample (ppb)
111
210
367
108
334
251
108
334
251
Determination of HMT in simulated pure aqueous unknown samples and formaldehyde containing unknown samples.
Formaldehyde cone. Absorbance 8 Amount determined R.S.D.b (M) (M)det. (A)
Pure aqueous HMT samples
0.276 ±0.003
0.502 ±0.002
0.852 ±0.002
(ppb) (%)
113
213
370
102
102
101
Aqueous CH20-HMT samples: CH20 removal by evaporation
0.0331
0.164
0.0943
0.0297
0.163
0.0933
0.287 ±0.002
0.800 ±0.005
0. 611 ±0. 002
109
332
251
101
100
100
Aqueous CH20-HMT samples: CH20 removal by NaBH4 reduction
0.0331
0.164
0.0943
0.0297
0.163
0.0933
0.286 ±0.004
0.849 ±0.004
0.639 ±0.005
109
334
254
101
100
101
1.07
0.345
0.242
0. 718
0.650
0.267
1. 38
0.500
0.706
aAverage of four samples and standard deviation bR.S.D. - relative standard deviation

~ u z ~ ~ 0 ~ = <
Figure 10
1.200 ~----------------------------,
1.000
0.800
0.600
0.400
0.200
Regression Output: Constant Std Err of Y Est R Squared No. of Observations
0.0237 0.0115
0.999 16
Degrees of Freedom 14 Slope 314000 Std Err of Coef 2650
0 .0 0 0 L.__ __ ____j_ ___ ___.L__ __ ______L ___ _,__ ___ _J.__ __ ----'-----------'
0.0 5.0 10.0 15.0 20.0 25.0 30.0 35.0 HMT CONCENTRATION (M) (1E-7)
Calibration curve for the determination of pure aqueous HMT and synthetic unknown samples. u, w

54
Determination of HMT by the USP XXII Chromotropic Acid Method:
The standard calibration curve for the determination of HMT in
aqueous samples is shown in figure 11. Unknown synthetic samples were
also run and HMT determination was accomplished using the standard
calibration curve. The results of the unknown HMT sample determinations
are shown in figure 11 and table 7.
The standard curve in figure 11 shows that the results are very
linear with a correlation coefficient r 2 of 0. 9998 for 6 samples. However,
the apparent molar absorptivity of 41,400 L/(cm mol) is less than one half
the theoretical apparent molar absorptivity of 15,900 X 6 - 95,400 L/(cm
mol). Formaldehyde was tested along with the HMT samples for comparison.
The results are shown in figure 12. The formaldehyde samples were tested
by the same procedure as HMT and produced a molar absorptivity of 15,900
L/(cm mol). This good molar absorptivity agreement for formaldehyde
demonstrates that the low HMT results are probably not due to formaldehyde
lost during the 30 minute, 100° C hydrolysis step. The low results may
be a consequence of the secondary reactions of HMT or decomposition of the
chromotropic acid. Incomplete hydrolysis is probably not responsible for
the low results.
Sulfuric acid was studied for the hydrolysis of HMT with the hydrous
silver oxide iron(III) Ferrozine determination of formaldehyde. The
results of 0.71 M sulfuric acid hydrolysis at 60° C ranged between 70 and
95 percent of the expected released formaldehyde. Since the chromotropic
acid method uses 9 M sulfuric acid, lower results should not be expected.
The chromotropic acid method appears to be very time dependent.
The USP procedure states that the 30 minute hydrolysis be accurately

55
timed. The measured absorbance of each sample decreased on repetitive
observations. The absorbances may have stabilized after about 10 minutes
after final dilution. It was also noted that the chromotropic acid
reagent possibly degrades in solution after a few hours. Experiments with
a fresh reagent produced apparent molar absorptivities of approx. 48,000
L/(cm mol). Six hours later the same reagent produced apparent molar
absorptivities approx. 35,000 L/(cm mol). The results obtained with the
6 hour old reagent were also very erratic.
The USP method employs an HMT standard in the determination and does
not list an expected apparent molar absorptivity. The use of the standard
addition procedure accounts for any variation in the determination.
This procedure requires more than 1 hour for the determination of
10 samples. Each sample is analyzed separately which requires a minimum
of a three minute interval between samples. A batch process of performing
each step on all of the samples simultaneously was not used, because the
absorbance decreased with time and must be closely monitored.

Jl:i u z ~ ~ 0 rJ) ,::Q
<
Figure 11
1.600
1.400
1.200
1.000
0.800
0.600
0.400
0.200
0.000 0.0
Regression Output: Constant 0.0267 Std Err of Y Est 0.00 8 S 3 R Squared 1.00 No. of Observations 6 Degrees of Freedom Slope Std Err of Coef
5.0 10.0 15.0 20.0 25.0 30.0 HMT CONCENTRATION (M) (lE-6)
4 41400
286
35.0
Chromotropic acid calibration curve for the determination of pure aqueous HMT and synthetic unknown samples.

1.000 r-------------------------~
0.800
0.600
0.400
0.200
Re1ru1loa Oatpat: Coa1tant 0.0255 Std Err of Y Eat 0.00271 R Sqaared 1.00 No. of Obaenatloa, 4 De1ree1 of Freedom 2 Slope u,oo Std Err of Coef ,1.0
0.000 ~ _ _.___..,____...,___----'----'------'-----'-----'--------'----'--------'~-----' 0.00 0.S0 1.00 1.S0 2.00 2.S0 3.00 3.S0 4.00 4.S0 S.00 S.S0 6.00
CH2O CONCENTRATION (M) (lE-5)
57
Figure 12 Chromotropic acid determination of formaldehyde standards.
1.000 ----------------------~
0.800
a 0.600
i ; 0.400
0.200
Re1res1lon Oatpat: Coutant 0.00665 Std Err of Y E1t 0.00441 R Sqaared 1.00 No. of Obaenatlon1 4 De1ree1 of Freedom 2 Slope 55 600 Std Err of Coef 3 7 3
0.000 ~-~--~-~--~-~--~-~--~-~ 0.00
Figure 13
0.20 0.40 0.60 0.80 1.00 1.20 1.40 1.60 1.80 CH2O CONCENTRATION (M) (lE-5)
Hydrous silver(I) oxide iron(III) -Ferrozine calibration curve for formaldehyde in synthetic unknowns.

fable 7
sample (ppm)
1.11
2.10
3.67
58
Determination of HMT in simulated pure aqueous unknown samples by the USP chromotropic acid method.
Absorbance8 Amount determined R.S.D.b (A) (ppm) (%)
0.363 ±0.001 1.14 103 0.159
0.649 ±0.003 2.11 100 0.408
1.076 ±0.003 3.56 96.8 0.233
8Absorbance - average of three samples and standard deviation 8R.S.D. = relative standard deviation

59
Determination of HMT in the Presence of a Large Amount of Formaldehyde:
The determination of HMT in the presence of a large amount of
formaldehyde was accomplished by first removing or greatly lowering the
formaldehyde interference and then testing for the HMT as previously
described. The formaldehyde interference was eliminated by either the
method of evaporation in the presence of Ni(II) or by reduction to
methanol with borohydride. Both methods were studied using the same
samples for comparison. The standard calibration curves are shown in
figures 14 and 15. The synthetic unknown sample results are shown in
table 6 and figures 14 and 15.
To achieve the most accurate results possible, the amount of
formaldehyde in each unknown sample was determined, using the method of
Jaselskis and Al-Jabari (49). The formaldehyde standard calibration curve
is shown in figure 13. The results of the diluted unknown sample are
shown in table 6 and plotted as points on the calibration curve figure 13.
The molar absorptivity for the formaldehyde determination corresponds to
55,600 L/(cm mol), which is very close to the theoretical value 2 x 27,900
= 55,800. However, this determination does not need to be very accurate
because the residual absorbance corrections for initial formaldehyde
concentration are relatively small.
The results of the evaporation procedure are shown in figure 14 and
table 6. The apparent molar absorptivity obtained for the evaporated
standards was 307,000 L/(cm mol). The obtained value was lower than the
theoretical apparent molar absorptivity. The low value was probably due
to a small loss of HMT during the evaporation step used in this procedure.
Alternatively, a small amount of the HMT may have been hydrolyzed to

60
formaldehyde during evaporation in the presence of acetic acid or the HMT
may have been sublimed when the sample reached dryness. This loss is
proportional, thus the standard curve makes the appropriate correction.
The time required for the formaldehyde removal was about 2 hours.
The borohydride reduction results are shown in figure 15 and table
6. The apparent molar absorptivity obtained for the reduction of standard
HMT was 322,000 L/(cm mol). This apparent molar absorptivity indicates
that there is no loss of HMT resulting from this procedure. The time
required for the formaldehyde removal was about 15 minutes.
Both of these methods of formaldehyde removal work very well.
However, these methods also have their disadvantages. The evaporation
method requires a time interval corresponding to the amount of aqueous
sample being evaporated. The time required to evaporate 10 to 20 samples
containing 150 µL of aqueous solution is about two hours. Another problem
with the evaporation method is residual formaldehyde interference. This
interference corresponds to about 0.05 absorbance units per 25 mL final
dilution of 50 µL 0.2 M formaldehyde. The borohydride reduction method
requires only about 15 minutes time for reduction. However, there is a
residual formaldehyde interference. This interference corresponds to
about O .18 absorbance unit per 25 mL final dilution of 50 µL O. 2 M
formaldehyde sample as was shown in figure 5.

~ u z ~ ~ 0 rl)
=:i <
Figure 14
1.200 ~---------------------~
1.000
0.800
0.600
0.400
0.200
Regression Output: Constant 0.0258 Std Err of Y Est 0.00200 R Squared 1.00 No. of Observations 8 Degrees of Freedom 6 Slope 307000 Std Err of Coef 6 S S
0. 0 0 0 L__ __ _____j_ ___ __,__ ___ _.L.._.. __ ___,_ ___ -----'--------'------
o. o S.0 10.0 1S.0 20.0 2S.0 30.0 3S.0
HMT CONCENTRATION (M) (lE-7)
Calibration curve for the determination of HMT samples and CH20-HMT synthetic unknown samples after evaporation.

~ u z ~ ~ 0 rl)
~
<
Figure 15
1.200 ~---------------------------,
1.000
0.800
0.600
0.400
0.200
Regression Output: Constant 0.0189 Std Err of Y Est 0.00564 R Squared 1.00 No. of Observations 8 Degrees of Freedom 6 Slope 322000 Std Err of Coef 1840
0. 0 0 0 L------'----------'------'--------l.-----'-------'-------
0 .0 5.0 10.0 15.0 20.0 25.0 30.0 35.0
HMT CONCENTRATION (M) (lE-7)
Calibration curve for the determination of HMT samples and CH20-HMT synthetic unknown samples after borohydride reduction. °'
~

63
Determination of Ammonia:
The determination of HMT formed was accomplished in a manner similar
manner to the determination of HMT in the presence of a large amount of
formaldehyde. The formaldehyde interference was first eliminated by
evaporation or borohydride reduction and the remaining HMT was determined
as previously described. Both methods of formaldehyde removal were used
here for comparison on the same ammonia samples. The standard calibration
curves are shown in figures 16 and 17. The synthetic unknown sample
results are shown in table 8 and figures 16 and 17.
All of the standard and synthetic unknown reaction solutions were
run at a formaldehyde concentration of 0.1 M formaldehyde. Thus all the
samples were essentially the same in formaldehyde concentration after the
condensation reaction was complete. The residual formaldehyde
interference was the same in all samples and corrected for in the standard
calibration curve.
The apparent molar absorptivities for these methods were both around
80,000 L/(cm mol). This falls in the expected range of 78,500 to 80,500,
which corresponds to the aqueous pure HMT sample range.
sample concentrations ranged from 15 to 120 ppm.
The ammonia

Figure 16
1.400 -------------------------------,.
1.200
1.000
0.800
0.600
0.400
0.200
Regression Output: Constant 0.106 Std Err of Y Est 0.00404 R Squared 1.00 No. of Observations 7 Degrees of Freedom Slope Std Err of Coef
s 80600
312
0 .0 0 0 '------'--------'-------'------'----------'----'-----------L------'
0.0 2.0 4.0 6.0 8.0 10.0 12.0 14.0 16.0 NH 3 CONCENTRATION (M) (lE-6)
Calibration curve for the determination of ammonia samples and synthetic unknown samples after evaporation.
~ u z ~ ~ 0 fZI j:Q
<
Figure 17
1.400 ~----------------------~
1.200
1.000
0.800
0.600
0.400
0.200
Regression Output: Constant 0.0440 Std Err of Y Est 0.00693 R Squared 1.00 No. of Observations 10 Degrees of Freedom 8 Slope 80200 Std Err of Coef 508
0. 0 0 0 '-----------'---------'--------'---------'-----'----....L---~-~
0.0 2.0 4.0 6.0 8.0 10.0 12.0 14.0 16.0 NH 3 CONCENTRATION (M) (1E-6)
Calibration curve for the determination of ammonia samples and synthetic unknown samples after borohydride reduction. °'
u,

66
Table 8 Determination of ammonia in simulated unknown samples.
Sample Formaldehyde Absorbance 8 Amount determined R.S.D.b (ppb) removal (A) (ppb) (%)
33.3 evap. 0.422 ±0.004 33.4 100 0.948
48.9 evap. 0.584 ±0.006 50.5 103 0.969
84.5 evap. 0.915 ±0.007 85.5 101 0.790
107 evap. 1.133 ±0.008 109 101 0.685
33.3 reduct. 0.366 ±0.002 34.1 102 0.580
48.9 reduct. 0.507 ±0.002 49.1 100 0.419
84.5 reduct. 0.852 ±0.002 85.7 101 0.249
107 reduct. 1.074 ±0.007 109 102 0.658
aAbsorbance = average of three samples and standard deviation bR.S.D. = relative standard deviation

67
Determination of HMT in Urine:
The determination of HMT in urine was accomplished by first removing
the urine interferences. Since HMT is stable to hydrolysis in alkaline
solution, most of the urine interferences were removed by keeping the
sample at high pH. However, a small residual amount of interference was
at times still present after the interference removal procedure. This
problem was overcome by using the method of standard additions. The
standard additions curve is shown in figure 18.
The slope of the standard additions curve gave an apparent molar
absorptivity of 314,000 L/(cm mol). This value fell within the expected
range. Thus HMT was not lost during the interference removal process.
The three points at 7 x 10·7 M HMT were separate samples run through the
procedure and show high precision.
The diluted samples tested along the standard additions curve shown
in figure 18 correspond to original urine-HMT concentrations of 0.27 to
1.35 mg/mL. Since physiologic concentrations of HMT range from 0.6 to
1. 7 mg/mL (34), this method is sufficiently sensitive for clinical
applications.
Other methods used for this determination have been criticized as
being inaccurate, because they determine formaldehyde before HMT
hydrolysis and the total formaldehyde after HMT hydrolysis. The
formaldehyde difference is then due to HMT. The urine sample and
formaldehyde determination are both in acidic solutions causing hydrolysis
of HMT which results in a high "prehydrolysis" formaldehyde concentration.
This results in inaccurate low values of HMT. The method described here
with alkaline samples removes formaldehyde and interferences before HMT

68
hydrolysis. The problem of hydrolysis in acidic urine can be solved by
making the solution alkaline after its collection.
interfere with the method described here.
This does not

ix;i u z ~ ~ 0 rJ'.l t:Q
<
1.200 c------------------------------,
1.000
0.800
0.600
0.400
0.200
Regression Output: Constant 0.0340 Std Err of Y Est 0.00461 R Squared 1.00 No. of Observations 6 Degrees of Freedom 4 Slope 314000 Std Err of Coef 2000
0.000 ~--~--~--~---~--~--~--~ 0.0 S.0 10.0 1S.0 20.0 2S.0 30.0 3S.0
HMT CONCENTRATION (M) (lE-7)
Figure 18 Standard additions curve for the determination of HMT in urine samples.

THE DETERMINATION OF HEXAMETHYLENETETRAMINE AND AMMONIA
BY NUCLEAR MAGNETIC RESONANCE SPECTROSCOPY
Introduction
Background:
In NMR spectroscopy, a strong magnetic field causes the energies of
certain nuclei to be split into two or more quantized levels, owing to the
magnetic properties of these nuclei. In this magnetic field the nuclei
orient themselves to populate the lower energy state to a greater extent
than the higher energy state. At room temperature, only a small excess
(<10 ppm) populates the lower energy state as compared to the higher
energy state in accordance with the Boltzman distribution. Transitions
among the resulting magnetically induced energy levels can be brought
about by the absorption of radio frequency (rf) energy at the nucleus
resonance frequency. The peak absorption of energy is observed at this
resonance frequency.
Many atomic nuclei behave as if they were spinning and possess
quantized spin angular momentum. If an atomic nucleus possesses either
odd mass number or odd atomic number, or both, it has spin angular
momentum. The angular momentum can be described in terms of spin number
I. The number of allowed spin states is determined by its spin number and
is a physical constant for each nuclei. In the presence of a magnetic
70

71
field, a nucleus will have 2I + 1 discrete states. In the absence of a
magnetic field, these states all have the same energy. The spin quantum
numbers of several common nuclei are shown in table 9. A diagram of the
proton splitting is shown in figure 19.
Conventional, or continuous wave NMR spectroscopy is not very
sensitive. The spectrometer scans the spectrum at a slow rate in order
to achieve a high signal for narrow absorbances. Therefore, time is
wasted by recording mostly background and occasionally recording a signal.
Efficiency and sensitivity of this system is far from optimum. The
generation of good proton spectra for samples in microgram quantities is
difficult, time consuming, and sometimes impossible.
Fourier transform (FT) NMR overcomes this time problem by operating
in a different manner. A strong pulse of rf energy is applied to the
sample for a very short time (1-1000 µsec). This pulse of energy contains
a range of frequencies sufficiently great to excite nuclei with different
resonance frequencies. Following the pulse, a rf emission signal due to
the decay of the excited nuclei back to equilibrium in the magnetic field
is recorded as a function of time. This free induction decay (FID) signal
contains all the resonance frequencies of the excited nuclei present. The
observation time is usually between 1 and 4 seconds. This process can
then be repeated and the FID signals are averaged to give a vastly
improved signal to noise ratio. This improvement occurs since the signals
add linearly while the noise adds as the square root of the number of
pulses. The FID signal contains all the information needed to produce
a normal frequency domain NMR spectrum. A digital computer then performs

72
a fast Fourier transformation of the FID to produce the spectrwn. A FID
and its transformed spectrwn are shown in figures 20 and 21.

Table 9
ELEMENT
SPIN NO.
SPIN STATES
Figure 19
Spin quantum numbers of some common nuclei.
~H
1 2
2
1 0
3 0
1 2
2
·······················}
1 0
3 0
5 2
6
ll.E = kH0 = hv
1 2
2
Ho------------------INCREASING MAGNETIC FIELD
3 2
2
~Cl
1 2
4
73
The spin state energy separation as a function of the strength of the applied magnetic field (H0 ).

Figure 20
I I I 7
Figure 21
74
Example of FID signal containing all proton resonance signals.
I I I I' 6
I JI I I I 4
j I I I I I I I 3
Transformed FT-NMR frequency domain spectrum.
I I I I I I
2 PPM

75
The resolution and sensitivity are critically dependent on the
strength and quality of the magnet. A stronger magnetic field produces
better line separation of nuclei in the spectrum. This higher sensitivity
is due to a more populated lower energy state resulting from greater
splitting of the energy states. This splitting due to magnetic field
strength is shown in figure 19. The magnet also must be highly
homogeneous and reproducible within the sample area.
Nuclear magnetic resonance methods are not widely used for
quantitative analyses. The most common and important applications of NMR.
are for the identification of atomic configurations of organic, metal
organic, and biochemical molecules. In NMR. spectroscopy, the area under
an absorption band is proportional to the number of nuclei responsible for
the absorption. A quantitative determination does not require a pure
sample but the peaks of interest in the spectra must not overlap other
peaks present.
Two methods have been reported in the literature for the
quantitative NMR. determination of HMT at the milligram level using a 60
MHz continuous wave NMR. Baum and Goodman (70) in 1970 determined HMT in
urea-formaldehyde molding compounds. Deuterated chloroform was used to
extract the HMT from a dried finely ground sample. The HMT containing
sample was evaporated to about 10 mL and cyclohexane was added as the
reference standard. The spectrum was then determined and integrated.
Losses were reported to occur if there was moisture in the sample and if
the sample was heated during the drying process.
In 1973, Turczan and Goldwitz (41) reported a method for the
determination of HMT in methenamine and methenamine mandelate

76
pharmaceutical tablets. At least 20 tablets were finely ground. About
70 mg HMT or 150 mg HMT-mandelate and 350 mg maleic acid reference
standard were added to 3 mL NMR solvent. To overcome the problems of
solubility, overlapping of the resonance signals, and potential
decomposition of HMT, the deuterated NMR $qlvent was formulated to contain
65% acetonitrile, 25% acetone, and 10% dimethylformamide. The sample was
mixed, centrifuged, and 0.4 mL was transferred to a NMR tube. Between 94
and 100 percent HMT were obtained.
Statement of Problem and Approach:
The goal of this study was to develop a moderately sensitive proton
NMR method for the determination of HMT in aqueous solutions alone and in
the presence of large amounts of formaldehyde. Determination of HMT in
the presence of a large amount of formaldehyde will also allow the
indirect determination of ammonia, via its quantitative reaction with
excess formaldehyde to form HMT. Application of this method to the
determination of HMT in urine was also studied.
The proposed method is based on the use of a 300 MHz FT-NMR to
provide high resolution and sensitivity. The 300 MHz FT-NMR has a magnet
operating at 7.05 tesla as compared to a basic 60 MHz NMR magnet operating
at 1.409 tesla. High resolution and sensitivity are critically related
to the strength of the magnetic field. This high field strength allows
the determination of low microgram amounts of HMT within a reasonable
amount of NMR operating time. The working determination range for HMT in
0.6 mL NMR solvent is 5 to 35 µg. This amount of HMT cannot be detected
using a continuous wave 60 MHz NMR.

77
The determination of HMT is based on the quantitative integration
of its proton resonance peak area. Hexamethylenetetramine is a
symmetrical "adamantane like" molecule containing 12 equivalent protons
as shown below.
HMT
These 12 equivalent protons produce one large singlet proton NMR signal.
This signal can be used for the quantitative measurement of HMT
concentration as shown in figure 22.
The development of this procedure required investigation of
experimental and instrumental parameters. The experimental parameters
included: i) a suitable reference standard employed for quantitative
measurements, ii) appropriate solvent in respect to solubility and
reactivity of HMT and the reference standard, iii) elimination of
resonance peak interferences. Instrument parameters were optimized
including: i) spectral width, ii) pulse width, and iii) pulse delay.
Once the optimum conditions were established for solid HMT, the
method was applied to various aqueous samples. Water cannot be present

78
in the NMR determination. Water was replaced with a deuterated NMR
solvent. Methods were developed to remove water either by evaporation or
extraction into a more volatile solvent for evaporation. Extraction of
HMT into a more volatile organic solvent was investigated to reduce the
time required for evaporation. Extraction of HMT in a deuterated NMR
solvent would eliminate the need for evaporation but the amount of NMR
solvent needed would be cost prohibitive. After evaporation, the residue
was dissolved in an NMR solvent containing a reference standard,
transferred to a 5 mm NMR tube, and run on the FT-NMR.
After developing the procedure to determine aqueous HMT samples,
methods were investigated to determine HMT in the presence of a large
amount of formaldehyde. The evaporation of formaldehyde leaves
paraformaldehyde, which yields resonance signals that interfere with the
HMT signal of interest. Therefore, techniques were needed to reduce the
formation of this formaldehyde residue. A number of approaches were
investigated, and satisfactory modified evaporation and extraction
techniques were developed.
After developing the method to determine HMT in the presence of
large amounts of formaldehyde, the procedure was used to study the
determination of ammonia. Ammonia was reacted with a large excess of
formaldehyde and heated to drive the reaction to completion and to form
HMT. The large excess of formaldehyde was removed and the HMT was
quantitatively determined. The amount of HMT was then related to the
amount of ammonia originally in the sample. The development of the
quantitative ammonia condensation parameters was described previously for
the spectrophotometric determination.

79
This method was then applied to the study of spiked urine samples.
Urine samples contain many different compounds which may produce proton
resonance signals which interfere with the HMT signal. Extraction methods
were developed to remove the urine interferences and to leave the HMT in
a volatile organic solvent suitable for evaporation.
Experimental
Instrumentation:
All fourier transform nuclear magnetic resonance experiments were
performed on an 300 MHz Varian VXR-300 FT-NMR using a Varian 300 MHz
Generation III switchable 5 mm probe. All continuous wave NMR experiments
were performed on an 60 MHz Varian EM-360 NMR. Constant temperatures were
obtained using a Cole Parmer model 1266-00 immersion circulator water
bath. The pH measurements were made using a Fisher Accumet model 830 pH
meter. Solid and liquid samples were weighed with either a Sartorius
analytical balance or semi-micro balance.
Reagents:
All chemicals used were analytical or primary standard grade.
Acetonitrile-d3 and chloroform-d3 NMR solvents were purchased from Aldrich
and Isotech. Formate buffer, pH 4.0, was prepared by titrating 0.1 M
formic acid (3. 93 mL concentrated formic acid/1 L) with 50% sodium
hydroxide. Bromocresol green, 3', 3", 5', 5" -tetrabromo-m-cresolsulfone-
phthalein, sodium salt (Aldrich), was dissolved in pH 4.0 formate buffer
to produce a 0.0025 M solution (0.180 g/100 mL). Silica gel columns were

80
prepared by placing 900 mg silica gel, grade 60, 230-400 mesh, 60 A
(Aldrich), into a 7.0 mm i.d. glass colwnn plugged with glass wool. All
other reagents used are described in the previous sections.
Development of Methods
Solvent Solution:
The best solvents for proton NMR spectroscopy contain no protons,
such as carbon tetrachloride. However, many compounds are not soluble in
carbon tetrachloride. Thus, a variety of deuterated solvents are used
instead. The choice of NMR solvents took into account price and ready
availability. Since HMT is very highly soluble and stable in water, D20
appeared to be a good choice. However, D20 presented a problem because its
HDO solvent impurity resonance signal occurred at the chemical shift of
o 4.61 and the HMT signal at o 4.69. These signals were sufficiently
close together to interfere with each in the quantitative integration
measurements. The solvent of preference was deuterated chloroform,
probably the most common and least expensive deuterated NMR solvent.
Chloroform produced very good spectra because its solvent impurity
resonance signal, at o 7.13, did not interfere. However, chloroform will
slowly decompose amine. A fine white precipitate has been observed
forming in deuterated chloroform after the dissolution of HMT. The next
choice was deuterated acetonitrile since its solvent impurity resonance
signals were produced at o 1.93, and the H20 impurity resonance signal was
at o 2 .13. In this solvent the HMT resonance signal was observed at o
4.60 and the HMT compound was stable. These signals are labeled and shown

81
in figure 22. The solubility of HMT in acetonitrile was limited but at
the low microgram per mL concentrations, solubility is not a problem.
Reference Standard:
Quantitative measurement of HMT concentration requires the use of
an internal standard of known concentration. The proton signal area of
the compound of interest can then be quantitatively related to the proton
signal area of a known concentration of the reference standard. The
internal standard should preferably produce a strong singlet resonance
signal close to the proton resonance signal of interest, but it must not
interfere. The internal standard also should not react with HMT or the
NMR solvent. Knowing the amount of the internal standard present and the
ratio of the two proton signals, one can calculate the amount of HMT
present using equation 9
mass A mass Bx #B protons in signal #A protons in signal
X M.W. A M.W. B
X A signal area ( 9 ) B signal area
where A is the unknown HMT and Bis the internal reference standard.
Anisole (C6H50CH3 ) was chosen as the internal standard, since it is
soluble in deuterated acetonitrile, and its resonance signals do not
interfere with the HMT resonance singlet signal. The anisole methoxy
group produces a resonance singlet at 6 3. 77 and the benzene group
resonance signals are around 6 7 in deuterated acetonitrile as shown in
figure 22.

82
NMR Instrument Parameters:
To produce the best possible signal, instrumental parameters have
been optimized. Spectral width was narrowed from 4000 Hz to 2510 Hz
giving a greater number of data points for more precision in measurement.
The transmitter offset was adjusted from 400 Hz to 100 Hz to produce a
spectral range of o O. 3 and o 8. 0 which contained all the resonance
signals in the sample. Care had to be taken in the adjustment of spectral
width and transmitter offset, because any peak occurring outside of this
narrowed range would become folded and could possibly produce a poor
spectrum. A pulse width of 17.0 µsec was used for increased signal to
noise which is near the 90° pulse width of about 20 µsec. A pulse delay
of 1 sec was used to ensure that the FID signal had returned to
equilibrium before the next pulse occurred. Longer pulse delays were
investigated, and no signal to noise improvement occurred. Acquisition
times were adjusted for each sample to obtain an acceptable signal to
noise ratio for quantitative integration of the signal peaks. Thirty
minutes was considered the longest reasonable amount of time to be used
for a low concentration sample acquisition. Exact adjustment of the phase
for each spectrum was crucial for quantitative integration and small
adjustments had a large effect on the integration and the results for low
concentration samples. Electronic integration results were checked with
hand measured results to verify the accuracy of the electronic
integration. The best integration data were obtained when the reference
resonance signal was similar in area to the HMT signal. For each group
of samples tested, a constant concentration of reference standard was used
so that the only variable was the concentration of HMT. Optimized

83
instrumental settings used are shown in table 9. An example of the
spectra obtained using these optimized parameters is shown in figure 22.
Table 10
Nucleus
Frequency
Spec. Width
Acq. Time
Pulse Width
Offset
Pulse Delay
Instrument parameters used for FT-NMR determinations.
d-acetonitrile d-chloroform
1.250 1.750
300 MHz 300 MHz
2510.0 Hz 4000.0 Hz
3.697 sec 3.752 sec
17.0 µsec 17.0 µsec
100 Hz 700 Hz
1.000 sec 1.000 sec

Figure 22
I Ii I II 4.6
l.000
-C5H5 (anisole)
A
I I I I
4.4
I I 6
I I I' 4.2
I I 5
I
I I I I
4.0
CH2 (HMT) I
I I 4
II I II I I I 3.8 PPM
I I 2.8911
+- -OCH 3 (anisole)
I I 3
I 1
I I ii I 2 PPM
Example FT-NMR spectrum of HMT and anisole in d-acetonitrile solvent using the optimized instrumental parameters. The inset spectrum shows the HMT and anisole peaks integrated in the standard manner.

85
Evaporation of Water:
Aqueous samples of HMT required the removal of solvent (water) and
its replacement with deuterated acetonitrile. The evaporation of aqueous
HMT samples described earlier for the spectrophotometric method presented
similar problems here. Evaporation of the samples in a vacuum desiccator
had to be stopped immediately when the water was evaporated. Sublimation
of the solid HMT began to take place at this point. To prevent the loss
of HMT due to sublimation, metal salts were added to the sample as
described for the spectrophotometric method. Nickel nitrate and cobalt
nitrate were tested. They greatly broadened the HMT peak to near baseline
height because of complexation with HMT and their paramagnetic properties.
Potassium cyanide was added to the NMR solvent to tie up the metal as a
stable complex thus releasing the HMT, but it produced a fine precipitate
which was difficult to work with. Dimethylglyoxime (DMG) was added to
nickel containing samples and produced a very large fluffy precipitate
which was simple to filter through cotton. Nickel-DMG results were
sometimes good but not reproducible, because the HMT peak signal rapidly
decreased after DMG addition and filtration. A small amount of strong
acid ion exchange resin was added to the solvent in an attempt to adsorb
nickel, but positive results were not obtained. Calcium nitrate,
magnesium nitrate, and zinc nitrate were tested, since they are not
paramagnetic. These metals did not broaden the HMT peaks to near baseline
height, but varied amounts of these metals slightly broadened and shifted
the HMT peak downfield in the NMR spectra due to complexation. The amount
of shift varied with the amount of metal present. Unfortunately, these
metals also produced inconsistent results and began to decompose HMT.

86
However, it was found that zinc acetate added in the ratio of 0.5:1 to 2:1
Zn(II):HMT would yield reproducible results. If zinc acetate was added
in amounts greater than 2:1 Zn(II):HMT, similar decomposition problems
would occur.
Evaporation of Formaldehyde:
The removal of formaldehyde by evaporation was accomplished in the
manner described earlier for the spectrophotometric method. Glacial
acetic acid was added to the sample to inhibit formaldehyde polymerization
to paraformaldehyde during the evaporation. When this interference was
not completely removed from the sample, the remaining interference
resonance peaks obstructed the integration of the HMT peak as shown in
figure 23. As was described for the spectrophotometric method, samples
containing up to 0.2 M formaldehyde required approx. 0.1 M acetic acid for
the evaporation. Zinc acetate was also added before evaporation to help
prevent sublimation. The sample evaporation was carried as described
previously for the evaporation of water.

Figure 23
I I I 7
j I I I I 11 I I I I I I I I,, I I I j I I I I I' I I I I• I I I I'' I I I• I I I I' I I I I• I I I 4.6 4.4 4.2 4.0 3.8 PPM
I I I 6
I I 5
I I 4
I I 3
I I II II 2 PPM
Example of FT-NMR spectrum determination of HMT with formaldehyde residue interference remaining after evaporation of formaldehyde. 00
-...J

88
Extraction of HMT:
The removal of formaldehyde from HMT samples may also be
accomplished by extraction of HMT from the aqueous sample leaving behind
formaldehyde and other interferences. Attempts were made to extract HMT
as a picrate into methylene chloride, chloroform, and isobutyl ketone, but
the results were not very promising. Liquid-liquid extraction of HMT is
not very efficient, because HMT is highly water soluble and weakly basic.
However, Strom and Jun (51) developed a method in which HMT was
adsorbed on a silica gel cartridge from aqueous solutions as an HMT
bromocresol green ion pair. Thus, the interfering substances were allowed
to pass through. The technique involved equilibrating the column with 5
mL of a pH 4 citrate buffer. One mL of the HMT sample was mixed with 1
mL of bromocresol green (BCG) in citrate buffer to form an ion pair which
was adsorbed on the silica gel cartridge. The ion-pair was then eluted
with 5 mL methylene chloride:1-pentanol (95:1). The ion-pair was
extracted from the eluate, and the HMT was freed from the ion pair by a
5 mL solution of tetrabutylammonium iodide in 0.1 M HCl. An aliquot was
removed and the HMT was spectrophotometrically determined by the Nash
method (51) as described earlier. The silica gel cartridge could be
reused by rinsing with 5 mL anhydrous methanol and reequilibrated with 5
mL buffer solution. This method was applied to the determination of HMT
in prescription compounds (51) and also in urine samples containing HMT
and a small amount of formaldehyde (50).
The application of this technique for the NMR procedure required
altering some of the parameters. The parameters were also adjusted to
allow the developed spectrophotometric method to monitor the results.

89
The citrate buffer was replaced with formate buffer to eliminate
spectrophotometric interferences caused by citrate. The formate buffer
was prepared using O .1 M formic acid and adjusting the pH to 4. 0 with
sodium hydroxide. Rinsing the column after loading was not specified by
Strom and Jun, presumably because they removed all the liquid in the
cartridge with air. Rinsing the column was desirable to be sure all
interfering substances were removed before eluting the HMT. Rinsing the
column with buffer solution, water, and methanol slowly eluted the ion
pair. However, acetonitrile apparently left the ion pair on the column
while eluting interfering substances. Elution of the ion pair with
methylene chloride:1-pentanol (95:1) was not desireable since 1-pentanol
has a boiling point of 136-138° C making it difficult to evaporate to
dryness. Methylene chloride was investigated as a means of eluting the
ion pair, but the results were not favorable. The ideal solvent for
elution should have a low boiling point and should decrease the amount of
time required for the evaporation required for the NMR determination.
Methanol appeared ideal since it was used to "clean off" the column and
has a boiling point of 65° C. However, methanol lowered the
spectrophotometric determination results proportionally to the amount of
methanol in the aliquot tested. Methanol also "cleaned" off unwanted
urine interferences which had adsorbed when this method was applied to
urine samples. Acetonitrile containing O. 01 M perchloric acid was chosen,
because it did not interfere with the spectrophotometric procedure, and
it can be easily evaporated to dryness for the NMR determination. The
perchloric acid was added to break up and elute the HMT-BCG ion pair. A
profile of this elution with 0.01 M perchloric acid in acetonitrile is

90
shown in figure 24. The eluted HMT solution was immediately made basic,
because HMT would be hydrolyzed by the perchloric acid. An aliquot of
this basic eluate was removed and evaporated with added zinc acetate as
described previously for the evaporation of water. A flow diagram of this
procedure is shown in figure 25.

riJ 2.500 u z ~ 2.000 ~ 0 rn
1.500 ~ < i,.J
< 1.000 z C, ""'"4 rn 0.500
0 .0 00 ~--~======t~ __ _l___ __ ____.l___-=::::~~--~--_J
Figure 24
0 0.5 1 1.5 2 2.5 3 3.5 ELUATE (mL)
Elution profile for break up and extraction of HMT-BCG ion pair using 0.01 M perchloric acid in acetonitrile.

Figure 25
EXTRACTION PROCEDURE
~ 900 mg silica gel
Prepare ~ add MeOH
Column ~ add buffer
Load ~ Column~ add HMT-BCG ion pair
Rinse ~ . .1 C I
aceton1tn e o umn
Elute~ HMT ~ HCI04 In acetonitrile
HMT
92
Flow diagram for HMT extraction from formaldehyde containing sample.

93
Reduction of Formaldehyde:
The removal of formaldehyde may also be accomplished by borohydride
reduction followed by evaporation. Sodium borohydride was added to the
formaldehyde sample to reduce the formaldehyde to methanol. However,
after evaporation, the resulting precipitate was difficult to dissolve in
either deuterated acetonitrile or deuterated chloroform and produced large
hydride peaks between 6 0 and 6 -1. The experimentally determined HMT
recoveries were not good, possibly because of HMT trapped in the solid
matrix. Various acids other than perchloric were added to neutralize the
borohydride, but they produced new problems which also resulted in low HMT
recoveries. It appeared that borohydride reduction of formaldehyde
created new problems which were not solved.
Urine Samples:
Urine samples are complex and contain many different interfering
components. Figure 26 shows the NMR spectrum of an evaporated HMT spiked
urine sample with no pretreatment for the removal of interferences. The
sample was not very soluble in d-acetonitrile which may explain why the
obtained spectrum was less complicated than expected. However, a large
interference "hump" can be seen at the expected location of the HMT peak.
This broadened peak was probably due to nuclear qudrupole broadening of
-NHx compounds present in urine. Because of this problem, the
interferences had to be removed.
The extraction method proved to be the best method for the removal
of these interferences. The procedure used for this extraction was the
same procedure described earlier for the extraction of HMT. The HMT-urine

94
sample had to be diluted at least 10:1, because apparently some of the
interference was also adsorbed onto the silica gel and eluted with the
0. 01 M perchloric acid in acetonitrile. However, the interference
appeared to elute at a slower rate than the HMT so that most of the
interference could be left on the column after the HMT had eluted.
Since some of the interference shown in figure 26 remained with the
HMT after the extraction procedure, a small and very broad interference
peak below the HMT peak remained as shown in figure 27. The problems
associated with this interference can be seen most clearly in the
integration. Small HMT peaks on top of this broad peak could not be
integrated in the standard manner as is demonstrated in figure 27.
Because the signal peak due to HMT was very narrow, the broad peak could
be used as the baseline, since it added only a very small amount of area.
The HMT peak was expanded in the plot and integrated as shown in figure
28. The anisole reference standard peak was also integrated in exactly
the same manner. Since the scale adjustments for expanding the plot and
the height of the plot were not changed between the integration of the two
peaks, this integration technique worked very well. This integration
technique was tested on previous spectra which did not contain
interferences and no significant differences in the results were obtained
when contrasted to the standard integration technique. The expanded
spectra containing the interference was also plotted and integrated by
hand to verify the validity of this technique.

2/28 URINE+ HHT + ANISOLe
EXP1 PULSE SEQUENCE: STD1H DATE 02-26-91 SOLVl!NT CD3CN FILE URINE
ACQUISITION DEC. & VT TN 1.250 DN 1.250 SM 4000.0 DO 406.2 AT 3.696 DM NNN NP 291568 OLP 20 PW 17.0 HOMO N P1 0 D1 1.000 PROCESSING 02 0 M•TH F TO 700 NT 128 DISPLAY CT 128 SP 372.3 PH90 20.0 WP 1991.3 BS 6• vs 1031 ss 0 SC 0 J:L N WC 230 J:N N IS 412 DP y RFL 841.1 HS NN RFP 578.9 ALOCK s TH 93
INS 1.000 DC
I I 6
I I 5
I I 2 PPM
Figure 26 NMR plot of evaporated urine sample with no pretreatment to remove interferences. \0 u,

I I I 5.0
Figure 27
I I I I
4.8 I I I I
4.6
l!/2& COLUMN URZNE i
EXP1 PULSE S!!QUENCE 8TD1H DATI! 02-eS-9i SOL.Vt!NT CD3CN FILE HMT:l
ACQUIS:tn::oN DEC. C VT TN 1..2!50 ON 1.250 SW .cooo.o DD -40&.2 AT S.1198 OM NNN NP 295&8 OLP 20 PW 17.0 HOMO N P:l 0 Di i.000 P~OCESSI:NG 02 0 MATH F
DISPLAY CT 2!56 5P :S.07-4.3 PWSO 20.0 WP 437.3 BS 6,4 vs 231-4 ss 0 SC 0 Il. N WC 230 IN N IS 18052 DP y RFL 841.1 HS NN RFP 578.9 Al.DCK s TH 53
INS :1.000 cc
I I I I
4.4 I I I I 4.2
I I I I
4.0 I I I I I I I I 3.8 PPM
I I I 3.6
NMR plot with standard integration showing broad interference remaining in sample after the extraction procedure.

I I I I I I I I 11 I I I I I I I I I I I I I,, I I I 11 I I If I I I I 11 I I 4.84 4.82 4.60 4.58 PPM
I I I I I I I I I I I I I I I I I I I I I I I I I I I I I I I I I I I I I I I I I 3.BO 3.78 S.76 3.74 PPM
121.5
Figure 28 Expanded plots of HMT and anisole peaks from figure 27 using the alternate method of signal area integration.

98
Procedures
Determination of Solid HMT:
Hexamethylenetetramine in pure solid samples is determined with the
use of a 300 MHz FT-NMR. The solid HMT determinations were performed
mainly for the optimization of instrumental and solvent parameters.
All of the following weighings are made to 0.01 mg. A stock
solution of HMT in d-acetonitrile was prepared by accurately weighing 2-
3 mg of HMT into a 5 mL volumetric flask. The solution was diluted to
volume with d-acetonitrile and weighed. Aliquots corresponding to 10-50
µg HMT were removed and weighed into 5 mm NMR tubes. A stock solution of
anisole reference standard was prepared by weighing pure anisole into a
5 mL volumetric flask containing 5 mL of weighed d-acetonitrile. The
amount of anisole in 0.6 mL samples was calculated to produce a signal
peak area equivalent to the middle of the HMT range being tested.
Aliquots containing 0.6 mL of stock anisole solution were then weighed
into the NMR tubes. The samples were run on the 300 MHz FT-NMR to develop
the optimized parameters as shown in table 10. The amount of HMT present
in each sample was calculated by either using equation 9 or a standard
calibration curve using the integration ratios of HMT and anisole.
Determination of Aqueous HMT:
Aqueous samples of HMT were determined in a similar manner as solid
samples of HMT after the removal of the solvent water. The determination
was accomplished by first evaporating the water with zinc acetate added
to prevent sublimation of HMT. The sample was then dissolved in d-
99
acetonitrile containing the reference standard anisole and transferred to
a 5 mm NMR tube to be run on the FT-NMR.
Sample aliquots of 75 or 150 µL, corresponding to a working range
of 7 to 35 µg HMT, were pipetted into 10 mL test tubes. An 11.0 µL
aliquot of 0.0089 M zinc acetate was added to each sample making sure that
the mole ratio of Zn(II):HMT is less than 2 for the dilute samples. The
samples were evaporated just to dryness in a vacuum desiccator, containing
Drierite, using water aspirator vacuum. Samples were always kept to a
maximum 200 µL since larger volumes require more than a reasonable amount
of time to evaporate. Samples can be evaporated without zinc but must be
removed from the vacuum precisely at the time when the water has been
removed. After evaporation of the water was complete, 0.6 mL deuterated
acetonitrile containing 46 µg anisole was weighed into each sample test
tube. The amount of anisole used was calculated to produce a signal peak
area equivalent to the middle of the HMT range being tested, which is
about 15 µg HMT. The samples were vigorously mixed and briefly sonicated
to dissolve the solid HMT. After the solid samples were dissolved, the
solutions were transferred to 5 mm NMR tubes and tested as described for
the solid HMT samples using the FT-NMR parameters in table 10.
Determination of HMT in the Presence of a Large Excess of Formaldehyde:
Hexamethylenetetramine in the presence of a large excess of
formaldehyde was determined after the removal of both water and
formaldehyde. The formaldehyde concentrations were in the range of Oto
0. 2 M. The removal of water and formaldehyde was achieved by either
evaporation or extraction followed by evaporation.

100
Evaporation of water and formaldehyde was accomplished in a manner
similar to that given in the spectrophotometric method and the aqueous HMT
method just described. Sample aliquots of 75 or 150 µL, corresponding to
a working range of 7 to 35 µg HMT, were pipetted into 10 mL test tubes.
An 11.0 µL aliquot of 0.0089 M zinc acetate was added to each sample to
help prevent HMT sublimation. Aliquots of 10 µL glacial acetic acid for
75 µL samples and 20 µL glacial acetic acid for 150 µL samples were added
for formaldehyde removal. The samples were evaporated just to dryness in
a vacuum desiccator containing Drierite and using water aspirator vacuum.
An 0.6 mL aliquot of deuterated acetonitrile containing 46 µg anisole was
weighed into each sample test tube. A calculated amount of anisole was
used so as to produce a signal peak having an area equivalent to the
middle of the HMT range being tested, i.e., about 15 µg HMT. The samples
were vigorously mixed and briefly sonicated to dissolve the solid HMT.
After the solid samples had dissolved, the solutions were transferred to
5 mm NMR tubes and tested as described for the solid HMT samples using the
FT-NMR parameters in table 10.
The removal of formaldehyde by extraction of HMT onto silica gel
was carried out as follows. A small extraction column was prepared by
adding 900 mg silica gel into a glass wool plugged 7.0 mm i.d. extraction
column. The column was cleaned and equilibrated by passing 5 mL anhydrous
methanol and 5 mL pH 4 formate buffer through the column. All solutions
were forced through the column by exerting gentle air pressure from the
top of the column. One mL BCG solution and one mL HMT-formaldehyde
solution containing between 45 and 150 µg HMT was added and mixed in the
column space above the silica gel to form the ion pair. The mixture was

101
then passed through the silica gel. Five mL of acetonitrile were passed
through to rinse the formaldehyde and water from the column. The HMT was
eluted with 0.01 M perchloric acid in acetonitrile and 5 mL of the eluate
was collected in a 5 mL volumetric flask. A 1 mL aliquot was removed and
weighed into a 10 mL test tube containing 10 µL of 0.0089 M zinc acetate
to prevent HMT sublimation during evaporation and 10 µL of 2.2 M sodium
hydroxide to neutralize the perchloric acid. The sample was then
sonicated for a few minutes to get the aqueous sodium hydroxide into the
acetonitrile solvent. The samples were evaporated just to dryness in a
vacuum desiccator containing Drierite and using water aspirator vacuum.
An 0.6 mL aliquot of deuterated acetonitrile containing 46 µg anisole was
weighed into each sample test tube. A calculated amount of anisole was
used so as to produce a signal peak having an area equivalent to the
middle of the HMT range being tested, i.e. about 15 µg HMT. The samples
were vigorously mixed and briefly sonicated to dissolve the solid HMT.
The solutions were then transferred to 5 mm NMR tubes and tested as
described for the solid HMT samples using the FT-NMR parameters in table
10. The column used for the extraction can be reused a number of times
as long as the column is "cleaned" with anhydrous methanol as described
in the first step of this procedure. A flow chart for this procedure is
shown in figure 29.

Figure 29
EXTRACTION PROCEDURE
~ 900 mg silica gel
Prepare ~ pass SmL MeOH
Column ~ pass SmL buffer
Load ~ add lmL BCG solution
C I add lmL HMT sample
o umn . mix and pass through
Rinse ~ 5 L . .1 C I
pass m acetomtn e o umn
Elute ~.·. pass HC104 in acetonitrile
HMT ~ collect SmL eluate
~-~ remove lmL aliquot
I HMTI neut. with NaOH ==~~ add zinc acetate
evaporate to just dry
Flow diagram for extraction procedure.
102

103
Determination of Ammonia:
The determination of ammonia was accomplished by first reacting the
ammonia with an excess amount of formaldehyde to quantitatively form HMT.
Once the reaction was complete, the formaldehyde was removed and the
remaining HMT was determined and quantitatively related to the amount of
ammonia originally present in the sample. The parameters developed for
this quantitative reaction were described previously in the
spectrophotometric section under quantitative ammonia condensation with
formaldehyde to form HMT. A formaldehyde concentration of O. 1 M was
selected for the reaction to make its removal for the HMT determination
easier.
Ammonia samples and standards were added quantitatively to
volumetric flasks so that the final diluted ammonia concentrations were
in the range of 0.5 to 8.5 mM. Formaldehyde was quantitatively added to
each flask to produce a diluted concentration of O .10 M, the solution
diluted to volume with distilled water, and mixed. The flasks were
immersed in a 60°C water bath for 4 hours to insure complete HMT
condensation. The samples were then cooled to room temperature. At this
point the samples contained HMT and a large amount of formaldehyde. The
samples were then analyzed for HMT by using either the evaporation method
or the extraction method of formaldehyde removal.
compared here.
Determination of HMT in Urine:
Both procedures are
Urine samples, spiked with HMT, were analyzed for HMT by using the
extraction method described previously for the removal of a large excess

104
of formaldehyde. Most of the urine interfering substances were removed
by this procedure.
The HMT spiked urine samples were diluted 1:10 or greater to bring
the sample HMT concentration into the HMT determination range of 25 to 150
µg/mL. The procedure described previously for the extraction separation
of HMT from formaldehyde was followed. A residual precipitate remained
in the sample after the dissolution of HMT in d-acetonitrile which
required that the samples be centrifuged and filtered before their
transfer to 5 mm NMR tubes. After each sample was run, the spectrum was
integrated by expanding the HMT and anisole reference peak in the plot
and integrating each peak separately.
Determination of HMT-Monomandelate:
Samples of HMT-monomandelate was tested by the same procedures as
described for HMT and similar results were obtained.
Results and Discussion
All the results of the various determinations shown here were run
on a Varian 300 MHz FT-NMR. The acquisition times ranged between 1 minute
for the more concentrated samples to 20 minutes for the very dilute
samples. All samples were phase adjusted electronically or manually
depending upon which produced a better phased spectra. Integrations were
plotted and electronically determined in the standard manner except for
the urine samples which were integrated as described previously. The

105
amount of HMT present in each sample was calculated using equation 9.
However, the samples which employed the extraction method for interference
removal showed some loss of HMT. The loss for each set of determinations
was proportional within each set. Therefore, calibration curves were
plotted for each set of determinations to obtain the most accurate
results. All standard calibration curves are shown with the 95%
confidence intervals plotted as dotted lines. The simulated unknowns are
plotted on the corresponding calibration curve as error bars denoting
their standard deviation. The simulated unknown results are also shown
in tables for comparison.
Determination of Aqueous HMT:
The standard calibration curve for the determination of HMT in
aqueous samples is shown in figure 30. The unknown amount of HMT in
synthetic samples was determined using the standard calibration curve and
by calculation using equation 9. The results of the unknown sample
determinations are shown in figure 30 and table 11.
The calibration curve in figure 30 shows a very good correlation for
the standards in the range between 7 and 34 µg HMT. The standards and
unknowns were determined from aliquots of either 75 or 150 µL of sample.
This difference in sample volume had no affect on the sample results. The
calibration curve results were only about 1% higher than the results
calculated from the reference standard using equation 9. This correlation
indicates that virtually all of the HMT was accounted for in the
determination and no HMT had sublimed during the evaporation procedure.

Table 11 Determination of HMT in aqueous samples.
Sample• HMT Signal ratio Amount determined (~L} ~ (HMTLanisole} StdC(~g} (%} Calcd(~g}
150 16.7 1.085 ±0.004 16.9 102 16.8
75 15.8 1.011 ±0.005 15.8 100 15.7
75 27.6 1.748 ±0.033 27.2 99 27.1
8 Sample = sample aliquot evaporated bR.S.D. = relative standard deviation cstd = determination by standard calibration curve dCalc = determination by reference standard calculation
106
R.S.D.b (%}
101 0.326
99 0.490
98 1.86

2.500 ~----------------------
8 2.000 ~ ~ ,-J
~ 1.500 C, """'4 rl'.l
~ 8 1.000 rl'.l """'4 z < -E--4 0.500 )1 =c:
Regression Output: Constant -0.0119 Std Err of Y Est 0.01 72 R Squared 1.00 No. of Observations 8 Degrees of Freedom 6 Slope 0.0648 Std Err of Coef 0.000591
0 .0 0 0 '-"'------'--------'--------'--------'----------'------'---____J
0.00 5.00 10.00 15.00 20.00 25.00 30.00 35.00
µg HMT
Figure 30 Calibration curve for the determination of pure aqueous HMT and synthetic unknown samples. I-' 0 .......

108
Determination of HMT in the Presence of a Large Excess of Formaldehyde:
The determination of HMT in the presence of a large amount of
formaldehyde was accomplished by removing both the formaldehyde and the
solvent. The formaldehyde concentrations studied were in the range of
0. 03 to 0 .16 M. The formaldehyde interference was removed by either
evaporation or by HMT ion pair extraction from the sample. Both methods
were studied here for comparison. The standard calibration curves are
shown in figures 31 and 32. The synthetic unknown sample results are
shown in table 12 and figures 31 and 32.
The evaporation procedure used was identical to the aqueous HMT
sample procedure except for the addition of acetic acid in the case of
evaporation of formaldehyde. The calibration curve used for this
determination was the same calibration curve used for the aqueous HMT
samples. The evaporation results for these formaldehyde containing
samples were generally the same as those for samples without formaldehyde.
There was also no significant difference between the results using the
calibration curve or the reference standard results as calculated from
equation 9.
The ion pair extraction procedure required the use of a calibration
curve since the reference standard calculated results were well below
100%. This difference was probably due to the sublimation loss during the
evaporation step. Most of the salts present in the extraction eluate were
not very soluble in acetonitrile. As the acetonitrile evaporated, these
salts began to precipitate out of solution and dry on the sides of the
test tube. If HMT was trapped in the formation of this precipitate, there
was a chance for sublimation to occur. A small amount of water was added

109
to the samples to keep the salts in solution but less than 100% results
were still obtained. However, the losses within each batch of evaporated
samples were proportional so that a standard calibration curve correcting
for this problem could be used.
Table 12 Determination of HMT in the presence of a large amount of formaldehyde by evaporation and extraction-evaporation methods.
Formaldehyde Sample8 HMT Signal ratio Stdb det. Calcc det. cone. (M} (l!L} 1M&l (HMTLanisole} (l!&} (%} (l!&} (%} R.S.D.d
Formaldehyde removal by evaporation
0.0331 150 16.3 1.015 ±0.022 15.8 97 15.7 97 2.16
0.164 75 25.0 1. 653 ±0.006 25.7 103 25.6 102 0.385
0.0943 75 18.8 1.197 ±0.012 18.7 99 18.5 98 1.00
Formaldehyde removal by extraction
0.0331 1020 11.1 0.479 ±0.015 10.9 98 7.42 67 3.20
0.164 1010 16.9 0.761 ±0.015 17.2 102 11.8 70 2.02
0.0943 1010 25.3 1.112 ±0.015 25.2 99 17.3 68 1. 37
asample = sample aliquot evaporated bStd = determination by standard calibration curve ccalc = determination by reference standard calculation bR.S.D. = relative standard deviation

2.500 ,---------------------------,
S 2.000 ~ ~
i-J < z C!:> """" rll
~
1.500
i-J 1.000 0 rll
"""" z < -~ 0.500 ~ ::c:
Regression Output: Constant -0.0119 Std Err of Y Est 0.0172 R Squared 1.00 No. of Observations 8 Degrees of Freedom 6 Slope 0.0648 Std Err of Coef 0.000591
0.000 ~--~--~--~---~--~--~--~
Figure 31
0.00 5.00 10.00 15.00 20.00 25.00 30.00 35.00 µg HMT
Calibration curve for the determination of HMT samples and formaldehyde-HMT synthetic unknown samples after evaporation removal of formaldehyde. t-'
t-' 0

1.600
1.400 0 1-4
~ 1.200 ~
~ 1.000 < z
C!:> 1-4 0.800 rll
~ ~ 0 0.600 rll 1-4 z < 0.400 -
Regression Output: Constant -0.0105 Std Err of Y Est 0.0153
0.998 R Squared E-4 No. of Observations 5
::s 0.200 =
Degrees of Freedom 3 Slope 0.0449 Std Err of Coef 0.00103
0.000 0.00 5.00 10.00 15.00 20.00 25.00 30.00 35.00
Figure 32
µg HMT
Calibration curve for the determination of HMT samples and formaldehyde-HMT synthetic unknown samples after HMT-BCG ion pair extraction.

112
Determination of Ammonia:
The determination of ammonia was accomplished by its quantitative
reaction in a large excess of formaldehyde to form HMT. The HMT was then
determined in a manner similar to the determination of HMT in the presence
of a large amount of formaldehyde. The interfering formaldehyde was
evaporated along with the water or removed by extracting the HMT from the
aqueous formaldehyde sample. Both methods were investigated and the
results are shown for comparison. The standard calibration curves are
shown in figures 33 and 34. The results for synthetic unknown samples are
shown in table 13 and figures 33 and 34.
All of the standard and synthetic unknown ammonia reactions were
carried out in a formaldehyde concentration of O .1 M. The ammonia
concentration in the samples ranged from 15 to 120 ppm. These were the
same samples tested by the spectrophotometric procedure. Sample aliquots
were adjusted for use within the desired determination range. The
evaporation method required 75 and 150 µL aliquots and the extraction
method required 500 or 1000 µL aliquots of sample.
The evaporation procedure used was exactly the same as that used for
the determination of HMT in the presence of a large amount of
formaldehyde. The samples could be determined directly using equation 9
and the reference standard to calculate the amount of HMT present.
However, the results were less accurate than those obtained using the
standard calibration curve. Slight losses could have resulted from
hydrolysis, as the water evaporates and the acetic acid is concentrated,
or by sublimation when the sample reaches dryness. The losses were

113
proportional and the standard calibration curve was used to make the
corrections.
The extraction procedure was also exactly the same as that used for
the determination of HMT in the presence of a large amount of
formaldehyde. These results also required the use of a standard
calibration curve since the reference standard calculated results were
below 100%. At least part of this loss appeared to be due to sublimation.
Table 13 Determination of ammonia in synthetic unknown samples by the evaporation and extraction-evaporation methods.
Sample8 NH3 Signal ratio Stdb det Calcc det (~L} i.w. (HMTLanisole) (~g) (%) (~g) (%) R.S.D.d
Formaldehyde removal by evaporation
150 5.00 0.899 ±0.053 5.05 101 4.75 95 5.91
75 8.06 1. 531 ±0.053 8.20 102 8.08 100 3.47
Formaldehyde removal by extraction
996 6.64 0.576 ±0.033 6.55 99 4.79 72 5.79
995 10.7 1. 020 ±0. 033 10.9 102 8.53 80 3.27
asample = sample aliquot evaporated bStd = determination by standard calibration curve ccalc = determination by reference standard calibration dR.S.D. - relative standard deviation

2.000 r--------------------------,
1.000
0.500
Regression Output: Constant Std Err of Y Est R Squared No. of Observations Degrees of Freedom Slope
- 0.114 0.0532
0.997 4 2
0.201 Std Err of Coef 0.00797
0.000 ~~--~----~---~----~---~
Figure 33
0.00 2.00 4.00 6.00 8.00 10.00 µg NH 3
Calibration curve for the determination of ammonia samples and synthetic unknown samples after evaporation removal of formaldehyde.

1.400 -------------------------,
1.200
1.000 ~ < ~ 0.800 ..... rll
~ 0.600 0 rll ..... ~ 0.400 -E-4
~ 0.200
Regression Output: Constant - 0.0862 Std Err of Y Est 0.0334 R Squared 0.997 No. of Observations 3 Degrees of Freedom 1
0.101 0.00520
Slope Std Err of Coef
0 .0 0 0 1__,L_ _ _____L_ ___ -----'-------'-------'----___,__-----'----
Figure 34
0.00 2.00 4.00 6.00 8.00 10.00 12.00 14.00 µg NH 3
Calibration curve for the determination of ammonia samples and synthetic unknown samples after HMT-BCG ion pair extraction.

116
Determination of HMT in Urine:
The determination of HMT in urine was accomplished using the
extraction-evaporation technique for the removal of interfering
substances. The standard addition curve is shown in figure 35. These
results show that the method of additions can be used for the
determination of an unknown urine sample and that the results are linear
in the range of 5 to 30 µg HMT.
If the urine sample was unknown and the first four determinations
shown in figure 35 were standard additions of 0, 5.00, 11.2, and 18.6 µg
HMT, the extrapolated value for the unknown would be 5.01 µg HMT. This
result would be 101% of the actual 4.98 µg HMT present.
Since the extraction-evaporation results tended to produce results
that were less than 100 percent, when calculated using the reference
standard and equation 9, the method of standard additions was considered
to be most accurate. The results for this determination calculated from
the reference standard were between 87 and 93 percent. In contrast to the
previous extraction-evaporation determinations, these results were
consistent at around 90 percent. The loss was probably not due to
evaporation because evaporation losses tend to produce results
proportional to the amount of HMT present. A standard HMT sample was not
determined during the procedure verifying the amount of anisole reference
standard present. The exact amount of reference standard is critical for
the calculation results. The standard additions method requires only that
the amount of anisole reference standard present be constant in each
sample.

2.500 ~-------------------------,,--,
8 2.000
~ ~
~ 1.500 t!)
"""" rll
~
c5 1.000 rll
"""" z < -E-4 0.500 ~ =
Regression Output: Constant -0.0307 Std Err of Y Est 0.0 3 02 R Squared 0.999 No. of Observations 6 Degrees of Freedom 4 Slope 0.07 33 Std Err of Coef 0.00129
0. 0 0 0 '---"-----'------L---------'----------'----L---------'------'
0.00 5.00 10.00 15.00 20.00 25.00 30.00 35.00 µg HMT
Figure 35 Standard additions curve for the determination of HMT in urine samples.

ION EXCHANGE DETERMINATION OF AMMONIA
Introduction
Ion exchange chromatography is based on the exchange of ions of like
sign between a solution and the ions of a solid-insoluble resin in contact
with it. The solid resin contains a number of positively or negatively
charged ionic groups that are fixed in a three-dimensional cross-linked
polymeric hydrocarbon network. These charged ionic groups are surrounded
by oppositely charged ions that are free to move inside the resin but
cannot leave the resin particle unless replaced by another ion of equal
charge, since electrical neutrality must be maintained. The inside of the
resin particle is very similar to a concentrated solution of a strong acid
or base except that the negative or positive charges are held firmly in
place instead of being free to move as they are in solution.
When an ion exchange resin is placed in solution, ions may enter the
solid particle and may be exchanged for ions of like charge. Ions of the
same charge as the fixed ionic groups are excluded from the resin
particle. Thus, a cation resin charged with hydrogen ions is in contact
with a solution of sodium chloride, ion exchange occurs. The equilibrium
established can be represented by equation 10
(10)
118

119
where R: represents the fixed negative sites on the resin. The exchange
is a reversible reaction that attains equilibriwn and follows the law of
mass action to a first approximation. Consequently, if a solution
containing a small amount of sodiwn ion is passed through a large amount
of cation resin charged with hydrogen ions, the sodiwn will be
quantitatively removed from the solution and replaced with an equivalent
amount of hydrogen ions. In a like manner, if a concentrated acid is
passed through a cation resin charged with sodium ions, the sodiwn ions
will be completely removed and replaced with hydrogen ions. This
regeneration of the resin can be repeated many times without apparent
damage to the resin.
Ion exchange resins show a degree of selectivity in respect to
different ions. They have been found to follow some general rules which
are summarized as follows: The affinity of various ions to the same resin
increases with the ionic charge of the ion. Under the same conditions,
polyvalent ions are attached to a resin more strongly than monovalent
ions. For ions of the same charge, affinities are inversely proportional
to the radius of the hydrated ions. The extent of resin cross linkage
affects selectivity as a function of ion size. Greater amounts of cross
linking, result in pore sizes in the resin which in turn inhibit the
movement of water and ions. A highly cross-linked resin can exclude large
organic ions.
The measure of strength with which an ion is held by a resin is
expressed by the distribution coefficient (D) shown in equation 11.
D -amount of component in exchanger phase at equilibrium
amount of component in liquid phase at equilibrium (11)

120
If the equation is related to unit weight, the results are expressed as
the weight distribution coefficient (D9
) defined according to equation 12.
cone. of ion in resin D g = _c_o_n_c_. -o~f_i_o_n_i_n_s_o~l_u_t_i_o_n_ X
mL of solution grams of dry resin (12)
The larger the distribution coefficient, the more strongly the ion is held
by the resin.
The use of ion exchange for the determination of ammonia has been
reported by other researchers. Bouyoucos (71) separated and determined
ammonia directly by ion chromatography. Samples containing 300-600 ppm
ammonia and various amounts of methylamines were injected (50 µL) onto a
strong acid exchange resin in 0.01 M HCl. The ions were separated by the
exchange column, passed through a stripper column, and detected by a
conductivity measurement.
Jaworski (72) separated and determined ammonia directly by ion
exchange chromatography. Samples containing O .1-1. 0 mg ammonia and
ethylene diamine-urea reaction products were injected onto a strong acid
exchange resin in 2 M HCl. The ions were separated by the exchange resin
and detected directly by a thermal detector.
Moreno et al. (73) determined ammonia indirectly by forming
indophenol with the ammonia in the solution. This chromophore was
concentrated by ion exchange and determined spectrophotometrically. The
procedure was as follows: Samples of 2-200 mL containing 10-50 ppb
ammonia were reacted for 40 minutes to form indophenol. The samples were
then passed through an Amberlite XAD-7 ion exchange resin, eluted with 2

121
mL acetone, evaporated to dryness, the residue redissolved in 2 or 10 mL
distilled water, and the absorbance measured at 640 nm.
Statement of Problem and Purpose of Research:
The goal of this study was to develop an ion exchange method for the
determination of ammonia in solution with the use of atomic absorption
(AA) determination of the exchanged ion. Since ammonia is a difficult ion
to determine at low concentrations, it is convenient to quantitatively
exchange it for an ion which is easier to determine. Since AA is a
relatively sensitive method of determination, the exchanged ion can
usually be determined by this method.
Ammonia is volatile and commonly distilled from a sample and trapped
in an acid, such as boric acid or sulfuric acid. The proposed method is
based on the quantitative ion exchange of ammonium in boric acid for
lithium by means of a strong acid cation exchange resin. The exchanged
lithium is then quantitatively determined by AA.
The development of this procedure required the investigation of
several test parameters. The resin parameters that were investigated
include choice of resin material, amount of resin required, and optimum
solvent system. The AA parameters were adjusted, using a lithium hollow
cathode lamp, with both a graphite furnace and an acetylene-air flame for
the atomization of the sample. The graphite furnace AA (GFAA)
determinations required optimizing the following parameters of both time
and temperature for solvent evaporation, pretreatment removal of
interfering elements, and atomization temperature. The flame AA (FAA)
determinations required adjusting the following parameters of gas

122
mixtures, sample aspiration rate, and burner head position. Once the
optimum conditions were established, small amounts of ammonia were
determined in boric acid as ammonium ions.
Experimental
Instrumentation:
All atomic absorption measurements were obtained using a Perkin
Elmer model 5000 AA equipped with a Perkin Elmer Model 500 Automatic
Burner Control and a Perkin Elmer Model 400 Graphite Furnace Control. The
analytical wavelength used for lithium was 670.8 nm. The slit width for
the GFAA determinations was 1.4 nm, low, and for the FAA determinations
the slit width was 0.4 nm, high. Ten microliters of sample solution were
injected by Eppendorf pipette into pyrolytic coated graphite furnace tubes
for GFAA.
Reagents:
All chemicals utilized were analytical or primary standard grade.
The strong acid cation exchange resin was Dowex SOW-XS 100-200 mesh resin
purchased from Bio-Rad. All acetone used was distilled before its use.
Stock ammonium solutions were prepared from ACS grade ammonium chloride
which had been dried at 110° C for 2 hours.

123
Development of Method
The development of this method for the determination of ammonium ion
required optimization of resin, solvent, and M parameters. An ammonium
sample in O. 1 M boric acid was passed through an ion exchange column
charged with lithium. The eluate of exchanged lithium was then
quantitatively determined by atomic absorption.
Optimization of Exchange Parameters:
The development of the ion exchange method for the determination of
ammonia required optimization of several parameters: (i) choice of resin
type, (ii) amount of resin required, (iii) and nature of the solvent.
The first tests with resins employed 3 cm of resin in an 8 mm i.d. glass
tube. The resin was then charged with lithium. In this lithium charging
procedure, the resin was first charged with H+ by passing a large excess
of 3M HCl through the column. Excess HCl was removed by rinsing the
column with distilled water until the eluate did not test acidic using
litmus paper. Then, 0.2 M LiOH was passed through the column to exchange
Li+ for H+. The completion of this charge was also monitored using litmus
paper by testing the eluate for basic solution. Solvent containing 0.1
M boric acid was then passed through the column until the excess lithium
was rinsed from the column. Ideally there would be no lithium elution
from the resin due to the solvent at this point.
Of the available strongly acidic cation exchange resins tested,
Dowex SOW-XS produced the best results. All of the resins investigated
slowly exchanged lithium via solvent exchange. The boric acid

124
concentration was reduced but no decrease in solvent exchange was
observed.
According to Marhol (74) selectivity generally decreases in the
series (Dowex SOW-XS):
solutions. This series showed that W in the solvent should readily
exchange Li+. The pH of the solvent was raised to 7.00 with tetrabutyl
ammonium hydroxide in an attempt to reduce the solvent-Li+ exchange.
However, the amount of solvent-Li+ exchange increased. This increase may
have been the result of sodium impurity from tetrabutylammonium hydroxide
preparation or of the tetrabutylammonium ion exchanging with lithium.
At this point the exchange required large amounts of solvent. A
decrease in the column size to a 6 mm i.d. pasteur pipette and a reduction
in the amount of res in to about O. 25 g, or 2 cm height, lowered the
exchange volume to about 1 mL for 0.25 mL of 0.01 M ammonium chloride in
0.1 M boric acid. Changing the resin particle size from 200-400 mesh to
100-200 mesh increased the solvent flow through the column. Resin of 50-
100 mesh was found to be too large because the solvent passed through the
column too quickly, requiring very quick manipulation of the collection
glassware. The change in resin size did not have an effect on Li+ elution.
Resin of 100-200 mesh was the size of choice.
The nature of the solvent was investigated with the purpose of
reducing the amount of solvent exchange in the column. Since the affinity
of the alkali-metal elements increases with decreasing radius of its
hydrated ion, the hydrated ion radius can be decreased by changing solvent
composition (75). Various solvent mixtures with water were tested in the
range of 20-90 percent methanol or acetone. Various amounts of methanol

125
had little affect on solvent exchange, but acetone greatly reduced the
solvent exchange as shown in figure 36. To demonstrate the acetone-water
results, weight distribution coefficients (D9
) for H+-Li+ were determined
according to equation 12. The weight distribution coefficient was
determined by equilibrating 250 mL of a O. 1 M boric acid solution
containing 5 meq of Li+ with 2. 500 g equivalent of dry resin (76). A
mechanical shaker was used. The dry resin weight was determined by first
vacuum pumping a weighed sample for 24 hours and then drying it in an
Abderhalden at 65° Cover phosphorous pentoxide for 24 hours. The Dowex
SOW-X8 100-200 mesh resin in the proton form contained 52. 86 percent
water. Acetone-water solvent mixtures of 0, 10, 30, 50, and 70 percent
acetone with 0.1 M boric acid were investigated. The Li+ eluent
concentrations were determined by AA. The concentration of Li+ on the
resin was obtained by subtracting the Li+ eluate concentration from the
initial Li+ concentration. The results are shown in figure 37. They fit
a third order regression curve very well. Figure 37 shows that there is
a dramatic increase in the resin affinity for Li+ as the percentage of
acetone is increased. An acetone-water mixture of 50 percent was chosen
as the mixture of choice to decrease solvent Li+ exchange.
After charging the column with lithium, a determination of the point
at which the solvent exchange equilibrium was required. Solvent was
passed through the column with the collection of 1 mL samples every 2 mL.
The collections were tested for lithium. The "baseline" equilibrium
appeared to be established after about 13 mL. All subsequent experiments
were performed after the passage of about 15 mL of solvent.

J:IJ (.) z ~ ~
i -<
Figure 36
-QI)
Q -
Figure 37
1.200
1.000
0.800
0.600
0.400
0.200
2500
2000
1500
1000
500
126
0% 10% 20% 30% 40% 50% 60% 70% 80% ACETONE-WATER SOLVENT
Solvent-Li+ exchange at various acetone-water mixtures.
0% 10% 20% 30% 40% 50% 60% 70% 80% 90% 100% ACETONE-WATER SOLVENT
Determination of weight distribution coefficient (D9
) at various acetone-water mixtures.

127
Optimization of Atomic Absorption Parameters:
To obtain optimum conditions for the graphite furnace
determinations, the following parameters were studied with each solvent
system: (i) time and temperature for solvent evaporation, (ii)
pretreatment removal of interfering elements, and (iii) atomization
temperature. The graphite furnace control box used was programmable and
each step in the procedure was adjusted. The solvent evaporation step
was adjusted by temperature and time to evaporate the sample droplet
slowly and constantly without spattering. The second step of pretreatment
was adjusted by temperature and time to remove as much of the interfering
sample matrix as possible without atomizing any Li+. The third step of
atomization was adjusted to the lowest atomization temperature that
produced a maximum signal. A fourth step was used after atomization with
a high temperature and full gas flow through the graphite tube to remove
any remaining sample and prevent carryover problems.
The parameters used for the determinations are shown in table 14.
High concentrations of acetone in the solvent caused large errors in
delivering 10-20 µL samples into the graphite furnace. The acetone did
not adhere to the plastic tip very well and a portion would leak out
before transfer in the furnace tube. The correlation coefficient for a
50 percent acetone-water solvent sample run 35 consecutive times was only
0.701. The correlation coefficient for an aqueous solvent sample run 18
consecutive times was 0.977. Therefore, lower acetone concentrations were
highly desireable for reproducible graphite furnace determinations.
However, higher water concentrations in the solvent exchanged more Li+ from

128
the resin resulting in high blank signal. Despite these problems,
acceptable results were obtained when great care was used.
Table 14
Step
Evaporation
Pretreatment
Atomization
Cleaning
Evaporation
Pretreatment
Atomization
Cleaning
Optimized graphite furnace parameters programmed into the furnace controller.
Temp Ramp Hold inner gas flow oc sec sec mLLmin
Aqueous Samples
110 2 30 310
900 3 20 310
2600 1 5 25
2700 1 3 310
50% Acetone-Water Samples
80 5 20 310
1300 3 20 310
2600 1 5 60
2700 1 3 310
The problems of sample delivery were eliminated by using the flame
for atomization. The flame was set for the acetylene-air gas mixture
which required adjustment of the following parameters for each solvent
system: (i) gas mixture, (ii) aspiration rate, and (iii) burner head
position. When analyzing samples in organic solvents, adjustments had to
be made in the acetylene-air flow mixture to compensate for the
flammability of the solvent. The fuel flow was reduced until maximum

129
sensitivity was obtained. The aspiration rate was adjusted to the point
where the maximwn absorbance was obtained. However, the aspiration rate
had to be decreased to 2-4 mL/min when small volwne samples were tested.
This lowered the sensitivity. The lower aspiration rate was required in
order to obtain the Li+ atomization equilibriwn in the flame before the
whole sample had been aspirated. The burner head was adjusted for maximwn
sensitivity while aspirating a standard solution of Li+. The optimum
position varied according to the solvent composition being aspirated and
adjustments to the burner head position were made in every direction. The
standard AA parameters were used; high 0.4 nm slit width, continuum source
background correction, and 3 times 3 sec signal averaging.
Procedure
The 6 mm i.d. columns charged with 0.25 g Dowex 50W-X8 100-200 mesh
resin were cleaned and regenerated by passing 3M HCl through the column.
The excess HCl was removed by rinsing the column with distilled water
until the eluate did not test acidic with litmus paper. Then, 0.2 M LiOH
was passed through the column to exchange Li+ for H+. The completion of
the charge was monitored using litmus paper to test the eluate for a basic
solution. Fifteen mL of 0.1 M boric acid in 50 percent acetone-water
solvent were then passed through the column to remove the excess lithium
from the colwnn.
All of the samples were analyzed for lithiwn by acetylene-air flame
atomic absorption. Lithiwn standards were tested continuously to correct

130
for any drift in the determinations. Graphite furnace M also could have
been used for the lithium determinations by using the parameters listed
in table 14. However, the samples containing 50 percent acetone were more
accurately determined by the FM technique.
Determination of Ammonia by Quantitative Lithium Ion Exchange:
Aqueous ammonia samples in O .1 M boric acid were determined by
pipetting an aliquot onto a small ion exchange column charged with lithium
and measuring the exchanged lithium collected in the eluate.
After the exchange column had passed 15 mL of solvent, 1 to 2 mL of
eluate was collected for a blank determination. Aqueous samples were
prepared from a stock solution to produce samples containing between 0.19
to 3. 2 mM NH4Cl in O. 1 M H3B03 • A sample aliquot of 200 µL was added to the
column followed by the solvent. The eluate was collected in a 2 mL
volumetric flask and another sample of the eluate was collected for the
blank determination. A second 200 µL sample was loaded onto the column
and 2 mL of the eluate was collected. A third eluate blank was collected
and a third sample was added and collected from the column. The 3 samples
and blanks were analyzed for lithium by FM with parallel lithium
standards. The sample absorbances were subtracted from the blank
absorbances and the amount of lithium present in the samples was
calculated from the standards. The column was regenerated and used again.
Determination of Ammonia by Ammonium-Lithium Ion Exchange Equilibrium:
A more sensitive method of determination was attained by
continuously passing an ammonium ion sample through the column to exchange

131
the lithium at a constant rate. The amount of lithium exchanged was
equivalent to the concentration of ammonium ion in the sample.
Aqueous ammonium samples were prepared from a stock solution to
produce samples containing between 0.038 to 0.31 mM NH4Cl in 0.1 M H3B03 •
After rinsing the column of excess lithium with 15 mL solvent, 1 mL of the
ammonium ion sample was passed through the column and discarded. The
ammonium ion sample exchange was continued and 3 collections of about 2
mL eluate were taken for the determination of lithium.
Results and Discussion
The calibration curves are shown with the 95% confidence intervals
plotted as dotted lines. The actual points are also plotted as error bars
of their standard deviations.
Determination of Ammonia by Quantitative Lithium Ion Exchange:
Aqueous samples of ammonium ions were determined and are shown in
figure 38. The results were very linear in the determination range
between 0.13 and 2.2 ppm Li+ producing a linear correlation coefficient r 2
of 0.999. However, results corrected for the blank are about 90 percent
of the expected exchange. Standardized LiCl samples were passed through
the column in the same manner as the NH4Cl samples and similar results were
obtained. If the exchange resin was not 100 percent charged with lithium,
an equilibrium could have occurred as the sample passed through the
column. Ten percent of the ammonium ions or lithium ions may not have

132
exchanged in the column or may have exchanged with H+ present and therefore
were undetected in the eluate.

2.50 ,-._
e 2.25 c.. c.. --~ 2.00 C, z 1.7 5 < = 1.50 ~ ~
1.25 + .""" ~
Q 1.00 ~ z 0.75 1--4
::s ~ 0.50 ~ ~
0.25 ~ Q
0.00
Regression Output: Constant -0.0502 Std Err of Y Est 0.0291 R Squared No. of Observations Degrees of Freedom
0.999 18 16
Slope 0.924 Std Err of Coef 0.00863
0.00 0.25 0.50 0.75 1.00 1.25 1.50 1.75 2.00 2.25 2.50
Figure 38
EXPECTED Li+ EXCHANGE (ppm)
Calibration curve for the determination of ammonium ion samples in 0.1 M boric acid by quantitative lithium ion exchange.

134
Determination of Ammonia by Ammonium-Lithium Ion Exchange Equilibrium:
Aqueous samples of ammonium ions were determined and are shown in
figure 39. The results produced a linear correlation coefficient of 0.998
in the determination range between 0.27 and 2.7 ppm Li+. The results shown
in figure 39 are not corrected for the blank. An exchange equilibrium
resulted when each sample passed through the exchange column. The use of
standards eliminates the need for blank determinations. When the blanks
were subtracted, the results were about 85 percent of the expected
exchange results. The blank subtracted results were also more erratic due
to the blank determination results for each sample. Standardized LiCl
samples were passed through the column in the same manner as the NH4Cl
samples and similar results were obtained. These results suggest that
the column may not have been fully loaded with lithium.

3.00 ,.-. e 2.15 C,,t C,,t
2.50 '-'
ll,;j c, 2.2 5 z < 2.00 = ~ 1.75 ll,;j
1.50 + """ ~ 1.25 Q ll,;j 1.00 z ~
0.75 ~ ~ ll,;j 0.50 ~ ll,;j 0.25 Q
0.00
Regression Output: Constant Std Err of Y Est R Squared
0.356 0.02 77
0.998 18 16
0.938 0.00997
No. of Observations Degrees of Freedom Slope Std Err of Coef
0.00 0.25 0.50 0. 75 1.00 1.25 1.50 1. 75 2.00 2.25 2.50
EXPECTED Li+ EXCHANGE (ppm)
Figure 39 Calibration curve for the determination of ammonium ion samples in 0.1 M boric acid by quantitative lithium ion exchange equilibrium. I-'
w u,

SUMMARY AND SUGGESTIONS FOR FUTURE WORK
In this study, methods were developed for the quantitative
determination of hexamethylenetetramine (HMT) and ammonia present in
various matrices. In particular, the determination of HMT in the presence
of a large amount of formaldehyde was investigated. Techniques were
developed to eliminate or reduce the interferences present and allow the
quantitative determination of HMT.
A spectrophotometric method was presented for the quantitative
determination of hexamethylenetetramine and ammonia present in various
matrices. Hexamethylenetetramine was determined indirectly, after the
separation from interferences, by its quantitative hydrolysis with
perchloric acid and subsequent determination of the released formaldehyde.
The formaldehyde was quantitatively oxidized by an excess of hydrous
silver oxide to form silver metal. Then silver metal was reoxidized with
added ferric ion and the resulting ferrous ions were quantitatively
complexed with Ferrozine. The iron(II)-Ferrozine complex absorbance was
measured and related to the amount of HMT originally present in the
sample.
Hexamethylenetetramine was determined by this spectrophotometric
method in the range of 3. 2 x 10⁻⁷ to 3. 2 x 10-s M. Pure aqueous samples
were determined, producing an apparent molar absorptivity of 314,000 L/(cm
mol). Hexamethylenetetramine samples containing up to 0.2 M formaldehyde
136

137
were determined after first removing or decreasing the large formaldehyde
interference. The formaldehyde was removed by either evaporation or
borohydride reduction. Hexamethylenetetramine was also determined in
urine. Interferences in urine were removed by oxidation with silver(!)
in basic conditions leaving HMT unreacted. Hexamethylenetetramine was
quantitatively determined in the supernatant after removal of the
resulting precipitate.
Future work could include investigation of established indirect HMT
determination methods coupled with the developed techniques for the
removal of formaldehyde interference. These other indirect methods can
tolerate only small amounts of formaldehyde present in the samples.
A NMR technique also was developed for the quantitative
determination of hexamethylenetetramine and ammonia present in various
matrices. Hexamethylenetetramine was quantitatively determined directly
using its 12 equivalent proton resonance signal. A 300 MHz FT-NMR
instrument was used with d-acetonitrile as the solvent and anisole as the
reference standard.
Hexamethylenetetramine was determined in the range of 3 to 35 µgin
0. 6 mL of solvent. All samples were evaporated to dryness for the removal
of the interfering solvent and redissolved in d-acetonitrile containing
anisole. Hexamethylenetetramine in samples containing up to 0. 2 M
formaldehyde was determined after first removing or decreasing the large
formaldehyde interference. The formaldehyde was removed either by the
evaporation procedure or by silica gel extraction of an HMT:bromocresol
green ion pair and subsequent elution in a more volatile acetonitrile
eluant. Hexamethylenetetramine was also determined in the presence of

138
urine. The urine interferences were decreased by using the ion pair
extraction technique.
Future work could include investigation of the extraction technique
using d-acetonitrile to elute and free the extracted HMT:BCG ion pair from
the column. This eluate could then be scanned on the NMR eliminating the
need for evaporation and reducing sample total analysis time to approx.
15 minutes.
An ion exchange technique for the determination of ammonia trapped
in boric acid was investigated. Dowex SOW-XS strong acid cation exchange
resin charged with lithium was used for the exchange. Atomic absorption
was used for the determination of the exchanged lithium.
Exchanged lithium ions were determined in the range of 0.15 to 2.25
ppm. Lithium analyzed in 2 mL eluate samples corresponded to 38 to 640
µmol of ammonium ions. The exchange was made more sensitive by
continuously passing the sample through the column to form an exchange
equilibrium rather than using the singular sample elution. The lithium
analyzed eluate samples corresponded to 0.038 to 0.31 mM ammonium ions.

139
REFERENCES
1. Butlerow, A. Liebig. Ann. Chem. 1859, 111, 249.
2. ibid., 1860, 115, 322.
3. Hofmann A. W. Ber. dtsh. chem. Ges. 1869, 2153.
4. Butlerow, A. Liebig. Ann. Chem. 1860, 115, 322.
5. Van't Hoff, J. Ansichten Ober organische Chemie, I; Braunschweig, 1881; p 121.
6. Delepine, M. C.R. hebd. seances Acad. Sci. 1893, 120, 197.
7. Losekann, G. Chem. Zeit. 1890, 14, 1409.
8. Duden, P.; Scharff, M. Liebig. Ann. Chem. 1895, 288, 218.
9. Guareschi, J. Einfuhrung in das Studium Alkaloide; H. Kunz-Krausse: Berlin, 1897; p 620.
10. Cohn, G. J. prakt. Chem. 1897, 56, 345.
11. Dominikiewicz, M. Arch. Chem. Farm. 1939, 4, 1.
12. Dickinson, R. G.; Raymond, A. L. J. Am. Chem. Soc. 1923, 45, 22.
13. Gonell, H. W.; Mark, H. Z. physik. Chem. 1923, 107, 181.
14. Wyckoff, R. W. G.; Corey, R. B. Z. Krist. 1934, 89, 462.
15. Hampson, G. C.; Stosick, A. J. J. Am. Chem. Soc. 1938, 60, 1814.
16. Walker, J. F. Formaldehyde, 3rd ed.; Reinhold: New York, 1964; p 514.
17. Kirk-Othmer Encyclopedia of Chemical Technology, 2nd ed.; Standed, A., Ed.; Interscience: New York, 1966; p 96.
18. Walker, J. F. Formaldehyde, 3rd ed.; Reinhold: New York, 1964; p 522.
19. Cooney, A. P.; Crampton, M. R.; Golding, P. J. Chem. Soc., Perkin Trans. 2 1986, 6, 835.

140
20. Duden, P.; Scharff, M. Liebig. Ann. Chem. 1895, 288, 218.
21. Baur, E; Ruetschi, W. Helv. chim. Acta 1941, 24, 754.
22. Boyd, M. L.; Winkler, C. A. Can. J. Research 1947, 25B, 387.
23. Richmond, H. H.; Myers, G. S.; Wright, G. F. J. Am. chem. Soc. 1948, 70, 3659.
24. Bose, S. J. Indian chem. Soc. 1957, 34, 663.
25. Kawasaki, A; Ogata, Y Hem. Fae. Eng., Nagoya Univ. 1967, 19, 1.
26. Nielsen, A. T.; Moore, D. W.; Ogan, M. D.; Atkins, R. L. J. Org. Chem. 1979, 44, 1678.
27. Duden,P.; Scharff, M. Liebig. Ann. Chem. 1895, 288, 218.
28. Philippi, E.; Lobering, J. Biochem. Z. 1935, 277, 365.
29. Slowick, E.; Kelley, R. J. Am. Pharm. Assoc. 1942, 31, 15.
30. Tada, H.J. Am. Chem. Soc. 1960, 82, 255.
31. Smolin, E. M.; Rapoport, L. s-Triazines and Derivatives; Reinhold: New York, 1964; p 552.
32. Epstein, S.; Winkler, C. Can. J. Chem. 1952, 30, 734.
33. Nicolaier, A Zbl. Med.Wiss. 1894, 32, 897.
34. Musher, D. M.; Griffith, D. P. Antimicrob. Agents Chemother. 1974, 6, 708.
35. Stankovic, V. Chem. Zvesti 1963, 17, 274.
36. Pawelczyk, E.; Marciniec, B. Acta Pol. Pharm. 1978, 35, 643.
37. Tokes, B.; Suciu, G. Chim. Anal. (Bucharest) 1972, 2, 193.
38. Sandu, M.A.; Lozan, R. M.; Ropot, V. M. Izv. Akad. Nauk Mold. SSR, Ser. Biol. Khim. Nauk 1988, 2, 71.
39. Slusanschi, H. Z. Lebensm.-Untersuch. u. -Forsch. 1960, 112, 390.
40. Koszegi, D.; Salgo, E. Magyar Kem. Folyoirat 1960, 66, 142.
41. Turczan, J. W.; Goldwitz, B. A. J. Ass. Off. Anal. Chem. 1973, 56, 669.

141
42. Pentegova, I. A.; Dubrovina, G. I. Metody Anal. Kontrolya Proizvod. Khim. Prom-sti. 1977, 8, 34.
43. Maruna, A. T. Tr. Komis. po Analit. Khim., Akad. Nauk SSSR, Inst. Geokhim. i Analit Khim. 1963, 13, 320.
44. Fishman, G. I.; Pevzner, I. D. Zavod. Lab. 1970, 36, 926.
45. Stransky, Z.; Dolinek, J.; Pavlica, J. Acta Univ. Palacki. Olomucl, Fae. Rerum Nat. 1978, 57, 197.
46. Blazsek, A.; Biro, Z. Rev. Med. (Targu-Mures) 1968, 14, 70.
47. Nikolic, K.; Velasevic, K. Arb. Farm. 1985, 35, 215.
48. Strom, J. G.; Jun, H. W. J. Pharm. Sci. 1977, 66, 589.
49. Filipeva, S. A.; Strelets, L. N.; Petrenko, V. V.; Buryak, V. P. Zh. Anal. Khim. 1989, 44, 131.
50. Strom, J. G.; Jun, H. W. J. Pharm. Sci. 1986, 75, 416.
51. Rizzoli, C. Boll. soc. ital. biol. sper. 1949, 25, 433.
52. Taha, A. M.; El-Rabbat, N. A.; Fattah, F. A. Analyst 1980, 105, 568.
53. Sawicki, E.; Hauser, T. R.; McPherson, S. Anal. Chem. 1962, 34, 1460.
54. Zhantalai, B. P.; Ruch'eva, N. I. Zh. Prikl. Khim. 1966, 39, 2339.
55. Koupparis, M.A.; Efstathiou, C. E.; Hadjiioannou, T. P. Anal. Chem. Acta 1979, 107, 91.
56. Levin, J. 0.; Faengmark, I. Analyst 1988, 113, 511.
57. Nair, J.B.; Delaney, M. F.; Combs, K. J. Ana. Lett. 1983, 16, 711.
58. Koga, M.; Shinohara, R.; Akiyama, T. Anal. Sci. 1985, 1, 381.
59. The United States pharmacopeia. The national formulary; United States Pharmacopeia Convention, inc.; Rockville, Md., 1990; p 846.
60. Al-Jabari, Ghazi; Jaselskis, Bruno Talanta 1988, 35, 655.
61. Stookey, L. L. Anal. Chem. 1970, 42, 779.
62. Blau, F. Monatsh. 1898, 19, 666.
63. Al-Jabari, G.; Jaselskis, B. Talanta 1987, 34, 479.

142
64. The Merck Index, 9th ed.; Windholz, M., Ed.; Merck: Rahway, N.J., 1976; p 1110.
65. CRC Handbook of Chemistry and Physics, 65th ed.; Weast, R. C., Ed.; CRC Press: Boca Raton, Florida, 1984; p C-301.
66. ibid., p C-326.
67. The Merck Index, 9th ed.; Windholz, M., Ed.; Merck: Rahway, N.J., 1976; p 545.
68. Morrison, R. T.; Boyd, R. N. Organic Chemistry, 4th ed.; Allyn and Bacon: Boston, 1983; p 759.
69. Morrison, R. T.; Boyd, R. N. Organic Chemistry, 4th ed.; Allyn and Bacon: Boston, 1983; p 754.
70. Baum, D. E.; Goodman, K. D. Brit. Polym. J. 1970, 2, 81.
71. Bouyoucos, S. A. Anal. Chem. 1977, 49, 401.
72. Jaworski, M. Chromatographia 1980, 13, 101.
73. Moreno, P.; Sachez, E.; Pons, A.; Palou, A Anal. Chem. 1986, 58, 585.
74. Marhol,M. Ion Exchangers in Analytical Chemistry. Their Use in Inorganic Chemistry; Svehla, G., Ed.; Wilson and Wilson's Comprehensive Analytical Chemistry vol. XIV; Elsevier: Amsterdam, 1982; p 41.
75. ibid., p 171.
76. Strelow, F. W. E.; Victor, A. H.; van Zyl, C. R.; Eloff, C. Anal. Chem. 1971, 43, 870.

VITA
The author, Gary Lee Madsen, was born May 1, 1962 in Elmhurst
Illinois.
In September, 1980, Gary Madsen entered Bradley University in Peoria
Illinois. He worked as an undergraduate teaching assistant and received
the degree of Bachelor of Arts with a major in chemistry in May, 1984.
In September, 1984, the author entered the Graduate Program in
Chemistry at Loyola University of Chicago and became a graduate teaching
assistant. In 1985, he began his research with Dr. Bruno Jaselskis. Gary
Madsen presented his work at the following meetings: i) Sigma Xi
Symposium, Loyola University, May 1990, ii) 23rd Great Lakes Regional
Meeting of the American Chemical Society, June 1990, iii) Loyola
University St. Albert's Day Poster Presentation, Nov. 1990, and iv) The
Pittsburgh Conference, March 1991. The auther is in the process of
writing two articles co-authored with Dr. Jaselskis currently titled
"Indirect Spectrophotometric Determination of Hexamethylenetetramine." and
"Direct Quantitative NMR Determination of Hexamethylenetetramine"
143

APPROVAL SHEET
The dissertation submitted by Gary Lee Madsen has been read and approved by the following committee:
Dr. Bruno Jaselskis, Director Professor, Chemistry, Loyola
Dr. Yen Yang Associate Professor, Chemistry, Loyola
Dr. David Crumrine Associate Professor, Chemistry, Loyola
Dr. Carl Moore Emeritus Professor, Chemistry, Loyola
Dr. Alfred Von Smolinski Professor, Chemistry, University of Illinois at Chicago
The final copies have been examined by the director of the dissertation and the signature which appears below verifies the fact that any necessary changes have been incorporated and that the dissertation is now given final approval by the Committee with reference to content and form.
The dissertation is therefore accepted in partial fulfillment of the requirements for the degree of Doctor of Philosophy.
(
Daife Director Is Signat~r;.