Study of Quality Function Deployment (QFD) in Service...
12
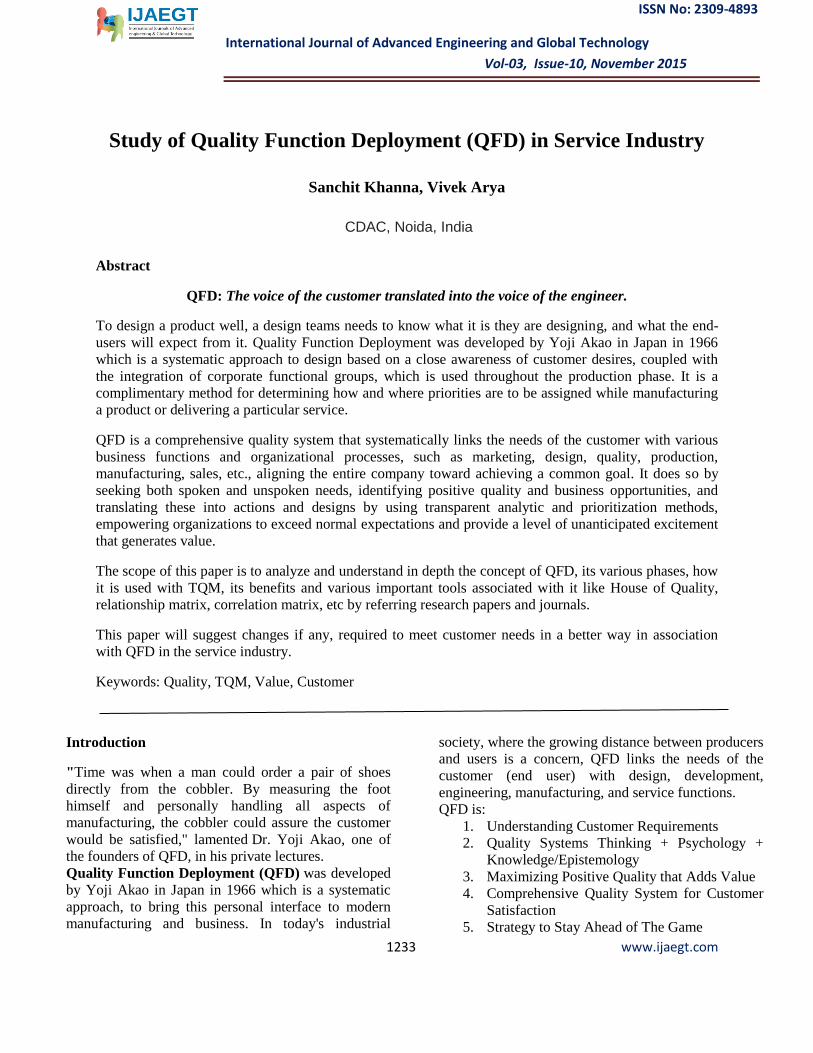
ISSN No: 2309-4893 International Journal of Advanced Engineering and Global Technology I Vol-03, Issue-10, November 2015 1233 www.ijaegt.com Study of Quality Function Deployment (QFD) in Service Industry Sanchit Khanna, Vivek Arya CDAC, Noida, India Abstract QFD: The voice of the customer translated into the voice of the engineer. To design a product well, a design teams needs to know what it is they are designing, and what the end- users will expect from it. Quality Function Deployment was developed by Yoji Akao in Japan in 1966 which is a systematic approach to design based on a close awareness of customer desires, coupled with the integration of corporate functional groups, which is used throughout the production phase. It is a complimentary method for determining how and where priorities are to be assigned while manufacturing a product or delivering a particular service. QFD is a comprehensive quality system that systematically links the needs of the customer with various business functions and organizational processes, such as marketing, design, quality, production, manufacturing, sales, etc., aligning the entire company toward achieving a common goal. It does so by seeking both spoken and unspoken needs, identifying positive quality and business opportunities, and translating these into actions and designs by using transparent analytic and prioritization methods, empowering organizations to exceed normal expectations and provide a level of unanticipated excitement that generates value. The scope of this paper is to analyze and understand in depth the concept of QFD, its various phases, how it is used with TQM, its benefits and various important tools associated with it like House of Quality, relationship matrix, correlation matrix, etc by referring research papers and journals. This paper will suggest changes if any, required to meet customer needs in a better way in association with QFD in the service industry. Keywords: Quality, TQM, Value, Customer Introduction "Time was when a man could order a pair of shoes directly from the cobbler. By measuring the foot himself and personally handling all aspects of manufacturing, the cobbler could assure the customer would be satisfied," lamented Dr. Yoji Akao, one of the founders of QFD, in his private lectures. Quality Function Deployment (QFD) was developed by Yoji Akao in Japan in 1966 which is a systematic approach, to bring this personal interface to modern manufacturing and business. In today's industrial society, where the growing distance between producers and users is a concern, QFD links the needs of the customer (end user) with design, development, engineering, manufacturing, and service functions. QFD is: 1. Understanding Customer Requirements 2. Quality Systems Thinking + Psychology + Knowledge/Epistemology 3. Maximizing Positive Quality that Adds Value 4. Comprehensive Quality System for Customer Satisfaction 5. Strategy to Stay Ahead of The Game
Transcript of Study of Quality Function Deployment (QFD) in Service...
ISSN No: 2309-4893
International Journal of Advanced Engineering and Global Technology
I Vol-03, Issue-10, November 2015
1233 www.ijaegt.com
Study of Quality Function Deployment (QFD) in Service Industry
Sanchit Khanna, Vivek Arya
CDAC, Noida, India
Abstract
QFD: The voice of the customer translated into the voice of the engineer.
To design a product well, a design teams needs to know what it is they are designing, and what the end-
users will expect from it. Quality Function Deployment was developed by Yoji Akao in Japan in 1966
which is a systematic approach to design based on a close awareness of customer desires, coupled with
the integration of corporate functional groups, which is used throughout the production phase. It is a
complimentary method for determining how and where priorities are to be assigned while manufacturing
a product or delivering a particular service.
QFD is a comprehensive quality system that systematically links the needs of the customer with various
business functions and organizational processes, such as marketing, design, quality, production,
manufacturing, sales, etc., aligning the entire company toward achieving a common goal. It does so by
seeking both spoken and unspoken needs, identifying positive quality and business opportunities, and
translating these into actions and designs by using transparent analytic and prioritization methods,
empowering organizations to exceed normal expectations and provide a level of unanticipated excitement
that generates value.
The scope of this paper is to analyze and understand in depth the concept of QFD, its various phases, how
it is used with TQM, its benefits and various important tools associated with it like House of Quality,
relationship matrix, correlation matrix, etc by referring research papers and journals.
This paper will suggest changes if any, required to meet customer needs in a better way in association
with QFD in the service industry.
Keywords: Quality, TQM, Value, Customer
Introduction
"Time was when a man could order a pair of shoes
directly from the cobbler. By measuring the foot
himself and personally handling all aspects of
manufacturing, the cobbler could assure the customer
would be satisfied," lamented Dr. Yoji Akao, one of
the founders of QFD, in his private lectures.
Quality Function Deployment (QFD) was developed
by Yoji Akao in Japan in 1966 which is a systematic
approach, to bring this personal interface to modern
manufacturing and business. In today's industrial
society, where the growing distance between producers
and users is a concern, QFD links the needs of the
customer (end user) with design, development,
engineering, manufacturing, and service functions.
QFD is:
1. Understanding Customer Requirements
2. Quality Systems Thinking + Psychology +
Knowledge/Epistemology
3. Maximizing Positive Quality that Adds Value
4. Comprehensive Quality System for Customer
Satisfaction
5. Strategy to Stay Ahead of The Game
ISSN No: 2309-4893
International Journal of Advanced Engineering and Global Technology
I Vol-03, Issue-10, November 2015
1234 www.ijaegt.com
As a quality system that implements elements of
Systems Thinking with elements of Psychology and
Epistemology (knowledge), QFD provides a system of
comprehensive development process for:
Understanding 'true' customer needs from the
customer's perspective
What 'value' means to the customer, from the
customer's perspective
Understanding how customers or end users
become interested, choose, and are satisfied
Analyzing how do we know the needs of the
customer
Deciding what features to include
Determining what level of performance to
deliver
Intelligently linking the needs of the customer
with design, development, engineering,
manufacturing, and service functions
Intelligently linking Design for Six Sigma
(DFSS) with the front end Voice of Customer
analysis and the entire design system
QFD is a comprehensive quality system that
systematically links the needs of the customer with
various business functions and organizational
processes, such as marketing, design, quality,
production, manufacturing, sales, etc., aligning the
entire company toward achieving a common goal.
It does so by seeking both spoken and unspoken
needs, identifying positive quality and business
opportunities, and translating these into actions and
designs by using transparent analytic and prioritization
methods, empowering organizations to exceed normal
expectations and provide a level of unanticipated
excitement that generates value.
The QFD methodology can be used for both tangible
products and non-tangible services, including
manufactured goods, service industry, software
products, IT projects, business process development,
government, healthcare, environmental initiatives, and
many other applications.
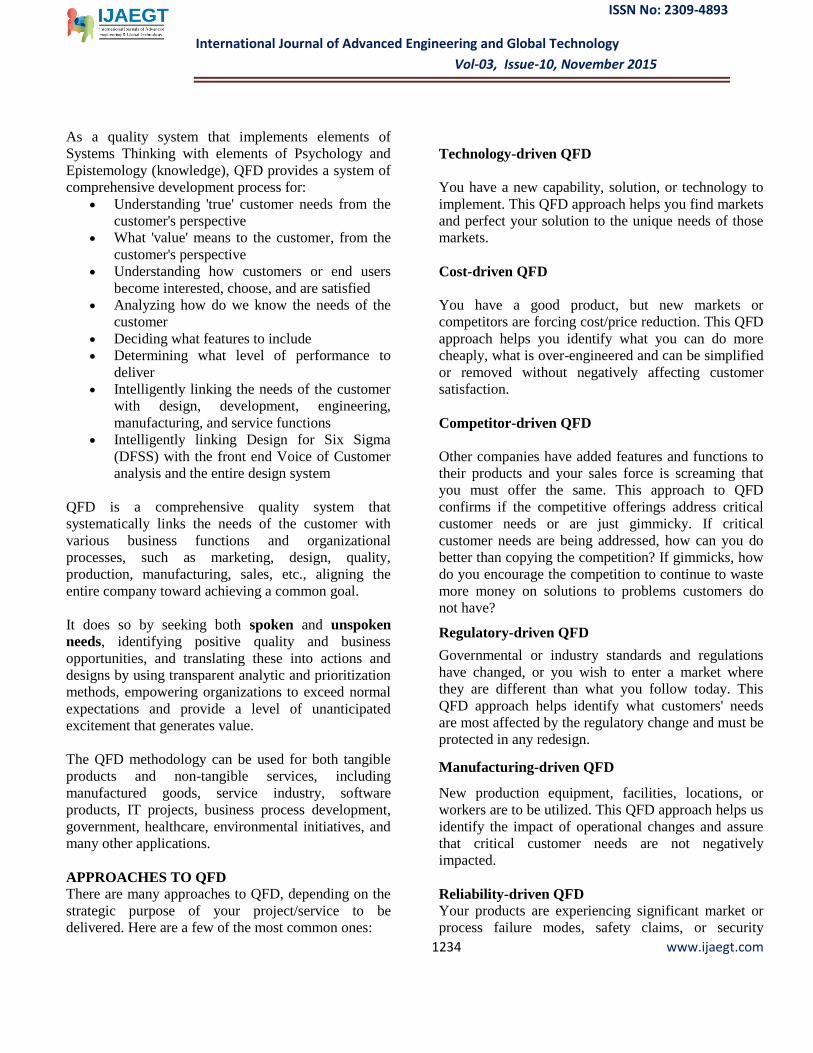
APPROACHES TO QFD
There are many approaches to QFD, depending on the
strategic purpose of your project/service to be
delivered. Here are a few of the most common ones:
Technology-driven QFD
You have a new capability, solution, or technology to
implement. This QFD approach helps you find markets
and perfect your solution to the unique needs of those
markets.
Cost-driven QFD
You have a good product, but new markets or
competitors are forcing cost/price reduction. This QFD
approach helps you identify what you can do more
cheaply, what is over-engineered and can be simplified
or removed without negatively affecting customer
satisfaction.
Competitor-driven QFD
Other companies have added features and functions to
their products and your sales force is screaming that
you must offer the same. This approach to QFD
confirms if the competitive offerings address critical
customer needs or are just gimmicky. If critical
customer needs are being addressed, how can you do
better than copying the competition? If gimmicks, how
do you encourage the competition to continue to waste
more money on solutions to problems customers do
not have?
Regulatory-driven QFD
Governmental or industry standards and regulations
have changed, or you wish to enter a market where
they are different than what you follow today. This
QFD approach helps identify what customers' needs
are most affected by the regulatory change and must be
protected in any redesign.
Manufacturing-driven QFD
New production equipment, facilities, locations, or
workers are to be utilized. This QFD approach helps us
identify the impact of operational changes and assure
that critical customer needs are not negatively
impacted.
Reliability-driven QFD
Your products are experiencing significant market or
process failure modes, safety claims, or security

ISSN No: 2309-4893
International Journal of Advanced Engineering and Global Technology
I Vol-03, Issue-10, November 2015
1235 www.ijaegt.com
vulnerabilities. Improvement processes such as six
sigma, kaizen, quality improvement stories, 7D/8D
reports, etc. are not delivering significant enough
improvement. This approach to QFD examines the
environmental and situational sources of these
problems, which often involve customer and user
behaviors in order to help design more robust products.
PHASES OF QFD
The four-phase-based QFD was modified, due to the
fact that there is no part deployment in the service
application, into a three-phase action plan based
methodology:
Fig 1: Phases of QFD in Service industry
Phase I: Service planning (HoQ)
The overall process of QFD is based on its core matrix
framework, called the HoQ. The components of this
house are:
• Understanding and identifying the target customers
• Identifying customer requirements (WHATs)
• Establishing relative importance of customer
requirements (AHP-driven importance rating)
• Analyzing the customer requirements (WHATs)
• Performing a customer competitive evaluation and
analysis
• Identifying service characteristics (HOWs)
• Establishing relationships between the WHATs and
HOWs
• Prioritizing service characteristics and technical
weightings
• Performing a technical competitive assessment
• Setting desired target values to achieve customer
satisfaction
• Analyzing the HoQ
The prioritized service characteristics are transformed
to the next phase.
Phase II: Process control characteristics matrix
This phase links the service characteristics identified in
Phase I to the service process elements that will satisfy
the customer requirements. In this phase, the
measurable or quantifiable characteristics will be
defined for each service characteristic and prioritized
from the HoQ to develop the process control
characteristics matrix. This matrix will include service
process characteristics, measurement units,
measurement scales, and target values. Some of these
characteristics are application dependent.
Phase III: Action plans matrix
This phase links the service process elements to the
service quality control parameters that need to be
monitored to ensure customer satisfaction. An action
plan is developed for each of the critical process
characteristics that are identified in Phase II. All the
action plans will result in an Action Plans Matrix. All
action plans will be measurable to allow maintaining
control of critical service characteristics and
consequently attaining customer satisfaction goals (that
is, target values).
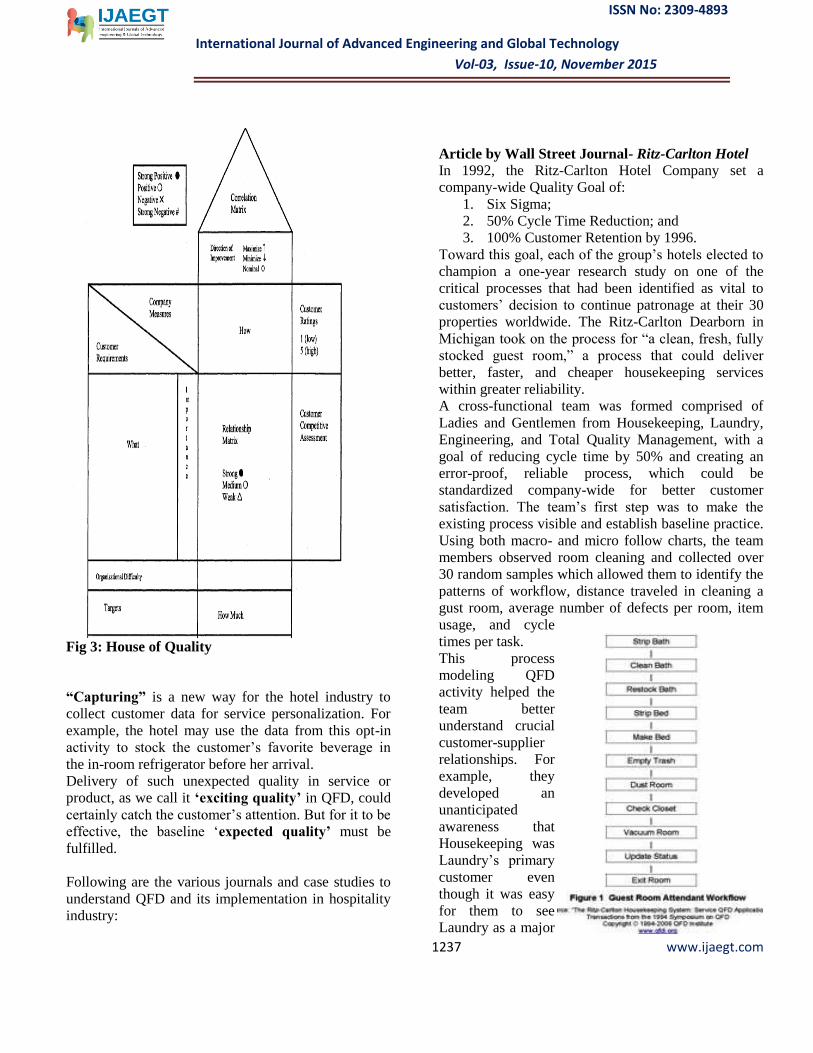
HOUSE OF QUALITY (HoQ)
The first phase in the implementation of the Quality
Function Deployment process involves putting
together a "House of Quality". It is basically a diagram

ISSN No: 2309-4893
International Journal of Advanced Engineering and Global Technology
I Vol-03, Issue-10, November 2015
1236 www.ijaegt.com
resembling house showing relationship between
customer desires and firm’s capabilities.
The House of Quality is an assembly of several
deployment hierarchies and tables, including the
Demanded Quality Hierarchy, Quality Characteristics
Hierarchy, the relationships matrix, the Quality
Planning Table, and Design Planning Table. It is a
table that connects dots between the Voice of the
Customer and the Voice of the Engineer.
Steps to the House of Quality
Step 1: Customer Requirements - "Voice of the
Customer"
The first step in a QFD project is to determine what
market segments will be analyzed during the process
and to identify who the customers are.
Step 2: Regulatory Requirements
Not all product or service requirements are known to
the customer, so the team must document requirements
that are dictated by management or regulatory
standards that the product must adhere to.
Step 3: Customer Importance Ratings
On a scale from 1 - 5, customers then rate the
importance of each requirement. This number will be
used later in the relationship matrix.
Step 4: Customer Rating of the Competition
Understanding how customers rate the competition can
be a tremendous competitive advantage. In this step of
the QFD process, it is also a good idea to ask
customers how your product or service rates in relation
to the competition. There is remodeling that can take
place in this part of the House of Quality.
Step 5: Technical Descriptors - "Voice of the
Engineer"
The technical descriptors are attributes about the
product or service that can be measured and
benchmarked against the competition. Technical
descriptors may exist that your organization is already
using to determine product specification, however new
measurements can be created to ensure that your
product is meeting customer needs.
Step 6: Relationship Matrix
The relationship matrix is where the team determines
the relationship between customer needs and the
company's ability to meet those needs. The team asks
the question, "what is the strength of the relationship
between the technical descriptors and the customer’s
needs?" Relationships can either be weak, moderate, or
strong or carry a numeric value of 1, 3 or 9.
Step 7: Target Values for Technical Descriptors
At this stage in the process, the QFD team begins to
establish target values for each technical descriptor.
Target values represent "how much" for the technical
descriptors, and can then act as a base-line to compare
against.
Step 8: Correlation Matrix:
This room in the matrix is where the term House of
Quality comes from because it makes the matrix look
like a house with a roof. Team members must examine
how each of the technical descriptors impact each
other. The team should document strong negative
relationships between technical descriptors and work
to eliminate physical contradictions.
PRACTICAL APPLICATION
The service industry exhibits distinct features that are
not shared in the manufacturing industry. Many service
organizations are profit-earning business enterprises
such as hotels, restaurants, and retail stores. The hotel
and hospitality industry is often perceived as the most
“global” in the service sector. Hence, substantial
capital is invested in designing and improving hotels
each year. On the other hand, a key challenge for
management is achieving customer satisfaction in an
increasingly competitive marketplace. Therefore, the
hospitality industry, and hotels in particular, have
witnessed increasing competition for high service
quality and customer satisfaction
ISSN No: 2309-4893
International Journal of Advanced Engineering and Global Technology
I Vol-03, Issue-10, November 2015
1237 www.ijaegt.com
Fig 3: House of Quality
“Capturing” is a new way for the hotel industry to
collect customer data for service personalization. For
example, the hotel may use the data from this opt-in
activity to stock the customer’s favorite beverage in
the in-room refrigerator before her arrival.
Delivery of such unexpected quality in service or
product, as we call it ‘exciting quality’ in QFD, could
certainly catch the customer’s attention. But for it to be
effective, the baseline ‘expected quality’ must be
fulfilled.
Following are the various journals and case studies to
understand QFD and its implementation in hospitality
industry:
Article by Wall Street Journal- Ritz-Carlton Hotel
In 1992, the Ritz-Carlton Hotel Company set a
company-wide Quality Goal of:
1. Six Sigma;
2. 50% Cycle Time Reduction; and
3. 100% Customer Retention by 1996.
Toward this goal, each of the group’s hotels elected to
champion a one-year research study on one of the
critical processes that had been identified as vital to
customers’ decision to continue patronage at their 30
properties worldwide. The Ritz-Carlton Dearborn in
Michigan took on the process for “a clean, fresh, fully
stocked guest room,” a process that could deliver
better, faster, and cheaper housekeeping services
within greater reliability.
A cross-functional team was formed comprised of
Ladies and Gentlemen from Housekeeping, Laundry,
Engineering, and Total Quality Management, with a
goal of reducing cycle time by 50% and creating an
error-proof, reliable process, which could be
standardized company-wide for better customer
satisfaction. The team’s first step was to make the
existing process visible and establish baseline practice.
Using both macro- and micro follow charts, the team
members observed room cleaning and collected over
30 random samples which allowed them to identify the
patterns of workflow, distance traveled in cleaning a
gust room, average number of defects per room, item
usage, and cycle
times per task.
This process
modeling QFD
activity helped the
team better
understand crucial
customer-supplier
relationships. For
example, they
developed an
unanticipated
awareness that
Housekeeping was
Laundry’s primary
customer even
though it was easy
for them to see
Laundry as a major

ISSN No: 2309-4893
International Journal of Advanced Engineering and Global Technology
I Vol-03, Issue-10, November 2015
1238 www.ijaegt.com
supplier to Housekeeping. The discovery was an
important lesson because insufficient supply of linen
and towels was a company-wide defect. Data indicated
each room attendant wasted 30 to 45 minutes daily in
tracking down needed supplies. Practices ranged from
walking to the Laundry department from the guest
floors to learn product availability to hoarding supplies
to taking supplies from co-workers’ carts or linen
closets.
The team also found that distribution of guest room
supplies such as towels and linen to honor bar items
and paper products was unreliable, resulting in
mistakes, rework, break downs in process
inefficiencies, variation, and discrepancies for honor
bar billing. Waste due to this included lost labor
dollars, wasted effort and travel, redundant work, and
lost business. The Cost of Quality was calculated to
exceed $460,000 annually for the entire Housekeeping
system.
Because this study was conducted before Modern
QFD was developed, this team resorted to building
a classical House of Quality (HOQ) matrix in order to
align customer requirements with supplier measures
and to identify customer requirements.
We might point out that today, this same analysis
could be done more efficiently and faster by using
more agile and easier-to-use Modern QFD tools such
as the Maximum Value Table and without building a
HOQ.
The Ritz-Carlton team then used brainstorming and
benchmarking to develop process options and
conducted pilot processes to test and fine-tune the
selected alternative process. Their process
improvement resulted in:
Reduction in room cleaning cycle time to 65%
or 8 minutes with the added task of servicing
the honor bar;
Reduction in defects per room by 42% to 3.7
which translates to a higher reliability in
cleanliness factor;
Reduction of standard guest room interruptions
by 33% due to combining of honor bar task
with cleaning team;
Reduction in time guest would be disturbed if
occupying room at time cleaning is provided;
Increase in property/life safety for gusts and
staff due to fewer guest room doors being
opened at any one time, as well as presence of
more than one room attendant within a room;
Increase in productivity from 13 to 15 rooms
per person and still increasing with resultant
labor savings; and
Reduction in individual travel by 64% to 205
feet within guest room.
The team also reported intangible benefits such as
reduction in loneliness and monotony, increased job
enrichment and teamwork, better communication
between team members and between guests and team
members, and stronger customer-supplier relationship
between Housekeeping and Laundry.
Case Study: Azadi Grand Hotel, formerly Hyatt
Hotel
Azadi Grand Hotel, formerly Hyatt Hotel, with a 24-
story high tower on a two-story podium and two
basement levels, is the most famous hotel in the
metropolitan area of Tehran, Iran. The majority of the
hotel’s guests are business people and diplomats, and
the average occupancy rate (Occ. %) is approximately
60 percent, of which 45 percent are business people, 12
percent are diplomats, and 3 percent are normal guests.
The Azadi Grand Hotel executives decided to renovate
the hotel and its services to make it comparable to the
level of quality expected from a five-star hotel. The
executives thought that all aspects of the hotel should
be analyzed to ensure compliance with current five-star
International standards. Hence, they chose a cross-
functional team to identify and analyze the hotel
functions and service delivery processes. The QFD
flow down process was applied in this hotel.
PHASE I: SERVICE PLANNING (HoQ)
Identifying Customer Requirements
(WHATs)
The HoQ starts with the customers’ needs and wants,
which are called customer requirements. This research
used SERVQUAL’s structure for identifying the key
customer requirements of the hotel and hospitality
industry. This resulted in the following definitions:
ISSN No: 2309-4893
International Journal of Advanced Engineering and Global Technology
I Vol-03, Issue-10, November 2015
1239 www.ijaegt.com
• Tangibles: Physical aspects of the hotel services,
including the appearance of physical facilities,
equipment, personnel, and communication services.
• Reliability: Ability to perform the promised hotel
services dependably and accurately.
• Responsiveness: Willingness to serve hotel
customers in providing prompt service.
• Assurance: Knowledge and courtesy of the hotel’s
staff and their ability to inspire trust and confidence in
their guests.
• Empathy: Caring and individualized attention that
the hotel must pay to its guests.
In this research, the hotel guest interviews determined
that the SERVQUAL items were applicable and
understandable; however, the dimensions needed
modifications for this industry.
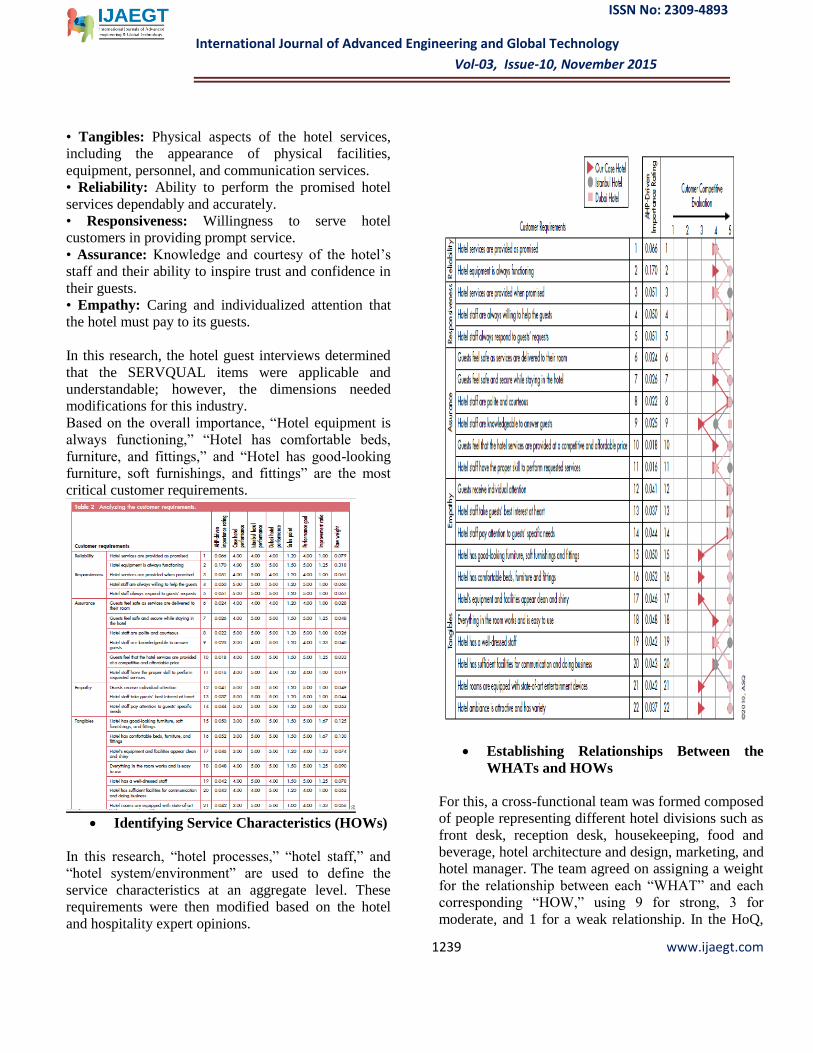
Based on the overall importance, “Hotel equipment is
always functioning,” “Hotel has comfortable beds,
furniture, and fittings,” and “Hotel has good-looking
furniture, soft furnishings, and fittings” are the most
critical customer requirements.
Identifying Service Characteristics (HOWs)
In this research, “hotel processes,” “hotel staff,” and
“hotel system/environment” are used to define the
service characteristics at an aggregate level. These
requirements were then modified based on the hotel
and hospitality expert opinions.
Establishing Relationships Between the
WHATs and HOWs
For this, a cross-functional team was formed composed
of people representing different hotel divisions such as
front desk, reception desk, housekeeping, food and
beverage, hotel architecture and design, marketing, and
hotel manager. The team agreed on assigning a weight
for the relationship between each “WHAT” and each
corresponding “HOW,” using 9 for strong, 3 for
moderate, and 1 for a weak relationship. In the HoQ,
ISSN No: 2309-4893
International Journal of Advanced Engineering and Global Technology
I Vol-03, Issue-10, November 2015
1240 www.ijaegt.com
these weightings are recorded with symbols: H for
strong, M for moderate and L for weak. Because
several customer requirements rows in the HoQ were
almost completely filled, it would indicate a customer
requirement that involves cost, reliability, or safety
issues.
Establishing Technical Correlations Matrix
The trade-offs were defined through the use of
symbols in the HoQ and assigned “+” for synergy and
“-” for a compromising functional relationship. To
improve “problems resolution,” improvements to “staff
friendly behavior,” “training & education,” and
“motivation” may be necessary. The negative
relationships for the “price” characteristic affect
“porters availability,” “staff appearance,” “training &
education,” and “proprietor & staff are on site and on
call.”
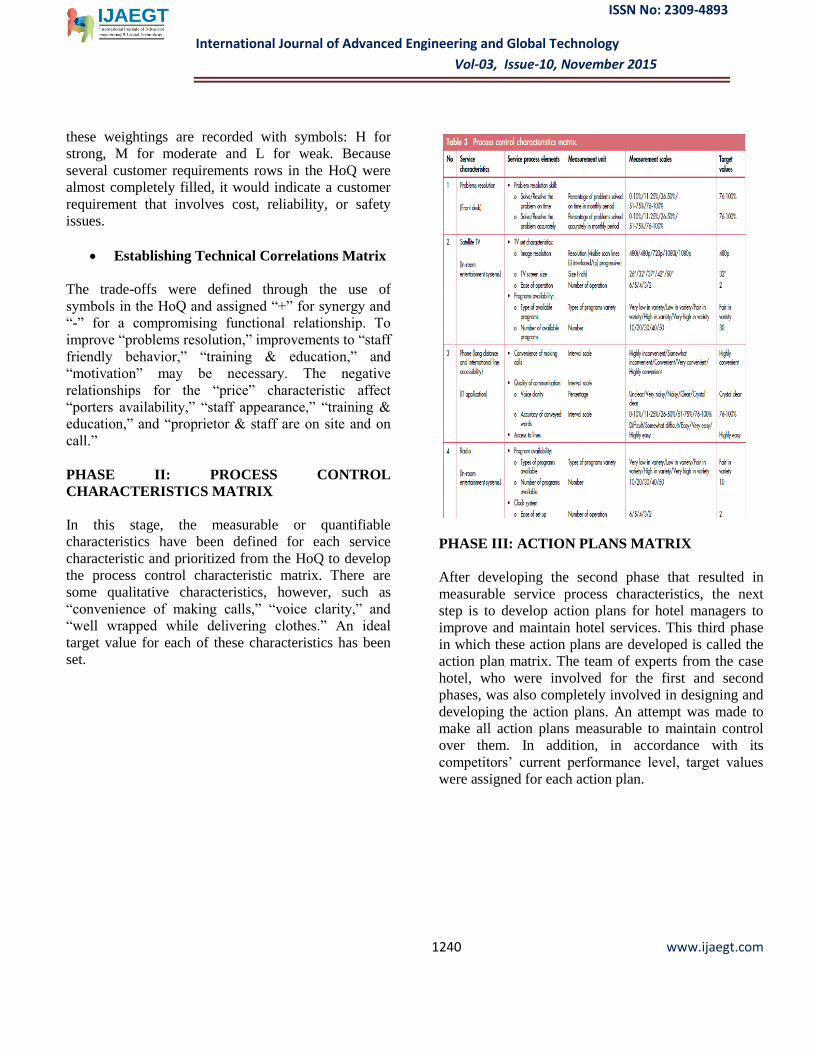
PHASE II: PROCESS CONTROL
CHARACTERISTICS MATRIX
In this stage, the measurable or quantifiable
characteristics have been defined for each service
characteristic and prioritized from the HoQ to develop
the process control characteristic matrix. There are
some qualitative characteristics, however, such as
“convenience of making calls,” “voice clarity,” and
“well wrapped while delivering clothes.” An ideal
target value for each of these characteristics has been
set.
PHASE III: ACTION PLANS MATRIX
After developing the second phase that resulted in
measurable service process characteristics, the next
step is to develop action plans for hotel managers to
improve and maintain hotel services. This third phase
in which these action plans are developed is called the
action plan matrix. The team of experts from the case
hotel, who were involved for the first and second
phases, was also completely involved in designing and
developing the action plans. An attempt was made to
make all action plans measurable to maintain control
over them. In addition, in accordance with its
competitors’ current performance level, target values
were assigned for each action plan.

ISSN No: 2309-4893
International Journal of Advanced Engineering and Global Technology
I Vol-03, Issue-10, November 2015
1241 www.ijaegt.com
ANALYSIS
Quality function deployment (QFD) is a systematic
planning process used by cross-functional teams to
identify and resolve the issues involved in providing
products, processes, services, and strategies that
enhance customer satisfaction. With the application of
the QFD process, possible relationships are explored
between quality characteristics expressed by customers
and substitute quality requirements expressed in
engineering terms.
The 3 main goals in implementing QFD are:
1. Prioritize spoken and unspoken customer wants and
needs.
2. Translate these needs into technical characteristics
and specifications.
3. Build and deliver a quality product or service by
focusing everybody toward customer satisfaction.
Understanding Customer needs in QFD
The Kano Model is a useful tool in understanding
customer needs in the QFD methodology. The Kano
model categorizes customer needs into three groups"
basic, performance, and excitement.
Fig 2: Kano Model
Basic needs are those that get a company in
the market; they are not spoken unless
violated. For example, at a hotel, you don't ask
for a bed, you expect it to be there. If you
show up and there is no bed, then you would
speak the need (after it was violated).
Performance needs are known as those that
keep a company in the market. They are
spoken by the customer and considered when
purchasing decisions are made. Performance
needs make the customer happy or unhappy,
and the customer's happiness is proportional to
how well the performance needs are met.
Excitement needs are unspoken, which are
beyond customer expectations. For this reason,
they are generally unknown and difficult to
uncover.
Evolution of Needs with Time
An extremely important aspect of the Kano model is
the idea that needs evolve over time. As time marches
on, excitement needs become performance needs and

ISSN No: 2309-4893
International Journal of Advanced Engineering and Global Technology
I Vol-03, Issue-10, November 2015
1242 www.ijaegt.com
performance needs become basic needs. The exciting
and innovative needs get copied by competitors and
become standard and expected. There are many
examples of this in the auto industry where automatic
transmission, cup holders, visors with clips, automatic
windows, and airbags were once considered
excitement needs and are now expected in a new
vehicle. Express checkout at hotels, which used to be
an excitement need, is now considered a performance
need and electronic ticket check in at the airport is
moving from an excitement need to a performance
need.
The Tools of Service QFD
While traditional quality tools were developed to
handle quantitative data, a new set of tools were
created to handle the more qualitative language and
relationships of-ten associated with non manufacturing
activities. The tools aid process reengineering for
improving existing services, as well.
Matrix Data Analysis Charts are used to present the
results of multivariate analysis of data. Particularly for
customer segmentation, techniques such as conjoint
analysis, cluster analysis, factor analysis, multiple
regression analysis, and other techniques are useful
when substantial quantitative customer data exists.
This is the most mathematically sophisticated quality
tool.
Affinity Diagrams are used to surface the deep
structure" in voiced customer requirements. This right-
brained tool is generally produced by the KT Method"
developed by cultural anthropologist Jiro Kawakita
Kawakita 19861. Team members can directly elicit
customers’ natural organization of requirements. Also,
makes a good first step for creating hierarchy
diagrams.
Relations Diagrams also called interrelationship
digraphs can be used to discover priorities, root causes
of service process problems, and unvoiced customer
requirements.
Hierarchy Diagram's also called tree diagrams or
systematic diagrams are found throughout all QFD
deployments to check for missing data, to align levels
of abstraction of the data, to diagram the why/how
nature of functions, and to diagram failures.
Matrices and Tables are used to examine two or more
dimensions in a deployment. Common types include
relationships matrix, prioritization matrices, and
responsibility matrices.
Process Decision Program Diagrams (PDPC) arc
used to analyze potential failures of new processes and
services.
The Analytic Hierarchy Process (AHP) is used to
prioritize a set of requirements and to select from
among many alternatives to meet those requirements.
This method employs pair-wise comparisons on
hierarchically organized elements to produce a very
accurate set of priorities.
Blueprinting is a tool used to depict and analyze all
the processes involved in providing a service. A
variant of the diagrams used in time/motion studies.
QFD uses some principles from Concurrent
Engineering in that cross-functional teams are involved
in all phases of service development. Each of the three
phases in a QFD process uses a matrix to translate
customer requirements from initial planning stages
through control and analysis.
Each phase, or matrix, represents a more specific
aspect of the service's requirements. Relationships
between elements are evaluated for each phase. Only
the most important aspects from each phase are
deployed into the next matrix.
Quality Function Deployment and TQM
Through TQM practices, companies have been trying
to improve service quality to earn customer
satisfaction, besides their overall performance. But an
image of the kind of TQM strategy which will
efficiently earn this satisfaction in service industry is
still vaguely presented. Most companies naturally
focus on improving the quality of the product, while
service quality – the steps taken to deliver the product
– is not generally given priority. Thus, it is helpful for
companies to know and understand the current
practices and opportunities offered by TQM if they
want pursue customer satisfaction by combining

ISSN No: 2309-4893
International Journal of Advanced Engineering and Global Technology
I Vol-03, Issue-10, November 2015
1243 www.ijaegt.com
improvements in the product with those in the quality
of service.
To provide a comprehensible image of TQM strategy
in a service company, the present study collects data
from a ‘Voice of the Customer’ survey, which
describes how customers appreciate quality in products
and services. The main research question is:
• How TQM can be implemented to achieve customer
satisfaction in terms of quality of products and
services?
A key to improving quality through TQM is linking the
design of products or services to the processes that
produce them. Quality Function Deployment (QFD) is
a means of translating customer requirements into
appropriate technical requirements for each stage of
product or service development and production. The
data are analyzed by the QFD method to gauge the
level of customer satisfaction with products and
service and to establish action plans for developing the
potential of both.
It has been analyzed that implementing QFD
successfully involves answering these 6 questions:
Voice of customer: What does our customer
need and want?
Competitive analysis: In terms of our
customer, who well we are doing relative to
our competitors?
Voice of the engineer: What technical
measures relate to our customers’ needs?
Correlation: What are the relationships
between the voice of the customer and the
voice of the engineer?
Technical Comparison: How does our product
or service performance compare to that of our
competition?
Trade-offs: What are the potential technical
trade-offs?
Benefits of QFD
Through this work following major benefits of the
QFD can be interpreted:
To help companies make key trade-offs
between what the customer demands and what
the company can afford to produce
To bring together all the data required for the
development of a product or service
To assist the development team in quickly
identifying where additional information is
needed during the process
To shorten time to market
Conclusion and Recommendations
Conclusion
QFD is a profitable tool for the service industry,
specifically for the hospitality industry. This project
work finds little research and few papers with limited
scope that have been published to illustrate the
application of the complete QFD process. Only a
handful of publications extend beyond the HoQ. Most
publications provide only an example of the HoQ. The
documented results of this paper show that quality
improvement projects could indeed benefit from the
QFD methodology to relate customer needs to the
internal procedures or actions of the organization to
gratify and exceed customer expectations.
So, through this study, we can say that since its
introduction, Quality Function Deployment has helped
to transform the way many companies
• Plan new services
• Design service requirements
• Determine process characteristics
• Control the servicing process
• Document already existing service specifications
In short, this project can be used as a case study,
demonstrating that the QFD process can be fruitfully
applied in a service industry.

ISSN No: 2309-4893
International Journal of Advanced Engineering and Global Technology
I Vol-03, Issue-10, November 2015
1244 www.ijaegt.com
Recommendations
The present work brings together information from
diverse sources to offer a common starting point and
information base for quality assurance professionals.
The following recommendations and suggestions can
be given based on above journal and case study:
In most QFD studies, the House of Quality is not the
starting point. In technology driven QFDs and Cost
Reduction driven QFDs, the House of Quality may
not even be created, this being the main reason for
unsuccessful implementation of QFD in various
companies.
The difference between product QFD phases and
service QFD phases must be understood. Taking
services under consideration, 3-phases QFD must be
implemented. The House of Quality is not QFD; it is
to be followed by process control matrix and action
plan matrix.
QFD implementation should be carried out as a part
of TQM, keeping in mind the defects allowed n Six
Sigma.
A continuous QFD needs to be deployed at the
lowest level of operations. In addition, in order to
make TQM work efficiently, companies need to build
a corporate culture to replace continuous QFD.
Each phase of QFD should not be confused with the
other so that life cycle of analysis between one QFD
and another is shortened and the company becomes
more competitive due to the increasing speed of its
innovations.
LIMITATIONS
Limitations
The limitations of this project study will be as follows:
The study is based on the data that existed so far
in journals and does not include any self
implementation of this concept in any
organization.
The study is a theoretical analysis of QFD and its
concepts that have been successfully used so far
in service industry.
Recommendations are based on shortfalls found
in the research papers and journals read and
analyzed only.
Access to any organizational data where it is used
was limited.
Future Scope
There are three main areas of future research that can
benefit from this research. The first area is to apply a
three-phase action plan based QFD in every division of
a hotel in detail. Next, this research can be applied in
other service industries such as healthcare, retail,
restaurants, salons (beauty salons, spas), and health
clubs. Finally, it would be beneficial to compare the
advantages of the use of QFD in the service industry
with manufacturing.
BIBLIOGRAPHY
1. Journals and research papers
Article by Wall Street Journal,1992
regarding Ritz-Carlton Hotel
Chang, H.H. (2006), “Development of
performance measurement systems in quality
management organizations”, The Service
Industries Journal, 26(7), pp. 765-86.
Andronikidis, A., Georgiou, A. C., Gotzamani,
K. and Kamvysi, K. (2009) The application of
quality function deployment in service quality
management. The TQM Journal.
Akao, Y. 1997. QFD : Past, present, and
future. Third International Symposium on
Quality Function Deployment, Linkoping,
Sweden.
TQM AND QFD approach to achieve
customer satisfaction: a flour milling
company case study by Maqsood
Sandhu*, United Arab Emirates University,
UAE
2. Internet websites:
. www.qfdi.org
http://asq.org/learn-about-quality/qfd-
qualitfunctiondeployment/overview/overview.
html
http://www.isixsigma.com/dictionary/qfd/
https://totalqualitymanagement.wordpress.com
/2009/09/09/quality-function-deployment/
http://www.zeepedia.com/read.php?quality_fu
nction_deployment_qfd_and_other_tools_for_
implementation_total_quality_management_tq
m&b=59&c=35