Integrated Quality Function Deployment (QFD) Model for Dry ... · expanding and seriously...
4
Index Terms—Quality function deployment (QFD), dry bulk terminal improvement (DBTI), house of quality (HOQ). Manuscript received October 18, 2013; revised December 20, 2013. Muhammad Ashlyzan Bin Razik is with the Universiti Malaysia Pahang, Malaysia (e-mail: [email protected]). expanding and seriously increasing their capacity due to the high demand for energy and mineral resources [2]. To reach for these purposes, the existing terminal must take the challenge to improve their efficiency through making an investment. It takes into account what and how parts aspects in dry bulk terminals to improved. Some port authority used the approach to expand the port using by copying the existing facilities until the required capacity is reached. In other words, the terminal does not only lose the opportunity to utilize the developments which made over the last decades on terminal design but also end up with a costly operation. And apart from that, every port authority must be careful in making investment considerations which would like to do. Hence, for the port authority, must consider how to develop an efficient marine terminal to create significantly value added benefits for the customers [3]. Source: UNCTAD 2011 Fig. 1. International seaborne trade. Integrated Quality Function Deployment (QFD) Model for Dry Bulk Terminal Improvements (DBTI) in Malaysian Ports Md. Ashlyzan Razik, Razman Mat Tahar, Wan Hasrulnizzam Wan Mahmood, and Norlinda Mohd Rozar Journal of Economics, Business and Management, Vol. 3, No. 4, April 2015 413 DOI: 10.7763/JOEBM.2015.V3.219 Abstract—The main purpose of this paper is to apply integrated quality function deployment (QFD) for dry bulk terminal improvement from the perspectives of the customers. Firstly, the main issue of the QFD problem was made which are ‘what’ the customer required and ‘how’ to implement the problem to solutions. This two major of components to be emphasized on the house of quality (HOQ) matrices. In this research, the systematic procedures using inferential statistics which are factor analysis and correlation spearman were applying in QFD method. Factor analysis used for identifying the best group and reduced the unused items. Whereas correlation spearman used for see the relationship and strengthen each factor. The results in this study show 4 best group or criteria were identified which are loading efficiency, infrastructure improvement, time performance and dry bulk operation improvement. This four criteria is the main criteria for improvement. The using QFD method suggested the management in Port Terminal should listen the customer voice to raise the issue for solutions. How to solve the issue is based on the strategy implemented. The proposed strategy from this study can be used for the port management to identify solution in dry bulk terminal. I. INTRODUCTION Dry bulk sector is the single largest commodity grouping in terms of tons loaded in the context of international seaborne trade. Fig. 1 shows the International Seaborne Trade that represented 38% of global seaborne tones, followed by oils 34% and containerized cargo 28%. This trade divided two categories which is major dry bulk and minor dry bulk. Iron ore contributed two third of major dry bulk volume which is accounting for 844 million tons, coal, 815 million tons, grain 323 million tons, bauxite and alumina 84 million tons and phosphate rock 32 million tons. In contrast, minor dry bulk consist of a wide variety of cargo types which to be shipped in smaller quantities still represent important trades. This is proved in 2011 over 265 million tons of steel was loaded, 176 million tons of forestry products, 83 million tons of bulk fertilizers, 120 million tons of cement and clinker and 519 million tons of raw sugar [1]. The high demand from around the world on dry bulk sector, causing pressure on the terminals to increase their capacity. Many dry bulk terminals around the world are From the perspective of Port Management and authority especially in Dry Bulk Terminals, they have information and feedback about the criteria needed from port users or customers such as what requirement is needed to improve the port and how to become competitive. This information is very important as input to design and where to improve. Apart from that, quality function deployment (QFD) is a suitable approach to explain this circumstance. The QFD is a theory from total quality management (TQM) and its function to identify customer requirements and assure quality in dry bulk terminal improvement (DBTI). Other than that, inferential statistics such as factor analysis used for grouping the WHATs priority and correlation spearman used for correlation each factor in house of quality (HOQ). HOQ shows the matrices used for relationship between customer‟s requirement („what‟ customer needs) and technical specifications or design requirements („how‟ the products/services have to be made) [3]. The matrices of
Transcript of Integrated Quality Function Deployment (QFD) Model for Dry ... · expanding and seriously...
Index Terms—Quality function deployment (QFD), dry bulk
terminal improvement (DBTI), house of quality (HOQ).
Manuscript received October 18, 2013; revised December 20, 2013.
Muhammad Ashlyzan Bin Razik is with the Universiti Malaysia Pahang,
Malaysia (e-mail: [email protected]).
expanding and seriously increasing their capacity due to the
high demand for energy and mineral resources [2]. To reach
for these purposes, the existing terminal must take the
challenge to improve their efficiency through making an
investment. It takes into account what and how parts aspects
in dry bulk terminals to improved. Some port authority used
the approach to expand the port using by copying the
existing facilities until the required capacity is reached. In
other words, the terminal does not only lose the opportunity
to utilize the developments which made over the last
decades on terminal design but also end up with a costly
operation. And apart from that, every port authority must be
careful in making investment considerations which would
like to do. Hence, for the port authority, must consider how
to develop an efficient marine terminal to create
significantly value added benefits for the customers [3].
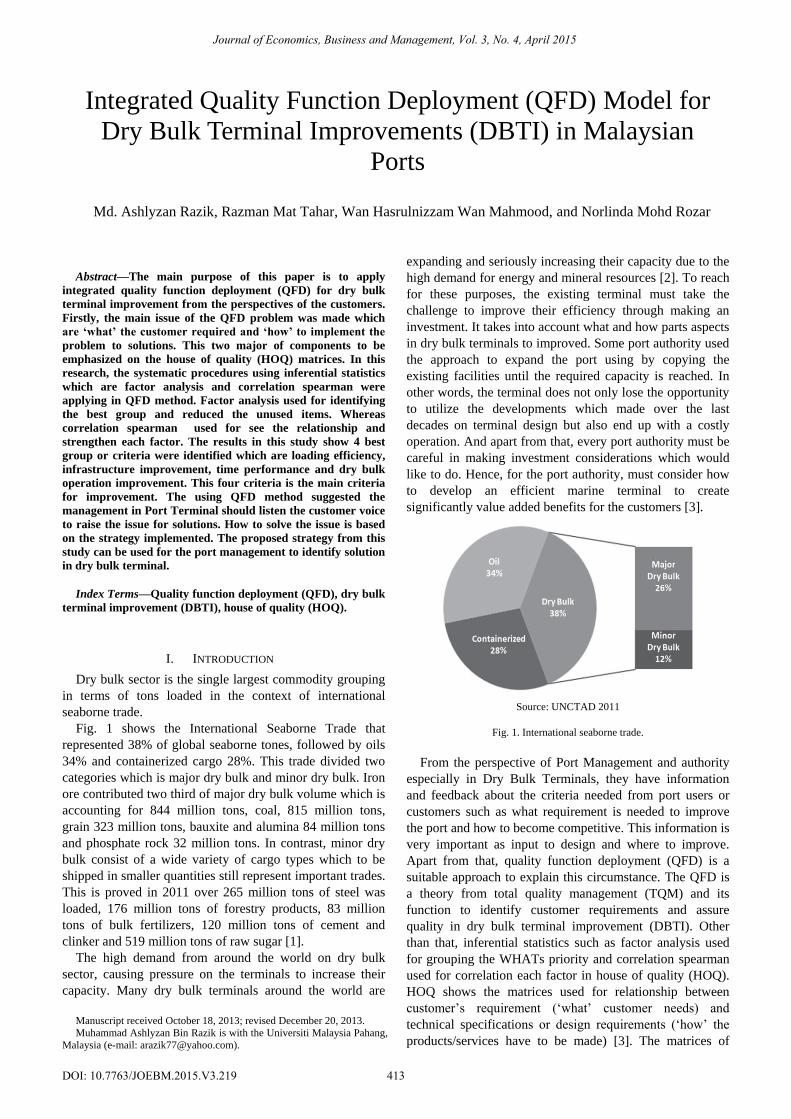
Source: UNCTAD 2011
Fig. 1. International seaborne trade.
Integrated Quality Function Deployment (QFD) Model for
Dry Bulk Terminal Improvements (DBTI) in Malaysian
Ports
Md. Ashlyzan Razik, Razman Mat Tahar, Wan Hasrulnizzam Wan Mahmood, and Norlinda Mohd Rozar
Journal of Economics, Business and Management, Vol. 3, No. 4, April 2015
413DOI: 10.7763/JOEBM.2015.V3.219
Abstract—The main purpose of this paper is to apply
integrated quality function deployment (QFD) for dry bulk
terminal improvement from the perspectives of the customers.
Firstly, the main issue of the QFD problem was made which
are ‘what’ the customer required and ‘how’ to implement the
problem to solutions. This two major of components to be
emphasized on the house of quality (HOQ) matrices. In this
research, the systematic procedures using inferential statistics
which are factor analysis and correlation spearman were
applying in QFD method. Factor analysis used for identifying
the best group and reduced the unused items. Whereas
correlation spearman used for see the relationship and
strengthen each factor. The results in this study show 4 best
group or criteria were identified which are loading efficiency,
infrastructure improvement, time performance and dry bulk
operation improvement. This four criteria is the main criteria
for improvement. The using QFD method suggested the
management in Port Terminal should listen the customer voice
to raise the issue for solutions. How to solve the issue is based
on the strategy implemented. The proposed strategy from this
study can be used for the port management to identify solution
in dry bulk terminal.
I. INTRODUCTION
Dry bulk sector is the single largest commodity grouping
in terms of tons loaded in the context of international
seaborne trade.
Fig. 1 shows the International Seaborne Trade that
represented 38% of global seaborne tones, followed by oils
34% and containerized cargo 28%. This trade divided two
categories which is major dry bulk and minor dry bulk. Iron
ore contributed two third of major dry bulk volume which is
accounting for 844 million tons, coal, 815 million tons,
grain 323 million tons, bauxite and alumina 84 million tons
and phosphate rock 32 million tons. In contrast, minor dry
bulk consist of a wide variety of cargo types which to be
shipped in smaller quantities still represent important trades.
This is proved in 2011 over 265 million tons of steel was
loaded, 176 million tons of forestry products, 83 million
tons of bulk fertilizers, 120 million tons of cement and
clinker and 519 million tons of raw sugar [1].
The high demand from around the world on dry bulk
sector, causing pressure on the terminals to increase their
capacity. Many dry bulk terminals around the world are
From the perspective of Port Management and authority
especially in Dry Bulk Terminals, they have information
and feedback about the criteria needed from port users or
customers such as what requirement is needed to improve
the port and how to become competitive. This information is
very important as input to design and where to improve.
Apart from that, quality function deployment (QFD) is a
suitable approach to explain this circumstance. The QFD is
a theory from total quality management (TQM) and its
function to identify customer requirements and assure
quality in dry bulk terminal improvement (DBTI). Other
than that, inferential statistics such as factor analysis used
for grouping the WHATs priority and correlation spearman
used for correlation each factor in house of quality (HOQ).
HOQ shows the matrices used for relationship between
customer‟s requirement („what‟ customer needs) and
technical specifications or design requirements („how‟ the
products/services have to be made) [3]. The matrices of
HOQ are used for organizing customers‟ requirement and
establishing priorities of technical specifications to satisfy
customer requirements [4]. Integrated QFD and inferential
statistics such as factor analysis and correlation spearman
hoping can identify the solutions in Dry Bulk Terminals
Improvements for Malaysians Ports.
II. RESEARCH METHODOLOGY
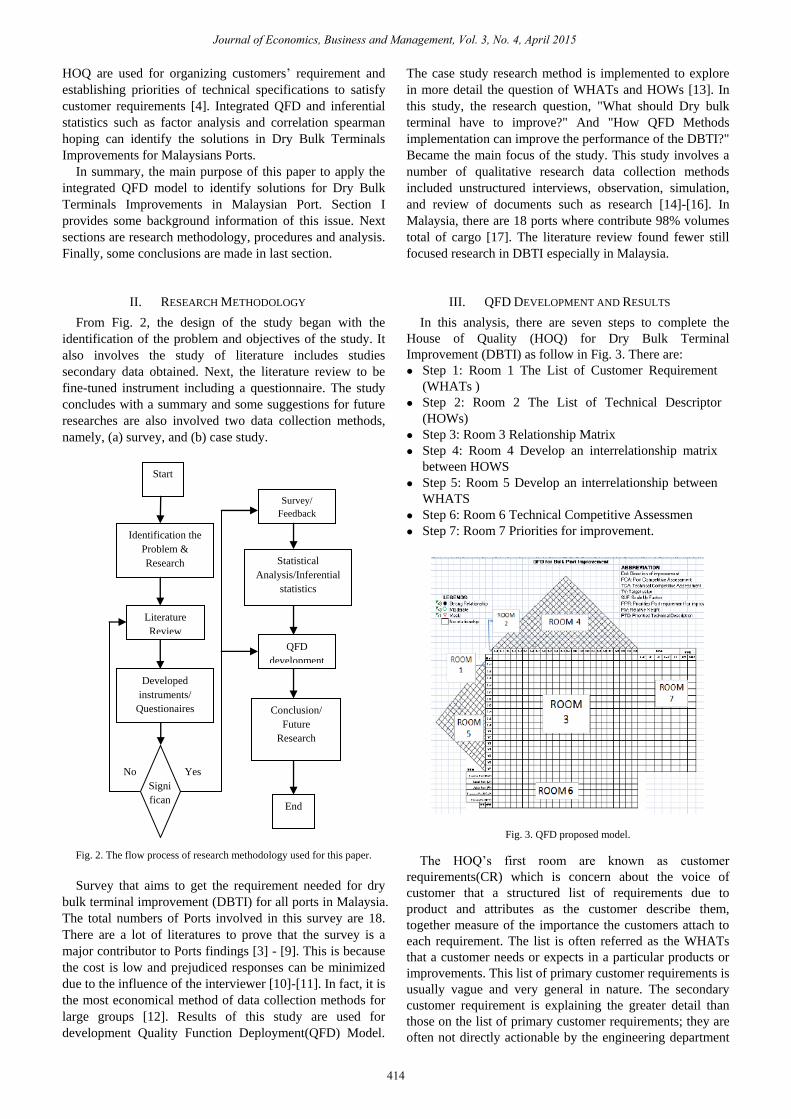
From Fig. 2, the design of the study began with the
identification of the problem and objectives of the study. It
also involves the study of literature includes studies
secondary data obtained. Next, the literature review to be
fine-tuned instrument including a questionnaire. The study
concludes with a summary and some suggestions for future
researches are also involved two data collection methods,
namely, (a) survey, and (b) case study.
Fig. 2. The flow process of research methodology used for this paper.
Survey that aims to get the requirement needed for dry
bulk terminal improvement (DBTI) for all ports in Malaysia.
The total numbers of Ports involved in this survey are 18.
There are a lot of literatures to prove that the survey is a
major contributor to Ports findings [3] - [9]. This is because
the cost is low and prejudiced responses can be minimized
due to the influence of the interviewer [10]-[11]. In fact, it is
the most economical method of data collection methods for
large groups [12]. Results of this study are used for
development Quality Function Deployment(QFD) Model.
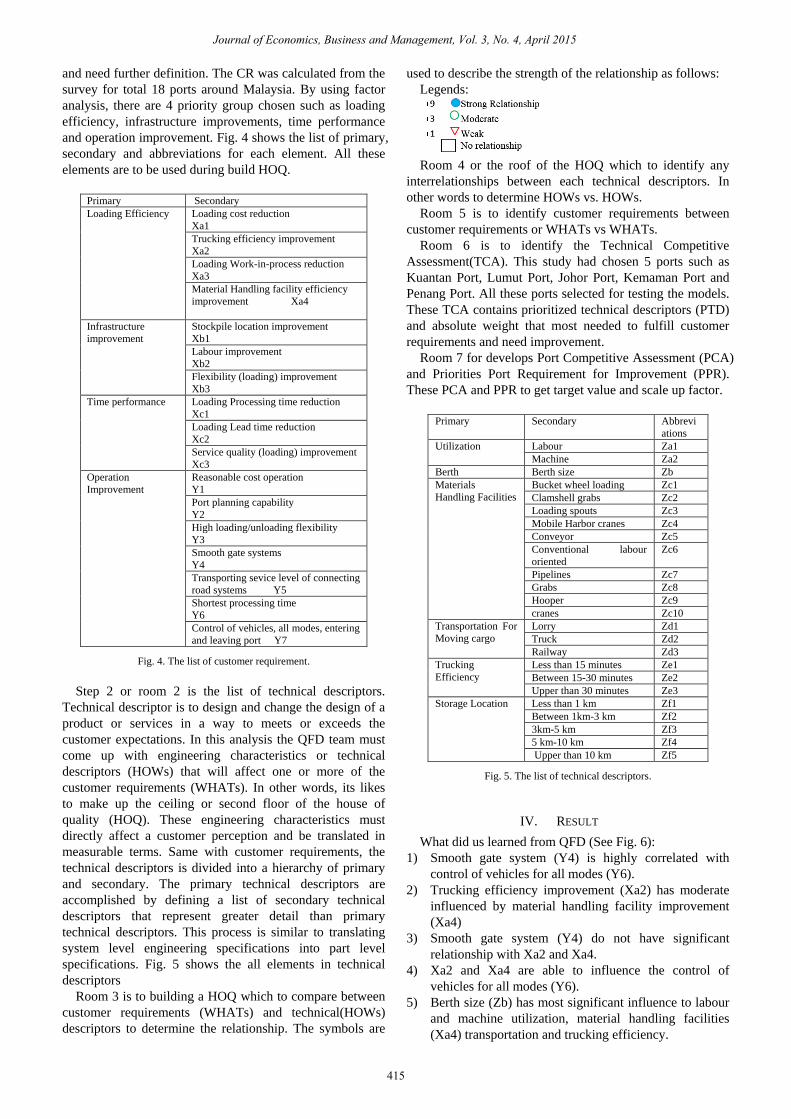
Fig. 3. QFD proposed model.
The HOQ‟s first room are known as customer
requirements(CR) which is concern about the voice of
customer that a structured list of requirements due to
product and attributes as the customer describe them,
together measure of the importance the customers attach to
each requirement. The list is often referred as the WHATs
that a customer needs or expects in a particular products or
improvements. This list of primary customer requirements is
usually vague and very general in nature. The secondary
customer requirement is explaining the greater detail than
those on the list of primary customer requirements; they are
often not directly actionable by the engineering department
Identification the
Problem & Research
Objectives
Start
Literature
Review
Developed
instruments/ Questionaires
Survey/
Feedback
Statistical
Analysis/Inferential
statistics
QFD
development
s
Conclusion/
Future
Research
End
Yes No
Signi
fican
ce?
Journal of Economics, Business and Management, Vol. 3, No. 4, April 2015
414
III. QFD DEVELOPMENT AND RESULTS
In this analysis, there are seven steps to complete the
House of Quality (HOQ) for Dry Bulk Terminal
Improvement (DBTI) as follow in Fig. 3. There are:
Step 1: Room 1 The List of Customer Requirement
(WHATs )
Step 2: Room 2 The List of Technical Descriptor
(HOWs)
Step 3: Room 3 Relationship Matrix
Step 4: Room 4 Develop an interrelationship matrix
between HOWS
Step 5: Room 5 Develop an interrelationship between
WHATS
Step 6: Room 6 Technical Competitive Assessmen
Step 7: Room 7 Priorities for improvement.
In summary, the main purpose of this paper to apply the
integrated QFD model to identify solutions for Dry Bulk
Terminals Improvements in Malaysian Port. Section I
provides some background information of this issue. Next
sections are research methodology, procedures and analysis.
Finally, some conclusions are made in last section.
The case study research method is implemented to explore
in more detail the question of WHATs and HOWs [13]. In
this study, the research question, "What should Dry bulk
terminal have to improve?" And "How QFD Methods
implementation can improve the performance of the DBTI?"
Became the main focus of the study. This study involves a
number of qualitative research data collection methods
included unstructured interviews, observation, simulation,
and review of documents such as research [14]-[16]. In
Malaysia, there are 18 ports where contribute 98% volumes
total of cargo [17]. The literature review found fewer still
focused research in DBTI especially in Malaysia.
and need further definition. The CR was calculated from the
survey for total 18 ports around Malaysia. By using factor
analysis, there are 4 priority group chosen such as loading
efficiency, infrastructure improvements, time performance
and operation improvement. Fig. 4 shows the list of primary,
secondary and abbreviations for each element. All these
elements are to be used during build HOQ.
Primary Secondary
Loading Efficiency Loading cost reduction
Xa1
Trucking efficiency improvement
Xa2
Loading Work-in-process reduction
Xa3
Material Handling facility efficiency
improvement Xa4
Infrastructure
improvement
Stockpile location improvement
Xb1
Labour improvement
Xb2
Flexibility (loading) improvement
Xb3
Time performance
Loading Processing time reduction
Xc1
Loading Lead time reduction
Xc2
Service quality (loading) improvement
Xc3
Operation
Improvement
Reasonable cost operation
Y1
Port planning capability
Y2
High loading/unloading flexibility
Y3
Smooth gate systems
Y4
Transporting sevice level of connecting
road systems Y5
Shortest processing time
Y6
Control of vehicles, all modes, entering
and leaving port Y7
Fig. 4. The list of customer requirement.
Step 2 or room 2 is the list of technical descriptors.
Technical descriptor is to design and change the design of a
product or services in a way to meets or exceeds the
customer expectations. In this analysis the QFD team must
come up with engineering characteristics or technical
descriptors (HOWs) that will affect one or more of the
customer requirements (WHATs). In other words, its likes
to make up the ceiling or second floor of the house of
quality (HOQ). These engineering characteristics must
directly affect a customer perception and be translated in
measurable terms. Same with customer requirements, the
technical descriptors is divided into a hierarchy of primary
and secondary. The primary technical descriptors are
accomplished by defining a list of secondary technical
descriptors that represent greater detail than primary
technical descriptors. This process is similar to translating
system level engineering specifications into part level
specifications. Fig. 5 shows the all elements in technical
descriptors
Room 3 is to building a HOQ which to compare between
customer requirements (WHATs) and technical(HOWs)
descriptors to determine the relationship. The symbols are
used to describe the strength of the relationship as follows:
Legends:
Room 4 or the roof of the HOQ which to identify any
interrelationships between each technical descriptors. In
other words to determine HOWs vs. HOWs.
Room 5 is to identify customer requirements between
customer requirements or WHATs vs WHATs.
Room 6 is to identify the Technical Competitive
Assessment(TCA). This study had chosen 5 ports such as
Kuantan Port, Lumut Port, Johor Port, Kemaman Port and
Penang Port. All these ports selected for testing the models.
These TCA contains prioritized technical descriptors (PTD)
and absolute weight that most needed to fulfill customer
requirements and need improvement.
Room 7 for develops Port Competitive Assessment (PCA)
and Priorities Port Requirement for Improvement (PPR).
These PCA and PPR to get target value and scale up factor.
Primary Secondary Abbrevi
ations
Utilization Labour Za1
Machine Za2
Berth Berth size Zb
Materials
Handling Facilities
Bucket wheel loading Zc1
Clamshell grabs Zc2
Loading spouts Zc3
Mobile Harbor cranes Zc4
Conveyor Zc5
Conventional labour
oriented
Zc6
Pipelines Zc7
Grabs Zc8
Hooper Zc9
cranes Zc10
Transportation For
Moving cargo
Lorry Zd1
Truck Zd2
Railway Zd3
Trucking
Efficiency
Less than 15 minutes Ze1
Between 15-30 minutes Ze2
Upper than 30 minutes Ze3
Storage Location Less than 1 km Zf1
Between 1km-3 km Zf2
3km-5 km Zf3
5 km-10 km Zf4
Upper than 10 km Zf5
Fig. 5. The list of technical descriptors.
IV. RESULT
What did us learned from QFD (See Fig. 6):
1) Smooth gate system (Y4) is highly correlated with
control of vehicles for all modes (Y6).
2) Trucking efficiency improvement (Xa2) has moderate
influenced by material handling facility improvement
(Xa4)
3) Smooth gate system (Y4) do not have significant
relationship with Xa2 and Xa4.
4) Xa2 and Xa4 are able to influence the control of
vehicles for all modes (Y6).
5) Berth size (Zb) has most significant influence to labour
and machine utilization, material handling facilities
(Xa4) transportation and trucking efficiency.
Journal of Economics, Business and Management, Vol. 3, No. 4, April 2015
415
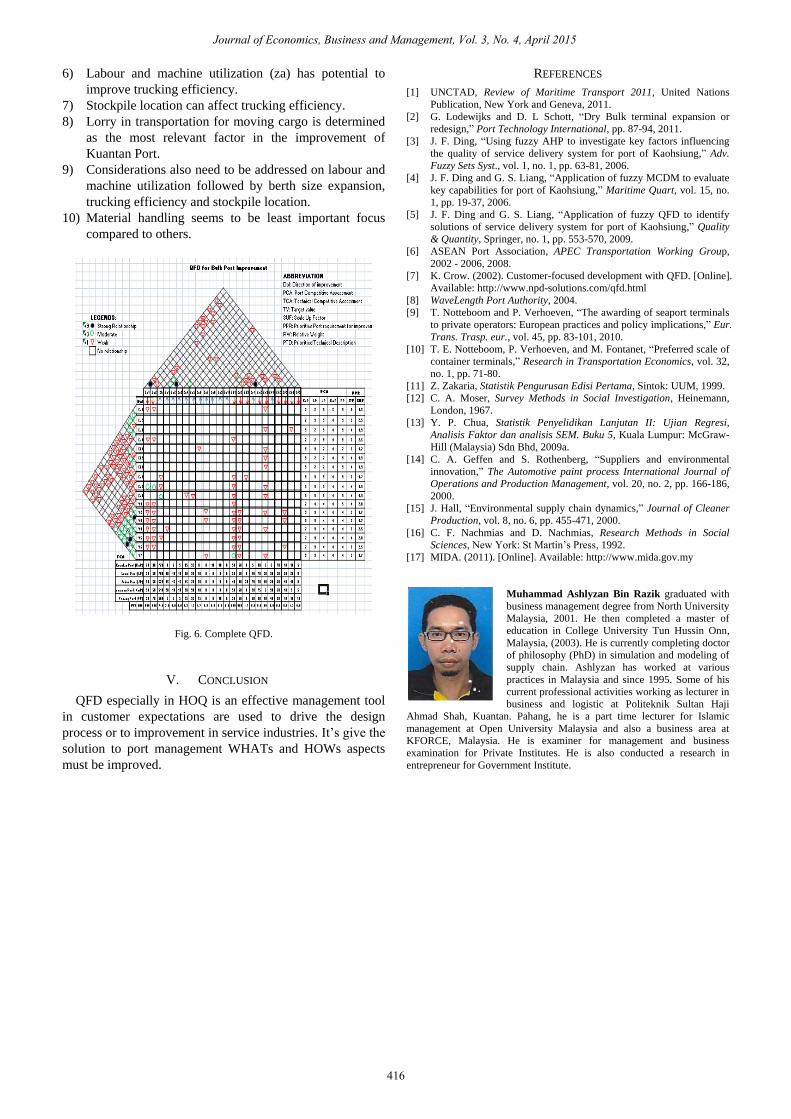
6) Labour and machine utilization (za) has potential to
improve trucking efficiency.
7) Stockpile location can affect trucking efficiency.
8) Lorry in transportation for moving cargo is determined
as the most relevant factor in the improvement of
Kuantan Port.
9) Considerations also need to be addressed on labour and
machine utilization followed by berth size expansion,
trucking efficiency and stockpile location.
10) Material handling seems to be least important focus
compared to others.
Fig. 6. Complete QFD.
V. CONCLUSION
QFD especially in HOQ is an effective management tool
in customer expectations are used to drive the design
process or to improvement in service industries. It‟s give the
solution to port management WHATs and HOWs aspects
must be improved.
Journal of Economics, Business and Management, Vol. 3, No. 4, April 2015
416
REFERENCES
[1] UNCTAD, Review of Maritime Transport 2011, United Nations
Publication, New York and Geneva, 2011.
[2] G. Lodewijks and D. L Schott, “Dry Bulk terminal expansion or
redesign,” Port Technology International, pp. 87-94, 2011.
[3] J. F. Ding, “Using fuzzy AHP to investigate key factors influencing
the quality of service delivery system for port of Kaohsiung,” Adv.
Fuzzy Sets Syst., vol. 1, no. 1, pp. 63-81, 2006.
[4] J. F. Ding and G. S. Liang, “Application of fuzzy MCDM to evaluate
key capabilities for port of Kaohsiung,” Maritime Quart, vol. 15, no.
1, pp. 19-37, 2006.
[5] J. F. Ding and G. S. Liang, “Application of fuzzy QFD to identify
solutions of service delivery system for port of Kaohsiung,” Quality
& Quantity, Springer, no. 1, pp. 553-570, 2009.
[6] ASEAN Port Association, APEC Transportation Working Group,
2002 - 2006, 2008.
[7] K. Crow. (2002). Customer-focused development with QFD. [Online].
Available: http://www.npd-solutions.com/qfd.html
[8] WaveLength Port Authority, 2004.
[9] T. Notteboom and P. Verhoeven, “The awarding of seaport terminals
to private operators: European practices and policy implications,” Eur.
Trans. Trasp. eur., vol. 45, pp. 83-101, 2010.
[10] T. E. Notteboom, P. Verhoeven, and M. Fontanet, “Preferred scale of
container terminals,” Research in Transportation Economics, vol. 32,
no. 1, pp. 71-80.
[11] Z. Zakaria, Statistik Pengurusan Edisi Pertama, Sintok: UUM, 1999.
[12] C. A. Moser, Survey Methods in Social Investigation, Heinemann,
London, 1967.
[13] Y. P. Chua, Statistik Penyelidikan Lanjutan II: Ujian Regresi,
Analisis Faktor dan analisis SEM. Buku 5, Kuala Lumpur: McGraw-
Hill (Malaysia) Sdn Bhd, 2009a.
[14] C. A. Geffen and S. Rothenberg, “Suppliers and environmental
innovation,” The Automotive paint process International Journal of
Operations and Production Management, vol. 20, no. 2, pp. 166-186,
2000.
[15] J. Hall, “Environmental supply chain dynamics,” Journal of Cleaner
Production, vol. 8, no. 6, pp. 455-471, 2000.
[16] C. F. Nachmias and D. Nachmias, Research Methods in Social
Sciences, New York: St Martin‟s Press, 1992.
[17] MIDA. (2011). [Online]. Available: http://www.mida.gov.my
Muhammad Ashlyzan Bin Razik graduated with
business management degree from North University
Malaysia, 2001. He then completed a master of
education in College University Tun Hussin Onn,
Malaysia, (2003). He is currently completing doctor
of philosophy (PhD) in simulation and modeling of
supply chain. Ashlyzan has worked at various
practices in Malaysia and since 1995. Some of his
current professional activities working as lecturer in
business and logistic at Politeknik Sultan Haji
Ahmad Shah, Kuantan. Pahang, he is a part time lecturer for Islamic
management at Open University Malaysia and also a business area at
KFORCE, Malaysia. He is examiner for management and business
examination for Private Institutes. He is also conducted a research in
entrepreneur for Government Institute.