
Structure and dynamics of electrorheological fluids
20
Structure and dynamics of electrorheological fluids James E. Martin and Judy Odinek Advanced Materials Physics Division, Sandia National Laboratories, Albuquerque, New Mexico 87185-1421 Thomas C. Halsey Exxon Research and Engineering, Route 22 East, Annandale, New Jersey 08801 Randall Kamien Department of Physics, University of Pennsylvania, Philadelphia, Pennsylvania 19104 ~Received 14 June 1996; revised manuscript received 26 December 1996! We have used two-dimensional light scattering to study the structure and dynamics of a single-scattering electrorheological fluid in the quiescent state and in steady and oscillatory shear. Studies of the quiescent fluid show that particle columns grow in two stages. Particles first chain along the electric field, causing scattering lobes to appear orthogonal to the field, and then aggregate into columns, causing the scattering lobes to move to smaller angles. Column formation can be understood in terms of a thermal coarsening model we present, whereas the early-time scattering in the direction parallel to the field can be compared to the theory of line liquids. In simple shear the scattering lobes are inclined in the direction of fluid vorticity, in detailed agreement with the independent droplet model of the shear thinning viscosity. In oscillatory shear the orientation of the scattering lobes varies nonsinusoidally. This nonlinear dynamics is described by a kinetic chain model, which provides a theory of the nonlinear shear rheology in arbitrary shear flows. @S1063-651X~97!10112-X# PACS number~s!: 47.50.1d I. INTRODUCTION Electrorheological ~ER! fluids @1,2# are made by suspend- ing particles in a liquid whose dielectric constant or conduc- tivity @3–5# is mismatched in order to create dipolar particle interactions in the presence of an ac or a dc electric field. ER fluids rapidly solidify, or at least increase their viscosity dra- matically, in response to an electric field, due to the forma- tion of particle chains that bridge the electrodes. The milli- second response of ER fluids has piqued the interest of engineers, who are now trying to incorporate these fluids into practical fast electromechanical actuators, such as fiber spin- ning clutches and active shock absorbers. To predict the behavior of ER fluid-based devices a de- signer must have a good understanding of the both the so- lidification kinetics and the response of the activated fluid to mechanical stress, especially when flow is induced. We have previously reported preliminary light-scattering studies of the evolution of structure in a quiescent fluid @6#, the steady- state structures that form in shear @7#, and the nonlinear dy- namics of chain structures in oscillatory shear @8#. In this paper we extend those investigations and give a complete account of the light-scattering studies we have made as well as the theoretical ideas that can be invoked to understand the data. The first experiments we report concern the evolution of structure after an electric field is applied to a quiescent ER fluid. This occurs in two principal phases: the fast aggrega- tion of particles into chains, which occurs in milliseconds, and the slow coalescence of chains into columns, which oc- curs in minutes. Chain formation has been studied by time- resolved studies of the transmission of light through an opaque ER fluid @9#, birefringence and dichroism @10#, and fluid permittivity @11#. The light-scattering measurements we report compliment these measurements since they allow de- termination of the slow column formation as well. In the Halsey-Toor theory of column formation @12# it is shown that after particle chains form and span the electrodes, the long-range dipolar interactions between vicinal chains are screened by the image dipoles created by the conducting electrodes and the chains then interact via a short-ranged potential that arises from one-dimensional Landau-Peierls charge-density fluctuations. The chains then coalesce in the plane orthogonal to the field to form a three-dimensional solid @13#. Our measurements of the power-law growth of columns as a function of applied voltage and fluid concen- tration support this general description of coarsening, but the observed voltage dependence has led to the consideration of the case wherein column coalescence occurs before a charge- density fluctuation can relax. The anisotropic ‘‘bow tie’’ light-scattering pattern we ob- serve is similar in appearance to that predicted by the theory of line liquids. By analyzing our data in ways suggested by this theory we show that there is a strong correspondence of the predictions of line liquid theory to scattering data taken shortly after the quench. For completeness we mention that within the columns the colloids eventually form a crystalline solid @13# that recent calculations show is body-centered tetragonal @14#. This bct structure has been observed in a laser diffraction experiment from a column of large silica spheres @15#. Of course, a glassy structure may result from a rapid, deep quench. When an initially quiescent ER fluid is subjected to steady or oscillatory shear, the electrode-spanning columns break into volatile structures that continuously fragment and aggre- gate, and generally tilt away from strict field alignment in the direction of fluid vorticity. There are two fundamentally dif- ferent theoretical models of structure and rheology in shear: PHYSICAL REVIEW E JANUARY 1998 VOLUME 57, NUMBER 1 57 1063-651X/98/57~1!/756~20!/$15.00 756 © 1998 The American Physical Society
Transcript of Structure and dynamics of electrorheological fluids

PHYSICAL REVIEW E JANUARY 1998VOLUME 57, NUMBER 1
Structure and dynamics of electrorheological fluids
James E. Martin and Judy OdinekAdvanced Materials Physics Division, Sandia National Laboratories, Albuquerque, New Mexico 87185-1421
Thomas C. HalseyExxon Research and Engineering, Route 22 East, Annandale, New Jersey 08801
Randall KamienDepartment of Physics, University of Pennsylvania, Philadelphia, Pennsylvania 19104
~Received 14 June 1996; revised manuscript received 26 December 1996!
We have used two-dimensional light scattering to study the structure and dynamics of a single-scatteringelectrorheological fluid in the quiescent state and in steady and oscillatory shear. Studies of the quiescent fluidshow that particle columns grow in two stages. Particles first chain along the electric field, causing scatteringlobes to appear orthogonal to the field, and then aggregate into columns, causing the scattering lobes to moveto smaller angles. Column formation can be understood in terms of a thermal coarsening model we present,whereas the early-time scattering in the direction parallel to the field can be compared to the theory of lineliquids. In simple shear the scattering lobes are inclined in the direction of fluid vorticity, in detailed agreementwith the independent droplet model of the shear thinning viscosity. In oscillatory shear the orientation of thescattering lobes varies nonsinusoidally. This nonlinear dynamics is described by a kinetic chain model, whichprovides a theory of the nonlinear shear rheology in arbitrary shear flows.@S1063-651X~97!10112-X#
PACS number~s!: 47.50.1d
-ucleEaa
illitinp
dest
ao
lewd
oEgasoe
a
e
de-
des,insctingged
erlsthe
nalofen-then of
arge-
-orybye ofen
the
ent
dyeakre-
hef-ar:
I. INTRODUCTION
Electrorheological~ER! fluids @1,2# are made by suspending particles in a liquid whose dielectric constant or condtivity @3–5# is mismatched in order to create dipolar particinteractions in the presence of an ac or a dc electric field.fluids rapidly solidify, or at least increase their viscosity drmatically, in response to an electric field, due to the formtion of particle chains that bridge the electrodes. The msecond response of ER fluids has piqued the interesengineers, who are now trying to incorporate these fluidspractical fast electromechanical actuators, such as fiber sning clutches and active shock absorbers.
To predict the behavior of ER fluid-based devices asigner must have a good understanding of the both thelidification kinetics and the response of the activated fluidmechanical stress, especially when flow is induced. We hpreviously reported preliminary light-scattering studiesthe evolution of structure in a quiescent fluid@6#, the steady-state structures that form in shear@7#, and the nonlinear dy-namics of chain structures in oscillatory shear@8#. In thispaper we extend those investigations and give a compaccount of the light-scattering studies we have made asas the theoretical ideas that can be invoked to understandata.
The first experiments we report concern the evolutionstructure after an electric field is applied to a quiescentfluid. This occurs in two principal phases: the fast aggretion of particles into chains, which occurs in millisecondand the slow coalescence of chains into columns, whichcurs in minutes. Chain formation has been studied by timresolved studies of the transmission of light throughopaque ER fluid@9#, birefringence and dichroism@10#, andfluid permittivity @11#. The light-scattering measurements w
571063-651X/98/57~1!/756~20!/$15.00
-
R---oftoin-
-o-ovef
teellthe
fR-
,c--
n
report compliment these measurements since they allowtermination of the slow column formation as well.
In the Halsey-Toor theory of column formation@12# it isshown that after particle chains form and span the electrothe long-range dipolar interactions between vicinal chaare screened by the image dipoles created by the conduelectrodes and the chains then interact via a short-ranpotential that arises from one-dimensional Landau-Peicharge-density fluctuations. The chains then coalesce inplane orthogonal to the field to form a three-dimensiosolid @13#. Our measurements of the power-law growthcolumns as a function of applied voltage and fluid conctration support this general description of coarsening, butobserved voltage dependence has led to the consideratiothe case wherein column coalescence occurs before a chdensity fluctuation can relax.
The anisotropic ‘‘bow tie’’ light-scattering pattern we observe is similar in appearance to that predicted by the theof line liquids. By analyzing our data in ways suggestedthis theory we show that there is a strong correspondencthe predictions of line liquid theory to scattering data takshortly after the quench.
For completeness we mention that within the columnscolloids eventually form a crystalline solid@13# that recentcalculations show is body-centered tetragonal@14#. This bctstructure has been observed in a laser diffraction experimfrom a column of large silica spheres@15#. Of course, aglassy structure may result from a rapid, deep quench.
When an initially quiescent ER fluid is subjected to steaor oscillatory shear, the electrode-spanning columns brinto volatile structures that continuously fragment and agggate, and generally tilt away from strict field alignment in tdirection of fluid vorticity. There are two fundamentally diferent theoretical models of structure and rheology in she
756 © 1998 The American Physical Society

leoiher,mpcharsiino
ticashcon
m
uilonifto
o
inw
cimnts
deor,urnttho
og
we-
asil
tanal.5lo
hethe
he
re-ely
in atsus-fi-
eas-
ons
dius-t ofle
riza-
tro-Zeeob-ap-edi-le tohighob-ne,cles
34h-ics.5-
ficbe-
bil-aleti-that
isro-
totec-ed able
cmighty aeo
57 757STRUCTURE AND DYNAMICS OF . . .
the equilibrium droplet model@16# and thekinetic chainmodel@17#. In both of these models we use the point dipoapproximation, which is reasonably accurate for our colldal silica fluid, which has negative dielectric contrast. In tdroplet model, which was developed for stationary sheafree energy is minimized in order to compute the equilibriusize, shape, and orientation of particle structures that aresumed to be ellipsoidal. In the kinetic chain model, whican be applied to both stationary and non-stationary shemechanical stability condition determines the metastableand orientation of structures that are presumed to be chaThe predictions of these models are contrasted as we cpare them to our light-scattering data.
Light-scattering measurements in steady shear@7# showhow the steady-state size and orientation of these parstructures depends on the shear rate, with the size decreand the tilt angle increasing as the shear rate increases. Tchanges are responsible for the shear thinning of the visity of ER fluids @16#. We have extended these measuremeto include the voltage dependence.
We report light-scattering studies of the structural dynaics in oscillatory shear flow. These measurements shouldof special interest to those interested in modeling the flstress response to nonstationary shear flows. Direct rheocal studies@18,19# have been complicated by the difficulty ifinding a linear-response regime. It has been shown thatstrict linear viscoelastic regime exists at all, it is confinedstrain amplitudes smaller than 1022. Thus the framework oflinear viscoelasticity, a phase-shifted stress in response tapplied strain, is of limited utility for ER fluids. Powell@20#has presented rheological data that demonstrate the nonlnature of the stress response and these agree quite wellthe light-scattering data we present here.
In our measurements of the orientation dynamics in oslatory shear we find a quasilinear response regime at sstrain amplitudes and are able to determine experimeconditions where the droplet orientation is in or out of phawith the strain. This quasilinear regime is successfullyscribed by the independent droplet model, wherein the drlet size does not change during a shear cycle. Howevestrain amplitudes larger than about 0.25, chain volatility ding a single strain cycle becomes significant and the orietion dynamics becomes strongly nonlinear. In this regimekinetic chain model gives a very reasonable descriptionthe observed dynamics and agrees well with direct rheolcal measurements@20# of the stress.
II. EXPERIMENT
A. Sample preparation
The sample used in this study is a model ER fluiddeveloped for light scattering@6#, microscopy, and electrorheological measurements@16#. The colloids in our modelfluid are synthesized by the base-catalyzed nucleationgrowth of monodisperse silica spheres from tetraethoxycon ~TEOS!. To reduce the Keesom interactions that leadaggregation, this synthesis was conducted in a mixed orgsolvent that index matches the growing spheres. Specificto prepare a 200-ml solution we combine 21.2 ml of 29wt. % NH3 with 39.2 ml of formamide, 117.2 ml of benzyalcohol, and 22.4 ml TEOS. The solution is mixed but n
-
a
re-
, azes.
m-
leingeses-ts
-bedgi-
a
an
earith
l-allale-
p-at-a-efi-
ndi-oic
ly,-
t
shaken and allowed to react without stirring for 2 h. Thydrophilic silica spheres are then coated with 5.0 ml oforganophilic silane coupling agent 3-~trimethoxysilyl! propylmethacrylate via a condensation reaction@21#. After a 24-hvacuum distillation of water and ammonia at 50 °C tspheres are centrifuged at low acceleration~;35 g for 7 h,the supernatant decanted, and the soft colloidal solid isdispersed in 4-methylcyclohexanol, again chosen to closindex match the spheres. The sample is centrifuged aga35 g for 16 h, the supernatant decanted, and the solid repended in 4-methylcyclohexanol. To prevent settling thenal sample is rotated slowly until used.
Scanning electron microscopy and elastic and quasieltic light-scattering measurements indicate that 0.7-mm-diamsilica spheres are easily formed at high silica concentratiunder mild hydrolysis with 0.5M NH4OH. The elastic light-scattering data are consistent with a Gaussian sphere raR distribution havingsR /R of 10.5%. Light-scattering intensity measurements indicate a refractive index incremendn/dc50.0017 ml/g, which is small enough to ensure singscattering from concentrated dispersions: Indeed, depolation of the scattered light was negligible.
To measure the surface charge of the colloids, elecphoresis measurements were made in a Pen Kem Lasermicroelectrophoresis apparatus. Since we were unable toserve any electrophoresis with this apparatus we simplyplied a 1-kV/mm electric field to the particles and observtheir behavior through a Nikon Microphot-FXA optical mcroscope. Even at these high electric fields we were unabobserve electrophoresis of these particles, although atapplied frequencies field-induced particle chaining wasserved and found to be reversible by Brownian motion aloindicating that contact interactions between these partiare much smaller thankBT.
The two samples used in the study measured 20 andwt. % by thermal gravimetric analysis, although the higconcentration sample was diluted to 11 wt. % for the kinetstudies. The fluid used in the oscillatory shear study is 7wt. % silica, which is 3.0 vol %, assuming a silica specigravity of 2.5. This corresponds to a mean separationtween silica sphere centers of;6R and a spacing of;11Rbetween initially formed chains.
B. Two-dimensional light scattering
To study the kinetics of phase separation requires the aity to determine structure as a function of time. Traditionone-dimensional light-scattering instruments must reptively scan through a sequence of angles, with the resultdata are acquired in an interval during which the structureevolving, so that temporal resolution is severely compmised. Furthermore, the ER phase transition gives riseanisotropic scattering and therefore a two-dimensional detor is required. To meet these demands we have developlight-scattering instrument that is based on readily availavideo and computer technology.
A 454.5-nm argon-ion laser beam, focused with a 40-focal length lens, illuminates the sample, the scattered limpinges on an opaque diffusing screen, is collected bfixed-gain Pulnix video camera, and is stored on a vidcassette recorder at a spatial resolution of 6403480. The

t-bshfeovethe
it
e-
rgthreteeeseercath
ngro
nter
ela
tiogh
ishce
zi
atotre
wenetr
edeasececortr
mi-lim-
aor.t of
ap-m,an
n-l totor.by
scat-s a
locksm.the
andea-re-
t an
ch,uc-e
me
eical
sld,at iso-in
758 57MARTIN, ODINEK, HALSEY, AND KAMIEN
video frames are then grabbed from the tape and eighdigitized by a Perceptics PixelBuffer card on a MacintoQuadra 950. The frame grabber card immediately transthese images to a 32-Mbyte dual-ported PixelStore memboard that resides on both the slow computer bus and afast direct bus from the frame grabber that can supportdata transfer rate of 10 Mbyte/s. The digitized images havdynamic range of 256, a spatial resolution of 5123480, anda temporal resolution of130 s.
The length scale regime that can be studied w454.5-nm light is from 2p/q522 to 0.95 mm, where q54p sin(u/2)/l is the scattering wave vector,u is the scat-tering angle, andl is the wavelength in the scattering mdium.
The scattered light that ultimately arrives at the chacoupled device array is not the true scattered intensityemerges from the scattering volume. In fact, the measuscattered intensity increasingly underestimates the true insity as the scattering angle increases. The loss of scattlight is due to a number of causes and although each of this small, they combine to give a correction factor of almotwo at the highest measured wave vector, relative to zangle. We correct for the incident polarization of the lasthe polarization and incident-angle-dependent cell and stering screen reflectances, the angular distribution ofemerging light from the diffusing screen, camera vignettithe Jacobian for light refraction, and the Jacobian of the pjection of a sphere onto a flat screen~twice!.
We calculate each of these corrections analytically aapply these to a 5123480 constant intensity image to creaa 5123480 ‘‘template.’’ Each scattering image was then corected by multiplying by the template on a pixel-by-pixbasis. Calibration runs with a uniform scatterer yieldedessentially constant scattering image after these correcwere applied, with only a small drop in the intensity at hiq.
C. Scattering cells
The scattering cell for the quiescent fluid studies consof a black nylatron body with a cylindrical cavity into whic1.0-mm-diam black anodized cylindrical aluminum eletrodes were threaded. Flat glass microscope slides wpressed against rubberO rings to provide a seal. A 12.0-kHsine wave was applied to the 0.72-mm electrode gap toduce particle chaining.
The scattering cell for the shear studies consists ofinner ~4032!-mm flat circular electrode that is concentrica 42-mm hole in an outer electrode, creating a radial elecfield in a 1.0-mm gap. The outer electrode is sandwichbetween plastic and both electrodes are embedded betglass plates, with a fluid-filled 2.0-mm gap between the incircular electrode and each glass plate. The radial elecfield is parallel to the shear gradient in the fluid.
For the steady shear studies a dc servo motor was usdrive a pulley on the inner electrode. In the oscillatory shstudies the inner electrode was caused to oscillate sinudally by a long rod connected to a 25-mm lever on the eltrode shaft, which is driven open loop by an adjustablecentric shaft on a powerful 300-oz-in. microstepping motThe strain amplitude can be varied by adjusting the eccen
it
rsryryea
h
eatdn-
redsetro,t-e,-
d
-
nns
ts
-re
n-
n
icdenric
tor
oi---.ic
and the strain frequency can be varied by adjusting thecrostepping controller speed. The detector response timeits the maximum frequency to;1 Hz.
The electric field is supplied by a square wave fromTrek power supply driven by Wavetek signal generatVoltages are reported peak to peak. The dielectric constan4-methylcyclohexanol is 13.5 and silica is;4.
D. Strain phase determination
One problem in this experiment is the phasing of theplied strain with the scattering data. To solve this problewe devoted a small corner of the scattering screen tooptical ‘‘strain phase clock.’’ This clock was created by runing a second pulley, whose rotational axis is orthogonathe scattering screen, synchronously with the stepping moInside this second pulley is mounted a prism that deflectsseveral degrees a He-Ne laser beam directed toward thetering screen. As the pulley turns, the laser beam scribesmall circle on the scattering screen. The strain phase ccan be set by means of a rotational adjustment of the priEach image thus contains both the scattering data andabsolute strain phase.
III. QUIESCENT FLUID
The first measurements we report concern the growthstructure of the fluid in the quiescent state. Preliminary msurements of the structure orthogonal to the field wereported earlier@6#, here we extend those results and presenanalysis of the structure parallel to the field.
A. Domain structure orthogonal to the field
Scattering data taken shortly after an electric-field quenshown in Fig. 1, demonstrate an unstable concentration fltuation orthogonal to the electric-field lines in the fluid. Thtwo scattering lobes have an intensity maximum at so
FIG. 1. Within milliseconds of an electric-field quench into thtwo-phase region the scattered intensity from an electrorheologfluid shows two distinct lobes~the maximum scattering angle i;8° here!. These lobes, which are orthogonal to the electric fieindicate the presence of an unstable concentration fluctuation thdue to column formation. This scattering pattern is the twdimensional analog of the ‘‘spinodal ring’’ commonly observedthe first-order phase separation of three-dimensional systems.
nto
g.gu
enag
oi
nthrinb
el tsbehe
t
aiintwa
teioinng
ruc-insir
wo-ruc-hat. In
cethattal
o-and
ling
-ize-pin-
thim
pa
sitytherve,
s-scat-
of a
57 759STRUCTURE AND DYNAMICS OF . . .
nonzero wave vector, indicating strong spatial correlatiobetween initially formed chains in the plane orthogonalthe field. The scattering patterns fades when the fieldturned off, indicating the reversibility of particle chainin~The Bragg scattering one would expect from chains of relarly spaced particles is at values ofq larger than observablewith our instrument, but can be seen on the image scre!Reversible chaining is also observed in direct optical iming.
The distinctive scattering lobes are superficially the twdimensional counterpart to the spinodal ring observedthree-dimensional systems and thus compel a comparisothis model. In fact, if the laser beam is directed alongfield lines, by using transparent electrodes, a scatteringcan be observed. We will show that more information canobtained in our scattering geometry.
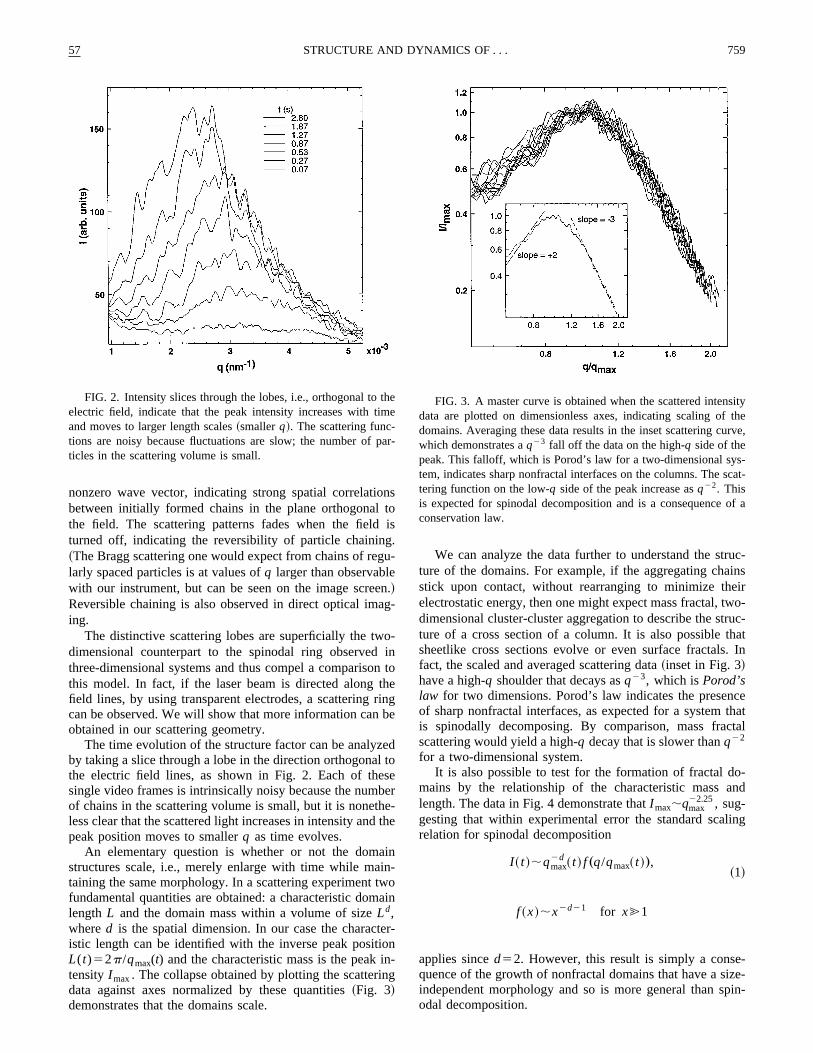
The time evolution of the structure factor can be analyzby taking a slice through a lobe in the direction orthogonathe electric field lines, as shown in Fig. 2. Each of thesingle video frames is intrinsically noisy because the numof chains in the scattering volume is small, but it is nonetless clear that the scattered light increases in intensity andpeak position moves to smallerq as time evolves.
An elementary question is whether or not the domstructures scale, i.e., merely enlarge with time while mataining the same morphology. In a scattering experimentfundamental quantities are obtained: a characteristic domlength L and the domain mass within a volume of sizeLd,whered is the spatial dimension. In our case the characistic length can be identified with the inverse peak positL(t)52p/qmax(t) and the characteristic mass is the peaktensityI max. The collapse obtained by plotting the scatteridata against axes normalized by these quantities~Fig. 3!demonstrates that the domains scale.
FIG. 2. Intensity slices through the lobes, i.e., orthogonal toelectric field, indicate that the peak intensity increases with tand moves to larger length scales~smallerq!. The scattering func-tions are noisy because fluctuations are slow; the number ofticles in the scattering volume is small.
s
is
-
.-
-nto
ege
doer-he
n-oin
r-n-
We can analyze the data further to understand the stture of the domains. For example, if the aggregating chastick upon contact, without rearranging to minimize theelectrostatic energy, then one might expect mass fractal, tdimensional cluster-cluster aggregation to describe the stture of a cross section of a column. It is also possible tsheetlike cross sections evolve or even surface fractalsfact, the scaled and averaged scattering data~inset in Fig. 3!have a high-q shoulder that decays asq23, which isPorod’slaw for two dimensions. Porod’s law indicates the presenof sharp nonfractal interfaces, as expected for a systemis spinodally decomposing. By comparison, mass fracscattering would yield a high-q decay that is slower thanq22
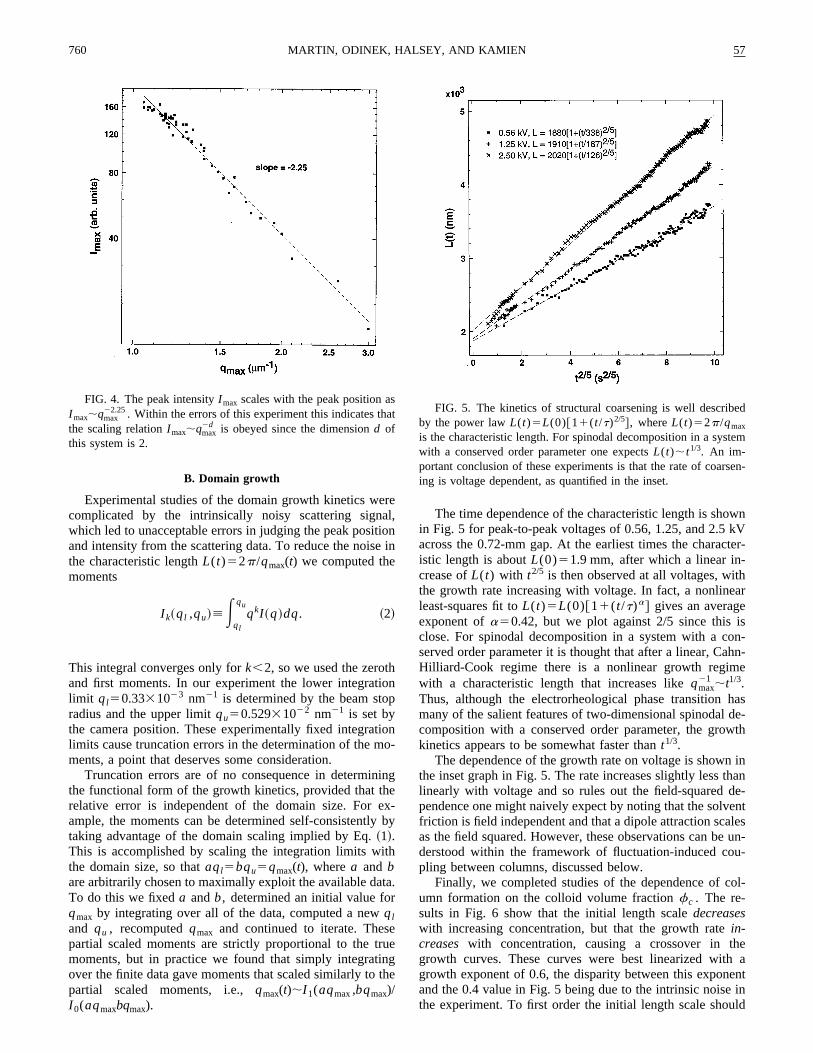
for a two-dimensional system.It is also possible to test for the formation of fractal d
mains by the relationship of the characteristic masslength. The data in Fig. 4 demonstrate thatI max;qmax
22.25, sug-gesting that within experimental error the standard scarelation for spinodal decomposition
I ~ t !;qmax2d ~ t ! f „q/qmax~ t !…,
~1!
f ~x!;x2d21 for x@1
applies sinced52. However, this result is simply a consequence of the growth of nonfractal domains that have a sindependent morphology and so is more general than sodal decomposition.
ee
r-
FIG. 3. A master curve is obtained when the scattered intendata are plotted on dimensionless axes, indicating scaling ofdomains. Averaging these data results in the inset scattering cuwhich demonstrates aq23 fall off the data on the high-q side of thepeak. This falloff, which is Porod’s law for a two-dimensional sytem, indicates sharp nonfractal interfaces on the columns. Thetering function on the low-q side of the peak increase asq22. Thisis expected for spinodal decomposition and is a consequenceconservation law.
raltioe
hiop
tioo
inheexy
ith
tar
erungth
wnkVter-
har
ison-hn-e
hasde-wth
n inhande-entlesun-
u-
ol-
heh aentin
uld
sat ed
tem
sen-
760 57MARTIN, ODINEK, HALSEY, AND KAMIEN
B. Domain growth
Experimental studies of the domain growth kinetics wecomplicated by the intrinsically noisy scattering signwhich led to unacceptable errors in judging the peak posiand intensity from the scattering data. To reduce the noisthe characteristic lengthL(t)52p/qmax(t) we computed themoments
I k~ql ,qu
ler tai
oo
dbo
ort
thi
e
ofow
af
is
e
be-le ofe
-rce
byrce
-
the
for
e
to
ts
idoseThe
me-theenthat
un
thau
tfntt;
57 761STRUCTURE AND DYNAMICS OF . . .
decrease as 1/fc1/2, the mean separation between sing
chains that span the electrodes, and the data roughly beaout. The faster growth rate occurs because closer ch‘‘feel’’ a greater attraction.
C. Thermal theory of coarsening
The roughly linear dependence of the coarsening rateelectric field and the approximately root time dependencethe length scale of the condensed phase can be accountesemiquantitatively if we suppose that coarsening is driventhermally generated dipole moments. The electric fieldperfectly ordered chains or columns of dipoles is shranged, decaying exponentially as one moves away fromcolumn in a transverse direction, with a range that is oforder of magnitude of the lattice spacing of the particlesthe column. However, chains or columns of dipoles aresentially one-dimensional solids and are thus subjectstrong Landau-Peierls fluctuations. If the phonon field~lon-gitudinal or transverse! of a column isu(k), with k the wavevector along the column, then equipartition implies that@22#
uu~k!u2;kBT
b2E2R3 , ~3!
where R is the radius of the column andb2E2R3 is theenergy scale for density fluctuations of the column.
These density fluctuations lead to the appearancefluctuating electric field near the column. It is easy to shthat this electric field is of the order of magnitude@12#
FIG. 6. The coarsening kinetics was also determined as a ftion of the initial particle volume fraction~the legend gives thecolloid concentration in wt. %!. As expected, the initial columnspacingL(0) decreases with increasing concentration, whereascolumn growth rate increases with increasing concentration, cing a crossover in the growth curves. The best power-law fitthese data isL(t)5L(0)@11(t/t)3/5#. This coarsening exponent o3/5 is greater than the value of 2/5 obtained in our first experimeThis variation is due to the large intrinsic noise in the experimenrealistic estimate of the growth exponent is 0.560.1.
hisns
nfforyft
heens-to
a
^E2&;kBTR
r4 ~4!
at a transverse distancer from the column. Thus there isfluctuating forceEdip per unit length between columns oradius R separated by a distancer, which may be eitherattractive or repulsive and is of the order of magnitude
Fdip;AkBTbER3/5
r3 ~5!
since the dipole moment per unit length of a columnbER2.
The dominant force for columns separated by a distancrcomes from fluctuations withk;r21, thus the coherencelength of these fluctuations will be;r. Now adjacent sec-tions of lengthr, which will be pulled in different directionsby this force, cannot move independently of one anothercause there is a strong restoring force, on the energy scab2E2R3, which keeps the columns parallel to the field. Wdo expect, however, that sections of lengthj@r can moveindependently, wherej is determined by balancing this restoring force with the statistical average of the thermal fofor a column of lengthj. We thus conclude thatj satisfies
AjrFdip;b2E2R3S r
j2D , ~6!
which leads immediately toj;r(l/f)1/5.The time scale for the columns to be drawn together
this force can be obtained by balancing this thermal fo~for a column of lengthj! against the viscous forceFvis;Cm0vj, wherem0 is the solvent viscosity,v is the veloc-ity of the column, andC is a drag coefficient at most logarithmically dependent onR @23#. We thereby obtain a colli-sion time
tc;m0r3/2Cl1/10
AkBTbEf27/20. ~7!
We should compare this time to the coherence time offluctuations of the dipole moment on a scalek5r21. By thefluctuation-dissipation theorem we expect that the timethese fluctuations to dissipate ist f;1/Dk2, where D;kBT/m0R is a characteristic diffusion coefficient for thparticles@24#. We thus conclude that for largel we willhavet f@tc and the fluctuations will persist long enoughdrive coarsening. We now obtain the estimate
r~ t !;~At!5/9, ~8!
with A;(bE)4/5, in qualitative agreement with the resulabove.
We conclude that the evolution of structure in an ER fluproceeds by an unstable concentration fluctuation whcharacteristic size scale increases with a power of time.observed growth exponent of 0.560.1 is slightly larger thanthe 1/3 value expected for spinodal decomposition and sowhat smaller than the 5/9 value predicted by extendingHalsey-Toor theory to account for electric-field-dependfluctuations in interchain interactions. However, the fact t
c-
es-o
s.a

ito.
re
th-red
sen
tthdi-e
t
ea
nlothte
ni-trv
ring. Am-
nthaton
veo
ea
e
ng.
scalee inding
762 57MARTIN, ODINEK, HALSEY, AND KAMIEN
the characteristic growth rate increases almost linearly wthe field is further evidence that the modified Halsey-Totheory accounts for the structural evolution in this system
D. Structure parallel to the field
We have thus far limited our discussion to the scatteintensity as a function of the wave vectorq' in the directionparallel to the scattering lobes, which is perpendicular toelectric field. Nelson and Seung@25# have studied the statistical mechanics of line liquids and have noted a strikingsemblance of the shape of our scattering images to pretions for line liquids. In this section we explore theconnections quantitatively. Before we start our discussiois useful to examine Fig. 7 to see how a wave vectorqi thatis parallel to the applied field for each value ofq' is defined.
There are several experimental issues to address. Isshape of the scattering lobes scale invariant? How doeswidth of a scattering lobe vary along its length? What isfunctional form of the scattered intensity in the parallelrection, that is,I (qi ,q'5c)? We will examine each of thesissues experimentally and then will compare our resultstheory.
The first issue we will investigate is the variation of thscattering width parallel to the field as a function of the sctering wave vectorq' . To do this it is useful to define theparallel moment
^qi1/2&5E
0
`
qi1/2I ~qi ,q'!dqiY E
0
`
I ~qi ,q'!dqi .
We have chosen to work with root moment to eliminate covergence problems with the integrals, as the intensity falis expected to be Lorentzian in the direction parallel tofield. The results are shown in Fig. 8 for a sample subjecto a 0.56-kV/mm field at various aging times. A deep mimum in the width of the scattering function is observed avalue of q' that decreases with time and a master cuappears to be developing for values ofq' past the minimum.The minimum scattering width occurs at the value ofq' thatmaximizes the scattered intensityI (qi50,q') and this valueof q' is proportional to the moment^q'& defined previously.
FIG. 7. This diagram shows the definition of scattering wavectorsqi and q' used to describe the detailed shape of the twdimensional scattering function. The contour lines are from rscattering data.
hr
d
e
-ic-
it
thehee
o
t-
-ffed
ae
We can determine whether the shape of the scattefunction, hence the column structure, is scale invariantscale-invariant scattering function will have a minimuwidth ^qi
1/2&2 proportional to the peak position. It is convenient to define the lengthL i52p/^qi
1/2&2 and determine ifthis is proportional to our previously defined lengthL' .Data for a fluid subjected to a 0.56-kV/mm field are showin Fig. 9. Despite the noise these data convincingly showL i}L' . Similar results are obtained at larger fields, so
-l
FIG. 8. The width of the scattering lobe in theqi direction is aminimum at the value ofq' where the intensity is a maximum. Thscattering width is apparently time independent for values ofq'
.q',max. The solid lines are the data smoothed by Fourier filteri
FIG. 9. The lengthL' is proportional toL i , indicating that theshape of the scattering data, and thus the domain structure, isindependent. Note that there is roughly a one-decade differenclength scales, however, with correlations along the chains extenmuch further.
n
t-
t.is
eekT
the
uldewa
erein
Ro
dsle
bto
ity
n.er,
-et
thehes,a
nd
g
ise
e
the
57 763STRUCTURE AND DYNAMICS OF . . .
experimental grounds we conclude that the scattering fution and column structure are scale invariant.
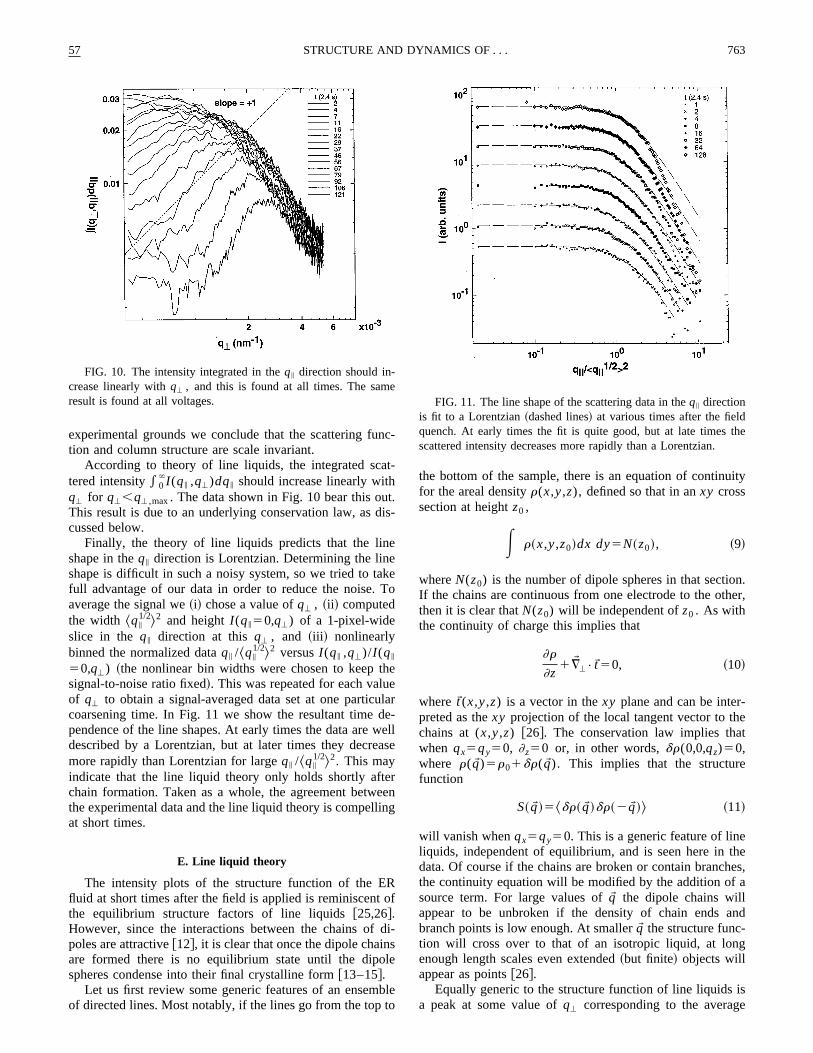
According to theory of line liquids, the integrated scatered intensity* 0
`I (qi ,q')dqi should increase linearly withq' for q',q',max. The data shown in Fig. 10 bear this ouThis result is due to an underlying conservation law, as dcussed below.
Finally, the theory of line liquids predicts that the linshape in theqi direction is Lorentzian. Determining the linshape is difficult in such a noisy system, so we tried to tafull advantage of our data in order to reduce the noise.average the signal we~i! chose a value ofq' , ~ii ! computedthe width ^qi
1/2&2 and heightI (qi50,q') of a 1-pixel-wideslice in the qi direction at thisq' , and ~iii ! nonlinearlybinned the normalized dataqi /^qi
1/2&2 versusI (qi ,q')/I (qi
50,q') ~the nonlinear bin widths were chosen to keepsignal-to-noise ratio fixed!. This was repeated for each valuof q' to obtain a signal-averaged data set at one particcoarsening time. In Fig. 11 we show the resultant timependence of the line shapes. At early times the data aredescribed by a Lorentzian, but at later times they decremore rapidly than Lorentzian for largeqi /^qi
1/2&2. This mayindicate that the line liquid theory only holds shortly aftchain formation. Taken as a whole, the agreement betwthe experimental data and the line liquid theory is compellat short times.
E. Line liquid theory
The intensity plots of the structure function of the Efluid at short times after the field is applied is reminiscentthe equilibrium structure factors of line liquids@25,26#.However, since the interactions between the chains ofpoles are attractive@12#, it is clear that once the dipole chainare formed there is no equilibrium state until the dipospheres condense into their final crystalline form@13–15#.
Let us first review some generic features of an ensemof directed lines. Most notably, if the lines go from the top
FIG. 10. The intensity integrated in theqi direction should in-crease linearly withq' , and this is found at all times. The samresult is found at all voltages.
c-
-
eo
e
ar-
ellse
eng
f
i-
le
the bottom of the sample, there is an equation of continufor the areal densityr(x,y,z), defined so that in anxy crosssection at heightz0 ,
E r~x,y,z0!dx dy5N~z0!, ~9!
whereN(z0) is the number of dipole spheres in that sectioIf the chains are continuous from one electrode to the oththen it is clear thatN(z0) will be independent ofz0 . As withthe continuity of charge this implies that
]r
]z1¹W'• tW50, ~10!
where tW(x,y,z) is a vector in thexy plane and can be interpreted as thexy projection of the local tangent vector to thchains at (x,y,z) @26#. The conservation law implies thawhen qx5qy50, ]z50 or, in other words,dr(0,0,qz)50,where r(qW )5r01dr(qW ). This implies that the structurefunction
S~qW !5^dr~qW !dr~2qW !& ~11!
will vanish whenqx5qy50. This is a generic feature of lineliquids, independent of equilibrium, and is seen here indata. Of course if the chains are broken or contain brancthe continuity equation will be modified by the addition ofsource term. For large values ofqW the dipole chains willappear to be unbroken if the density of chain ends abranch points is low enough. At smallerqW the structure func-tion will cross over to that of an isotropic liquid, at lonenough length scales even extended~but finite! objects willappear as points@26#.
Equally generic to the structure function of line liquidsa peak at some value ofq' corresponding to the averag
FIG. 11. The line shape of the scattering data in theqi directionis fit to a Lorentzian~dashed lines! at various times after the fieldquench. At early times the fit is quite good, but at late timesscattered intensity decreases more rapidly than a Lorentzian.

ides
ththgat
hem
evw
lio
n-ly
ssfont
ia
in
re
h
,
orc
m.onghe
ng
dthere
uc-nd
ica
lt2/3thehisrop-fieldise,for
n-ri-ki-
ag-es,ernthe. 13.of
e-cionsave
764 57MARTIN, ODINEK, HALSEY, AND KAMIEN
interchain spacing. This is simply due to the incipient liquor crystalline order that will emerge at lower temperaturAgain, the data show these peaks.
To consider the dynamics of the coarsening, we notethe chains form almost immediately. Thus we can viewcoarsening of the dipole fluid as the coarsening of a linesuddenly quenched into the crystal phase and ignorecomplication of chain formation. Note that although tnumber of dielectric spheres is constant with time, the nuber of chains need not be as they can join and coalescein the absence of chain ends and branch points. Thussuggest a nonconserved coarsening dynamics. We modechange in areal density according to the Langevin equat
]r~x!
]t52G
dF@r#
dr~x!1h~x,t !, ~12!
whereh(x,t) is a noise term with correlation chosen to esure that the system comes to thermal equilibrium, name
^h~x,t !h~x8,t8!&5GkBTd3~x2x8!d~ t2t8!. ~13!
Using the model free energy@26# for a line liquid, we are ledto the linearized equation for the structure function@27#:
]S~qW ;t !
]t'22GFCq'
2 1Kqz
2
q'2 1r GS~qW ;t !12GkBT,
~14!
wherer ,0 andC andK are constants related to the stiffneand density of the dipole chains@26#. The nonlocal nature othe kernel in Eq.~14! is a consequence of the conservatilaw. For short times Eq.~14! can be solved and we find tha
S~qW ;t !'e2w~qW !tS~qW ;0!1@12e2w~qW !t#S~qW ;`!, ~15!
with w(qW )52G@Cq'2 1K(qz
2/q'2 )1r #. Thus the structure
function will have the form of a line gas with an exponentqW -dependent decay. ForCq'
4 1Kqz2.2rq'
2 the modes de-cay, while forCq'
4 1Kqz2,2rq'
2 the modes grow. Thus weexpect that for very smallqz there will be a regime ofq' forwhich the scattered intensity will grow at early times.
The structure function at zero time should be that of a lgas, namely,
S~qW ;0!}r0
2q'2
Bq'2 1Cq'
4 1Kqz2 , ~16!
whereB.0 is related to the average spacing and this expsion is valid for smallqW . At largerqW there will be additionalterms leading to the peak that represents the average cspacing. This form also predicts that at fixedq' the structurefunction will fall off along qz with a Lorentzian line shapein agreement with the data.
The three-dimensional structure function gives us infmation about the two-dimensional structure as well. Sinthe two-dimensional structure functionS2(x,y)5S(x,y,z50) we have
.
ates
he
-ene
then
,
l
e
s-
ain
-e
S2~qW !5E ei ~qxx1qyy!S~x,y,z50!dx dy
5E ei ~qxx1qyy!S~x,y,z!d~z!dx dy dz
5E S~qx ,qy ,qz!dqz
2p, ~17!
where the last equality comes from the convolution theoreThe data have been reduced to this form by integration alqz . We see again two generic features of the line liquid. Tplot of I (q')5q'
2 /S2(q') versusq' should rise linearly atsmall q' and then have a dip atq'
* , the wave vector of theincipient crystalline order at the relevant density. Accordito the model outlined above,I (q')}ABq'
2 1Cq'4 , in agree-
ment with the data for smallq' . We may also look at thetime dependence ofI (q' ;t). Using Eqs.~15! and ~17! wehave
I ~q' ;t !}e2G~r 2B!tI ~q' ;0! ~18!
for small times.While there is no time at which an equilibrium line liqui
exists, at short enough times the system is not far fromdilute gas that it started as on its way to a crystal. A modetailed theory of the coarsening would require the introdtion of nonlinearities along the lines of Langer, Bar-on, aMiller @28#.
IV. STEADY SHEAR
The shear thinning of the fluid viscositym is perhaps themost basic aspect of electrorheology. For the colloidal silfluid studied here we found@16# that at low applied fields theviscosity shear thinned asm;g22/3, where g is the shearrate, whereas at high applied fields the standard resum;g21 was obtained. The discovery of the anomalousshear thinning exponent prompted the development ofindependent droplet model, which gives this exponent. Tmodel makes some very specific predictions about the dlet size and orientation as functions of the shear rate andand these can be determined by light scattering. Likewthe kinetic chain model, originally developed to accountoscillatory shear, gives a shear thinning exponent of21 andmakes dramatically different predictions for the chain orietation. In the following we report measurements of the oentation of particle structures and compare these to thenetic and equilibrium models.
A. Droplet fragmentation and orientation
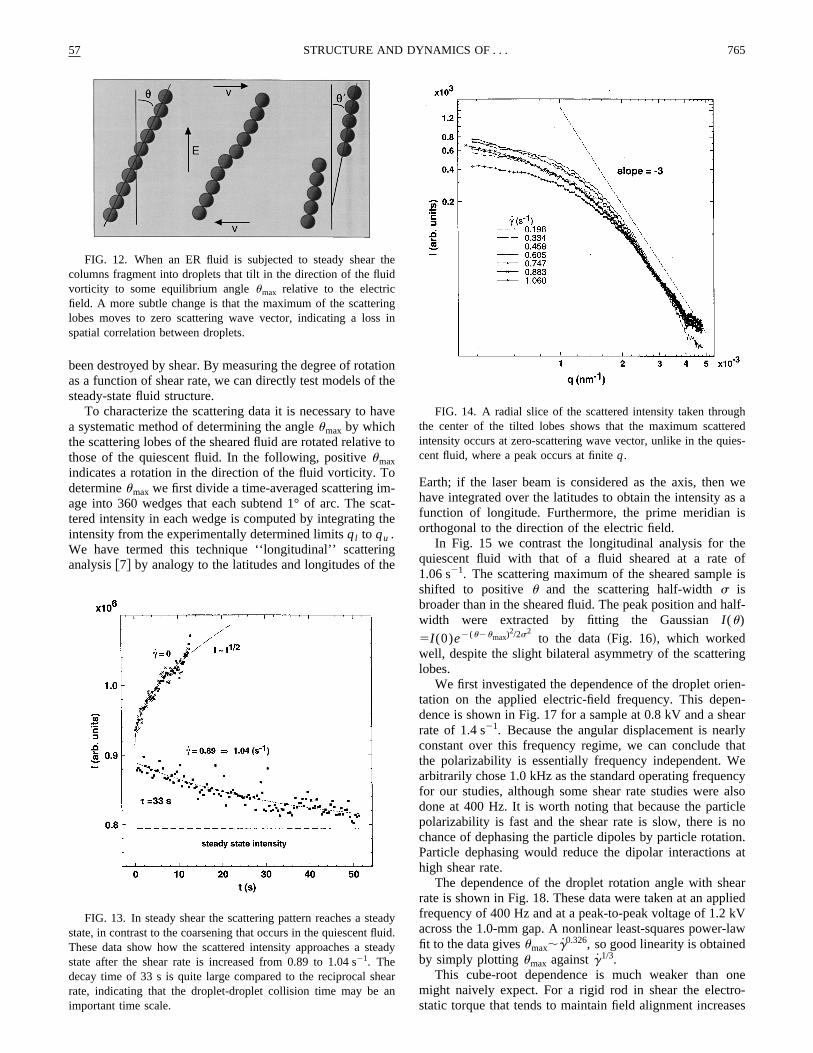
When an ER fluid is subjected to shear, the columns frment and tilt in response to the hydrodrodynamic forcresulting in several changes in the light-scattering patt~Fig. 12!. First, the coarsening of the lobes stops andscattering pattern reaches a steady state, as shown in FigSecond, the scattering pattern is rotated in the directionfluid vorticity. Finally, the peak of the scattering lobes dcreases toq50 ~Fig. 14!, showing that the quasiperiodiintercolumn correlations are destroyed. These observatindicate rotated structures whose spatial correlations h
tth
a
e
o-cth
ghe
wes ais
eofis
alf-
ing
en-n-earrlythat
encyalsoicleno
ion.at
earliedkV-law
onero-ses
thid
rins
teaflute
hean
ghred
ies-
57 765STRUCTURE AND DYNAMICS OF . . .
been destroyed by shear. By measuring the degree of rotaas a function of shear rate, we can directly test models ofsteady-state fluid structure.
To characterize the scattering data it is necessary to ha systematic method of determining the angleumax by whichthe scattering lobes of the sheared fluid are rotated relativthose of the quiescent fluid. In the following, positiveumaxindicates a rotation in the direction of the fluid vorticity. Tdetermineumax we first divide a time-averaged scattering image into 360 wedges that each subtend 1° of arc. The stered intensity in each wedge is computed by integratingintensity from the experimentally determined limitsql to qu .We have termed this technique ‘‘longitudinal’’ scatterinanalysis@7# by analogy to the latitudes and longitudes of t
FIG. 12. When an ER fluid is subjected to steady shearcolumns fragment into droplets that tilt in the direction of the fluvorticity to some equilibrium angleumax relative to the electricfield. A more subtle change is that the maximum of the scattelobes moves to zero scattering wave vector, indicating a losspatial correlation between droplets.
FIG. 13. In steady shear the scattering pattern reaches a sstate, in contrast to the coarsening that occurs in the quiescentThese data show how the scattered intensity approaches a sstate after the shear rate is increased from 0.89 to 1.04 s21. Thedecay time of 33 s is quite large compared to the reciprocal srate, indicating that the droplet-droplet collision time may beimportant time scale.
ione
ve
to
at-e
Earth; if the laser beam is considered as the axis, thenhave integrated over the latitudes to obtain the intensity afunction of longitude. Furthermore, the prime meridianorthogonal to the direction of the electric field.
In Fig. 15 we contrast the longitudinal analysis for thquiescent fluid with that of a fluid sheared at a rate1.06 s21. The scattering maximum of the sheared sampleshifted to positiveu and the scattering half-widths isbroader than in the sheared fluid. The peak position and hwidth were extracted by fitting the GaussianI (u)5I (0)e2(u2umax)
2/2s2to the data~Fig. 16!, which worked
well, despite the slight bilateral asymmetry of the scatterlobes.
We first investigated the dependence of the droplet oritation on the applied electric-field frequency. This depedence is shown in Fig. 17 for a sample at 0.8 kV and a shrate of 1.4 s21. Because the angular displacement is neaconstant over this frequency regime, we can concludethe polarizability is essentially frequency independent. Warbitrarily chose 1.0 kHz as the standard operating frequefor our studies, although some shear rate studies weredone at 400 Hz. It is worth noting that because the partpolarizability is fast and the shear rate is slow, there ischance of dephasing the particle dipoles by particle rotatParticle dephasing would reduce the dipolar interactionshigh shear rate.
The dependence of the droplet rotation angle with shrate is shown in Fig. 18. These data were taken at an appfrequency of 400 Hz and at a peak-to-peak voltage of 1.2across the 1.0-mm gap. A nonlinear least-squares powerfit to the data givesumax;g0.326, so good linearity is obtainedby simply plottingumax againstg1/3.
This cube-root dependence is much weaker thanmight naively expect. For a rigid rod in shear the electstatic torque that tends to maintain field alignment increa
e
gin
dyid.ady
ar
FIG. 14. A radial slice of the scattered intensity taken throuthe center of the tilted lobes shows that the maximum scatteintensity occurs at zero-scattering wave vector, unlike in the qucent fluid, where a peak occurs at finiteq.

c-eld
in
iedearely
ba
ingengetio
si-bse
theied
theouromeolar-ill
ithplet
. %the
766 57MARTIN, ODINEK, HALSEY, AND KAMIEN
to first order as the tilt angleu, whereas the hydrodynamitorque increases as the shear rateg. In steady state the droplet velocity is zero, so a torque balance gives the linear rtion umax;g1. The sublinear dependence actually observe
FIG. 15. The radially integrated intensity of scattered light, otained from the longitudinal analysis, is shown for an unshearedsheared sample in the polar coordinates (I ,u). Positive angles are inthe direction of fluid vorticity and the small background scatterhas been subtracted for clarity. Note that for the sheared samplscattering pattern is angularly displaced, indicating column tiltibroadened, indicating a dispersity of column sizes; and skewprimarily because of the nonlinear dependence of the orientaangle on droplet size.
FIG. 16. The column orientation can be obtained from a Gauian fit ~lines! to the data or from the position of the intensity maxmum. The Gaussian does not fit the wings of the data very well,reliably finds the peak position, while being insensitive to noiThe intensity is radially integrated.
a-is
due to the tendency of chains or droplets to fragmentresponse to flow, as discussed below.
The droplet or chain orientation angle can also be studas a function of the applied electric field at constant shrate. Stronger fields should align the structures more clos
-nd
the;d,n
s-
ut.
FIG. 17. The dependence of the droplet orientation angle onfield frequency is shown for a 7.5-wt. % sample at 0.8 kV applacross the 1.0-mm gap and a shear rate of 1.4 s21. The angulardisplacement is nearly constant in this regime, indicating thatparticle polarization is nearly frequency independent. Most ofshear and voltage studies were done at 1.0 kHz, although sshear rate studies were done at 400 Hz. Because the particle pizability is fast and the shear rate is slow, the particle dipoles wnot dephase by rotation in shear.
FIG. 18. The linear increase of the droplet orientation angle wthe cube root of the shear rate bolsters the independent dromodel of the shear thinning viscosity. This sample was 7.5-wtsilica and the applied voltage was 1.2 kV at 400 Hz across1.0-mm gap.

lt-ie
ate-Wo
lesiypre
th
acgh
itsheiont
tio
a
po-ex-
.n-
y-
-
-be-tric
awillIt isini-nse
aal-
f
er
thidthus
t tx
ab
57 767STRUCTURE AND DYNAMICS OF . . .
with the field. Because the fluid is non-Ohmic at high voages, it is expected that the particle and fluid polarizabilitmay be field dependent, so the scaling is expected tosomewhat obscured. Still, Fig. 19 shows that the datashear rate of 0.34 s21 are in good agreement with the cubroot law obtained in the shear-rate-dependent studies.will now compare these observations with the predictionsthe models.
B. Independent droplet model
Here we give a brief derivation of the independent dropmodel first developed to describe the shear thinning viscoof an ER fluid. This model neglects droplet-droplet hydrodnamic and electrostatic interactions and so is most approate for dilute suspensions at low Mason numbers, yet itmains informative for larger values of the concentration.
This independent droplet model is based partly onresult of Halsey and Toor@13# for the shape of a particledroplet. By balancing depolarization effects against surftension, one finds that such an independent droplet is roua prolate sphere, with the sizec of the droplet in the directionparallel to the applied field related to the sizeb of the dropletin the direction perpendicular to the field byb;r d
1/3c2/3,wherer d is the radius of an colloidal particle.
In shear flow an ellipsoidal droplet will rotate so thatlong axis is no longer parallel to the field. The larger tdroplet, the greater the rotation in a shear flow. This rotatreduces the depolarization energy of a droplet and a balabetween depolarization energy and surface energy demines the characteristic droplet size. This size computa
FIG. 19. The orientation angle is shown as a function ofapplied field, at constant shear rate, for a 7.5-wt. % silica fluBecause the fluid is nonohmic at high voltages, it is expectedthe particle and fluid polarizabilities will be field dependent, thobscuring the scaling. Still, at the lower shear rate of 0.34 s21 thedata are in good agreement with the expected cube root law. Ahigher shear rate the data are better described by a smaller enent, near 0.2, perhaps due to the formation of a shear slip instity.
sbea
ef
tty-ri--
e
ely
nceer-n
leads to a shear-rate-dependent ER fluid viscosity.In the following the electric field is oriented along thez
direction and the shear flow isv(z)5gzx. We also assume asolvent dielectric constant«s51. The hydrodynamic torqueabout they axis for a rigid ellipsoidal droplet rotating atrate u in a shear flowg is given by@29#
L52m0V
b2nx1c2nz@~c2cos2u1b2sin2u!g2~b21c2!u#,
~19!
where V is the spheroid volume andnx,y,z are the shape-dependent depolarization factors of the spheroid. The delarization factors of a prolate spheroidal droplet can bepressed asnz[n andnx,y[(12n)/2. For extremely prolatespheroids withc@b, we can defineg[b2/c2!1 to obtain@29# n'2 1
4 g, where we have dropped a logarithmic termThus bothg andn are suitable small parameters for expasion.
If the droplet is in mechanical equilibrium, then the hdrodynamic torqueL must balance the electrical torqueK.The electrostatic torqueK on a spheroid of dielectric constant« inclined at an angleu to the field is@30#
K>2~«21!2
8p~«11!E2V sin~2u!, ~20!
whereE is the applied electric field.If we assume that the droplet angleu is small, then bal-
ancing the electrostatic and hydrodynamic torques gives
u'16p~«11!m0g
~«21!2E2
1
g}
Mn
g. ~21!
Mn5m0g/2«0«cb2E0
2 is the Mason number, which expresses the ratio of hydrodynamic to electrostatic forcestween two vicinal spheres in shear in terms of the dieleccontrast factorb5(«p2«c)/(«p12«c), where«p is the par-ticle dielectric constant,«c is the dielectric constant of thecontinuous phase, and«058.854310214 F/cm is thevacuum permittivity. Note that for a rigid droplet withlarge aspect ratio in a large shear gradient, the tilt anglebe large, causing the droplet to gain polarization energy.therefore reasonable to expect the droplet to attempt to mmize its total energy by reducing its size, even at the expeof increasing its surface energy per unit volume.
Having determined the tilt angleu as a function ofg5b2/c2, we can now find the size and aspect ratio ofdroplet that minimize its total energy. This is done by bancing the depolarization energy~which will be a function ofn andu, both small parameters! against the surface tension oa droplet.
The depolarization energy of a spheroid is@30#
Fd'2~«21!VE2
8p F12S «21
«11D u22~«21!nG , ~22!
where only the lowest-order terms inu andn have been kept.This energy is minimized whenu50 andn50, so this termfavors long, thin columns aligned with the field. On the othhand, the surface energy term
e.at
hepo-il-
senn
ew
th
isaain
a
menn
foleinnw
di
ce
an-
rn
ofoleion
s
resthisob-lar
-the
ical
ng-nds
ear
mlid
e onw-hegle
sh-is
-at
768 57MARTIN, ODINEK, HALSEY, AND KAMIEN
Fs5s~«21!E2S
4p~23!
favors large spheroidal droplets. HereS54p(abc)2/3 is thesurface area of the spheroid and we expects;r d @13,31#.
Minimizing the total energyFd1Fs gives g}Mn2/3, b}Mn22/3, andc}Mn21. The droplet width isb}c2/3, as inthe theory of the quiescent fluid@6#. Also, since Mn/g}Mn1/3, Eq. ~4! indicates thatu}Mn1/3 for M!1, whichconfirms thatu is small. Thus, as the shear rate increases~orthe electric field decreases! the droplet lengthc and its aspectratio c/b}Mn21/3 decrease while the tilt angle increases.
The dependence of the droplet orientation angle hadirect bearing on the fluid viscosity. The field enhancemof the viscosity is conveniently quantified by the dimensioless field-specificviscosity mF[(m2mf )/fm0, wheremfis the solution viscosity at infinite Mn. To determine thdroplet contribution to the shear part of the stress tensorcompute the hydrodynamic torque per unit volume influid. If the volume fraction of droplets isf, then this isth>f4m0g/g, which yields
mF}Mn22/3 ~24!
for the field-induced contribution to the shear-thinning vcosity. This calculation applies only to the intermediate Mson number regime where the Mason number is smenough for chains to form, yet not so small that these chaspan the electrode gap.
C. Chain model
We have recently developed a simple chain model@17# ofelectrorheology that is based on a balance of electrostatichydrodynamic forces. Thisathermal model was originallybased on the interaction between the induced dipolements of dielectric spheres in solution. The dipole momwas originally computed for a single sphere in a liquid cotinuum, but we have modified this model to accountlocal-field effects by self-consistently computing the dipomoment on an enchained sphere. The presence of vicspheres then alters the local field and this has a substaeffect on the agreement of the model with experiment, asshall see.
In the chain model the particle structures are presumebe chains of spheres that interact through dipolar forces wtheir neighbors. The self-consistent electrostatically induattractive dipolar force is@17#
Fsc5bz~3!@~3k1cos2u2k2! r1k3sin~2u!u#, ~25!
whereb53pa2m0g/8 Mn, z(3)>1.202 is the Riemann zetfunction, andr and u are unit vectors parallel and perpedicular to the line of centers between the spheres. Themaining constants have to do with the local-field effects aare given by
k1511x2/8
~12x/42x2/8!2,
k251
~11x/4!2, ~26!
at
-
ee
--lls
nd
o-t
-r
altiale
tothd
e-d
k351
12x/42x2/8,
wherex5bz(3). To obtain some idea of the magnitudethe local-field correction, the enhancement, over the dipapproximation, of the breaking strength of a chain in tensaligned along the field direction isz(3)(3k12k2)/2. For b52 1
2 this factor is 0.71, but forb51 the enhancement i7.54.
The fluid exerts a Stokes friction on each of the spheand thus a hydrodynamic torque on the chain. Balancinghydrodynamic torque against the electrostatic torque,tained by summing the tangential component of the dipoforce along the chain, givesk3z(3)tanu58 MnN2 for the tiltangle of a chain of 2N11 spheres. Balancing the hydrodynamically induced tension at the chain center againstradial component of the dipolar force gives the mechanstability constraint
z~3!3k1cos2u2k2
sinu cosu>16 MnN2. ~27!
The chain angle thus increases with chain length. The loest stable chain will have a critical chain angle that depeon the dielectric contrast through
tanuc5A3k12k2
2k31k25A2
3
11x/4
A12x/2. ~28!
~Note that the singularity is outside the physical range ofb.!The chain angle is also closely approximated by the linrelation sinuc>A2/5(113x/10). As b increases over itsmaximum physical range of2 1
2 to 1, the critical chain angleincreases from 31.3° to 59.3°. A stable chain of maximulength N}Mn21/2 will be oriented at exactly the criticaangle uc . By contrast, the droplet model gives a ellipsolength L}Mn21/3 and an orientation angle increasing asu}Mn1/3.
The data clearly show a dependence of the chain anglthe cube root of Mn and so support the droplet model. Hoever, electrode friction can affect the simple prediction of tchain model to give a linear increase of the critical anwith Mn.
Rheology
The viscosity can be computed in a straightforward faion. The electrostatic torque on a single-particle pair2aFe,u52az(3)k3b sin2u. There are 2N such pairs in achain so the electrostatic torque per chain iste
5 32 pa2«0«cb
2E02Lz(3)k3sin2u. In terms of the volume
fraction f of spheres the stresss in the sample is thuss5 9
8 «0«cb2E0
2fz(3)k3sin2uc . Using our result for the criti-cal angle gives the shear field specific viscosity
mF>c Mn21, ~29!
where to a good approximationc5 15 ( 3
2 )5/2z(3)(11 410b
1 320b21 1
6 b3) over the physical range ofb.The scalingm2mf}g21 has been obtained in many ex
periments, including those conducted on our silica fluid

d in theh are
57 769STRUCTURE AND DYNAMICS OF . . .
FIG. 20. A typical scattering image contains a pair of scattering lobes and the strain clock. These scattering lobes are tiltedirection of fluid vorticity by some angleu relative to the orientation of the scattering lobes obtained for the quiescent fluid, whicorthogonal to the electric-field vector.
l
iddyea
sgtpsuderthret
nsx
rianetoyzio
ostiobthnd
nc
heng
ten-
s issim-the
ofng-tant
arncethethethen-
ndy-thatly
estheis
ped
high fields@16#. However, for the silica fluid at low fields wefind m2mf}g22/3, a result consistent with the ellipticadroplet model@16#.
V. OSCILLATORY SHEAR
We have reported preliminary measurements of ER fluin oscillatory shear flow that demonstrate that the chainnamics is highly nonlinear. The nonlinear dynamics was rsonably well described by a simplekinetic chain model, inwhich the nonlinear response is caused by large variationthe chain length during an oscillation. These chain lenvariations are caused by aggregation and fragmentationcesses that occur during each cycle. At the time these rewere reported we did not understand why the simple mowe presented did not agree more quantitatively with expment, nor did we have direct experimental evidence forchain length variations assumed to drive the nonlinearsponse. In the time hence we have thoroughly examinedchain model, including such effects as local-field correctiomultipolar interactions, and hydrodynamic screening. Eperimentally, we have now determined the chain size vations that occur during each cycle. We will first reexamithe kinetic chain model, showing how it can be modifiedtake into account these effects and then we will reanalpreviously reported data and present data on the fluctuatin chain size during a shear cycle.
We have previously generalized the droplet model tocillatory shear at small strain amplitudes, where aggregaand fragmentation effects that occur during a cycle canignored. This model gives a sinusoidal response, butsingle characteristic relaxation time of the system depeon the strain amplitude and shear frequency.
A. Data analysis
A scattering image contains a pair of scattering lobes aof course, the strain phase clock, as in Fig. 20. These s
s--
inhro-ltseli-e-
he,--
ens
-nees
d,at-
tering lobes are tilted by an angleu relative to the orientationof the scattering lobes obtained for the quiescent fluid. Tangleu was then obtained by one of two methods: locatithe intensity maximumumax or finding the medianum , de-fined as that angle that divides the integrated scattered insity into equal halves, so*um
90°I (u)du5*290°um I (u)du. The lat-
ter method is used when the strongly nonlinear dynamiccharacterized by twin peaks. Under these circumstancesply locating the maximum peak causes discontinuities indata.
B. Measurements
At relatively low strain amplitudes the responsethe orientation angleumax to the sinusoidal shear straig5g0 sin(2pnt) was nearly linear, demonstrating that framentation and aggregation effects may be not be imporin perturbative flows whereg0!1. This quasilinearity is ex-emplified in Fig. 21, where Lissajous plots of tan(umax)againstg are shown to be nearly elliptical. At the low shefrequency the chain orientation leads the strain by 57°. Sia 90° phase shift would put the droplets in phase withstrain rate, we conclude that the polarization coupling toelectric field, which tends to align the chains, dominateshydrodynamic forces, so the chains deviate from field aligment only at the highest shear rates.
Conversely, at high frequencies the shear rateg52png0sin(2pnt) is much larger and the droplet orientatiois nearly in phase with the fluid shear since the hydronamic torque dominates the electrostatic torque. Noteunder this condition the affine deformation limit is nearachieved, as shown by the dashed line.
At higher strain amplitudes the motion becom‘‘clipped’’ as the droplets fragment and aggregate duringcycle in order to maintain good electric-field alignment. Thnonlinear motion is evidenced by the parallelogram-sha

e.
idin
atels
hila
lerop-atre-ligneno atselettes
tmc
ignin
heig
heing
ofata
t-
ret-
770 57MARTIN, ODINEK, HALSEY, AND KAMIEN
Lissajous plots in Fig. 22. The dashed lines represent thretical curves computed from the theory developed below
At lower voltages we observe a different nonlinear fluresponse, as shown in a Lissajous plot in Fig. 23, and agatime in Fig. 24. The droplet motion leads the strain, indicing that electrostatic interactions dominate. This may sesurprising, given that the field is small, but we have areduced the strain frequency to 0.075 Hz.
Another way to appreciate the nonlinear behavior of tsystem is the noncircular Lissajous plot of the chain angu
FIG. 21. Clockwise Lissajous plots of tan(umax) againstg arevirtually elliptical ~lines! when the strain amplitude is small. Ahigh strain frequency hydrodynamic forces dominate and thetion is nearly in phase with the strain. At low frequency the eletrostatic forces dominate and the chains deviate from field alment in proportion to the instantaneous strain rate, thus bealmost out of phase with the strain.
FIG. 22. Lissajous plots at strain amplitudes ofg050.5, 1.6, and3.2 have parallelogram shapes that indicate a ‘‘clipping’’ of tangular motion as chains fragment and align with the field at hstrains. The theoretical curves~dashed lines! are computed in theinstantaneous ‘‘equilibrium’’ limit wherek is large.
o-
st-mo
sr
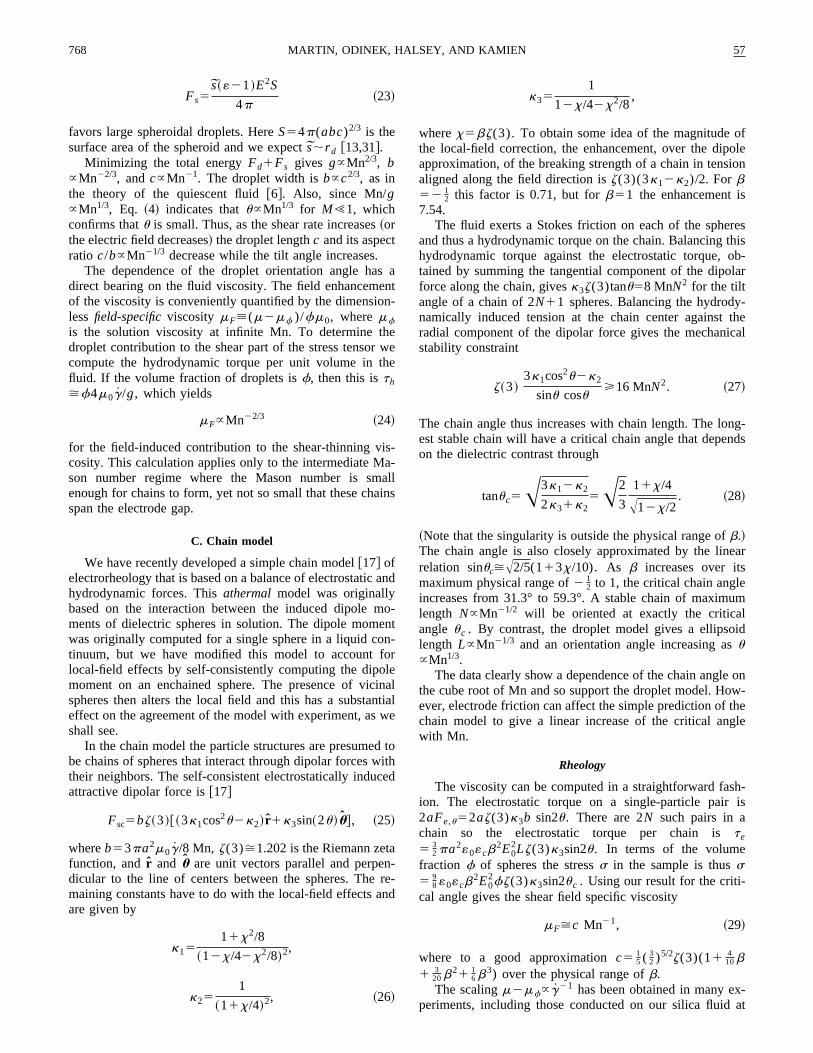
velocity versus the chain angle~Fig. 25!. Again, the theoret-ical prediction is shown for comparison.
Starting at maximum positive strain, the droplet half cyccan be described as follows. As the strain reverses, the dlets corotate with the fluid and tilt to a maximum angleroughly half the maximum strain on the return stroke, wheupon they fragment and undergo retrograde motion to reawith the electric field. If inertial effects are neglected ththe hydrodynamic torque equals the electrostatic torque, szero tilt angle the droplets corotate with the fluid. Becauthe hydrodynamic torque is thus proportional to the droptilt angle, the large area within the Lissajous loop indicathat this nonlinear response is dissipative.
o---g
h
FIG. 23. At low voltages a different nonlinear response of tfluid can be observed, with retrograde motion of fragmentchains. The dashed line is a theoretical curve. The amplitudemotion is sensitive to the dipolar model and the method of dreduction.
FIG. 24. The ‘‘dogbone’’ nonlinearity shown in Fig. 23 is ploted against time. The strain data are fit to a sinusoid~solid line! andthe chain orientation data are connected by a dashed line. Therograde motion is quite evident in this representation.
tecaetoa
avthdc-aln
xeng
n
-
inone
er,by
ticua-
tion
ter,
eny-m-
nc-
t onby
ticig
del.
57 771STRUCTURE AND DYNAMICS OF . . .
Finally, we observed that the scattering lobes brighconsiderably as they swing back through zero angle, indiing droplet aggregation. Likewise, as the lobes swing to thmaximum tilt they diminish in intensity, indicating droplefragmentation. All of these observations of the droplet mtion point the way to the simple model of the dynamics thwe shall now present.
C. Kinetic chain model
The salient features of experimental results we hshown can be understood in terms of a kinetic model ofdynamics of volatile chains. We have presented this moelsewhere@17# for the case of fixed induced dipolar interations: Here we modify the basic model to account for locfield corrections. Local-field corrections have the importaconsequence of changing the critical chain angle from a fivalue of;39.2° to a range from 31.3° to 59.3°, dependion the dielectric contrast factorb.
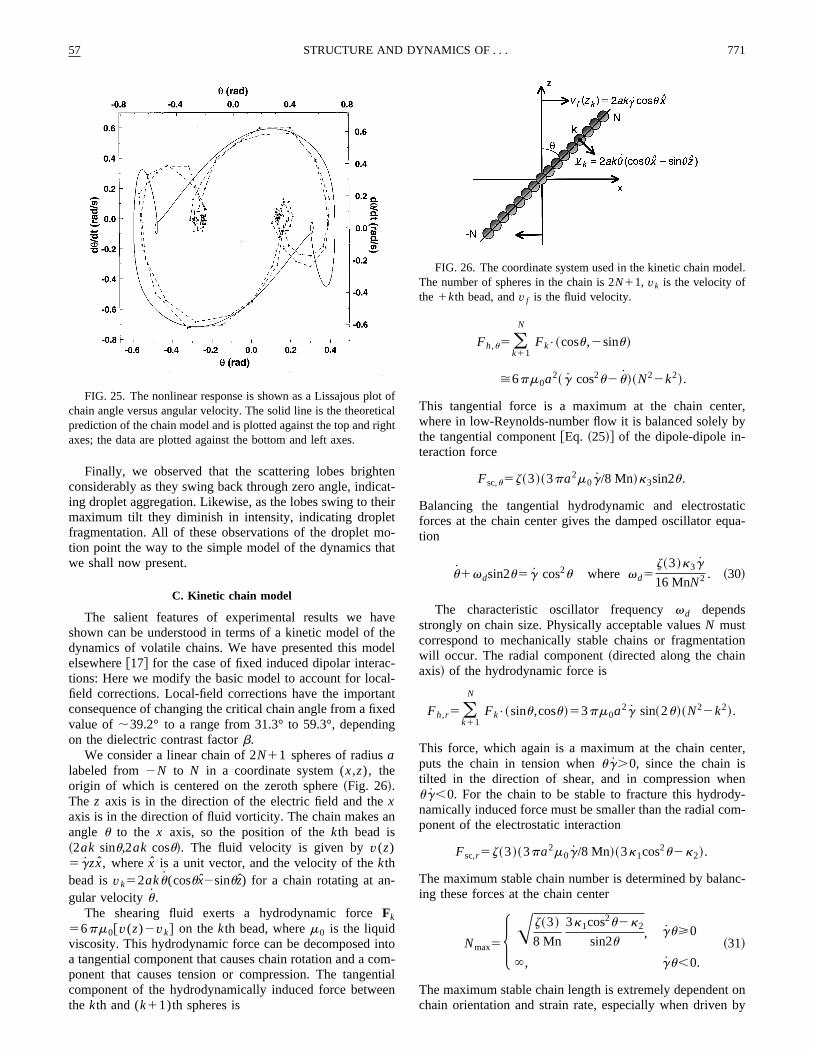
We consider a linear chain of 2N11 spheres of radiusalabeled from2N to N in a coordinate system (x,z), theorigin of which is centered on the zeroth sphere~Fig. 26!.The z axis is in the direction of the electric field and thexaxis is in the direction of fluid vorticity. The chain makes aangle u to the x axis, so the position of thekth bead is~2ak sinu,2ak cosu!. The fluid velocity is given byv(z)5gzx, wherex is a unit vector, and the velocity of thekthbead isvk52aku(cosux2sinuz) for a chain rotating at angular velocityu.
The shearing fluid exerts a hydrodynamic forceFk56pm0@v(z)2vk# on thekth bead, wherem0 is the liquidviscosity. This hydrodynamic force can be decomposeda tangential component that causes chain rotation and a cponent that causes tension or compression. The tangecomponent of the hydrodynamically induced force betwethe kth and (k11)th spheres is
FIG. 25. The nonlinear response is shown as a Lissajous plochain angle versus angular velocity. The solid line is the theoretprediction of the chain model and is plotted against the top and raxes; the data are plotted against the bottom and left axes.
nt-ir
-t
eeel
-td
tom-tialn
Fh,u5 (k11
N
Fk•~cosu,2sinu!
>6pm0a2~ g cos2u2 u !~N22k2!.
This tangential force is a maximum at the chain centwhere in low-Reynolds-number flow it is balanced solelythe tangential component@Eq. ~25!# of the dipole-dipole in-teraction force
Fsc,u5z~3!~3pa2m0g/8 Mn!k3sin2u.
Balancing the tangential hydrodynamic and electrostaforces at the chain center gives the damped oscillator eqtion
u1vdsin2u5g cos2u where vd5z~3!k3g
16 MnN2 . ~30!
The characteristic oscillator frequencyvd dependsstrongly on chain size. Physically acceptable valuesN mustcorrespond to mechanically stable chains or fragmentawill occur. The radial component~directed along the chainaxis! of the hydrodynamic force is
Fh,r5 (k11
N
Fk•~sinu,cosu!53pm0a2g sin~2u!~N22k2!.
This force, which again is a maximum at the chain cenputs the chain in tension whenug.0, since the chain istilted in the direction of shear, and in compression whug,0. For the chain to be stable to fracture this hydrodnamically induced force must be smaller than the radial coponent of the electrostatic interaction
Fsc,r5z~3!~3pa2m0g/8 Mn!~3k1cos2u2k2!.
The maximum stable chain number is determined by balaing these forces at the chain center
Nmax5HAz~3!
8 Mn
3k1cos2u2k2
sin2u, gu>0
`, gu,0.
~31!
The maximum stable chain length is extremely dependenchain orientation and strain rate, especially when driven
ofalht
FIG. 26. The coordinate system used in the kinetic chain moThe number of spheres in the chain is 2N11, vk is the velocity ofthe 1kth bead, andv f is the fluid velocity.

getao
izee-th
t
n
n-ine
ii
itsuronth
-sou
b
so
n
vdetnl-
wehen
thehenthe
en-omthe
iththe4
ainsn-
in-alnt
toral-
hearefor
con-
ugh
772 57MARTIN, ODINEK, HALSEY, AND KAMIEN
oscillatory shear. The maximum stable chain length diverwhen the chain is aligned with the field, when the instanneous strain rate is zero, and when the chain is under cpression.
If a chain is far from its maximum stable size then its swill adjust by aggregation or fragmentation. We will dscribe the kinetics of aggregation and fragmentation byphenomenological formula
dN~ t !
dt5
k
N~ t ! F12N~ t !2
Nmax2 ~ t !G , ~32!
where because induced dipolar forces drive aggregationrate constant it is useful to write k5k0@z(3)k3«0«cb
2E02/8m0#, where k0 is a concentration-
dependent constant with no implicit field or viscosity depedence. The reasons for this definition ofk0 will become ob-vious in the following.
This kinetic equation gives very different time depedences for aggregation and fragmentation. When the chamuch smaller than its maximum stable length, slow, powlaw aggregation will occur withN(t)5AN(0)212kt, inagreement with the root time prediction of See and Doi@32#,which they developed for the quiescent fluid. If the chainmuch larger than its stable length then fragmentation woccur exponentially quickly according to N(t)
5N(0)e2kt/Nmax2
. Note that the fragmentation ratek/Nmax2 is
proportional to the strain rate and isindependentof the elec-tric field and viscosity. Of course, when the chain is atmaximum length no aggregation or fragmentation occsincedN(t)/dt50. Thus the phenomenological rate equatigives physically reasonable behavior while avoidingcomplexities of the Smoluchowski equation.
Equations~30!–~32! now comprise a set of coupled nonlinear equations that can be solved to model the dynamicchains in shear flow. However, at this point there are findependent parameters in the system: the Mason numMn, the strain frequencyn and amplitudeg0 and the rateconstant prefactork0 . A considerable simplification occurby recognizing that solutions to the kinetic equation arethe formN(t)5@z(3)k3g/16n Mn#1/2n(nt). If all functionsare expressed in terms of the dimensionless times5nt thisleads to the reduced damped nonlinear oscillator equatio
u11
n2 sin2u5g cos2u, n5k0
n F12n2
nmax2 G ,
~33!
nmax5HA2
g
3k1cos2u2k2
k3sin2u, gu>0
`, gu,0.
The reduction to a three-parameter (g0 ,k0 ,b) model is aresult of the particular form of the rate equation we hachosen. The strain amplitude is fixed in the experiment anbcan be computed, so this is really a single free parammodel. Finally, it is interesting to note that the chain orietation dynamicsu(t) is independent of Mason number, athough the chain length dynamicsN(t) is not.
s-
m-
e
he
-
isr-
sll
s
e
ofrer
f
s
e
er-
1. Electrorheology
Before we discuss the behavior of these equationswould like to discuss the predicted rheology. In terms of tvolume fractionf of spheres the field-induced contributioto the fluid stress is
s56m0N2f~g cos2u2 u !5 98 «0«cb
2E02fz~3!k3sin2u.
~34!
From the right-hand side of this equation it is clear thatfluid stress increases with the chain orientation angle. Wu50, the chain contribution to the fluid stress is zero andchain comoves with the fluid sog cos2u5u. Because Eq.~33! shows that the dynamics of chain orientation is indepdent of electric field and shear frequency, we conclude frEq. ~34! that the stress scales purely as the square ofelectric field.
2. Numerical results
We can now compare the predictions of this model wour experimental results. For this purpose we have useddielectric constant of 13.5 for 4-methylcyclohexanol andfor silica, giving a negative value ofb. For small strains theresponse is sinusoidal, as expected, but for large str~Figs. 27 and 28! Lissajous plots are nonelliptical and depedent on the rate constantk. For k50 the oscillator reorien-tation rateva is a simple constant and the remaining nonlearities in Eq.~30! are small enough that a nearly ellipticresponse is observed. Ask increases, the chains fragmeand aggregate to achieve mechanical stability while tryingmaximize their length and Lissajous plots approach a palelogram. The instantaneous response limit~large k! of thelocal-field-corrected model is in good agreement with tdata in Fig. 22. This agreement is much better than the bmodel because of the reduced orientation angle. Finally,
FIG. 27. Lissajous plots change unexpectedly as the ratestantk is varied. Fork50 the oscillator reorientation ratevd is asimple constant and the remaining nonlinearities are small enothat a nearly elliptical response is observed. For largek Lissajousplots approach a parallelogram, whereas for intermediate-k valuesretrograde motion is observed.

edp
i
saiise
ecn
amhireTci
infteis
ureyra
atnteigd
nfao
trais
rtedolt-hationwodbede
ot ainn at
-lawnta-
eain
xis.ve ofons
57 773STRUCTURE AND DYNAMICS OF . . .
intermediate values ofk an interesting crossover is observwherein humps appear in the Lissajous plots. This humcommonly observed in our data at low fields, as illustratedFigs. 23 and 24.
The nonlinear behavior of this system is also shown aLissajous plot of the chain angular velocity versus the changle ~Fig. 27!. Again, the detailed shape of the theorysomewhat different from the data, but the overall agreemis quite good.
The chain orientation dynamics is a somewhat indirtest of the kinetic chain model since it is conceivable that ocould construct another set of equations that gives the soverall behavior. However, the nonlinear behavior of tmodel is ultimately driven by the fragmentation and agggation phenomena that occur during each shear cycle.dynamics of fragmentation, which occurs at twice the oslation frequency, is shown in Fig. 29. Chain aggregationvery pronounced just as the electrode is about to returzero angle, with chains reaching a maximum size just athe maximum strain. During this time interval the chainmore or less comoving with the flow. Fragmentation occmuch before the electrode returns to zero angle becauschain is nearly 90° ahead of the strain and thus is alreadits maximum tilt angle in the opposite direction. The powelaw aggregation and exponential fragmentation leads toobvious asymmetry in the chain size peaks.
Large aggregates cause intense light scattering, so to msure the chain size we determined the wedge integrmaximum intensityI max ~as opposed to the peak positioumax! for each scattering image. The peak intensity is plotagainst time in Fig. 30 and against chain orientation in F31. There is a very close correspondence between theseand the prediction~Fig. 29! of the kinetic chain model. Thepeak position relative to the applied strain is about right aeven the peak asymmetry, due to slow aggregation andfragmentation, can be seen. Moreover, this pattern wasserved in all of the data sets, except those taken at a samplitude of 0.25, despite the tremendous variations in Lsajous plots of the orientational dynamics.
FIG. 28. The orientational dynamics shown in Fig. 27 are plted as functions of the strain rate. As the rate constantk increases,the nonlinear dynamics becomes more pronounced.
isn
an
nt
tee
s-hel-stor
stheat-n
ea-ed
d.ata
dstb-in-
D. Phase bifurcation
The oscillatory shear measurements we have repothus far have been at low to moderate fields. When the vage is turned up to greater than about 1.0 kV we found tthe scattering lobes split into two pairs. Direct observatindicated that the phase and amplitude of motion of the tpairs differed. After digitizing the scattering data we founthat, due to the finite lobe width, the pairs of lobes coulddistinguished from each other only when the strain amplitu
- FIG. 29. The chain length varies considerably during the strcycle due to fragmentation at large chain angles and aggregatiosmall angles. The asymmetry of the peaks is due to the poweraggregation kinetics being slower than the exponential fragmetion. The sinusoid is the strain.
FIG. 30. When the maximum intensity~solid line, plottedagainst the first left axis! is plotted against time, the resulting curvis very similar to the chain length fluctuations of Fig. 29. The stris the sinusoid~plotted against the right axis! and the chain orien-tation is the small dashed line plotted against the second left aThese data, taken at a strain amplitude of 3.2, are representatidata taken at strain amplitudes down to 0.5. Intensity fluctuatiare small when the strain amplitude is 0.25.
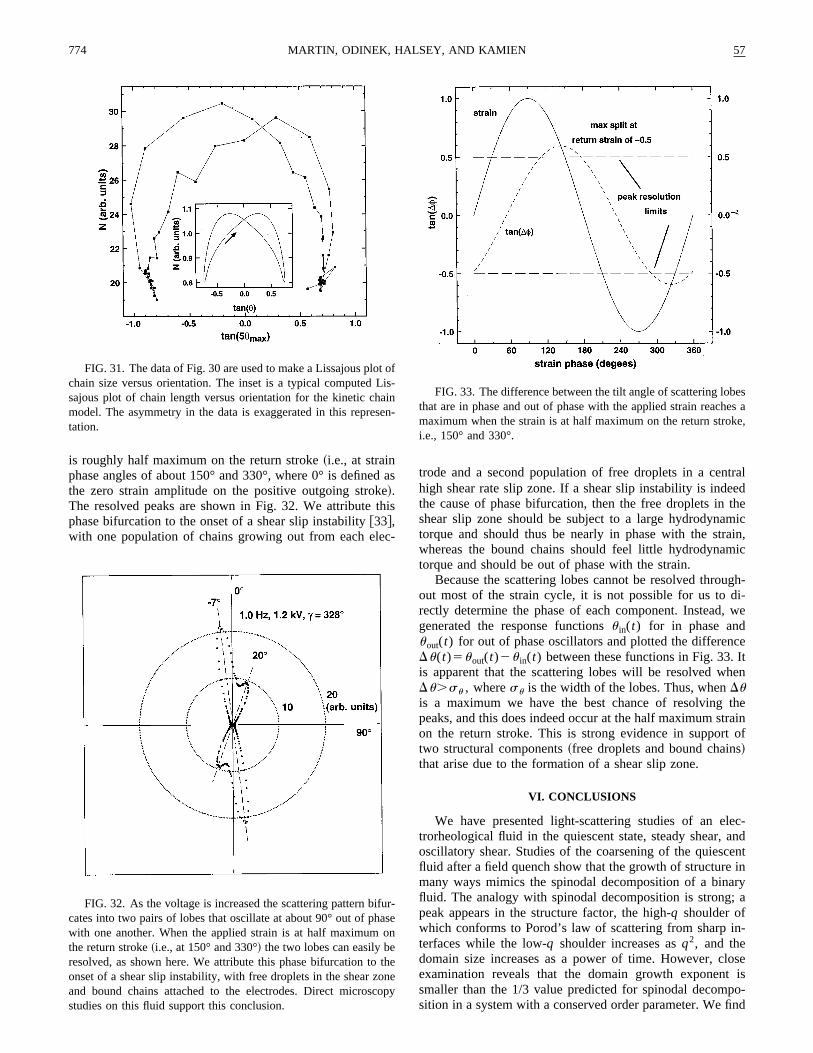
deth
c
traledthemicain,
ic
ugh-i-
, we
ceIthen
therainof
lec-andentin
ary; a
in-
loset ispo-find
tLiaise
ifuao
et
ono
beses ake,
774 57MARTIN, ODINEK, HALSEY, AND KAMIEN
is roughly half maximum on the return stroke~i.e., at strainphase angles of about 150° and 330°, where 0° is definethe zero strain amplitude on the positive outgoing strok!.The resolved peaks are shown in Fig. 32. We attributephase bifurcation to the onset of a shear slip instability@33#,with one population of chains growing out from each ele
FIG. 31. The data of Fig. 30 are used to make a Lissajous plochain size versus orientation. The inset is a typical computedsajous plot of chain length versus orientation for the kinetic chmodel. The asymmetry in the data is exaggerated in this repretation.
FIG. 32. As the voltage is increased the scattering pattern bcates into two pairs of lobes that oscillate at about 90° out of phwith one another. When the applied strain is at half maximumthe return stroke~i.e., at 150° and 330°! the two lobes can easily bresolved, as shown here. We attribute this phase bifurcation toonset of a shear slip instability, with free droplets in the shear zand bound chains attached to the electrodes. Direct microscstudies on this fluid support this conclusion.
as
is
-
trode and a second population of free droplets in a cenhigh shear rate slip zone. If a shear slip instability is indethe cause of phase bifurcation, then the free droplets inshear slip zone should be subject to a large hydrodynatorque and should thus be nearly in phase with the strwhereas the bound chains should feel little hydrodynamtorque and should be out of phase with the strain.
Because the scattering lobes cannot be resolved throout most of the strain cycle, it is not possible for us to drectly determine the phase of each component. Insteadgenerated the response functionsu in(t) for in phase anduout(t) for out of phase oscillators and plotted the differenDu(t)5uout(t)2u in(t) between these functions in Fig. 33.is apparent that the scattering lobes will be resolved wDu.su , wheresu is the width of the lobes. Thus, whenDuis a maximum we have the best chance of resolvingpeaks, and this does indeed occur at the half maximum ston the return stroke. This is strong evidence in supporttwo structural components~free droplets and bound chains!that arise due to the formation of a shear slip zone.
VI. CONCLUSIONS
We have presented light-scattering studies of an etrorheological fluid in the quiescent state, steady shear,oscillatory shear. Studies of the coarsening of the quiescfluid after a field quench show that the growth of structuremany ways mimics the spinodal decomposition of a binfluid. The analogy with spinodal decomposition is strongpeak appears in the structure factor, the high-q shoulder ofwhich conforms to Porod’s law of scattering from sharpterfaces while the low-q shoulder increases asq2, and thedomain size increases as a power of time. However, cexamination reveals that the domain growth exponensmaller than the 1/3 value predicted for spinodal decomsition in a system with a conserved order parameter. We
ofs-nn-
r-sen
heepy
FIG. 33. The difference between the tilt angle of scattering lothat are in phase and out of phase with the applied strain reachmaximum when the strain is at half maximum on the return stroi.e., 150° and 330°.

lge
thoe
run
thwisdenr-
ato
ofits
urnta-nglow
ton-
theslip
t of
diaart-0.
57 775STRUCTURE AND DYNAMICS OF . . .
the kinetics data are better described by a thermal modehierarchical clustering of columns into successively larcolumns. The interaction between columns is presumedarise from one-dimensional charge-density fluctuations incolumns that persist long enough to allow columns to clide. This model also gives a good account of the increasthe growth kinetics with applied voltage.
Studies of an ER fluid in steady shear show that the stture reaches a steady state wherein droplets are rotated idirection of fluid vorticity at some angleu relative to theapplied electric field. This angle is found to increase ascube root of the shear rate, in agreement with a modeloriginally proposed for the shear thinning viscosity. In thmodel the equation of motion of elliptical droplets is founby balancing the hydrodynamic and electrostatic torquThe droplets reach their free-energy minimum by fragmeing to align with the electric field until exposing more suface finally becomes too energetically costly.
Our studies of ER fluids in oscillatory shear demonstrthat the chain dynamics, and thus the electrorheology, is n
r-s
ofrtoe
l-in
c-the
ee
s.t-
en-
linear. We have described a simple kinetic chain modelthe dynamics that describes the approach of a chain tomaximum stable size by a kinetic equation. Much of oexperimental data can be described by taking the instaneous approach to stability; however, at low fields strononlinearities suggest that the approach to stability is scompared to the shear period. This model is then usedcompute the nonlinear rheology of an ER fluid and it is cocluded that light scattering is an indirect probe of stress.
At high voltages we observe a phase bifurcation inscattering pattern that we attribute to the onset of a shearzone. Free droplets in the shear slip zone oscillate ouphase with bound chains attached to the electrodes.
ACKNOWLEDGMENTS
The work of J.E.M. and J.O. was performed at SanNational Laboratories and was supported by the U.S. Depment of Energy under Contract No. DE-AC04-94AL8500
e
-
s
@1# H. Block and J. P. Kelly, J. Phys. D21, 1661~1988!.@2# A. P. Gast and C. F. Zukoski, Adv. Colloid Interface Sci.30,
153 ~1989!.@3# R. A. Anderson, inProceedings of the International Confe
ence on Electrorheological Fluids: Mechanism, PropertieStructure, Technology and Applications, edited by R. Tao~World Scientific, Singapore, 1992!.
@4# R. A. Anderson, Langmuir10, 2917~1994!.@5# L. C. Davis, Appl. Phys. Lett.60, 319 ~1992!.@6# J. E. Martin, J. Odinek, and T. C. Halsey, Phys. Rev. Lett.69,
1524 ~1992!.@7# J. E. Martin, J. Odinek, and T. C. Halsey, Phys. Rev. E50,
3263 ~1994!.@8# J. E. Martin and J. Odinek, Phys. Rev. Lett.75, 2827~1995!.@9# J. M. Ginder, Phys. Rev. E47, 3418~1993!.
@10# K. L. Smith and G. Fuller, J. Colloid Interface Sci.155, 183~1993!.
@11# D. Adolf and T. Garino, Langmuir11, 307 ~1995!; D. Adolf,T. Garino, and B. Hance,ibid. 11, 313 ~1995!.
@12# T. C. Halsey and W. Toor, J. Stat. Phys.61, 1257~1990!.@13# T. C. Halsey and W. Toor, Phys. Rev. Lett.65, 2820~1990!.@14# R. Tao and J. M. Sun, Phys. Rev. Lett.67, 398 ~1991!.@15# T. Chen, R. N. Ritter, and R. Tao, Phys. Rev. Lett.68, 2555
~1992!.@16# T. C. Halsey, J. E. Martin, and D. Adolf, Phys. Rev. Lett.68,
1519 ~1992!.@17# J. E. Martin and R. A. Anderson, J. Chem. Phys.104, 4814
~1996!.
,
@18# J. E. Martin, D. Adolf, and T. C. Halsey, J. Colloid InterfacSci. 167, 437 ~1994!.
@19# T. C. B. McLeish, T. Jordan, and M. T. Shaw, J. Rheol.35,427 ~1991!.
@20# J. A. Powell, J. Rheol.39, 1075~1995!.@21# A. P. Philipse and A. Vrij, J. Colloid Interface Sci.128, 121
~1987!.@22# L. Landau and E. M. Lifshitz,Statistical Physics, 2nd ed.~Per-
gamon, Oxford, 1984!.@23# G. K. Batchelor,Introduction to Fluid Dynamics~Cambridge
University Press, New York, 1967!.@24# W. B. Russel, D. A. Saville, and W. R. Schowalter,Colloidal
Dispersions~Cambridge University Press, New York, 1989!,Chap. 2.
@25# D. R. Nelson, Physica A177, 220~1991!; D. R. Nelson and H.S. Seung, Phys. Rev. B39, 9153~1989!.
@26# R. D. Kamien and D. R. Nelson, J. Stat. Phys.71, 23 ~1993!.@27# J. D. Gunton and M. Droz,Introduction to the Theory of Meta
stable and Unstable States~Springer-Verlag, Berlin, 1983!.@28# J. S. Langer, M. Bar-on, and H. D. Miller, Phys. Rev. A11,
1417 ~1975!.@29# G. B. Jeffry, Proc. R. Soc. London, Ser. A102, 161 ~1922!.@30# L. Landau and E. M. Lifshitz,Electrodynamics of Continuou
Media, 2nd ed.~Pergamon, Oxford, 1984!, Chaps. 1 and 2.@31# W. Toor and T. C. Halsey, Phys. Rev. A45, 8617~1992!.@32# H. See and M. Doi, J. Phys. Soc. Jpn.60, 2778~1991!.@33# D. F. Klingenberg and C. F. Zukoski, Langmuir6, 15 ~1990!.