
Electrorheological Fluids: Mechanisms, Dynamics, and Microfluidics
34
Electrorheological Fluids: Mechanisms, Dynamics, and Microfluidics Applications Ping Sheng and Weijia Wen Department of Physics, Hong Kong University of Science and Technology, Clear Water Bay, Kowloon, Hong Kong, China; email: [email protected], [email protected] Annu. Rev. Fluid Mech. 2012. 44:143–74 First published online as a Review in Advance on September 19, 2011 The Annual Review of Fluid Mechanics is online at fluid.annualreviews.org This article’s doi: 10.1146/annurev-fluid-120710-101024 Copyright c 2012 by Annual Reviews. All rights reserved 0066-4189/12/0115-0143$20.00 Keywords induced polarization, variational effective dielectric constant formulation, giant electrorheological fluids, aligned dipolar filaments, electrorheological fluid dynamics, microfluidic logic gate Abstract Electrorheological (ER) fluids, consisting of solid particles dispersed in an insulating liquid, display the special characteristic of electric-field-induced rheological variations. Nearly six decades after their discovery, ER fluids have emerged as materials of increasing scientific fascination and practical importance. This review traces the mechanisms responsible for these fluids’ ER response and their attendant theoretical underpinnings. In particular, ER fluids are divided into two different types, dielectric electrorheologi- cal (DER) and giant electrorheological (GER), which reflect the underlying electric susceptibility arising from the induced dielectric polarization and the orientational polarization of molecular dipoles, respectively. The for- mulation of a continuum ER hydrodynamics is described in some detail. As an electric-mechanical interface, ER fluids have broad application potential in electrifying the control of mechanical devices. This review focuses on their applications in microfluidic chips, in which GER fluids have enabled a variety of digitally controlled functionalities. 143 Annu. Rev. Fluid Mech. 2012.44:143-174. Downloaded from www.annualreviews.org by Hong Kong University of Science & Technology on 02/01/12. For personal use only.
Transcript of Electrorheological Fluids: Mechanisms, Dynamics, and Microfluidics

FL44CH07-Sheng ARI 18 November 2011 11:21
Electrorheological Fluids:Mechanisms, Dynamics, andMicrofluidics ApplicationsPing Sheng and Weijia WenDepartment of Physics, Hong Kong University of Science and Technology, Clear Water Bay,Kowloon, Hong Kong, China; email: [email protected], [email protected]
Annu. Rev. Fluid Mech. 2012. 44:143–74
First published online as a Review in Advance onSeptember 19, 2011
The Annual Review of Fluid Mechanics is online atfluid.annualreviews.org
This article’s doi:10.1146/annurev-fluid-120710-101024
Copyright c© 2012 by Annual Reviews.All rights reserved
0066-4189/12/0115-0143$20.00
Keywords
induced polarization, variational effective dielectric constant formulation,giant electrorheological fluids, aligned dipolar filaments, electrorheologicalfluid dynamics, microfluidic logic gate
Abstract
Electrorheological (ER) fluids, consisting of solid particles dispersed in aninsulating liquid, display the special characteristic of electric-field-inducedrheological variations. Nearly six decades after their discovery, ER fluidshave emerged as materials of increasing scientific fascination and practicalimportance. This review traces the mechanisms responsible for these fluids’ER response and their attendant theoretical underpinnings. In particular,ER fluids are divided into two different types, dielectric electrorheologi-cal (DER) and giant electrorheological (GER), which reflect the underlyingelectric susceptibility arising from the induced dielectric polarization andthe orientational polarization of molecular dipoles, respectively. The for-mulation of a continuum ER hydrodynamics is described in some detail. Asan electric-mechanical interface, ER fluids have broad application potentialin electrifying the control of mechanical devices. This review focuses ontheir applications in microfluidic chips, in which GER fluids have enabled avariety of digitally controlled functionalities.
143
Ann
u. R
ev. F
luid
Mec
h. 2
012.
44:1
43-1
74. D
ownl
oade
d fr
om w
ww
.ann
ualr
evie
ws.
org
by H
ong
Kon
g U
nive
rsity
of
Scie
nce
& T
echn
olog
y on
02/
01/1
2. F
or p
erso
nal u
se o
nly.

FL44CH07-Sheng ARI 18 November 2011 11:21
1. INTRODUCTION
Electrorheological (ER) fluids are a type of colloid whose rheological characteristics can be alteredupon the application of an electric field. Such rheological variation is generally reversible andoccurs within 10 ms. ER fluids can serve as an electric-mechanical interface, and when they arecoupled with sensors (as triggers to activate the electric field), many mechanical devices suchas clutches, valves, and dampers may be converted into active mechanical elements capable ofresponding to environmental variations. Hence ER fluids are sometimes denoted as a type of smartfluid. The diverse application potential has made ER fluids a persistent topic of study ever sincetheir discovery over six decades ago by Winslow (1949). Initially treated as a subject of scientificcuriosity, the ER effect and the attendant search for better ER materials attracted serious researchefforts beginning in the late 1980s, fueled undoubtedly in part by their envisioned applications(Klingenberg et al. 1989; Chen et al. 1991, 1992; Tao & Sun 1991; Davis 1992a,b; Halsey 1992;Bullough 1996). In particular, there has been extensive research into the basic mechanisms of theER effect (Chen & Conrad 1994, Ma et al. 1996, Tam et al. 1997, Wen et al. 1999, Choi et al. 2001).The more recent discovery of the giant electrorheological (GER) effect (Wen et al. 2003, 2004;Huang et al. 2006), together with its appeal in the basic science of nanoparticles and their dynamics,has provided a new direction in this area. The strong electrical response of GER fluids has beenparticularly useful in a diverse array of functionalities in microfluidic chips (Nakano et al. 2002;Yoshida et al. 2002; Liu et al. 2006a,b; Niu et al. 2005, 2006a,b, 2007, 2009; Wang et al. 2010).
1.1. Heuristic Understanding of the Electrorheological Effect
Let us consider a dispersion of particles in a fluid medium. Both the particles and the fluid areelectrically nonconducting or only slightly conducting, so as to avoid electrical breakdown undera moderate electrical field. When an electric field �E is applied to such a colloidal dispersion, theparticles will be electrically polarized, owing to the difference in the dielectric constant of the solidand that of the fluid. If εs denotes the complex dielectric constant of the solid particles and ε� thatof the liquid, then for a sphere with radius R, the induced dipole moment may be expressed as
�p = εs − ε�
εs + 2ε�
R3 �El = β R3 �El . (1)
Here β is the Claussius-Mossotti (CM) factor, and �El should be understood as the field at thelocation of the particle, i.e., the local field. The resulting (induced) dipole-dipole interactionbetween the particles implies that the random dispersion is not the lowest energy state of thesystem, and particles would tend to aggregate and form chains/columns along the applied fielddirection (Figure 1). The formation of chains/columns is the reason why such colloids exhibitan increased viscosity or even solid-like behavior when sheared in a direction perpendicular tothe electric field. However, the formation of chains/columns is governed by the competitionbetween electrical energy and the Brownian motion of the particles, manifest in the value ofthe dimensionless parameter γ = �p · �E/kB T , where kB is the Boltzmann constant and T is thetemperature. For room temperature and �p given by Equation 1, γ > 1 defines the ER regime.Thus for β1/3 R ∼ 100 nm, the field should be larger than 2 kV cm−1 for the system to be in theER regime.
1.2. Two Types of Electrorheological Fluids
Electric polarization of a collection of atoms/molecules can arise in two ways from an appliedelectric field. One is the induced polarization process that underlies the traditional ER effect,
144 Sheng ·Wen
Ann
u. R
ev. F
luid
Mec
h. 2
012.
44:1
43-1
74. D
ownl
oade
d fr
om w
ww
.ann
ualr
evie
ws.
org
by H
ong
Kon
g U
nive
rsity
of
Scie
nce
& T
echn
olog
y on
02/
01/1
2. F
or p
erso
nal u
se o
nly.

FL44CH07-Sheng ARI 18 November 2011 11:21
a b c
E
Figure 1The structural evolution of dielectric microspheres under an increasing electric field, from (a) no field, to(b) a moderate field of 500 V mm−1, to (c) a strong field of 900 V mm−1. Here the electrorheological fluidconsists of 1.5-μm glass spheres suspended in silicone oil. Figure adapted from Wen et al. (2007).
Breakdown field: thevalue of the electricfield at which anelectrical breakdownwould occur
described heuristically above. We denote this type as the dielectric electrorheological (DER)effect. The other is by aligning the initially randomly oriented molecular dipoles. This secondprocess is responsible for the GER effect. It is informative to compare the salient features of thesetwo types of polarization mechanisms and their implications on the ER effect.
An important common characteristic of ER fluids is the yield stress, i.e., the shear stress beyondwhich a solidified ER fluid breaks and starts to behave like a fluid. A non-Newtonian fluid thatexhibits such behavior is generally denoted as a Bingham fluid in which the stress-shear raterelationship is given by τ = τY + ηγ , where τ denotes the shear stress, τY the yield stress, η
the viscosity, and γ the shear rate. From dimensional analysis, τY must be proportional to the(electric) polarization energy density |− �P · �E|, where �P = N�p is the polarization density, with Nthe number density of the solid particles.
For induced polarization, �P = χ �E, where χ = Nα is the dimensionless electric susceptibility.Hence |− �P · �E| = χ E2; i.e., yield stress varies quadratically with the electric field. Also, becausethere is a maximum value of polarizability α = R3, reached at the limit of εs /ε� → ∞, it follows thatthere is a maximum value for the dimensionless electric susceptibility χ = Nα � R3/(4π R3/3) ∼0.24. This maximum value foreshadows the upper bound for the yield stress, 1.38
√R/δ(ε� E2/8π ),
where δ denotes the separation between the particles. Because the applied electric field is alwayslimited by the breakdown field, on the order of 5 kV mm−1, the yield stress achievable by most ofthe traditional ER effect is usually on the order of a few kilopascals.
For molecular dipoles, the polarization is the result of competition between the alignmentenergy − �po · �E = −p0 E cos θ and thermal Brownian motion, where θ denotes the angle betweenthe electric field and the molecular dipole moment p0. The thermally averaged dipole moment〈p〉 is given by the Langevin function 〈p〉 = po (coth x − x−1), where x = p0 E/kB T . For x 1, wehave 〈 �p〉 = po x/3 = [p2
o /(3kB T )] �E, or αp = p2o /3kB T . It follows that the electric susceptibility
at room temperature has a value χp ∼ Nαp ≈ 4–50, depending on the (maximum) number densityused. Regardless, χp � χ by one to two orders of magnitude, which implies that there is thepotential to break the yield stress upper bound imposed by the induced polarization mechanism,provided the molecular dipoles can be harnessed to an advantage. However, such expectation mustbe tempered by the fact that the electrical manifestations of molecular dipoles are usually maskedeither by random orientations, as in the liquid state, or by quadrupolar pairings, as in the case ofsolid configurations.
An important development in the study of ER fluids is the discovery of the GER effect in thedispersion of nanoparticles, comprising barium titanate oxalate [BaTiO(C2O4)2] coated with ananoscale layer of urea molecules, in silicone oil (Wen et al. 2003). The GER fluid can exceedby one to two orders of magnitude the theoretical upper bound on the yield stress imposed by
www.annualreviews.org • Electrorheological Fluids 145
Ann
u. R
ev. F
luid
Mec
h. 2
012.
44:1
43-1
74. D
ownl
oade
d fr
om w
ww
.ann
ualr
evie
ws.
org
by H
ong
Kon
g U
nive
rsity
of
Scie
nce
& T
echn
olog
y on
02/
01/1
2. F
or p
erso
nal u
se o
nly.

FL44CH07-Sheng ARI 18 November 2011 11:21
the induced polarization mechanism, as well as exhibit a linear dependency of the yield stresson the electric field that is distinct from that in conventional DER fluids. Below we discuss themechanism with which the molecular dipoles of the urea molecules, each with a dipole momentof 4.6 debyes, are harnessed in achieving the GER effect.
1.3. Outline of This Review
In what follows, Section 2 briefly reviews the DER mechanism and the conceptual advance thatmade its quantitative modeling possible. In particular, the variational effective dielectric constantformulation and the attendant implementation using Bergman-Milton representation theory aredescribed, together with some comparisons with experiments. The GER effect and its theoreticalunderpinnings, both phenomenological and microscopic, are presented in Section 3. Section 4addresses ER fluid dynamics from the continuum hydrodynamic point of view and presents resultsof a numerical implementation with predictions regarding the various aspects of Bingham fluidbehavior. Section 5 briefly reviews the present status of the use of GER fluids to achieve digitallycontrolled functionalities in microfluidic chips.
2. MECHANISM OF THE DIELECTRICELECTRORHEOLOGICAL EFFECT
By using the model of induced dipole-dipole interactions, one can demonstrate that for a systemof identical dielectric microspheres dispersed in insulating fluid, the lowest energy state is forthe microspheres to aggregate and form columns along the applied field direction, with a mi-crostructure inside the columns predictable from the dipole-dipole interaction (Tao & Sun 1991).However, such a simple picture leaves many questions unanswered. In particular, as the parti-cles aggregate and touch, multipole interactions (those beyond the dipole interaction) necessarilybecome dominant, and the local field effect must also be taken into account. Conductivity andrelaxational effects, appearing as the imaginary part of the particle or fluid dielectric constants,may also contribute to the DER effect. These complications make the theory of the DER effectquite complex, and hence most initial work in this area proceeded by direct simulations. Based on atheory incorporating the dynamics of both fluid and solid particles, Bonnecaze & Brady (1992a,b)performed simulations on systems comprising 25 or 49 particles, in two spatial dimensions.Klingenberg and colleagues (1989, 1991a,b, 1993; Klingenberg 1993) carried out simulationsbased on the interaction of point dipoles (subsequently also extended to beyond the point dipolelimit) with hard core repulsion, coupled with Stokes hydrodynamic drag on the particles, aimedat understanding the rheology and kinetics of structure formation in DER fluids. Hass (1993)performed simulations excluding the Brownian force and analyzed the structure formation fromhis data. Similar studies were also performed by Tao’s group (Tao & Jiang 1994, Gulley & Tao1997). Wang et al. (1996, 2000) considered the many-body effect (e.g., as in the local field effect)and simulated structure formation and transition in ER fluids. Hu et al. (1994) conducted simula-tions by considering the torque on solid particles under an AC applied electric field and, based ona simple model, partly included two-body hydrodynamic interactions. Davis (1992a,b) carried outfinite-element calculations to analyze the force arising from the polarization or conductivity ofthe particles. Conrad and coworkers (Chen et al. 1991, Chen & Conrad 1994, Conrad & Sprecher1994, Shih et al. 1994, Tang et al. 1995a,b) have developed model theories, including the effectsof the conductivity, along with experimental studies.
More recently, Yethiraj & van Blaaderen (2003) used confocal microscopy to experimentallyexplore the phase behavior of a colloidal system with a tunable interparticle interaction (from
146 Sheng ·Wen
Ann
u. R
ev. F
luid
Mec
h. 2
012.
44:1
43-1
74. D
ownl
oade
d fr
om w
ww
.ann
ualr
evie
ws.
org
by H
ong
Kon
g U
nive
rsity
of
Scie
nce
& T
echn
olog
y on
02/
01/1
2. F
or p
erso
nal u
se o
nly.
FL44CH07-Sheng ARI 18 November 2011 11:21
hard sphere to soft) under an external electric field. Hynninen & Dijkstra (2005) calculated theHelmholtz free energy of similar systems using simulations and obtained a full phase diagram thatagreed well with Yethiraj & van Blaaderen’s experimental results. Bossis et al. (2007) developed amodel that reproduced the experimentally measured size distribution of chains and their formationkinetics in DER fluids. Using confocal microscopy, Agarwal & Yethiraj (2009) found a novelcellular network phase in a low-density colloidal suspension on the application of a uniform ACfield. Sun & Yu (2003) studied the ground state of DER fluids comprising particles with differentdielectric constants, whereas Shen et al. (2006) investigated the microstructure of polydisperseDER fluids from an energetics point of view by using the finite-element method. Ivlev et al.(2008) reported the first observation of the DER effect in complex plasmas by performing amicrogravity experiment as well as a molecular dynamics simulation. It should also be noted thatChoi and coworkers (Cho et al. 2004, Choi & Jhon 2009) have devoted efforts to the fabricationof polymeric ER materials.
While much can be learned from simulations and experiments about the rheology and hydro-dynamics of DER fluids, they nevertheless cannot lead to an overview of the DER mechanism thatmay allow, e.g., quantitative predictions on the DER rheological effect, resolution on the issue ofthe contribution from (or the lack of ) the conductivity of the solid particles and the fluid, and thetheoretical formulation for obtaining an upper bound on the DER effect. In particular, the upperbound can be useful in providing a picture of the characteristics of the optimal DER particles,as well as the necessary guidelines for engineering designs involving the use of DER fluids. Thefollowing section proposes a variational theory that can address all these relevant issues.
2.1. Variational Effective Dielectric Function Formulation
The microstructural variation accompanying the field-induced rheological characteristics shouldalso have electrical manifestations. In particular, because the solid-fluid composite becomesanisotropic under the application of an electric field, such anisotropy must be reflected in theeffective dielectric constant of the system. Here the effective dielectric constant is defined by
〈 �D〉 = εeff 〈 �E〉, (2a)
εeff =
⎛⎜⎝εxx εxy εxz
εyx εyy εyz
εzx εzy εzz
⎞⎟⎠ , (2b)
where 〈 �D〉 denotes the spatially averaged displacement field, 〈 �E〉 is the spatially averaged electricfield (assumed to be along the z direction), and the matrix elements of εeff are complex in general[in the form of κ + i (4πσ/ω), with σ the conductivity and ω the angular frequency of the appliedelectric field].
The concept of the effective dielectric constant is based on the nature of the electromagneticwave interaction with inhomogeneous materials. When the wavelength is much larger than thescale of the heterogeneities, the microstructure can no longer be resolved, and the compositeappears homogeneous to the probing wave. In that limit, the electromagnetic response of thecomposite is fully captured by the effective dielectric constant tensor (Bergman & Stroud 1992).
The effective dielectric constant–tensor elements are dependent on the relative volume frac-tion(s) of the constituents and their respective dielectric constants, as well as the anisotropy and themicrostructure of their arrangement. In particular, differences in the close-packed microstructuresought to be reflected in the effective dielectric constant–tensor elements, provided the theory fortheir evaluations is sufficiently accurate.
www.annualreviews.org • Electrorheological Fluids 147
Ann
u. R
ev. F
luid
Mec
h. 2
012.
44:1
43-1
74. D
ownl
oade
d fr
om w
ww
.ann
ualr
evie
ws.
org
by H
ong
Kon
g U
nive
rsity
of
Scie
nce
& T
echn
olog
y on
02/
01/1
2. F
or p
erso
nal u
se o
nly.

FL44CH07-Sheng ARI 18 November 2011 11:21
The dielectric constant tensor directly participates in the Gibbs free energy density expressionf of the fluid-solid composite:
f = − 18π
�E · Re(εeff ) · �E − TS = − 18π
Re(εzz)E2 − TS, (3)
where S denotes entropy, and Re( ) means that we take the real part of the quantity in theparenthesis. As the stated focus of this review is the ER effect, we may treat the entropy termas small when compared to the electrical part of the energy. A variational formulation of theDER problem may then be obtained by requiring the minimization of f through the maximizationof Re(εzz) with respect to the microstructure of the solid particles (Ma et al. 1996). A successfulprogram in carrying out this maximization would not only obtain the DER ground-state structure,but also lay the basis for the quantitative evaluation of the rheological characteristics that can arisefrom the distortion of such a structure (Ma et al. 1996, Tam et al. 1997).
The variational effective dielectric constant approach solves, in one step, all the difficultiesposed above. In particular, the local field effect and the multipole interactions are all accounted for,provided the effective dielectric constant can be evaluated accurately. In addition, the contributionof the imaginary part of the dielectric constant may also be incorporated through the imaginaryparts of the components’ dielectric constants.
2.2. Effective Dielectric Constant: The Bergman-MiltonSpectral Representation
To evaluate εzz, we find that the Bergman-Milton spectral function representation (Bergman1978a,b, 1985; Milton 1979, 1981a,b, 2002; Bergman & Stroud 1992) of the effective dielectricconstant provides the best approach for our purposes. The starting point of our considerations isthe Laplace equation
∇ · [ε(�r)∇ϕ(�r)] = 0. (4)
Here ϕ is the electrical potential, i.e., �E = −∇ϕ, and ε(�r) is the local dielectric constant, given by
ε(�r) = ε�
[1 − 1
sϑ(�r)
], (5a)
where
s = ε�
ε� − εs, (5b)
ε� denotes the liquid dielectric constant, and εs is the solid dielectric constant. Here ϑ is thecharacteristic function, defined to be 1 inside the solid particles and zero elsewhere. The micro-geometric information of the system is captured by ϑ . In contrast, the parameter s (which can becomplex) contains the material characteristics. For later developments, it is important to note thatif the dielectric constants are real, then the value of s is either greater than 1 or less than zero. Inother words, a real s cannot take any value between zero and 1. Equation 4 is to be solved with theboundary conditions ϕ(x, y, z = 0) = 0 and ϕ(x, y, z = L) = L (i.e., average Ez = −1). As εzz isdefined by
εzz = 1V
∫dV {ε�[1 − ϑ(�r)] + εs ϑ(�r)}∂ϕ(�r)
∂z, (6)
it is not difficult to show that (see below) it can be expressed in the spectral representation
εzz = ε�
(1 − 1
V
∑u
|〈z|ϕu〉|2s − su
), (7)
148 Sheng ·Wen
Ann
u. R
ev. F
luid
Mec
h. 2
012.
44:1
43-1
74. D
ownl
oade
d fr
om w
ww
.ann
ualr
evie
ws.
org
by H
ong
Kon
g U
nive
rsity
of
Scie
nce
& T
echn
olog
y on
02/
01/1
2. F
or p
erso
nal u
se o
nly.

FL44CH07-Sheng ARI 18 November 2011 11:21
where ϕu and su are respectively the eigenfunctions and their associated eigenvalues of the integral(Hermitian) operator �, defined as
� =∫
dV ′ϑ(�r ′)∇′G(�r, �r ′) · ∇′. (8)
Here G(�r, �r ′) = 1/4π |�r−�r ′| is the Green function, and � is Hermitian with the following definitionof the inner product:
〈ψ |ϕ〉 =∫
dVϑ(�r)∇ψ∗(�r) · ∇ϕ(�r). (9)
Equation 7 can be derived by first noting that Equation 6 can be expressed in the inner productform as
εzz = ε�
(1 − s −1
V〈z|ϕ〉
).
A formal solution of the potential may be obtained by rewriting Equation 4 as a Poisson equation:
∇2ϕ = 1s∇ · [ϑ(�r)∇ϕ].
Solving this equation by integrating the inhomogeneous source term on the right-hand side withthe Green function yields
ϕ = z + 1s
�
�ϕ,
where z represents the homogeneous part of the solution, given by the applied electric fieldEz = −1. A formal solution of the potential is then obtained as
ϕ =(
1 − 1s
�
�
)−1
z.
This formal solution can be expanded in terms of the�
� operator’s eigenfunctions as
|ϕ〉 =∑
u
(1 − 1
s�
�
)−1
|ϕu〉〈ϕu|z〉 =∑
u
|ϕu〉 ss − su
〈ϕu|z〉.
Substitution of this formal solution into the inner product form of εzz leads to Equation 7.The integral operator � is noted to be a projection operator, as can be seen from
Equation 8, because the Green function may be regarded as the inverse of the Laplacian op-erator (two successive gradient operators). Hence the eigenvalues of � lie between zero and 1.
In Equation 7, V is the sample volume, a normalization factor. The most remarkable feature ofthis equation, which is exact, is that the material properties, given by s, are completely separatedfrom the geometric information (contained in ϕu and su) as filtered by the Laplacian. Becauseboth the solid and liquid dielectric constants can be complex, s is a complex number in general.At the same time, it is clear that if s is real, then its value as given by Equation 5b should beeither less than zero or greater than 1, as noted above. Because both |〈z|ϕu〉|2 and su are real, withthe additional constraint that 0 < su < 1 as already stated, it follows that s − su can approachzero only in limiting cases, i.e., at zero and 1, and these cases define the upper bounds for theshear modulus and yield stress, described below. Equation 7 also makes clear that the imaginary
www.annualreviews.org • Electrorheological Fluids 149
Ann
u. R
ev. F
luid
Mec
h. 2
012.
44:1
43-1
74. D
ownl
oade
d fr
om w
ww
.ann
ualr
evie
ws.
org
by H
ong
Kon
g U
nive
rsity
of
Scie
nce
& T
echn
olog
y on
02/
01/1
2. F
or p
erso
nal u
se o
nly.
FL44CH07-Sheng ARI 18 November 2011 11:21
Table 1 Comparison of the effective εzz for various lattice structures
Structure
εs/ε� BCT FCC HCP BCC SC Diamond10 Exact 2.167 2.156 2.156 2.043 1.911 1.627
Dipole 2.031 1.994 1.995 1.905 1.734 1.601
800 Exact 5.173 5.129 5.129 4.205 3.518 1.976
Dipole 3.376 3.188 3.194 2.798 2.230 1.897
Abbreviations: BCT, body centered tetragonal; FCC, face centered cubic; HCP, hexagonal closed packed; BCC, bodycentered cubic; SC, simple cubic.
parts of the dielectric constants can indeed contribute to Re(εzz) (through the complex materialparameter s) and hence the DER effect.
2.3. Predictions of the Variational Formulationand Comparisons with Experiments
By using the spectral representation and the effective dielectric constant formulation, quantitativepredictions become possible for a DER fluid comprising uniform-sized microspheres dispersed inan insulating liquid.
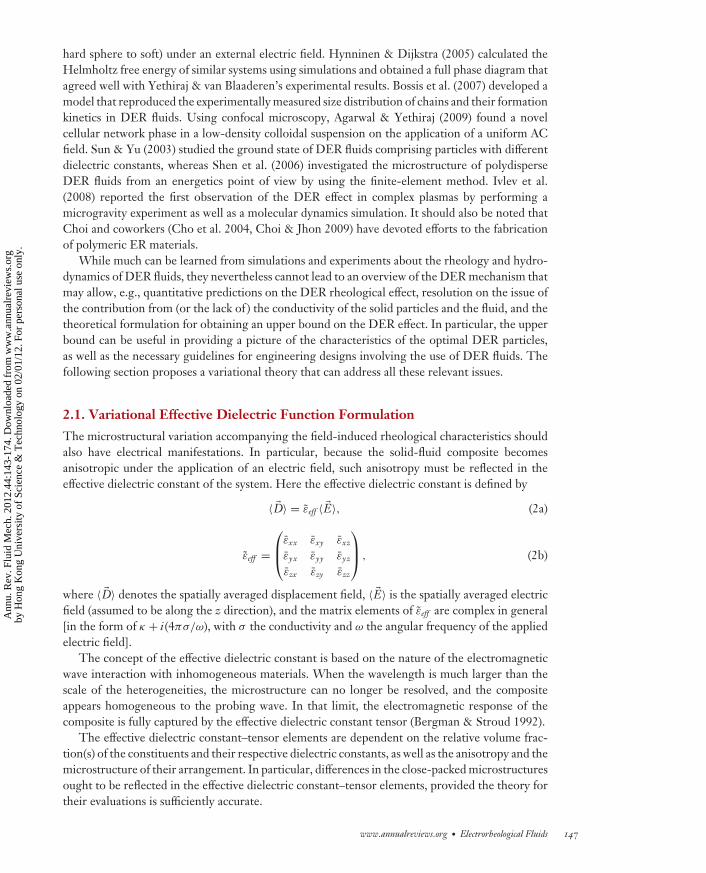
2.3.1. Ground-state microstructure. For uniform-sized microspheres, the lowest energy stateshould correspond with a periodic microstructure that maximizes Re(εzz). The computationalformalism for the numerical evaluation of Equation 7 has been detailed elsewhere (Ma et al.2003, Sheng & Wen 2010). The calculated values of εzz for the various structures are shown inTable 1, at two ratios of εs /ε� = 10 and 800. In the calculations, the separation between thespheres is 5 × 10⁻³ in units of R, and the volume fraction of solid particles is 0.2. For comparison,results using just the dipole approximation are also shown. In Table 1, for the effective dielectricconstant values inside the close-packed columns, the face centered cubic value is in fact slightlylarger than that for the body centered tetragonal (BCT) value, owing to the higher packing density.However, when averaged over the whole sample, the BCT value always wins slightly, regardlessof the values of the material constants or solid volume fractions.
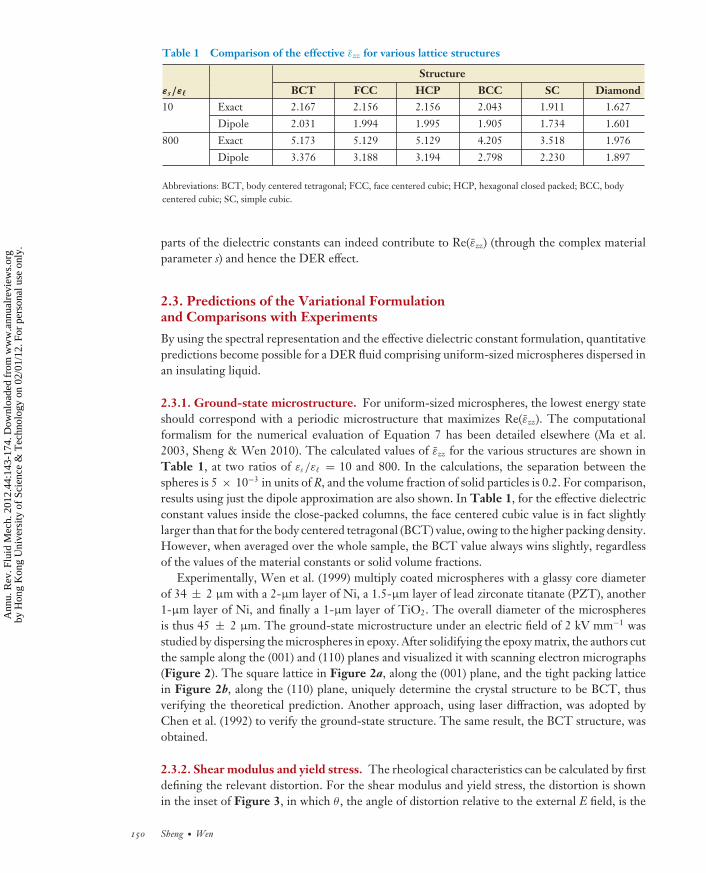
Experimentally, Wen et al. (1999) multiply coated microspheres with a glassy core diameterof 34 ± 2 μm with a 2-μm layer of Ni, a 1.5-μm layer of lead zirconate titanate (PZT), another1-μm layer of Ni, and finally a 1-μm layer of TiO2. The overall diameter of the microspheresis thus 45 ± 2 μm. The ground-state microstructure under an electric field of 2 kV mm−1 wasstudied by dispersing the microspheres in epoxy. After solidifying the epoxy matrix, the authors cutthe sample along the (001) and (110) planes and visualized it with scanning electron micrographs(Figure 2). The square lattice in Figure 2a, along the (001) plane, and the tight packing latticein Figure 2b, along the (110) plane, uniquely determine the crystal structure to be BCT, thusverifying the theoretical prediction. Another approach, using laser diffraction, was adopted byChen et al. (1992) to verify the ground-state structure. The same result, the BCT structure, wasobtained.
2.3.2. Shear modulus and yield stress. The rheological characteristics can be calculated by firstdefining the relevant distortion. For the shear modulus and yield stress, the distortion is shownin the inset of Figure 3, in which θ , the angle of distortion relative to the external E field, is the
150 Sheng ·Wen
Ann
u. R
ev. F
luid
Mec
h. 2
012.
44:1
43-1
74. D
ownl
oade
d fr
om w
ww
.ann
ualr
evie
ws.
org
by H
ong
Kon
g U
nive
rsity
of
Scie
nce
& T
echn
olog
y on
02/
01/1
2. F
or p
erso
nal u
se o
nly.
FL44CH07-Sheng ARI 18 November 2011 11:21
a b
(001) (110)E
Figure 2Body centered tetragonal structure formed by multiply coated microspheres under an electric field(2 kV mm−1). The structure is frozen in epoxy and visualized through cross-sectional scanning electronmicrographs. In panel a, the cut was along the (001) plane, and in panel b, the cut was along the (110) plane.Figure adapted from Wen et al. (1999).
strain variable. For the BCT lattice, shearing in the direction perpendicular to the z axis createsnot only a tilt away from the electric-field direction by an angle θ , but also a distortion in thelattice constants c and a given by c/R = 2/cosθ , a/R = [8 − (c2/2R2)]1/2. Thus under shear, thevolume fraction of solid spheres in the BCT structure is also dependent on θ . For small θ , εzz(θ )may be expanded about its optimal value as
Re[
εzz(θ )ε�
]= Re
[εzz(0)
ε�
]− 1
2μθ2 + − − −, (10)
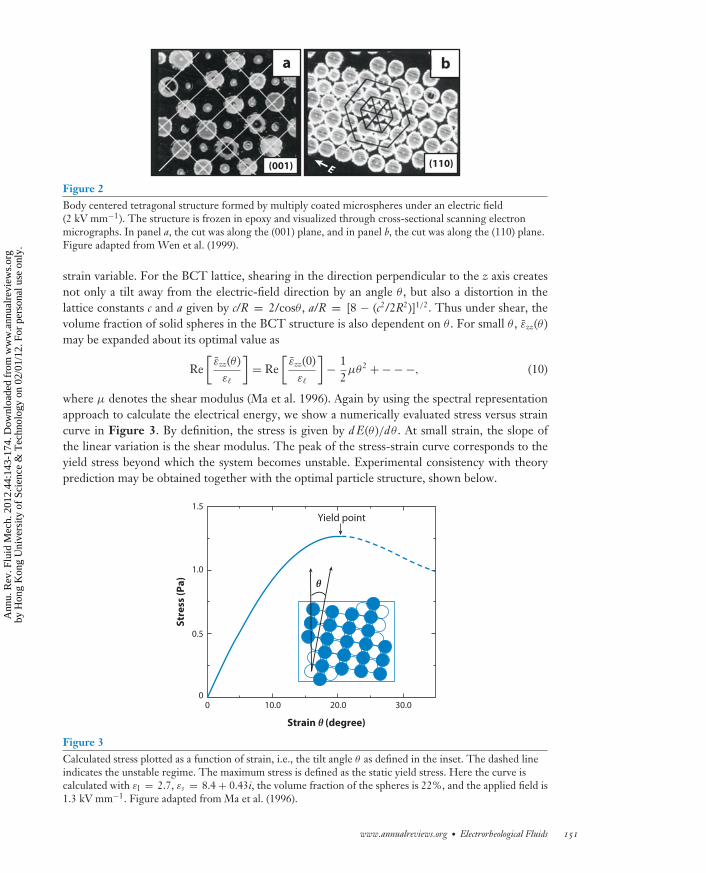
where μ denotes the shear modulus (Ma et al. 1996). Again by using the spectral representationapproach to calculate the electrical energy, we show a numerically evaluated stress versus straincurve in Figure 3. By definition, the stress is given by d E(θ )/dθ . At small strain, the slope ofthe linear variation is the shear modulus. The peak of the stress-strain curve corresponds to theyield stress beyond which the system becomes unstable. Experimental consistency with theoryprediction may be obtained together with the optimal particle structure, shown below.
00
10.0 20.0 30.0
0.5
1.0
1.5
Str
ess
(P
a)
Strain θ (degree)
θ
Yield point
Figure 3Calculated stress plotted as a function of strain, i.e., the tilt angle θ as defined in the inset. The dashed lineindicates the unstable regime. The maximum stress is defined as the static yield stress. Here the curve iscalculated with εl = 2.7, εs = 8.4 + 0.43i, the volume fraction of the spheres is 22%, and the applied field is1.3 kV mm−1. Figure adapted from Ma et al. (1996).
www.annualreviews.org • Electrorheological Fluids 151
Ann
u. R
ev. F
luid
Mec
h. 2
012.
44:1
43-1
74. D
ownl
oade
d fr
om w
ww
.ann
ualr
evie
ws.
org
by H
ong
Kon
g U
nive
rsity
of
Scie
nce
& T
echn
olog
y on
02/
01/1
2. F
or p
erso
nal u
se o
nly.
FL44CH07-Sheng ARI 18 November 2011 11:21
2.3.3. Upper bounds and optimal particle structure. The upper bounds (Ma et al. 2003) to theshear modulus and yield stress are directly related to the potential for the divergence of εzz shownin the spectral representation. From Equation 7, this can only happen when the denominator onthe right-hand side vanishes, i.e., when both s and su approach either zero or 1. Here we presentthe case of the zero limit. To obtain the physical upper bounds, we let εs → ∞ so that s → 0. Wealso note that su would approach zero only when the spheres touch. Hence a (small) separationδ between the surfaces of the neighboring spheres is specified, and the shear modulus and yieldstress are evaluated as a function of the ratio δ/R. The upper bounds thus obtained are 1.9(R/δ)for the shear modulus and 1.38
√R/δ for the static yield stress, both in units of the energy density
ε� E2/8π . For δ = 1 A (atomic separation) and R = 20 μm, we get 15,120(ε� E2) for the maximumshear modulus and 617(ε� E2) for the maximum yield stress. If ε� = 2.5 and E = 1 kV mm−1,these expressions translate into 4 MPa and 8 kPa, respectively.
To verify the particle size R and separation δ dependencies of the yield stress upper bound,researchers fabricated doubly coated microspheres with uniform-sized glassy cores and Ni andTiO2 outer coatings, using the electroless plating (for the Ni coating) and sol-gel (for the TiO2
coating) methods sequentially. Two different sizes of the core glass microspheres were used (1.5 μmand 50 μm in diameter). Here the Ni coating makes the microspheres polarizable enough so thatwe can take s to be nearly zero, and the TiO2 coating sets a value for δ.
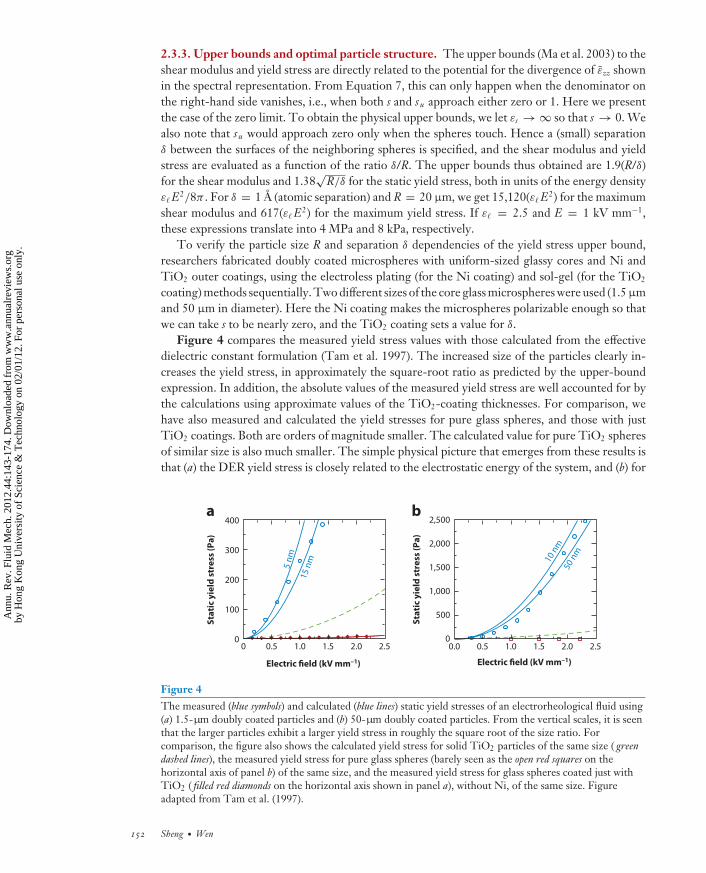
Figure 4 compares the measured yield stress values with those calculated from the effectivedielectric constant formulation (Tam et al. 1997). The increased size of the particles clearly in-creases the yield stress, in approximately the square-root ratio as predicted by the upper-boundexpression. In addition, the absolute values of the measured yield stress are well accounted for bythe calculations using approximate values of the TiO2-coating thicknesses. For comparison, wehave also measured and calculated the yield stresses for pure glass spheres, and those with justTiO2 coatings. Both are orders of magnitude smaller. The calculated value for pure TiO2 spheresof similar size is also much smaller. The simple physical picture that emerges from these results isthat (a) the DER yield stress is closely related to the electrostatic energy of the system, and (b) for
a b
Electric field (kV mm–1)
0.0 0.5 1.0 1.5 2.0 2.5
Sta
tic
yie
ld s
tre
ss (
Pa
)
0
1,000
500
1,500
2,000
2,500
10 n
m50
nm
Electric field (kV mm–1)
0 0.5 1.0 1.5 2.0 2.5
Sta
tic
yie
ld s
tre
ss (
Pa
)
0
200
100
300
400
5 n
m
15
nm
Figure 4The measured (blue symbols) and calculated (blue lines) static yield stresses of an electrorheological fluid using(a) 1.5-μm doubly coated particles and (b) 50-μm doubly coated particles. From the vertical scales, it is seenthat the larger particles exhibit a larger yield stress in roughly the square root of the size ratio. Forcomparison, the figure also shows the calculated yield stress for solid TiO2 particles of the same size ( greendashed lines), the measured yield stress for pure glass spheres (barely seen as the open red squares on thehorizontal axis of panel b) of the same size, and the measured yield stress for glass spheres coated just withTiO2 ( filled red diamonds on the horizontal axis shown in panel a), without Ni, of the same size. Figureadapted from Tam et al. (1997).
152 Sheng ·Wen
Ann
u. R
ev. F
luid
Mec
h. 2
012.
44:1
43-1
74. D
ownl
oade
d fr
om w
ww
.ann
ualr
evie
ws.
org
by H
ong
Kon
g U
nive
rsity
of
Scie
nce
& T
echn
olog
y on
02/
01/1
2. F
or p
erso
nal u
se o
nly.

FL44CH07-Sheng ARI 18 November 2011 11:21
LCR meter:meter that measureselectrical inductance,capacitance, andresistance
a given applied electric field, the electrostatic energy can be maximized by the field distributionand dielectric constant of the materials. The metallic coating of the doubly coated microsphereslimits the field distribution to the dielectric areas occupied by the TiO2 coating and the siliconeoil. The thin TiO2 coatings ensure small separations, thus producing high internal fields. Theenhanced ER effect is the result (Tam et al. 1997).
The doubly coated glassy microspheres are in a sense ideal for the DER effect. However, therequirement of large sphere size is not optimal from an application point of view because largemicrospheres also tend to sediment, unless the density can be matched with that of the fluid.
2.3.4. Anisotropy and nonlinearity of the effective dielectric constant. As the variationalapproach is based on the optimization of the effective dielectric constant, it is important to checkexperimentally if the dielectric constant indeed increases and displays anisotropy under the appli-cation of an electric field. However, when the applied field is fairly large, it is difficult to determinethe dielectric constant along the electric-field direction. To overcome this difficulty, investigatorshave utilized the similarity in the microstructure under an electric field with that under a magneticfield.
Special particles were prepared as silica spheres 35 ± 3 μm in diameter coated with an innerNi layer and an outer dielectric layer, such as PZT and TiO2, formed by using electroless platingand sol-gel processes, respectively. These particles respond to both the electric field and themagnetic field. The dielectric constants along the z (magnetic-field direction) and x directions(εzz and εxx), measured by an LCR meter, are shown in Figure 5 (Ma et al. 2003). Whereas εzz
displays an increasing trend with the magnetic field, as expected, the εxx component displays aslight decrease. These trends are independent of whether the outer coating is PZT or TiO2. Thetheory predictions of the asymptotic dielectric constant values, obtained by using the spectralfunction approach, are shown in Table 2. Here the inputs to the calculations are determined by
4.2
5.0
4.4
4.6
4.8
5.4
5.2
0 1,000 2,000 3,000
H (G)
4,000
a
PZT
TiO2
0.12
0.20
0.14
0.16
0.18
0.22
0.24
0.26
0.28
H (G)
b
PZT
TiO2
0 1,000 2,000 3,000 4,000
zz
zz
xx
xx
Re
(εzz
or ε x
x)
lm(ε
zz o
r ε x
x)
Figure 5Dependences of the (a) real (Re) and (b) imaginary (Im) parts of the dielectric constant on the applied magnetic-field strength. Here thevolume fraction is 0.27, and the frequency of the LCR meter is fixed at 1 kHz. Figure adapted from Ma et al. (2003).
www.annualreviews.org • Electrorheological Fluids 153
Ann
u. R
ev. F
luid
Mec
h. 2
012.
44:1
43-1
74. D
ownl
oade
d fr
om w
ww
.ann
ualr
evie
ws.
org
by H
ong
Kon
g U
nive
rsity
of
Scie
nce
& T
echn
olog
y on
02/
01/1
2. F
or p
erso
nal u
se o
nly.

FL44CH07-Sheng ARI 18 November 2011 11:21
Table 2 Theory-experiment comparison for the zz and xx components of the effective dielectricconstants
Theory Experiment
Structure Re(ε) Im(ε) Re(ε) Im(ε)Random Fitted Fitted 4.95 0.13PZT coating zz 5.67 0.23 5.29 0.14
xx 4.75 0.11 4.94 0.12
Random Fitted Fitted 4.26 0.26
TiO2 coating zz 4.56 0.37 4.44 0.28
xx 4.15 0.23 4.25 0.25
the values of the real and imaginary parts of the effective dielectric constants when the system isisotropic (H = 0). It is seen that reasonably good agreement is obtained.
3. MECHANISM OF THE GIANT ELECTRORHEOLOGICAL EFFECT
Since its discovery (Wen et al. 2003), the GER mechanism has been a topic of interest. Huanget al. (2006) have presented a phenomenological model. Tan et al. (2009) calculated local electricfields between two particles using the finite-element approach and concluded that the local fieldcan cause a saturation polarization of the coated polar molecules. Shen et al. (2009) proposed amodel based on the interaction between polar molecules and the induced charge on the particlesto explain the alignment of molecular dipoles. In terms of materials fabrication, Cheng et al.(2009, 2010), Lu et al. (2009), Shen et al. (2009), Yin & Zhao (2004), and Wang et al. (2007)have synthesized different types of inorganic materials that exhibit the GER effect. Below we basethe exposition of the GER effect on the material system of urea-coated nanoparticles of bariumtitanate oxalate (Wen et al. 2003).
3.1. Characteristics of Giant Electrorheological Fluids
Figure 6a shows the structure of GER particles, comprising a ∼50-nm core of barium titanateoxalate, with a 5-nm coating of urea (Wen et al. 2003). Figure 6b shows the column formation
b c a
E
20 nm0.1 mm20 nm
Urea
BaTiO(C2O4)2
E
Figure 6Images of nanoparticles in giant electrorheological suspensions. (a) Transmission electron micrograph ofcoated nanoparticles. The urea coatings, ∼5 nm in thickness, are clearly seen. (b) Optical microscope imageof a sample prepared in epoxy, solidified under an applied field E of 2 kV mm−1. Columns aligned along thefield direction are visible. (c) Transmission electron micrograph of a section of the column shown in panel b.The arrows indicate one of the flattened interfaces. Figure adapted from Wen et al. (2003).
154 Sheng ·Wen
Ann
u. R
ev. F
luid
Mec
h. 2
012.
44:1
43-1
74. D
ownl
oade
d fr
om w
ww
.ann
ualr
evie
ws.
org
by H
ong
Kon
g U
nive
rsity
of
Scie
nce
& T
echn
olog
y on
02/
01/1
2. F
or p
erso
nal u
se o
nly.

FL44CH07-Sheng ARI 18 November 2011 11:21
Electric field (V mm–1)
0.1
1
100
10
20 504030 60 8070
0
20
60
40
80
120
100
140
0 1,000 2,000 3,000 4,000 5,000 6,000
Concentration
15%
30%Yie
ld s
tre
ss (
kP
a)
√E (V mm–1)0.5J
(μA
cm
–2)
Figure 7Static yield stress plotted as a function of the applied electric field for two solid concentrations. The symbolsdenote experiment, and the solid lines are theory. (Inset) Logarithm of the current density J plotted as afunction of
√E. The dashed straight lines serve to delineate the relationship �nJ ∼ √
E, indicating themechanism of activation over the Coulomb barrier (the Poole-Frenkel effect). At the very moderate field of1 kV mm−1, the linear behavior of the yield stress is already established, indicating that a saturatedpolarization layer contributes to the giant electrorheological effect. Figure adapted from Wen et al. (2003).
when an electric field was applied. Figure 6c illustrates that under an electric field, the coatingsof the nanoparticles are significantly deformed, indicating a degree of softness in the coating.
Figure 7 plots the measured yield stress and current density (shown in the inset) as a function ofthe applied electric field. A prominent feature is the near-linear dependency of the yield stress onthe electric field. This is only possible if the yield stress arises not from induced polarization, butrather from the saturation polarization of permanent molecular dipoles so that in the expression− �Po · �E, the polarization density is a constant, and the resulting yield stress is therefore linear inthe applied field, with a magnitude that can break the theoretical upper bound for the inducedpolarization mechanism.
It should be noted that GER fluids are very oil sensitive. By using silicone oil, one can obtainthe effect shown in Figure 7, but with the same particles dispersed in pure decane, the GEReffect can disappear completely (Gong et al. 2008). Such a large contrast implies that oil plays asynergistic role in the GER effect. An important clue to this oil sensitivity is the consistency ofthe mixture one can obtain by using two different oils, e.g., silicone oil and decane. For siliconeoil, the consistency is like that of light yogurt, but for decane the consistency is like that of mud.Therefore, the particles can be better dispersed in silicone oil than in decane; i.e., there is a wettingeffect between silicone oil and GER particles.
Another qualitative difference between GER and DER fluids lies in the yield stress scalingwith respect to the particle size. For DER fluids, we demonstrate above that the yield stress variesroughly as
√R; i.e., larger particles imply a larger ER effect. However, in GER fluids, the yield
www.annualreviews.org • Electrorheological Fluids 155
Ann
u. R
ev. F
luid
Mec
h. 2
012.
44:1
43-1
74. D
ownl
oade
d fr
om w
ww
.ann
ualr
evie
ws.
org
by H
ong
Kon
g U
nive
rsity
of
Scie
nce
& T
echn
olog
y on
02/
01/1
2. F
or p
erso
nal u
se o
nly.

FL44CH07-Sheng ARI 18 November 2011 11:21
Yield stress
5
40
30
20
10
00 0.05 0.10 0.15 0.20 0.25
5 Å
5 Å2 Å
0
–5
–10
–15
–201 2 3 4 5 6 7 8 9 10
E
b
w
a
w (Å)
E/p2
(m
m–
3)
0
Str
ess
(k
Pa
)
Strain θ (radian)
θ
Figure 8Illustration of the phenomenological model of the giant electrorheological effect with calculated results. (a) Shown in the upper left is aschematic picture of our model, consisting of two coated spheres, each with a 50-nm-diameter core and a 5-nm coating (both with ε =60). The gap, with width w, has ε = 2 (for silicone oil). The solid curve shows the calculated interaction energy divided by p2
0 betweentwo pairs of nearest-neighbor surface dipoles, each with p0 = 4.6 debyes and separated laterally by 4.5 A (ε = 1 between the dipoles),when w increases from 2 A. (b) The stress numerically calculated from the finite-element method, at an electric field of 2 kV mm−1, isplotted as a function of the strain. The yield stress point corresponds to the point of separation between the two spheres. Figureadapted from Wen et al. (2003).
stress varies as 1/R (Wen et al. 2004), implying that the GER effect is interfacial in character sothat smaller particles would display a larger effect.
3.2. A Phenomenological Model of the Giant Electrorheological Effect
A phenomenological model was formulated to explain the GER effect (Huang et al. 2006). It isbased on the following elements.
The foremost assumption of the phenomenological model is that the molecular dipoles of ureacan form aligned dipolar layers in the contact region between two coated nanoparticles, undera moderate applied electric field. This is the source of the strong adhesion responsible for theGER effect and is shown schematically in Figure 8a. At distances larger than 10 nm, i.e., in thenoncontact state, the application of an electric field will induce some orientational polarization(as described by the Langevin function) in the molecular dipoles, and the approach to contact willfollow the DER mechanism described above.
The equilibrium contact state is represented by the balance of the (attractive) electrostaticforce with the (repulsive) elastic force, with the elastic deformation of the two coated spheres incontact given by the Hertzian solution (Huang et al. 2006). Mathematical details of the modelare presented in Supplemental Appendix A (follow the Supplemental Material link from theAnnual Reviews home page at http://www.annualreviews.org).
The predictions of the model are in good agreement with measured results, as seen inFigure 7. In particular, the linear dependency on the applied electric field and the magnitudeof the GER effect is a direct reflection of the surface saturation polarization. Another predictionof the model is that because the effect owes its origin to interfacial saturation polarization, moresurface area (hence smaller particles) would enhance the GER effect. This turns out to be thecase (Wen et al. 2004).
156 Sheng ·Wen
Supplemental Material
Ann
u. R
ev. F
luid
Mec
h. 2
012.
44:1
43-1
74. D
ownl
oade
d fr
om w
ww
.ann
ualr
evie
ws.
org
by H
ong
Kon
g U
nive
rsity
of
Scie
nce
& T
echn
olog
y on
02/
01/1
2. F
or p
erso
nal u
se o
nly.
FL44CH07-Sheng ARI 18 November 2011 11:21
2.9 nm Silicone oil chains
Urea molecules
Water molecules
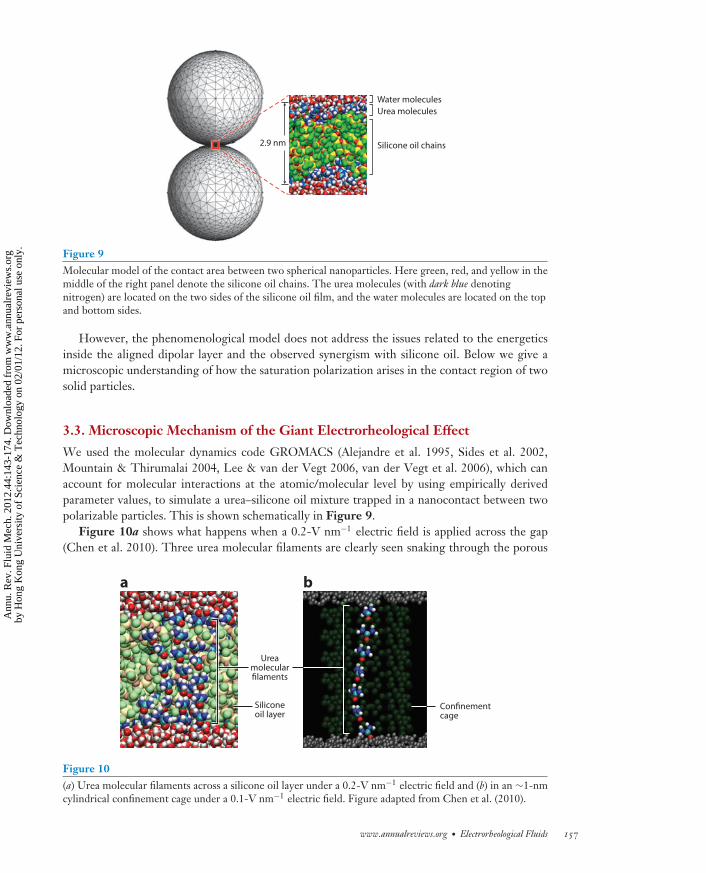
Figure 9Molecular model of the contact area between two spherical nanoparticles. Here green, red, and yellow in themiddle of the right panel denote the silicone oil chains. The urea molecules (with dark blue denotingnitrogen) are located on the two sides of the silicone oil film, and the water molecules are located on the topand bottom sides.
However, the phenomenological model does not address the issues related to the energeticsinside the aligned dipolar layer and the observed synergism with silicone oil. Below we give amicroscopic understanding of how the saturation polarization arises in the contact region of twosolid particles.
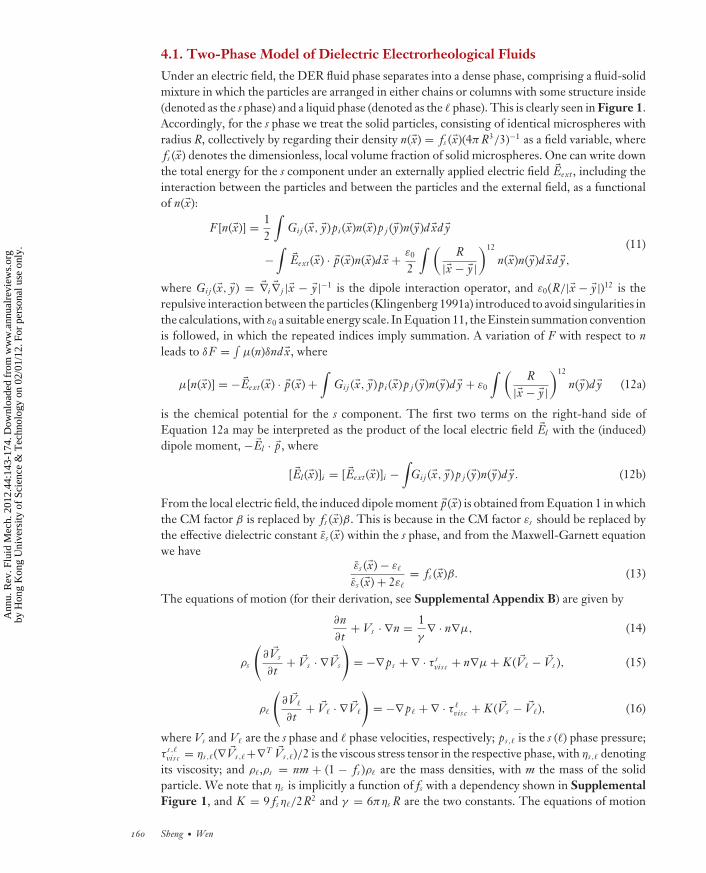
3.3. Microscopic Mechanism of the Giant Electrorheological Effect
We used the molecular dynamics code GROMACS (Alejandre et al. 1995, Sides et al. 2002,Mountain & Thirumalai 2004, Lee & van der Vegt 2006, van der Vegt et al. 2006), which canaccount for molecular interactions at the atomic/molecular level by using empirically derivedparameter values, to simulate a urea–silicone oil mixture trapped in a nanocontact between twopolarizable particles. This is shown schematically in Figure 9.
Figure 10a shows what happens when a 0.2-V nm−1 electric field is applied across the gap(Chen et al. 2010). Three urea molecular filaments are clearly seen snaking through the porous
a b
Ureamolecularfilaments
Siliconeoil layer
Confinementcage
Figure 10(a) Urea molecular filaments across a silicone oil layer under a 0.2-V nm−1 electric field and (b) in an ∼1-nmcylindrical confinement cage under a 0.1-V nm−1 electric field. Figure adapted from Chen et al. (2010).
www.annualreviews.org • Electrorheological Fluids 157
Ann
u. R
ev. F
luid
Mec
h. 2
012.
44:1
43-1
74. D
ownl
oade
d fr
om w
ww
.ann
ualr
evie
ws.
org
by H
ong
Kon
g U
nive
rsity
of
Scie
nce
& T
echn
olog
y on
02/
01/1
2. F
or p
erso
nal u
se o
nly.

FL44CH07-Sheng ARI 18 November 2011 11:21
oil chains to bridge the two surfaces. Inside each filament, the dipoles are predominantly aligned.In contrast, we have also conducted a simulation in which the gap region is occupied completelyby the liquid-like urea molecules (but with the same bounding surfaces with the water molecules).We found that at least 0.6 V nm−1 of electric field is required to partially align the urea molecules;i.e., there is a lowering of the required electric field for dipole alignment by a factor of two tothree. The two simulation cases considered, with and without the silicone oil chains, are meantto correspond to the wetting and nonwetting cases, respectively, because only if the silicone oilwets the particles would it be situated inside a nanoscale gap; otherwise a nonwetting oil wouldbe excluded, and a gap full of urea molecules is a more likely scenario.
To confirm that the confinement effect of the silicone oil chains is playing a major role, we haveartificially constructed a cylindrical confinement cage by using positionally fixed Lennard-Jonesparticles with the same force-field parameters as the methyl group, and the result obtained at0.1 V nm−1 is shown in Figure 10b, in which a filament of aligned molecular dipoles is clearlyseen. As the cage does not undergo thermal Brownian motion, the cage’s confinement effect isshown to be much more effective, evidenced by the formation of a filament at a field nearly oneorder of magnitude smaller than that required for liquid-state urea.
A simple explanation of this phenomenon is that the one-dimensional (1D) confinement de-creases the orientational entropic phase space of the urea dipoles and thereby significantly increasesthe urea dipoles’ sensitivity to the applied field (Chen et al. 2010). This effect may be mathemat-ically formulated: Whereas for the 3D case we have 〈p〉3D/p0 = coth(p0 E/kB T ) − (kB T /p0 E),where p0 = 4.6 debyes for urea molecules, in the 1D case, it is given by 〈p〉1D/p0 =tanh(p0 E/kB T ). At any given E, �p = 〈p〉1D − 〈p〉3D is always positive (e.g., at 0.3 V nm−1
the difference is 2.12 debyes); therefore, −�p · E provides a driving energy/force for the ureamolecules to develop a more diffuse interface with the oil film, in the form of 1D filaments pen-etrating the oil film (under an electric field), which is porous on the molecular scale. This isespecially the case as the number of hydrogen bonds per urea molecules is nearly the same ineither the 3D amorphous state or the 1D filaments. Also, in the limit in which p0 E/kB T 1, itis easy to see that in one dimension, αm = p2
o /kB T , which is exactly a factor of three larger thanthat in three dimensions.
It should be noted that there are hydrogen-bonding interactions in the system. But the numberof hydrogen bonds in the 1D filament configuration is well balanced against that in the 3Ddispersion; hence the 3D-to-1D crossover in the urea molecules’ microgeometry emerges as thedominant factor. Moreover, as E → ∞, we have �p → kB T /E, which implies that −�p · Eapproaches a constant value, −kB T , independent of E. This is consistent with the simulationresults showing that as E → ∞, there is a saturation behavior for the maximum gap width(∼9 nm) beyond which no filament formation was observed. This behavior is consistent with thesurface scaling aspect of the GER effect (Wen et al. 2004, Chen et al. 2010). �p · E → kB T isnoted to arise from the difference of two degrees of freedom between the 3D and 1D case; hencetwo times (1/2)kB T (the equipartition energy) is exactly kB T .
GROMACS simulations also confirm the synergism with silicone oil (Gong et al. 2008) becauseit is polar (having oxygen atoms in its chains) and thus more permeable to urea. It also wets theurea-coated nanoparticles.
The formation of aligned dipolar filaments provides a ready explanation for the observed yieldstress versus electric-field behavior, as the yield stress is directly proportional to the electricalenergy density. This can be seen as follows. For a linear stress-strain (τ−ε) relationship τ = aε,the yield stress is given by τY = aεo , with εo the critical strain. Because the energy density isgiven by (1/2)aε2, we thus have τY = 2Wo /εo , where Wo = (1/2)aε2
o . That is, the yield stress isproportional to the energy density as deduced above from dimensional analysis. If the stress-strain
158 Sheng ·Wen
Ann
u. R
ev. F
luid
Mec
h. 2
012.
44:1
43-1
74. D
ownl
oade
d fr
om w
ww
.ann
ualr
evie
ws.
org
by H
ong
Kon
g U
nive
rsity
of
Scie
nce
& T
echn
olog
y on
02/
01/1
2. F
or p
erso
nal u
se o
nly.

FL44CH07-Sheng ARI 18 November 2011 11:21
Ele
ctri
cal
en
erg
y d
en
sity
(M
Pa
)
Electric field (V nm–1)
80
70
60
50
40
30
20
10
0
0 0.2
Results from MD simulations
Sample 1
Sample 2
Sample 3
0.4 0.6 0.8 1.0
Figure 11Electrical energy density plotted as a function of the electric field in the nanogap (red curve). Scaled datafrom three sets of experiments are superposed on the curve. The electric field E is obtained from themeasured field Em by E = αEm, where α is the field enhancement factor. The measured yield stress Y isrelated to the electrical energy density �W by �W = βY /10, where β is the volume dilution factor. Thevalues of (α,β) for sample 1 (Wen et al. 2003), sample 2 (Wen et al. 2004), and sample 3 (Gong et al. 2008)are (281.2, 7,590), (100, 974), and (100, 1,010), respectively. Figure adapted from Chen et al. (2010).
relationship is not strictly linear, the constant a can be adjusted to account for its effect on theenergy density.
We have calculated the total potential energy density of the simulation box at different fields,with the zero-field total potential energy density subtracted off. The resulting difference �W isnegative, indicating a large attraction between the two bounding surfaces. Plotted in Figure 11is the variation of |�W | as a function of the electric field. To compare with experimental data,one must scale this energy density by a volume dilution factor β for the energy density of theGER fluid because the nanoscale gap considered here constitutes the region of closest approachbetween two nanoparticles. Hence the gap electrical energy should be averaged over a volume onthe order of d 3, with d the nanoparticle diameter. For d ∼ 50–100 nm and our sample volume of190 nm3, β ∼ 1,000–10,000. Also, as noted above, the field in the contact region is enhanced by afactor γ ∼ 100–300 when compared with the externally applied field. All three data sets shown inFigure 11 agree well with the curve obtained from the MD simulations, and the values of α andβ fall within the physically reasonable range.
4. ELECTRORHEOLOGICAL FLUID DYNAMICS
It is desirable to have a continuum hydrodynamic theory for ER fluids because discrete particlesimulations, even at the level of point dipole interactions only, simply cannot routinely handlethe large systems that are necessary for comparison with experiments. The Onsager variationalprinciple offers a systematic approach to derive the equations of motion by accounting for twoimportant elements in our complex system: dissipation and free energy. A description of theOnsager principle, together with the derivation of the ER hydrodynamic equations of motion andtheir numerical implementation, is given in Supplemental Appendix B. Here we present themodel, the relevant continuum hydrodynamic equations of motion, and simulation results (Zhanget al. 2008a). For simplicity, we consider only DER fluids in the limit of dipole interactions.
www.annualreviews.org • Electrorheological Fluids 159
Supplemental Material
Ann
u. R
ev. F
luid
Mec
h. 2
012.
44:1
43-1
74. D
ownl
oade
d fr
om w
ww
.ann
ualr
evie
ws.
org
by H
ong
Kon
g U
nive
rsity
of
Scie
nce
& T
echn
olog
y on
02/
01/1
2. F
or p
erso
nal u
se o
nly.
FL44CH07-Sheng ARI 18 November 2011 11:21
4.1. Two-Phase Model of Dielectric Electrorheological Fluids
Under an electric field, the DER fluid phase separates into a dense phase, comprising a fluid-solidmixture in which the particles are arranged in either chains or columns with some structure inside(denoted as the s phase) and a liquid phase (denoted as the � phase). This is clearly seen in Figure 1.Accordingly, for the s phase we treat the solid particles, consisting of identical microspheres withradius R, collectively by regarding their density n(�x) = fs (�x)(4π R3/3)−1 as a field variable, wherefs (�x) denotes the dimensionless, local volume fraction of solid microspheres. One can write downthe total energy for the s component under an externally applied electric field �Eext , including theinteraction between the particles and between the particles and the external field, as a functionalof n(�x):
F [n(�x)] = 12
∫Gi j (�x, �y)pi (�x)n(�x)p j (�y)n(�y)d �xd �y
−∫
�Eext(�x) · �p(�x)n(�x)d �x + ε0
2
∫ (R
|�x − �y |)12
n(�x)n(�y)d �xd �y,
(11)
where Gi j (�x, �y) = �∇i �∇ j |�x − �y |−1 is the dipole interaction operator, and ε0(R/|�x − �y |)12 is therepulsive interaction between the particles (Klingenberg 1991a) introduced to avoid singularities inthe calculations, with ε0 a suitable energy scale. In Equation 11, the Einstein summation conventionis followed, in which the repeated indices imply summation. A variation of F with respect to nleads to δF = ∫
μ(n)δnd �x, where
μ[n(�x)] = − �Eext(�x) · �p(�x) +∫
Gi j (�x, �y)pi (�x)p j (�y)n(�y)d �y + ε0
∫ (R
|�x − �y |)12
n(�y)d �y (12a)
is the chemical potential for the s component. The first two terms on the right-hand side ofEquation 12a may be interpreted as the product of the local electric field �El with the (induced)dipole moment, − �El · �p , where
[ �El (�x)]i = [ �Eext(�x)]i −∫
Gi j (�x, �y)p j (�y)n(�y)d �y . (12b)
From the local electric field, the induced dipole moment �p(�x) is obtained from Equation 1 in whichthe CM factor β is replaced by fs (�x)β. This is because in the CM factor εs should be replaced bythe effective dielectric constant εs (�x) within the s phase, and from the Maxwell-Garnett equationwe have
εs (�x) − ε�
εs (�x) + 2ε�
= fs (�x)β. (13)
The equations of motion (for their derivation, see Supplemental Appendix B) are given by
∂n∂t
+ Vs · ∇n = 1γ
∇ · n∇μ, (14)
ρs
(∂ �Vs
∂t+ �Vs · ∇ �Vs
)= −∇ ps + ∇ · τ s
vi s c + n∇μ + K ( �V� − �Vs ), (15)
ρ�
(∂ �V�
∂t+ �V� · ∇ �V�
)= −∇ p� + ∇ · τ �
vi s c + K ( �Vs − �V�), (16)
where Vs and V� are the s phase and � phase velocities, respectively; ps ,� is the s (�) phase pressure;τ
s ,�vi s c = ηs ,�(∇ �Vs ,�+∇T �Vs ,�)/2 is the viscous stress tensor in the respective phase, with ηs ,� denoting
its viscosity; and ρ�,ρs = nm + (1 − fs )ρ� are the mass densities, with m the mass of the solidparticle. We note that ηs is implicitly a function of fs with a dependency shown in SupplementalFigure 1, and K = 9 fs η�/2R2 and γ = 6πηs R are the two constants. The equations of motion
160 Sheng ·Wen
Ann
u. R
ev. F
luid
Mec
h. 2
012.
44:1
43-1
74. D
ownl
oade
d fr
om w
ww
.ann
ualr
evie
ws.
org
by H
ong
Kon
g U
nive
rsity
of
Scie
nce
& T
echn
olog
y on
02/
01/1
2. F
or p
erso
nal u
se o
nly.
FL44CH07-Sheng ARI 18 November 2011 11:21
are supplemented by the subsidiary (incompressibility) conditions ∇ · �Vs ,� = 0, together with theboundary conditions of normal components of ∇μ, with �Vs ,� zero at the solid boundary, and notangential slip for �Vs ,�.
Equation 14 is in the form of a continuity equation for the number density n. The right-hand side is the divergence of a current density derived from the Onsager principle. In ac-cordance with the linear response framework, this current density is proportional to the gra-dient of a potential—the chemical potential in the present case. Because in the linear re-sponse framework the current density and the force density are linearly related, here by thecoefficient γ , we find that the force density n∇μ also appears on the right-hand side ofEquation 15. Through the chemical potential, this term contains all the electrical effects, such asthe dipole-dipole interaction. The last terms on the right-hand sides of Equations 15 and 16 rep-resent the relative friction between the two phases; hence they have opposite signs. The first twoterms on the right-hand sides of Equations 15 and 16 are standard in the Navier-Stokes equation.However, the viscosity for the s phase, whose behavior is given in Supplemental Figure 1, isnoted to be the Newtonian component of the colloidal viscosity, applicable only at low shearingrates. At moderate to high shearing rates, the effective viscosity can be lower than that indicated inSupplemental Figure 1, but that will not materially affect the predicted behaviors shown below.
4.2. Predictions and Experimental Verification
We present theory predictions on two Bingham fluid characteristics: the yield stress, which canhave either a static or a dynamic value, and the Poiseuille flow profile. Another type of predictionis on the electrode configuration dependency of the shear stress, which is beyond the Binghamfluid model.
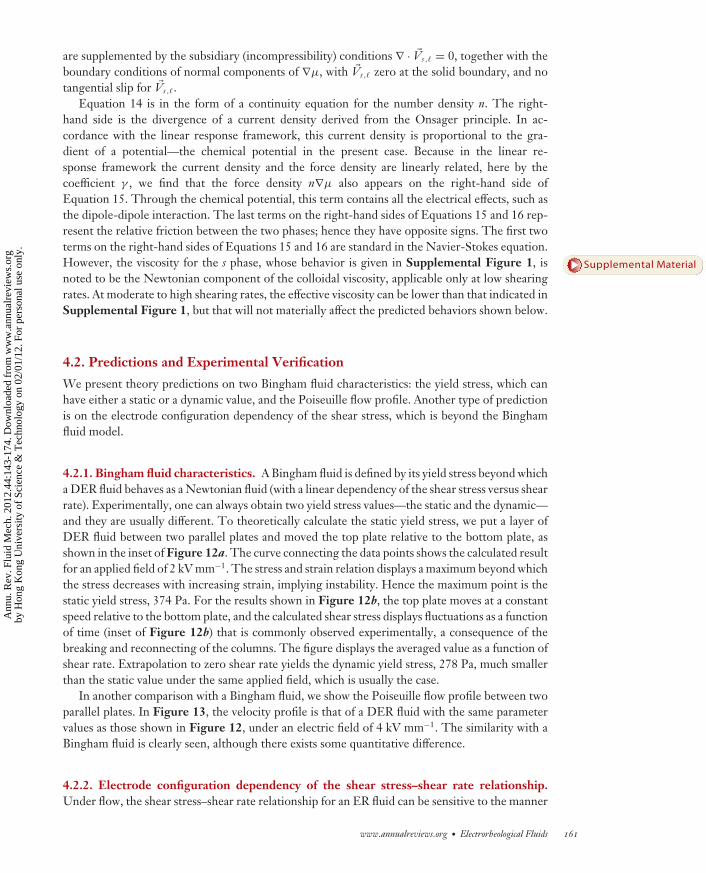
4.2.1. Bingham fluid characteristics. A Bingham fluid is defined by its yield stress beyond whicha DER fluid behaves as a Newtonian fluid (with a linear dependency of the shear stress versus shearrate). Experimentally, one can always obtain two yield stress values—the static and the dynamic—and they are usually different. To theoretically calculate the static yield stress, we put a layer ofDER fluid between two parallel plates and moved the top plate relative to the bottom plate, asshown in the inset of Figure 12a. The curve connecting the data points shows the calculated resultfor an applied field of 2 kV mm−1. The stress and strain relation displays a maximum beyond whichthe stress decreases with increasing strain, implying instability. Hence the maximum point is thestatic yield stress, 374 Pa. For the results shown in Figure 12b, the top plate moves at a constantspeed relative to the bottom plate, and the calculated shear stress displays fluctuations as a functionof time (inset of Figure 12b) that is commonly observed experimentally, a consequence of thebreaking and reconnecting of the columns. The figure displays the averaged value as a function ofshear rate. Extrapolation to zero shear rate yields the dynamic yield stress, 278 Pa, much smallerthan the static value under the same applied field, which is usually the case.
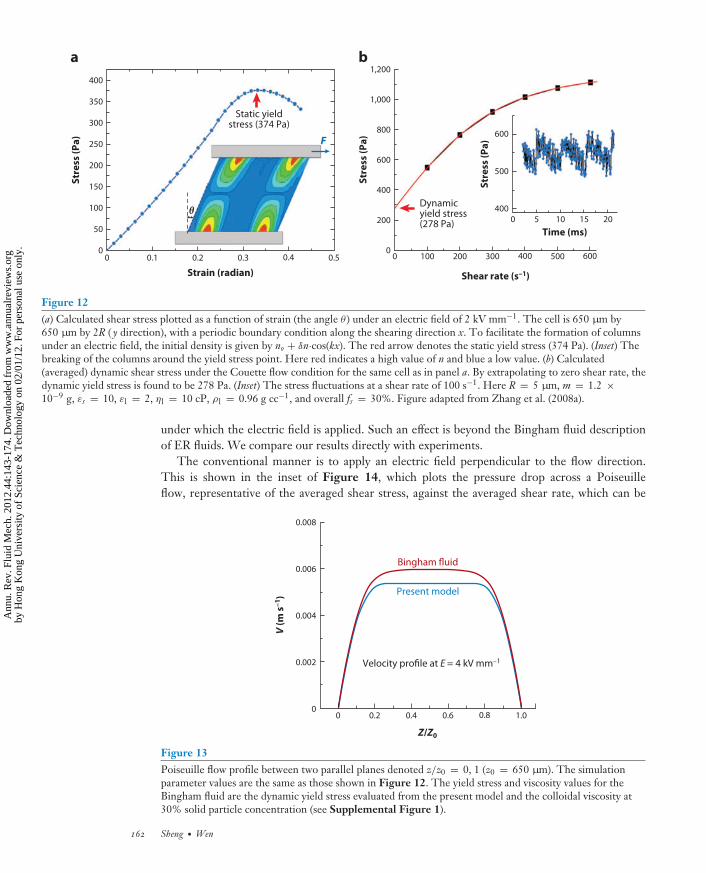
In another comparison with a Bingham fluid, we show the Poiseuille flow profile between twoparallel plates. In Figure 13, the velocity profile is that of a DER fluid with the same parametervalues as those shown in Figure 12, under an electric field of 4 kV mm−1. The similarity with aBingham fluid is clearly seen, although there exists some quantitative difference.
4.2.2. Electrode configuration dependency of the shear stress–shear rate relationship.Under flow, the shear stress–shear rate relationship for an ER fluid can be sensitive to the manner
www.annualreviews.org • Electrorheological Fluids 161
Supplemental Material
Ann
u. R
ev. F
luid
Mec
h. 2
012.
44:1
43-1
74. D
ownl
oade
d fr
om w
ww
.ann
ualr
evie
ws.
org
by H
ong
Kon
g U
nive
rsity
of
Scie
nce
& T
echn
olog
y on
02/
01/1
2. F
or p
erso
nal u
se o
nly.
FL44CH07-Sheng ARI 18 November 2011 11:21
0 0.40.30.20.1 0.50
50
100
150
200
250
300
350
400
F
Strain (radian)
Stre
ss (P
a)a
0 400300200100 500
Shear rate (s–1)
6000
200
400
600
800
1,000
1,200
Stre
ss (P
a)
400
500
600
0 2015105
Stre
ss (P
a)
b
θ
Time (ms)
Static yieldstress (374 Pa)
Dynamic yield stress (278 Pa)
Figure 12(a) Calculated shear stress plotted as a function of strain (the angle θ ) under an electric field of 2 kV mm−1. The cell is 650 μm by650 μm by 2R ( y direction), with a periodic boundary condition along the shearing direction x. To facilitate the formation of columnsunder an electric field, the initial density is given by no + δn·cos(kx). The red arrow denotes the static yield stress (374 Pa). (Inset) Thebreaking of the columns around the yield stress point. Here red indicates a high value of n and blue a low value. (b) Calculated(averaged) dynamic shear stress under the Couette flow condition for the same cell as in panel a. By extrapolating to zero shear rate, thedynamic yield stress is found to be 278 Pa. (Inset) The stress fluctuations at a shear rate of 100 s−1. Here R = 5 μm, m = 1.2 ×10⁻⁹ g, εs = 10, εl = 2, ηl = 10 cP, ρl = 0.96 g cc−1, and overall fs = 30%. Figure adapted from Zhang et al. (2008a).
under which the electric field is applied. Such an effect is beyond the Bingham fluid descriptionof ER fluids. We compare our results directly with experiments.
The conventional manner is to apply an electric field perpendicular to the flow direction.This is shown in the inset of Figure 14, which plots the pressure drop across a Poiseuilleflow, representative of the averaged shear stress, against the averaged shear rate, which can be
Bingham fluid
Velocity profile at E = 4 kV mm–1
Present model
0 0.80.60.40.2 1.0
Z/Z0
0
0.006
0.004
0.002
0.008
V (m
s–
1)
Figure 13Poiseuille flow profile between two parallel planes denoted z/z0 = 0, 1 (z0 = 650 μm). The simulationparameter values are the same as those shown in Figure 12. The yield stress and viscosity values for theBingham fluid are the dynamic yield stress evaluated from the present model and the colloidal viscosity at30% solid particle concentration (see Supplemental Figure 1).
162 Sheng ·Wen
Ann
u. R
ev. F
luid
Mec
h. 2
012.
44:1
43-1
74. D
ownl
oade
d fr
om w
ww
.ann
ualr
evie
ws.
org
by H
ong
Kon
g U
nive
rsity
of
Scie
nce
& T
echn
olog
y on
02/
01/1
2. F
or p
erso
nal u
se o
nly.
FL44CH07-Sheng ARI 18 November 2011 11:21
+V
–V
E
1,000 1,500 2,000 2,5000
10
5
20
15
Shear rate (s–1)
ΔPE
R (
kP
a)
1 kV mm–1
2 kV mm–1
3 kV mm–1
4 kV mm–1
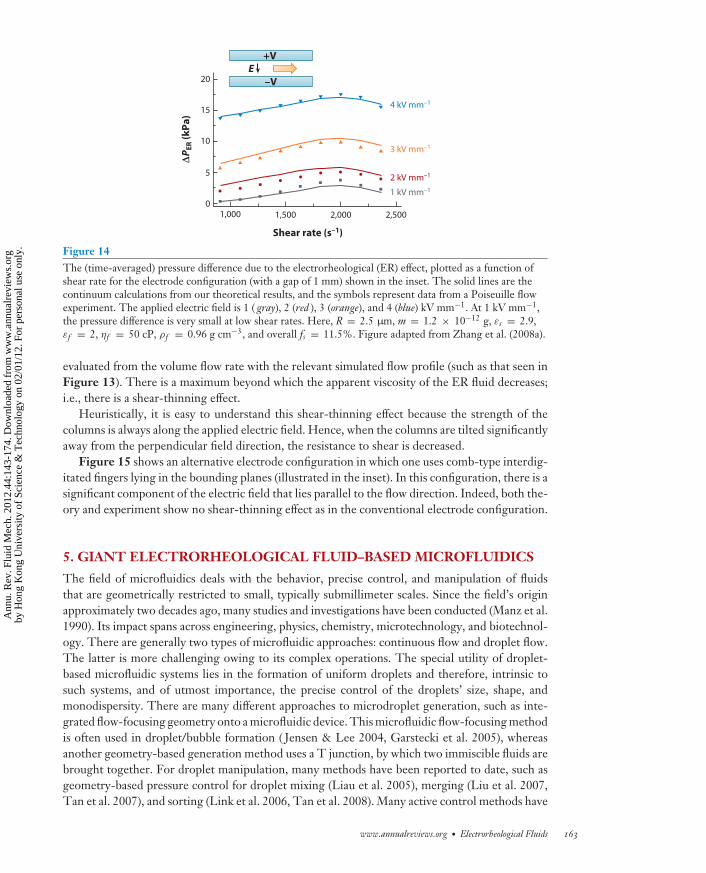
Figure 14The (time-averaged) pressure difference due to the electrorheological (ER) effect, plotted as a function ofshear rate for the electrode configuration (with a gap of 1 mm) shown in the inset. The solid lines are thecontinuum calculations from our theoretical results, and the symbols represent data from a Poiseuille flowexperiment. The applied electric field is 1 ( gray), 2 (red ), 3 (orange), and 4 (blue) kV mm−1. At 1 kV mm−1,the pressure difference is very small at low shear rates. Here, R = 2.5 μm, m = 1.2 × 10⁻¹² g, εs = 2.9,εf = 2, ηf = 50 cP, ρf = 0.96 g cm−3, and overall fs = 11.5%. Figure adapted from Zhang et al. (2008a).
evaluated from the volume flow rate with the relevant simulated flow profile (such as that seen inFigure 13). There is a maximum beyond which the apparent viscosity of the ER fluid decreases;i.e., there is a shear-thinning effect.
Heuristically, it is easy to understand this shear-thinning effect because the strength of thecolumns is always along the applied electric field. Hence, when the columns are tilted significantlyaway from the perpendicular field direction, the resistance to shear is decreased.
Figure 15 shows an alternative electrode configuration in which one uses comb-type interdig-itated fingers lying in the bounding planes (illustrated in the inset). In this configuration, there is asignificant component of the electric field that lies parallel to the flow direction. Indeed, both the-ory and experiment show no shear-thinning effect as in the conventional electrode configuration.
5. GIANT ELECTRORHEOLOGICAL FLUID–BASED MICROFLUIDICS
The field of microfluidics deals with the behavior, precise control, and manipulation of fluidsthat are geometrically restricted to small, typically submillimeter scales. Since the field’s originapproximately two decades ago, many studies and investigations have been conducted (Manz et al.1990). Its impact spans across engineering, physics, chemistry, microtechnology, and biotechnol-ogy. There are generally two types of microfluidic approaches: continuous flow and droplet flow.The latter is more challenging owing to its complex operations. The special utility of droplet-based microfluidic systems lies in the formation of uniform droplets and therefore, intrinsic tosuch systems, and of utmost importance, the precise control of the droplets’ size, shape, andmonodispersity. There are many different approaches to microdroplet generation, such as inte-grated flow-focusing geometry onto a microfluidic device. This microfluidic flow-focusing methodis often used in droplet/bubble formation ( Jensen & Lee 2004, Garstecki et al. 2005), whereasanother geometry-based generation method uses a T junction, by which two immiscible fluids arebrought together. For droplet manipulation, many methods have been reported to date, such asgeometry-based pressure control for droplet mixing (Liau et al. 2005), merging (Liu et al. 2007,Tan et al. 2007), and sorting (Link et al. 2006, Tan et al. 2008). Many active control methods have
www.annualreviews.org • Electrorheological Fluids 163
Ann
u. R
ev. F
luid
Mec
h. 2
012.
44:1
43-1
74. D
ownl
oade
d fr
om w
ww
.ann
ualr
evie
ws.
org
by H
ong
Kon
g U
nive
rsity
of
Scie
nce
& T
echn
olog
y on
02/
01/1
2. F
or p
erso
nal u
se o
nly.

FL44CH07-Sheng ARI 18 November 2011 11:21
Shear rate (s–1)
2
10
4
6
8
– + –
–+ +
2,000 3,000 4,000 5,000ΔP
ER
(k
Pa
)
1 kV mm–1
1.5 kV mm–1
2 kV mm–1
Figure 15The pressure difference due to the electrorheological (ER) effect plotted as a function of shear rate for theplanar, alternate electrode configuration. The symbols and lines represent the experimental and ourtheoretical results, respectively. The electric field is equal to 1 (red ), 1.5 (orange), and 2 (blue) kV mm−1.Here, R = 2.5 μm, m = 1.2 × 10⁻¹² g, εs = 2.9, εf = 2, ηf = 50 cP, ρf = 0.96 g cm−3, and overallfs = 11.5%. Figure adapted from Zhang et al. (2008a).
also been realized recently, such as hydrostatic pressure (Luo et al. 2007), temperature gradient(Mazouchi & Homsy 2001), thermal expansion (Zhu et al. 2005), optical approaches (Baroud et al.2007, Jeffries et al. 2007), magnetic field (Psaltis et al. 2006), and electrical control ( Joung et al.2000, Ahn et al. 2006, Priest et al. 2006, Chabert & Viovy 2008), including electrostatic (Link et al.2006), electrokinetic effect (Indeikina & Chang 2002), dielectrophoresis (Schwartz et al. 2004),and electrowetting (Pollack et al. 2002, Ren et al. 2003, Paik et al. 2003).
Recent experiments have shown that GER fluids can be used as highly effective smart mediumsto develop different types of microfluidic components, owing to their strong ER response. Belowwe present droplet manipulation and microfluidic logic gates based on the use of GER fluiddroplets. Successful implementations of GER fluid–based valves, pumps, and microfluidic mixersare presented in Supplemental Appendix C.
5.1. Microfluidic Droplet Manipulation
Droplet microfluidics has attracted increasing attention from diverse fields because it requiresonly a small amount of materials and less time, produces less waste, and has the potential of highlyintegrated and computer-controlled reaction processes for chemistry and biology. In previouswork, we employed a microfluidic flow-focusing approach together with a digital control systemto generate GER droplets with which some applications have been realized (Zhang et al. 2008b,2009; Niu et al. 2007, 2009). In the following, we review some recent results of GER fluid–basedmicrofluidic droplet generation and manipulation as well as the pertinent achievements.
GER droplets can be generated by a flow-focusing approach shown in Figure 16a, in whicha continuous-phase GER fluid (nanoparticles mixed with sunflower oil) and two streams of puresilicone oil were injected into the main channel through a center inlet and two side inlets, re-spectively. By properly controlling the flow rates of both the GER fluid and silicone oil, one can
164 Sheng ·Wen
Supplemental Material
Ann
u. R
ev. F
luid
Mec
h. 2
012.
44:1
43-1
74. D
ownl
oade
d fr
om w
ww
.ann
ualr
evie
ws.
org
by H
ong
Kon
g U
nive
rsity
of
Scie
nce
& T
echn
olog
y on
02/
01/1
2. F
or p
erso
nal u
se o
nly.
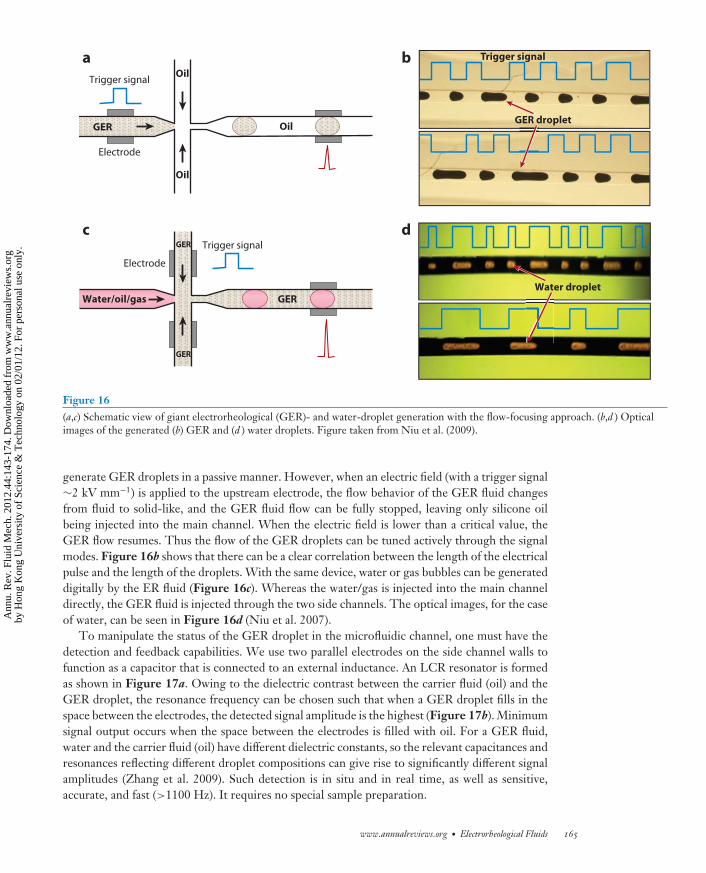
FL44CH07-Sheng ARI 18 November 2011 11:21
Trigger signal
Trigger signal
Electrode
Electrode
GER droplet
Water droplet
Trigger signal b
d
Oil
aOil
Oil GER
GER
GER
GER
c
Water/oil/gas
Figure 16(a,c) Schematic view of giant electrorheological (GER)- and water-droplet generation with the flow-focusing approach. (b,d ) Opticalimages of the generated (b) GER and (d ) water droplets. Figure taken from Niu et al. (2009).
generate GER droplets in a passive manner. However, when an electric field (with a trigger signal∼2 kV mm−1) is applied to the upstream electrode, the flow behavior of the GER fluid changesfrom fluid to solid-like, and the GER fluid flow can be fully stopped, leaving only silicone oilbeing injected into the main channel. When the electric field is lower than a critical value, theGER flow resumes. Thus the flow of the GER droplets can be tuned actively through the signalmodes. Figure 16b shows that there can be a clear correlation between the length of the electricalpulse and the length of the droplets. With the same device, water or gas bubbles can be generateddigitally by the ER fluid (Figure 16c). Whereas the water/gas is injected into the main channeldirectly, the GER fluid is injected through the two side channels. The optical images, for the caseof water, can be seen in Figure 16d (Niu et al. 2007).
To manipulate the status of the GER droplet in the microfluidic channel, one must have thedetection and feedback capabilities. We use two parallel electrodes on the side channel walls tofunction as a capacitor that is connected to an external inductance. An LCR resonator is formedas shown in Figure 17a. Owing to the dielectric contrast between the carrier fluid (oil) and theGER droplet, the resonance frequency can be chosen such that when a GER droplet fills in thespace between the electrodes, the detected signal amplitude is the highest (Figure 17b). Minimumsignal output occurs when the space between the electrodes is filled with oil. For a GER fluid,water and the carrier fluid (oil) have different dielectric constants, so the relevant capacitances andresonances reflecting different droplet compositions can give rise to significantly different signalamplitudes (Zhang et al. 2009). Such detection is in situ and in real time, as well as sensitive,accurate, and fast (>1100 Hz). It requires no special sample preparation.
www.annualreviews.org • Electrorheological Fluids 165
Ann
u. R
ev. F
luid
Mec
h. 2
012.
44:1
43-1
74. D
ownl
oade
d fr
om w
ww
.ann
ualr
evie
ws.
org
by H
ong
Kon
g U
nive
rsity
of
Scie
nce
& T
echn
olog
y on
02/
01/1
2. F
or p
erso
nal u
se o
nly.

FL44CH07-Sheng ARI 18 November 2011 11:21
GER droplet at the resonance condition
Dro
ple
ts away fro
m th
e
reso
nan
ce co
nd
ition
Oil
Electrode
LCR resonator
R L
GER droplet
Oil
C = ε Ad
f0
f0 =1
2π√LCGER
ba
Figure 17Schematics of giant electrorheological (GER) droplet detection via the capacitance approach. The outputdetected signal is shown schematically in panel b. Figure adapted from Niu et al (2007).
A GER fluid, together with a detection circuit, is useful in achieving accurate droplet control.Although GER fluid droplets can themselves be manipulated through the applied electric field(Zhang et al. 2008b), they can also be used to deliver a package containing a certain numberof other passive droplets to the targeted destination. One such example, shown in Figure 18,demonstrates how water droplets can be delivered in varying amounts to the desired locationon a chip, required in many chemical reactions and bioprocessings. By injecting GER dropletsamong the water-droplet trains, one can form packages of any desired number of water dropletssandwiched between two GER droplets. Figure 18b,c shows the schematics for one part of such achip and some snapshots of the experimental results. By controlling the GER droplets, which canbe digitally programmed, one can direct, sort, and deliver the train of water droplets to targeteddestinations at which mixing, heating, or other processing may be carried out.
5.2. Giant Electrorheological Fluid–Based Microfluidic Logic Gate
Electronic devices have evolved from the vacuum tube—the first electronic logic gate. The logicfunction of this near-legendary component has been successfully mimicked by fluidic diodes,microelectrochemical logic (Zhan & Crook 2003). In the microfluidic domain, researchers havescrutinized both kinetic fluid regulation (Groisman et al. 2003, Rhee & Burns 2009) and staticgeographical stream manipulation (Cheow et al. 2007, Prakash & Gershenfeld 2007, Mosadeghet al. 2010, Weaver et al. 2010) as possible fluidic analogs. Simple logic devices such as theAND/OR gate, the static fluid transistor, and the oscillator are among the list of the achievements.They are limited, however, in that they either entail bulky peripheral equipment for round-tripmanipulation or have complicated 3D microstructures.
The basic schematics of a GER fluid logic-gate design are illustrated in Figure 19, in whichtwo parallel channels separated by a conducting gap are used to pass the GER fluid and the signalfluid. Two electrodes, a and b, are formed on the walls of two respective channels, while anotherconducting gap c that interconnects both the GER fluid channel and the signal fluid channel servesas another electrode. Because the carrier fluid is an oil with very low conductivity, the application
166 Sheng ·Wen
Ann
u. R
ev. F
luid
Mec
h. 2
012.
44:1
43-1
74. D
ownl
oade
d fr
om w
ww
.ann
ualr
evie
ws.
org
by H
ong
Kon
g U
nive
rsity
of
Scie
nce
& T
echn
olog
y on
02/
01/1
2. F
or p
erso
nal u
se o
nly.

FL44CH07-Sheng ARI 18 November 2011 11:21
GER droplet Water droplet
Oil Oil Oil Oil
GE
R fl
uid
Wa
ter
Side channel out
Silicone oil
Silicone oil
Main channel out Silicone oil
GER fluid
Silicone oil Dyed deionizedwater
Control electrode
Detection electrode
GER droplet
Water droplet
Control electrode
Detection electrode
a
c
b
Figure 18(a) A microchip generating giant electrorheological (GER) and water microfluidic droplets. (b) Schematic of the detection and sortingof GER and water droplets. (c) A map and optical microscopic images of GER droplets controlling the water droplets. Figure adaptedfrom Zhang et al. (2009).
of high voltage across electrodes a and b has no effect on the conducting gap c. However, whena signal droplet moves into the regions denoted as electrodes b and c, a positive potential will betransmitted to the conducting gap through the signal droplet (as it is usually more conducting thanthe carrier oil), and thus the high voltage would be applied to the GER fluid, thereby solidifyingit. That is, the variable gap voltage leads to a voltage differential VG across the GER channel. VG
could be either off, wherein the voltage is not above the threshold required to completely solidifyGER, or on, causing the GER fluid to solidify and stop flowing in the GER channel. From thisdesign, the GER flow status thus can be tuned by the signal droplet.
The above basic design can be easily expanded into the OR and AND gate designs. Whenthe fundamental structure is repeated in series like those shown in Figure 20a, the GER flowdepends independently on the presence of droplets in channels 1 and 2. Thus a solidification ineither one will stop the overall flow of the GER fluid, making this structure an OR gate. An ANDgate design is presented in Figure 20b, in which voltage is shared evenly across the three channels,and only if water droplets are present in both control channels simultaneously would the GERflow be stopped. Because the GER flow is solidified only when both channels contain a droplet,the structure is a logical AND gate.
www.annualreviews.org • Electrorheological Fluids 167
Ann
u. R
ev. F
luid
Mec
h. 2
012.
44:1
43-1
74. D
ownl
oade
d fr
om w
ww
.ann
ualr
evie
ws.
org
by H
ong
Kon
g U
nive
rsity
of
Scie
nce
& T
echn
olog
y on
02/
01/1
2. F
or p
erso
nal u
se o
nly.
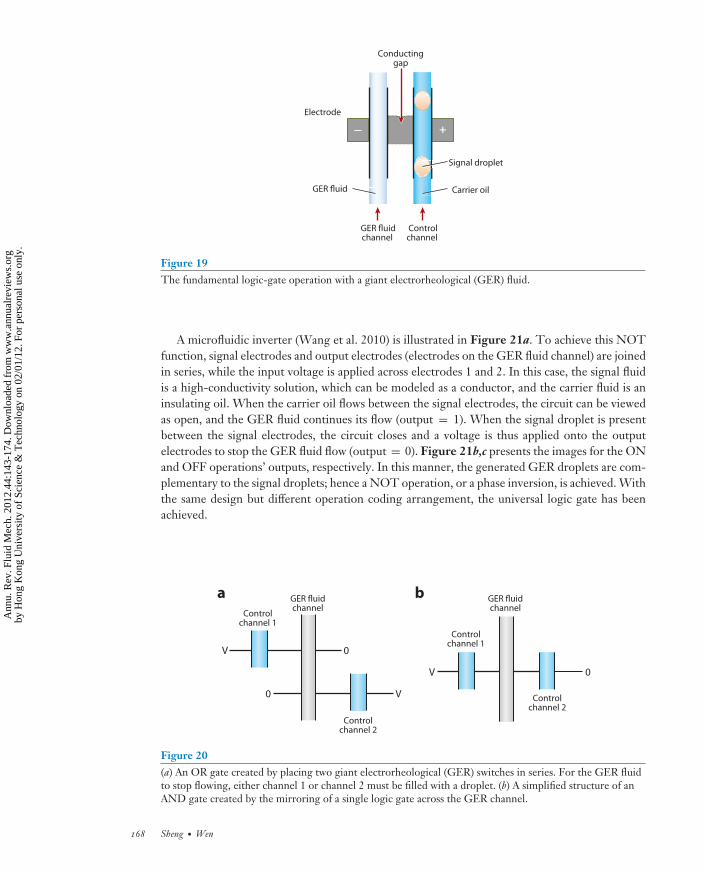
FL44CH07-Sheng ARI 18 November 2011 11:21
+–
GER fluid
Signal droplet
Conductinggap
Carrier oil
Electrode
GER fluidchannel
Controlchannel
g p
Figure 19The fundamental logic-gate operation with a giant electrorheological (GER) fluid.
A microfluidic inverter (Wang et al. 2010) is illustrated in Figure 21a. To achieve this NOTfunction, signal electrodes and output electrodes (electrodes on the GER fluid channel) are joinedin series, while the input voltage is applied across electrodes 1 and 2. In this case, the signal fluidis a high-conductivity solution, which can be modeled as a conductor, and the carrier fluid is aninsulating oil. When the carrier oil flows between the signal electrodes, the circuit can be viewedas open, and the GER fluid continues its flow (output = 1). When the signal droplet is presentbetween the signal electrodes, the circuit closes and a voltage is thus applied onto the outputelectrodes to stop the GER fluid flow (output = 0). Figure 21b,c presents the images for the ONand OFF operations’ outputs, respectively. In this manner, the generated GER droplets are com-plementary to the signal droplets; hence a NOT operation, or a phase inversion, is achieved. Withthe same design but different operation coding arrangement, the universal logic gate has beenachieved.
GER fluidchannel
GER fluidchannel
Controlchannel 1
V 0
V 0
V0 Controlchannel 2
Controlchannel 2
Controlchannel 1
a b
Figure 20(a) An OR gate created by placing two giant electrorheological (GER) switches in series. For the GER fluidto stop flowing, either channel 1 or channel 2 must be filled with a droplet. (b) A simplified structure of anAND gate created by the mirroring of a single logic gate across the GER channel.
168 Sheng ·Wen
Ann
u. R
ev. F
luid
Mec
h. 2
012.
44:1
43-1
74. D
ownl
oade
d fr
om w
ww
.ann
ualr
evie
ws.
org
by H
ong
Kon
g U
nive
rsity
of
Scie
nce
& T
echn
olog
y on
02/
01/1
2. F
or p
erso
nal u
se o
nly.
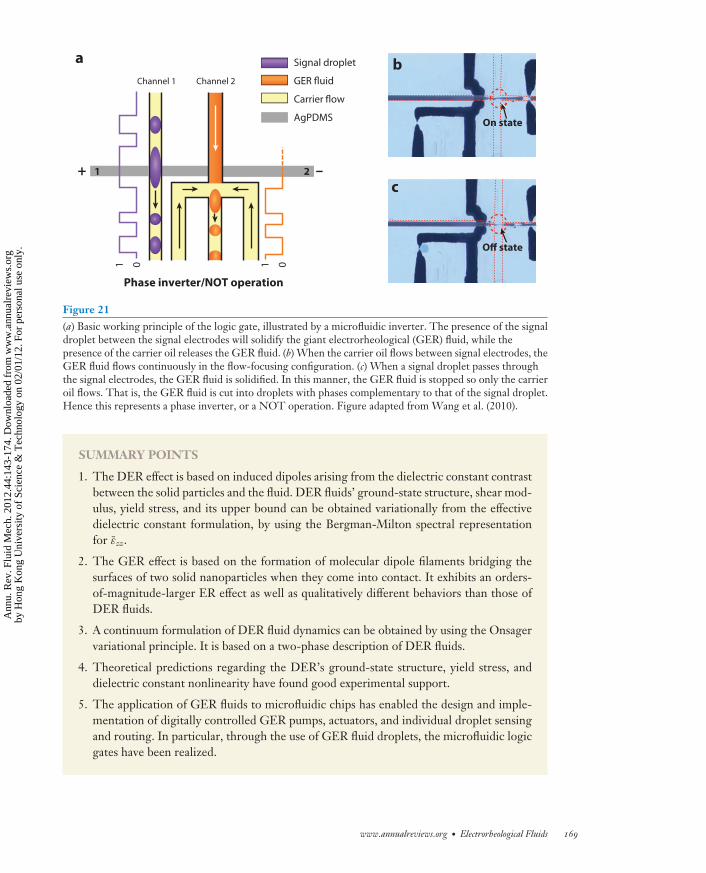
FL44CH07-Sheng ARI 18 November 2011 11:21
Phase inverter/NOT operation
a
+ –1 2
Signal droplet
GER fluid
AgPDMS
Carrier flow
01 01
C1
b
c
On state
Off state
Channel 1 Channel 2
Figure 21(a) Basic working principle of the logic gate, illustrated by a microfluidic inverter. The presence of the signaldroplet between the signal electrodes will solidify the giant electrorheological (GER) fluid, while thepresence of the carrier oil releases the GER fluid. (b) When the carrier oil flows between signal electrodes, theGER fluid flows continuously in the flow-focusing configuration. (c) When a signal droplet passes throughthe signal electrodes, the GER fluid is solidified. In this manner, the GER fluid is stopped so only the carrieroil flows. That is, the GER fluid is cut into droplets with phases complementary to that of the signal droplet.Hence this represents a phase inverter, or a NOT operation. Figure adapted from Wang et al. (2010).
SUMMARY POINTS
1. The DER effect is based on induced dipoles arising from the dielectric constant contrastbetween the solid particles and the fluid. DER fluids’ ground-state structure, shear mod-ulus, yield stress, and its upper bound can be obtained variationally from the effectivedielectric constant formulation, by using the Bergman-Milton spectral representationfor εzz.
2. The GER effect is based on the formation of molecular dipole filaments bridging thesurfaces of two solid nanoparticles when they come into contact. It exhibits an orders-of-magnitude-larger ER effect as well as qualitatively different behaviors than those ofDER fluids.
3. A continuum formulation of DER fluid dynamics can be obtained by using the Onsagervariational principle. It is based on a two-phase description of DER fluids.
4. Theoretical predictions regarding the DER’s ground-state structure, yield stress, anddielectric constant nonlinearity have found good experimental support.
5. The application of GER fluids to microfluidic chips has enabled the design and imple-mentation of digitally controlled GER pumps, actuators, and individual droplet sensingand routing. In particular, through the use of GER fluid droplets, the microfluidic logicgates have been realized.
www.annualreviews.org • Electrorheological Fluids 169
Ann
u. R
ev. F
luid
Mec
h. 2
012.
44:1
43-1
74. D
ownl
oade
d fr
om w
ww
.ann
ualr
evie
ws.
org
by H
ong
Kon
g U
nive
rsity
of
Scie
nce
& T
echn
olog
y on
02/
01/1
2. F
or p
erso
nal u
se o
nly.
FL44CH07-Sheng ARI 18 November 2011 11:21
FUTURE ISSUES
1. Molecular dipole manipulation at the nanoscale presents a broad horizon for furtherexploration. In particular, the formation of molecular dipole filaments as a spontaneousfluctuation effect as well as the possibility of having molecular dipole filaments of macro-scopic length are exciting topics for both theoretical and experimental studies.
2. GER microfluidic logic gates open the possibility for integrated complex microfluidiccircuitries to perform high-level smart functionalities.
3. An ideal GER fluid, with low zero field viscosity, yielding stresses in the range of100 kPa, and showing no particle aggregation or sedimentation effect under long-termuse, is still a challenge to be urgently addressed. Reaching such a goal can broaden GERfluids’ application to actively controllable mechanical devices such as dampers, clutches,brakes, and locks.
DISCLOSURE STATEMENT
The authors are not aware of any biases that might be perceived as affecting the objectivity of thisreview.
ACKNOWLEDGMENTS
This work is supported by Hong Kong Research Grants Council grants RGC602207 andRGC621006. The authors also wish to thank Shuyu Chen for helpful assistance in the litera-ture search and figure preparation.
LITERATURE CITED
Agarwal AK, Yethiraj A. 2009. Low-density ordered phase in Brownian dipolar colloidal suspensions.Phys. Rev. Lett. 102:198301
Ahn K, Agresti J, Chong H, Marquez M, Weitz DA. 2006. Electrocoalescence of drops synchronized bysize-dependent flow in microfluidic channels. Appl. Phys. Lett. 88:264105
Alejandre J, Tildesley DJ, Chapela GA. 1995. Molecular dynamics simulation of the orthobaric densities andsurface tension of water. J. Chem. Phys. 102:4574–83
Baroud CN, de Saint VMR, Delville JP. 2007. An optical toolbox for total control of droplet microfluidics.Lab Chip 7:1029–33
Bergman DJ. 1978a. Analytical properties of the complex effective dielectric constant of a composite mediumwith applications to the derivation of rigorous bounds and to percolation problems. In Electrical Transportand Optical Properties of Inhomogeneous Media, ed. JC Garland, DB Tanner, pp. 46–61. Woodbury, NY:Am. Inst. Phys.
Bergman DJ. 1978b. The dielectric constant of a composite material: a problem in classical physics. Phys. Rep.43:377–407
Bergman DJ. 1985. Bulk physical properties of composite media. In Les methodes de l’homogeneisation: theorie etapplications en physique, pp. 1–128. Paris: Eyrolles
Bergman DJ, Stroud D. 1992. The physical properties of macroscopically inhomogeneous media. In SolidState Physics, vol. 46, ed. H Ehrenreich, F Seitz, D Turnbull, pp. 148–270. New York: Academic
Bonnecaze RT, Brady JF. 1992a. Dynamic simulation of an electrorheological fluid. J. Chem. Phys. 96:2183–202
Bonnecaze RT, Brady JF. 1992b. Yield stresses in electrorheological fluids. J. Rheol. 36:73–115
170 Sheng ·Wen
Ann
u. R
ev. F
luid
Mec
h. 2
012.
44:1
43-1
74. D
ownl
oade
d fr
om w
ww
.ann
ualr
evie
ws.
org
by H
ong
Kon
g U
nive
rsity
of
Scie
nce
& T
echn
olog
y on
02/
01/1
2. F
or p
erso
nal u
se o
nly.
FL44CH07-Sheng ARI 18 November 2011 11:21
Bossis G, Metayer C, Zubarev A. 2007. Analysis of chaining structures in colloidal suspensions subjected toan electric field. Phys. Rev. E 76:041401
Bullough WA, ed. 1996. Electrorheological Fluids, Magnetorheological Suspensions and Associated Technology:Proceedings of the 5th International Conference. Singapore: World Sci.
Chabert M, Viovy JL. 2008. Microfluidic high-throughput encapsulation and hydrodynamic self-sorting ofsingle cells. Proc. Natl. Acad. Sci. USA 105:3191–96
Chen SY, Huang X, van der Vegt N, Wen W, Sheng P. 2010. Giant electrorheological effect: a microscopicmechanism. Phys. Rev. Lett. 105:046001
Chen TJ, Zitter RN, Tao R. 1992. Laser diffraction determination of the crystalline structure of an elec-trorheological fluid. Phys. Rev. Lett. 68:2555–58
Chen Y, Conrad H. 1994. Electrostatic interactions for particle arrays in electrorheological fluids II: measure-ments. Int. J. Mod. Phys. B 8:2895–902
Chen Y, Sprecher AE, Conrad H. 1991. Electrostatic particle-particle interactions in electrorheological fluids.J. Appl. Phys. 70:6796–803
Cheng Y, Liu X, Guo J, Liu F, Li Z, et al. 2009. Fabrication of uniform core-shell structural calcium andtitanium precipitation particles and enhanced electrorheological activities. Nanotechnology 20:055604
Cheng Y, Wu K, Liu F, Guo J, Liu X, et al. 2010. Facile approach to large-scale synthesis of 1D calcium andtitanium precipitate (CTP) with high electrorheological activity. ACS Appl. Mater. Interfaces 2:621–25
Cheow LF, Yobas L, Kwong D. 2007. Digital microfluidics: droplet based logic gates. Appl. Phys. Lett.90:054107
Cho MS, Choi HJ, Ahn WS. 2004. Enhanced electrorheology of conducting polyaniline confined in MCM-41channels. Langmuir 20:202–7
Choi HJ, Cho MS, Kim JW, Kim CA, John MS. 2001. A yield stress scaling function for electrorheologicalfluids. Appl. Phys. Lett. 78:3806–8
Choi HJ, Jhon MS. 2009. Electrorheology of polymers and nanocomposites. Soft Matter 5:1562–67Conrad H, Sprecher AF. 1994. Characteristics and mechanisms of electrorheological fluids. J. Stat. Phys.
64:1073–91Davis LC. 1992a. Finite-element analysis of particle-particle forces in electrorheological fluids. Appl. Phys.
Lett. 60:319–21Davis LC. 1992b. Polarization forces and conductivity effects in electrorheological fluids. J. Appl. Phys.
72:1334–40Garstecki P, Fuerstman MJ, Whitesides GM. 2005. Oscillations with uniquely long periods in a microfluidic
bubble generator. Nat. Phys. 1:168–71Gong X, Wu J, Huang X, Wen W, Sheng P. 2008. Influence of liquid phase on nanoparticle-based giant
electrorheological fluid. Nanotechnology 19:165602Groisman A, Enzelberger M, Quake SR. 2003. Microfluidic memory and control devices. Science 300:955–58Gulley GL, Tao R. 1997. Structure of an electrorheological fluid. Phys Rev. E 56:4328–36Halsey TC. 1992. Electrorheological fluids. Science 258:761–66Hass KC. 1993. Computer simulations of nonequilibrium structure formation in electrorheological fluids.
Phys. Rev. E 47:3362–73Hu Y, Glass JL, Griffith AE, Fraden S. 1994. Observation and simulation of electrohydrodynamic instabilities
in aqueous colloidal suspensions. J. Chem. Phys. 100:4674–82Huang X, Wen W, Yang S, Sheng P. 2006. Mechanisms of the giant electrorheological effect. Solid State
Commun. 139:581–88Hynninen A-P, Dijkstra M. 2005. Phase diagram of dipolar hard and soft spheres: manipulation of colloidal
crystal structures by an external field. Phys. Rev. Lett. 94:138303Indeikina PA, Chang HC. 2002. Electrokinetic displacement of air bubbles in microchannels. Phys. Fluids
14:1–14Ivlev AV, Morfill GE, Thomas HM, Rath C, Joyce G, et al. 2008. First observation of electrorheological
plasmas. Phys. Rev. Lett. 100:095003Jeffries GDM, Kuo JS, Chiu DT. 2007. Dynamic modulation of chemical concentration in an aqueous droplet.
Angew. Chem. Int. Ed. Engl. 46:1326–28
www.annualreviews.org • Electrorheological Fluids 171
Ann
u. R
ev. F
luid
Mec
h. 2
012.
44:1
43-1
74. D
ownl
oade
d fr
om w
ww
.ann
ualr
evie
ws.
org
by H
ong
Kon
g U
nive
rsity
of
Scie
nce
& T
echn
olog
y on
02/
01/1
2. F
or p
erso
nal u
se o
nly.

FL44CH07-Sheng ARI 18 November 2011 11:21
Jensen K, Lee AP. 2004. Special issue foreword. Lab Chip 4:N31–32Joung J, Shen J, Grodzinski P. 2000. Micropumps based on alternating high-gradient magnetic fields. IEEE
Trans. Magn. 36:2012–14Klingenberg DJ. 1993. Simulation of the dynamic oscillatory response of electrorheological suspensions:
demonstration of a relaxation mechanism. J. Rheol. 37:199–215Klingenberg DJ, Swol FV, Zukoski CF. 1989. Dynamic simulation of electrorheological suspensions. J. Chem.
Phys. 91:7888–95Klingenberg DJ, Swol FV, Zukoski CF. 1991a. The small shear rate response of electrorheological suspensions.
I. Simulation in the point-dipole limit. J. Chem. Phys. 94:6160–69Klingenberg DJ, Swol FV, Zukoski CF. 1991b. The small shear rate response of electrorheological suspensions.
II. Extension beyond the point-dipole limit. J. Chem. Phys. 94:6170–78Klingenberg DJ, Zukoski CZ, Hill JC. 1993. Kinetics of structure formation in electrorheological suspensions.
J. Appl. Phys. 73:4644–48Lee ME, van der Vegt NFA. 2006. Does urea denature hydrophobic interactions? J. Am. Chem. Soc. 128:4948–
49Liau A, Karnik R, Majumdar A, Cate JH. 2005. Mixing crowded biological solutions in milliseconds. Anal.
Chem. 77:7618–25Link DR, Grasland-Mongrain E, Duri A, Sarrazin F, Cheng Z, et al. 2006. Electric control of droplets in
microfluidic devices. Angew. Chem. Int. Ed. Engl. 45:2556–60Liu K, Ding H, Chen Y, Zhao XZ. 2007. Droplet-based synthetic method using microflow. Microfluid.
Nanofluid. 3:239–43Liu L, Chen X, Niu X, Wen W, Sheng P. 2006a. Electrorheological fluid-actuated microfluidic pump.
Appl. Phys. Lett. 89:083505Liu L, Niu X, Wen W, Sheng P. 2006b. Electrorheological fluid-actuated flexible platform. Appl. Phys. Lett.
88:173505Lu Y, Shen R, Wang XZ, Sun G, Lu KQ. 2009. The synthesis and electrorheological effect of a strontium
titanyl oxalate suspension. Smart Mater. Struct. 18:025012Luo Y, Zhang Q, Qin J, Lin B. 2007. Further improvement of hydrostatic pressure sample injection for
microchip electrophoresis. Electrophoresis 28:4769–71Ma H, Wen W, Tam WY, Sheng P. 2003. Dielectric electrorheological fluids: theory and experiments.
Adv. Phys. 52:343–83Ma HR, Wen W, Tam WY, Sheng P. 1996. Frequency dependent electrorheological properties: origin and
bounds. Phys. Rev. Lett. 77:2499–502Manz A, Graber N, Widmer HM. 1990. Miniaturized total chemical analysis systems: a novel concept for
chemical sensing. Sens. Actuators B 1:244–48Mazouchi A, Homsy GM. 2001. Thermocapillary migration of long bubbles in polygonal tubes. Phys. Fluids
13:1594–600Milton GW. 1979. Theoretical studies of the transport properties of inhomogeneous media. Rep. TP /79/1,
Univ. Sydney, Austr.Milton GW. 1981a. Bounds on the complex permittivity of a two-component composite material. J. Appl.
Phys. 52:5286–93Milton GW. 1981b. Bounds on the transport and optical properties of a two-component composite material.
J. Appl. Phys. 52:5294–304Milton GW. 2002. The Theory of Composites. Cambridge, UK: Cambridge Univ. PressMosadegh B, Kuo C, Tung Y, Torisawa Y, Bersano-Begey T, et al. 2010. Integrated elastomeric components
for autonomous regulation of sequential and oscillatory flow switching in microfluidic devices. Nat. Phys.6:433–37
Mountain RD, Thirumalai D. 2004. Importance of excluded volume on the solvation of urea in water. J. Phys.Chem. B 108:6826–31
Nakano M, Katou T, Satou A, Miyata K, Matsushita K. 2002. Three-ports micro ER valve for ER suspensionfabricated by photolithography. J. Intell. Mater. Syst. Struct. 13:503–8
Niu X, Liu L, Wen W, Sheng P. 2006a. Active microfluidic mixer chip. Appl. Phys. Lett. 88:153508
172 Sheng ·Wen
Ann
u. R
ev. F
luid
Mec
h. 2
012.
44:1
43-1
74. D
ownl
oade
d fr
om w
ww
.ann
ualr
evie
ws.
org
by H
ong
Kon
g U
nive
rsity
of
Scie
nce
& T
echn
olog
y on
02/
01/1
2. F
or p
erso
nal u
se o
nly.

FL44CH07-Sheng ARI 18 November 2011 11:21
Niu X, Liu L, Wen W, Sheng P. 2006b. Hybrid approach to high-frequency microfluidic mixing. Phys. Rev.Lett. 97:044501
Niu X, Wen W, Lee Y. 2005. Electrorheological-fluid-based microvalve. Appl. Phys. Lett. 87:243501Niu X, Zhang M, Peng S, Wen W, Sheng P. 2007. Real-time detection, control and sorting of microfluidic
droplets. Biomicrofluidics 1:044101–12Niu X, Zhang M, Wu J, Wen W, Sheng P. 2009. Generation and manipulation of “smart” droplets.
Soft Matter 5:576–81Paik P, Pamula VK, Pollack MG, Fair RB. 2003. Electrowetting-based droplet mixers for microfluidic systems.
Lab Chip 3:28–33Pollack MG, Shenderov AD, Fair RB. 2002. Electrowetting-based actuation of droplets for integrated mi-
crofluidics. Lab Chip 2:96–101Prakash M, Gershenfeld N. 2007. Microfluidic bubble logic. Science 315:832–35Priest C, Herminghaus S, Seemann R. 2006. Controlled electrocoalescence in microfluidics: targeting a single
lamella. Appl. Phys. Lett. 89:134101Psaltis D, Quake SR, Yang C. 2006. Developing optofluidic technology through the fusion of microfluidics
and optics. Nature 442:381–86Ren H, Srinivasan V, Fair RB. 2003. Automated electrowetting-based droplet dispensing with good re-
producibility. Proc. μTAS 2003 7th Int. Conf. Micro Total Anal. Syst., ed. MA Northrup, KF Jensen,DJ Harrison, pp. 993–96. Cleveland Heights, OH: Transducers Res. Found.
Rhee M, Burns MA. 2009. Microfluidic pneumatic logic circuits and digital pneumatic microprocessors forintegrated microfluidic systems. Lab Chip 9:3131–43
Schwartz A, Vykoukal JV, Gascoyne PRC. 2004. Droplet-based chemistry on a programmable micro-chip.Lab Chip 4:11–17
Shen M, Cao JG, Xue HT, Huang JP, Zhou LW. 2006. Structure of polydisperse electrorheological fluids:experiment and theory. Chem. Phys. Lett. 423:165–69
Shen R, Wang X, Lu Y, Wang D, Sun G, et al. 2009. Polar-molecule-dominated electrorheological fluidsfeaturing high yield stresses. Adv. Mater. 21:4631–35
Sheng P, Wen W. 2010. Electrorheology: statics and dynamics. Solid State Commun. 150:1023–39Shih YH, Sprecher AE, Conrad H. 1994. Electrostatic interactions for particle arrays in electrorheological
fluids I: calculations. Int. J. Mod. Phys. B 8:2877–94Sides SW, Curro J, Grest GS, Stevens MJ, Soddemann T, et al. 2002. Structure of poly(dimethylsiloxane)
melts: theory, simulation and experiment. Macromolecules 35:6455–65Sun H, Yu KW. 2003. Ground state of a polydisperse electrorheological solid: beyond the dipole approxima-
tion. Phys. Rev. E 67:011506Tam WY, Yi GH, Wen W, Ma HR, Loy MMT, Sheng P. 1997. New electrorheological fluids: theory and
experiment. Phys. Rev. Lett. 78:2987–90Tan P, Tian WJ, Wu XF, Huang JY, Zhou LW, Huang JP. 2009. Saturated orientational polarization of polar
molecules in giant electrorheological fluids. J. Phys. Chem. B 113:9092–97Tan YC, Ho YL, Lee AP. 2007. Droplet coalescence by geometrically mediated flow in microfluidic channels.
Microfluid. Nanofluid. 3:495–99Tan YC, Ho YL, Lee AP. 2008. Microfluidic sorting of droplets by size. Microfluid. Nanofluid. 4:343–48Tang X, Wu C, Conrad H. 1995a. On the conductivity model for the electrorheological effect. J. Rheol.
39:1059–74Tang X, Wu C, Conrad H. 1995b. On the conductivity model for the electrorheological response of dielectric
particles with a conducting film. J. Appl. Phys. 78:4183–88Tao R, Jiang Q. 1994. Simulation of structure formation in an electrorheological fluid. Phys. Rev. Lett. 73:205–8Tao R, Sun JM. 1991. Three-dimensional structure of induced electrorheological solid. Phys. Rev. Lett. 67:398–
401van der Vegt NFA, Lee ME, Trzesniak D, van Gunsteren WF. 2006. Enthalpy-entropy compensation in the
effects of urea on hydrophobic interactions. J. Phys. Chem. B 110:12852–55Wang BX, Zhao XP, Zhao Y, Ding CL. 2007. Titanium oxide nanoparticle modified with chromium ion and
its giant electrorheological activity. Compos. Sci. Technol. 67:3031–38
www.annualreviews.org • Electrorheological Fluids 173
Ann
u. R
ev. F
luid
Mec
h. 2
012.
44:1
43-1
74. D
ownl
oade
d fr
om w
ww
.ann
ualr
evie
ws.
org
by H
ong
Kon
g U
nive
rsity
of
Scie
nce
& T
echn
olog
y on
02/
01/1
2. F
or p
erso
nal u
se o
nly.
FL44CH07-Sheng ARI 18 November 2011 11:21
Wang L, Zhang M, Li J, Gong X, Wen W. 2010. Logic control of microfluidics with smart colloid. Lab Chip10:2869–74
Wang ZW, Fang HP, Lin ZF, Zhou LW. 2000. Simulation of field-induced structural formation and transitionin electromagnetorheological suspensions. Phys. Rev. E 61:6837–44
Wang ZW, Lin ZF, Tao RB. 1996. Many-body effect in electrorheological responses. Int. J. Mod. Phys. B10:1153–66
Weaver JA, Melin J, Stark D, Quake SR, Horowitz MA. 2010. Static control logic for microfluidic devicesusing pressure-gain valves. Nat. Phys. 6:218–23
Wen W, Huang X, Sheng P. 2004. Particle size scaling of the giant electrorheological effect. Appl. Phys. Lett.85:299–301
Wen W, Huang X, Sheng P. 2007. Electrorheological fluids: structures and mechanisms. Soft Matter 4:200–10Wen W, Huang X, Yang S, Lu K, Sheng P. 2003. The giant electrorheological effect in suspensions of
nanoparticles. Nat. Mater. 2:727–30Wen W, Wang N, Ma HR, Lin ZF, Tam WY, et al. 1999. Field induced structural transition in mesocrystal-
lites. Phys. Rev. Lett. 82:4248–31Winslow WM. 1949. Induced fibration of suspensions. J. Appl. Phys. 20:1137–40Yethiraj A, van Blaaderen A. 2003. A colloidal model system with an interaction tunable from hard sphere to
soft and dipolar. Nature 421:513–17Yin JB, Zhao XP. 2004. Giant electrorheological activity of high surface area mesoporous cerium-doped
TiO2 templated by block copolymer. Chem. Phys. Lett. 398:393–99Yoshida K, Kikuchi M, Park J, Yokota S. 2002. Fabrication of micro electro-rheological valves (ER valves) by
micromachining and experiments. Sens. Actuators A 95:227–33Zhan W, Crooks RM. 2003. Microelectrochemical logic circuits. J. Am. Chem. Soc. 125:9934–35Zhang J, Gong X, Liu C, Wen W, Sheng P. 2008a. Electrorheological fluid dynamics. Phys. Rev. Lett.
101:194503Zhang M, Gong X, Wen W. 2009. Manipulation of microfluidicroplets by electrorheological fluid.
Electrophoresis 30:3116–23Zhang M, Wu J, Niu X, Wen W, Sheng P. 2008b. Manipulations of microfluidic droplets using electrorheo-
logical carrier fluid. Phys. Rev. E 78:066305Zhu X, Gao C, Choi JW, Bishop PL, Ahn CH. 2005. On-chip generated mercury microelectrode for heavy
metal ion detection. Lab Chip 5:212–17
174 Sheng ·Wen
Ann
u. R
ev. F
luid
Mec
h. 2
012.
44:1
43-1
74. D
ownl
oade
d fr
om w
ww
.ann
ualr
evie
ws.
org
by H
ong
Kon
g U
nive
rsity
of
Scie
nce
& T
echn
olog
y on
02/
01/1
2. F
or p
erso
nal u
se o
nly.

FL44-FrontMatter ARI 1 December 2011 22:45
Annual Review ofFluid Mechanics
Volume 44, 2012Contents
Aeroacoustics of Musical InstrumentsBenoit Fabre, Joel Gilbert, Avraham Hirschberg, and Xavier Pelorson � � � � � � � � � � � � � � � � � � � � 1
Cascades in Wall-Bounded TurbulenceJavier Jimenez � � � � � � � � � � � � � � � � � � � � � � � � � � � � � � � � � � � � � � � � � � � � � � � � � � � � � � � � � � � � � � � � � � � � � � � � � � � � � � � �27
Large-Eddy-Simulation Tools for Multiphase FlowsRodney O. Fox � � � � � � � � � � � � � � � � � � � � � � � � � � � � � � � � � � � � � � � � � � � � � � � � � � � � � � � � � � � � � � � � � � � � � � � � � � � � � � � �47
Hydrodynamic Techniques to Enhance Membrane FiltrationMichel Y. Jaffrin � � � � � � � � � � � � � � � � � � � � � � � � � � � � � � � � � � � � � � � � � � � � � � � � � � � � � � � � � � � � � � � � � � � � � � � � � � � � �77
Wake-Induced Oscillatory Paths of Bodies Freely Risingor Falling in FluidsPatricia Ern, Frederic Risso, David Fabre, and Jacques Magnaudet � � � � � � � � � � � � � � � � � � � � � �97
Flow and Transport in Regions with Aquatic VegetationHeidi M. Nepf � � � � � � � � � � � � � � � � � � � � � � � � � � � � � � � � � � � � � � � � � � � � � � � � � � � � � � � � � � � � � � � � � � � � � � � � � � � � � � 123
Electrorheological Fluids: Mechanisms, Dynamics,and Microfluidics ApplicationsPing Sheng and Weijia Wen � � � � � � � � � � � � � � � � � � � � � � � � � � � � � � � � � � � � � � � � � � � � � � � � � � � � � � � � � � � � � � � 143
The Gyrokinetic Description of Microturbulence in Magnetized PlasmasJohn A. Krommes � � � � � � � � � � � � � � � � � � � � � � � � � � � � � � � � � � � � � � � � � � � � � � � � � � � � � � � � � � � � � � � � � � � � � � � � � � � 175
The Significance of Simple Invariant Solutions in Turbulent FlowsGenta Kawahara, Markus Uhlmann, and Lennaert van Veen � � � � � � � � � � � � � � � � � � � � � � � � � � 203
Modern Challenges Facing Turbomachinery AeroacousticsNigel Peake and Anthony B. Parry � � � � � � � � � � � � � � � � � � � � � � � � � � � � � � � � � � � � � � � � � � � � � � � � � � � � � � � � 227
Liquid Rope CoilingNeil M. Ribe, Mehdi Habibi, and Daniel Bonn � � � � � � � � � � � � � � � � � � � � � � � � � � � � � � � � � � � � � � � � � � � 249
Dynamics of the Tear FilmRichard J. Braun � � � � � � � � � � � � � � � � � � � � � � � � � � � � � � � � � � � � � � � � � � � � � � � � � � � � � � � � � � � � � � � � � � � � � � � � � � � 267
Physics and Computation of Aero-OpticsMeng Wang, Ali Mani, and Stanislav Gordeyev � � � � � � � � � � � � � � � � � � � � � � � � � � � � � � � � � � � � � � � � � 299
v
Ann
u. R
ev. F
luid
Mec
h. 2
012.
44:1
43-1
74. D
ownl
oade
d fr
om w
ww
.ann
ualr
evie
ws.
org
by H
ong
Kon
g U
nive
rsity
of
Scie
nce
& T
echn
olog
y on
02/
01/1
2. F
or p
erso
nal u
se o
nly.

FL44-FrontMatter ARI 1 December 2011 22:45
Smoothed Particle Hydrodynamics and Its Diverse ApplicationsJ.J. Monaghan � � � � � � � � � � � � � � � � � � � � � � � � � � � � � � � � � � � � � � � � � � � � � � � � � � � � � � � � � � � � � � � � � � � � � � � � � � � � � � 323
Fluid Mechanics of the EyeJennifer H. Siggers and C. Ross Ethier � � � � � � � � � � � � � � � � � � � � � � � � � � � � � � � � � � � � � � � � � � � � � � � � � � � � 347
Fluid Mechanics of Planktonic MicroorganismsJeffrey S. Guasto, Roberto Rusconi, and Roman Stocker � � � � � � � � � � � � � � � � � � � � � � � � � � � � � � � � � � 373
Nanoscale Electrokinetics and Microvortices: How MicrohydrodynamicsAffects Nanofluidic Ion FluxHsueh-Chia Chang, Gilad Yossifon, and Evgeny A. Demekhin � � � � � � � � � � � � � � � � � � � � � � � � � 401
Two-Dimensional TurbulenceGuido Boffetta and Robert E. Ecke � � � � � � � � � � � � � � � � � � � � � � � � � � � � � � � � � � � � � � � � � � � � � � � � � � � � � � � � � 427
“Vegetable Dynamicks”: The Role of Water in Plant MovementsJacques Dumais and Yoel Forterre � � � � � � � � � � � � � � � � � � � � � � � � � � � � � � � � � � � � � � � � � � � � � � � � � � � � � � � � � 453
The Wind in the Willows: Flows in Forest Canopies in Complex TerrainStephen E. Belcher, Ian N. Harman, and John J. Finnigan � � � � � � � � � � � � � � � � � � � � � � � � � � � � � 479
Multidisciplinary Optimization with Applicationsto Sonic-Boom MinimizationJuan J. Alonso and Michael R. Colonno � � � � � � � � � � � � � � � � � � � � � � � � � � � � � � � � � � � � � � � � � � � � � � � � � � � 505
Direct Numerical Simulation on the Receptivity, Instability,and Transition of Hypersonic Boundary LayersXiaolin Zhong and Xiaowen Wang � � � � � � � � � � � � � � � � � � � � � � � � � � � � � � � � � � � � � � � � � � � � � � � � � � � � � � � � 527
Air-Entrainment Mechanisms in Plunging Jets and Breaking WavesKenneth T. Kiger and James H. Duncan � � � � � � � � � � � � � � � � � � � � � � � � � � � � � � � � � � � � � � � � � � � � � � � � � 563
Indexes
Cumulative Index of Contributing Authors, Volumes 1–44 � � � � � � � � � � � � � � � � � � � � � � � � � � � � 597
Cumulative Index of Chapter Titles, Volumes 1–44 � � � � � � � � � � � � � � � � � � � � � � � � � � � � � � � � � � � � � 606
Errata
An online log of corrections to Annual Review of Fluid Mechanics articles may be foundat http://fluid.annualreviews.org/errata.shtml
vi Contents
Ann
u. R
ev. F
luid
Mec
h. 2
012.
44:1
43-1
74. D
ownl
oade
d fr
om w
ww
.ann
ualr
evie
ws.
org
by H
ong
Kon
g U
nive
rsity
of
Scie
nce
& T
echn
olog
y on
02/
01/1
2. F
or p
erso
nal u
se o
nly.