PART 2 ELECTRORHEOLOGICAL SUSPENSIONS. ELECTRORHEOLOGICAL SUSPENSIONS SUMMARY –Review of...
34
PART 2 PART 2 ELECTRORHEOLOGICAL ELECTRORHEOLOGICAL SUSPENSIONS SUSPENSIONS
-
Upload
norma-jackson -
Category
Documents
-
view
235 -
download
2
Transcript of PART 2 ELECTRORHEOLOGICAL SUSPENSIONS. ELECTRORHEOLOGICAL SUSPENSIONS SUMMARY –Review of...

PART 2 PART 2 ELECTRORHEOLOGICAL ELECTRORHEOLOGICAL
SUSPENSIONSSUSPENSIONS

ELECTRORHEOLOGICAL ELECTRORHEOLOGICAL SUSPENSIONSSUSPENSIONS
SUMMARYSUMMARY– Review of electrorheological Review of electrorheological
suspensions (ERS)suspensions (ERS)– Classification of ERSClassification of ERS– Mechanisms of the ER effect proposed Mechanisms of the ER effect proposed
by several researchersby several researchers– potential applicationspotential applications– modellingmodelling

ELECTROACTIVE MATERIALSELECTROACTIVE MATERIALS
An electro-active material is a An electro-active material is a suspension where a semiconductive suspension where a semiconductive material (particulate or liquid) is material (particulate or liquid) is dispersed in a dielectric liquid dispersed in a dielectric liquid medium.medium.
The rheological properties change in The rheological properties change in reversible form by several orders of reversible form by several orders of magnitude under external electric magnitude under external electric fields.fields.

ELECTROACTIVE MATERIALSELECTROACTIVE MATERIALS
Since the rheological properties can Since the rheological properties can be easily controlled within a wide be easily controlled within a wide range, many scientific and range, many scientific and technological applications may be technological applications may be developed.developed.
T. Hao , Adv. Colloid Interface Sci. 1-35, 97 (2002)H. Block, J.P. Kelley, J. Phys. D, 1661, 21(1988)A. P. Gast, C. F.Zukoski,Adv. Colloid Interface Sci.153,30(1989)T.C. Halsey Science 761,23(1992)

POTENTIAL APLICATIONSPOTENTIAL APLICATIONS
Clutch, brake and damping systems, Clutch, brake and damping systems, actuators, fuel injections systemsactuators, fuel injections systems
Joints and hands of robotic armsJoints and hands of robotic arms photonic crystals.photonic crystals.Microswitches.Microswitches.Mechanical-electronic Mechanical-electronic interfacesinterfaces
C. F.Zukoski, Annu.Rev.Matter.Sci.23(1993)45T.C. Halsey Science 23(1992) 761

Schematic illustration of structure Schematic illustration of structure change of ERSchange of ERS
E
Before an external electric field is applied
Structure of an electrorheological material after an electric field is applied

ERF PhenomenaERF Phenomena
Without Electric FieldWith Electric field (E)
DC ó AC
E
+
-
Increase in Viscosity

Continue Continue experimentalexperimental
4. Estructural arrangement observations

Classification of Electrorheological MaterialsClassification of Electrorheological MaterialsERF
Liquid Phase
Additive
Water Anhydrous
Dispersed Phase
Liquid
Homogeneous Fluid
Liquid Crystalline
Emulsiona
Microemulsion
Solid
Heterogeneous Fluid
Inorganic
Oxide Non-Oxide
Organic
Polymeric

Experimental CharacteristicsExperimental Characteristicsof an Electrorheological fluidof an Electrorheological fluid
Liquid Phase Particle ERSuspension
Relative dielectricconstant
2 2to10000
Conductivity (S/m) 10 -10 to10 -16 10 -7 10 -9 to10 -16
Viscosity atno electric field Pa.s
0.01 to 10 0.1 to 10

CRITICAL PARAMETERSCRITICAL PARAMETERS
Electric Field Strength, EElectric Field Strength, E– two effects in competition for explain the changes two effects in competition for explain the changes
in the yield stress, in the yield stress, y,y, after applying the electric after applying the electric field field
Frequency of Electric Field, Frequency of Electric Field, – DC is mostly used to generate detectable ER DC is mostly used to generate detectable ER
effecteffect– AC is used to study the ER mechanismsAC is used to study the ER mechanisms– ER effect is function of ER effect is function of through through and and
Particle Conductivity, Particle Conductivity, – determines determines JJ and it peaks and it peaks yy at at o o

CRITICAL PARAMETERSCRITICAL PARAMETERS
Particle Dielectric Property,Particle Dielectric Property,– the polarization depends on the polarization depends on ..– the electric double layer overlap is the reasonthe electric double layer overlap is the reason– the dielectric constant changes with the dielectric constant changes with
electrolyteselectrolytes Particle Volume Fraction, Particle Volume Fraction, yy and and depend on depend on , and exhibit a maximum, and exhibit a maximum
– Percolation theory was used to understand this Percolation theory was used to understand this phenomenonphenomenon

CRITICAL PARAMETERSCRITICAL PARAMETERS
TemperatureTemperature– Changes the polarizability of ERF Changes the polarizability of ERF
because changes because changes and and ..– Impact particle thermal motionImpact particle thermal motion
Liquid mediumLiquid medium– sedimentation, viscosity, conductivity sedimentation, viscosity, conductivity
and permitivity of liquid causes and permitivity of liquid causes pronounced differences for the ER pronounced differences for the ER effect.effect.
Water content Water content

FORCES RELEVANT TO THE FORCES RELEVANT TO THE ER EFFECTER EFFECT
After ER fluid is submitted to an electric After ER fluid is submitted to an electric field the particles should be polarized field the particles should be polarized and appears a electrostatic force. and appears a electrostatic force. However hydrodynamic, Brownian, van However hydrodynamic, Brownian, van der Waals, DLVO and other forces act der Waals, DLVO and other forces act too. too.
Dimensionless groups that describe the Dimensionless groups that describe the relative importance of those forces. Eg.relative importance of those forces. Eg.– Mason, Mn = 6Mason, Mn = 6/(/(00smsmEE22))
– Peclet, Pe = 6Peclet, Pe = 6smsmaa22/kT/kT

PHASE TRANSITIONPHASE TRANSITION
As increase the ERS changes from a As increase the ERS changes from a disordered state to coexistence with a disordered state to coexistence with a crystalline phasecrystalline phase
Laser diffraction method and confocal Laser diffraction method and confocal scanning laser microscopy were scanning laser microscopy were employed to determine the crystal employed to determine the crystal structure within fibrilated columns structure within fibrilated columns

POLARZATION PROCESSPOLARZATION PROCESS
Four kinds of polarization existFour kinds of polarization exist– electronicelectronic– atomicatomic– DebyeDebye– InterfacialInterfacial
The dielectric constant is The dielectric constant is = = E E + + AA + + DD + + II

ResultsResultsRheological properties
Viscosity vs shear rate
ba
10-2 10-1 100 101 102 10310-1
100
101
102
103
104
SF-14 (A-1100) 20 wt %
Rel
ativ
e vi
scos
ity
Shear rate (s-1)
E = kV/mm 0.25KV 0.5 KV 0.75KV 1.0 KV 1.5 KV 2.0 KV 2.5 KV
10-2 10-1 100 101 102 10310-1
100
101
102
103
104
SF-14 20 wt %
Rel
ativ
e vi
scos
ity
Shear rate (s-1)
E = kV/mm 0.25 0.50 0.75 1.0 1.5 2.0 2.5

Continue Continue resultsresults
Shear stress vs shear rate
b
10-2 10-1 100 101 102 10310-1
100
101
102
103
104
SF-14 20 wt %
(P
a)
Shear rate (s-1)
E = kV/mm 0.O KV 0.25KV 0.5 KV 0.75KV 1.0 KV 1.5 KV 2.0 KV 2.5 KV
a
10-2 10-1 100 101 102 10310-1
100
101
102
103
104
SF-14 (A-1100) 20 wt %
(P
a)
Shear rate (s-1)
E = kV/mm 0.0 V 0.25 0.5 0.75 1.0 1.5 2.0 2.5

Model of ER suspensionsModel of ER suspensions
= y + plastic
plastic = 0 [1- /m]
Bingham model
Krieger-Dougherty
= y + 0 [1- /m]
.
– [m
J. W. Goodwin et.al. J Phys. Chem. B, 1997, 101, 1961-1967L. Rejon. PhD Thesis, 1998, UNAM.
– [m
.

BKD ModelBKD Model
10-1 100 101 102 103101
102
103
104
2.5 Kv/mm
0.5 Kv/mm
SF-14 (A1100) 20 wt %
(P
a)
Shear rate (s-1)
Experimental Model

Kinetic chain model. [ Martin, J.E.; Kinetic chain model. [ Martin, J.E.; Odinek, J. Odinek, J. J. Rheol. J. Rheol. 19951995, , 3939, 995]., 995]. The kinetics of aggregation and The kinetics of aggregation and
fragmentation follows a fragmentation follows a phenomenological expressionphenomenological expression
The aggregation process is induced The aggregation process is induced
by the dipolar forces and hence the by the dipolar forces and hence the kinetic constant kinetic constant k k is given byis given by
max2
2
)(
)(1
)(
)(
tN
tN
tN
k
dt
tdN
)/8( 02
02
00 Ekk fMM
maximum stable size of the chains N(t)max,

This model predicts a viscosity This model predicts a viscosity proportional to the electric field proportional to the electric field squared and to inverse shear rate squared and to inverse shear rate according toaccording to
is the volume fraction of particlesis the volume fraction of particles
12
02
010
63
Ef

A rheological kinetic model for A rheological kinetic model for electrorheological suspensionselectrorheological suspensions
DDGD ),(2),( ´0
´
01),´( AD
EE
F WAkWAkAdt
dA)()()1(
1 0'1
0'0
DWF :
220 EPEWE
fp )1(

2202
0'0 1 Ek
kk
1'
1 kk
2200122
02
00 )/(1
:)/()1(EAk
Ek
DAkA
dt
dAE

For weak electric fields and low shear rates, the For weak electric fields and low shear rates, the viscosity grows slowly as a function of time with viscosity grows slowly as a function of time with rate proportional to rate proportional to E*EE*E. Under strong electric . Under strong electric fields, the viscosity growth with time is fields, the viscosity growth with time is exponential, and at long times the viscosity exponential, and at long times the viscosity approaches the limitapproaches the limit
At short times and in the case where , the model At short times and in the case where , the model gives the proportionality of the characteristic time gives the proportionality of the characteristic time for structure formation with the viscosity and for structure formation with the viscosity and electric field, i.e.,.electric field, i.e.,.
EE )/( 00
2/ Etc

Strong flow limitStrong flow limit
Initially, the reference viscosity is the zero Initially, the reference viscosity is the zero shear-rate viscosity. Asymptotic analysis of shear-rate viscosity. Asymptotic analysis of the model shows that at long times, for weak the model shows that at long times, for weak electric fields, the viscosity decreases with a electric fields, the viscosity decreases with a rate proportional torate proportional to
1/( )1/( ) whereas under strong electric fields, the whereas under strong electric fields, the
viscosity is proportional to viscosity is proportional to
In the latter case, the ratio of the electric field In the latter case, the ratio of the electric field to the shear rate controls the viscosity to the shear rate controls the viscosity decrease with time.decrease with time.
bt210
t
t
E

Weak flowWeak flow
2201
0
2201 )1(
Ek
Ek
E
E
/
)1)(1( 2202
2201
0
EkEkGy
00 Gy
220210 Ekkyy

Conductivity contributions to the Conductivity contributions to the electrorheological effect.electrorheological effect.
22032
0'0 )1(1 EEkk
kk
)1( 31'1 Ekkk
fp )1(

0 200 400 600 800 1000 1200100
1000
10000
r
time (s)
S100=0.08E (kV/mm)
0.5 1.0 1.5
A
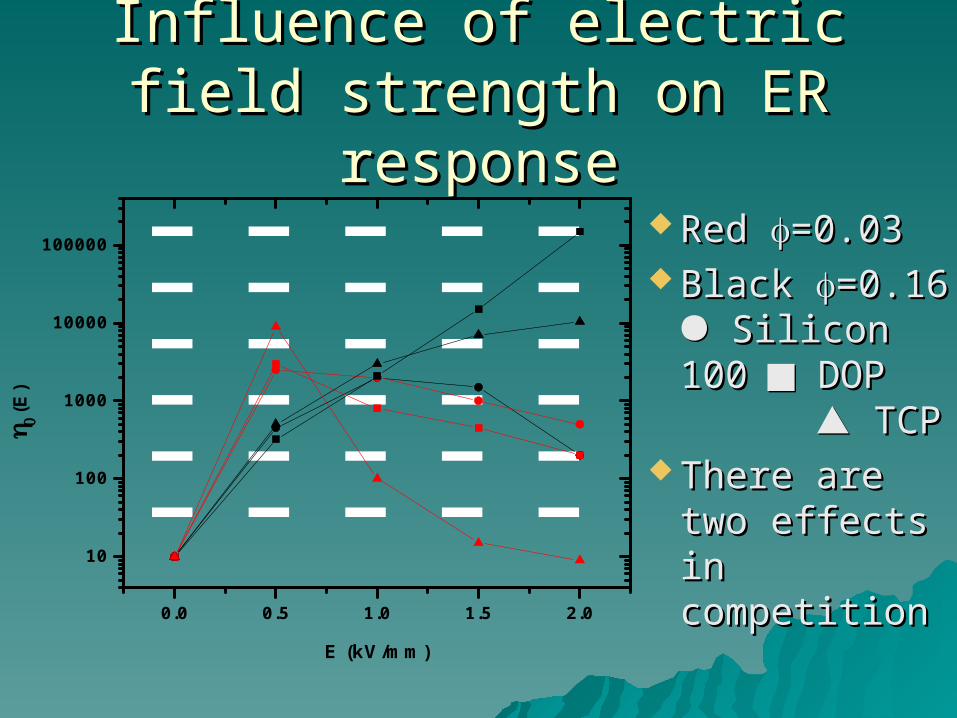
Influence of electric field Influence of electric field strength on ER responsestrength on ER response
0.0 0.5 1.0 1.5 2.0
10
100
1000
10000
100000
(E
)
E (kV/mm)
Red Red =0.03=0.03Black Black =0.16 =0.16 Silicon 100 Silicon 100 DOP DOP TCP TCP
There are two There are two effects in effects in competition competition
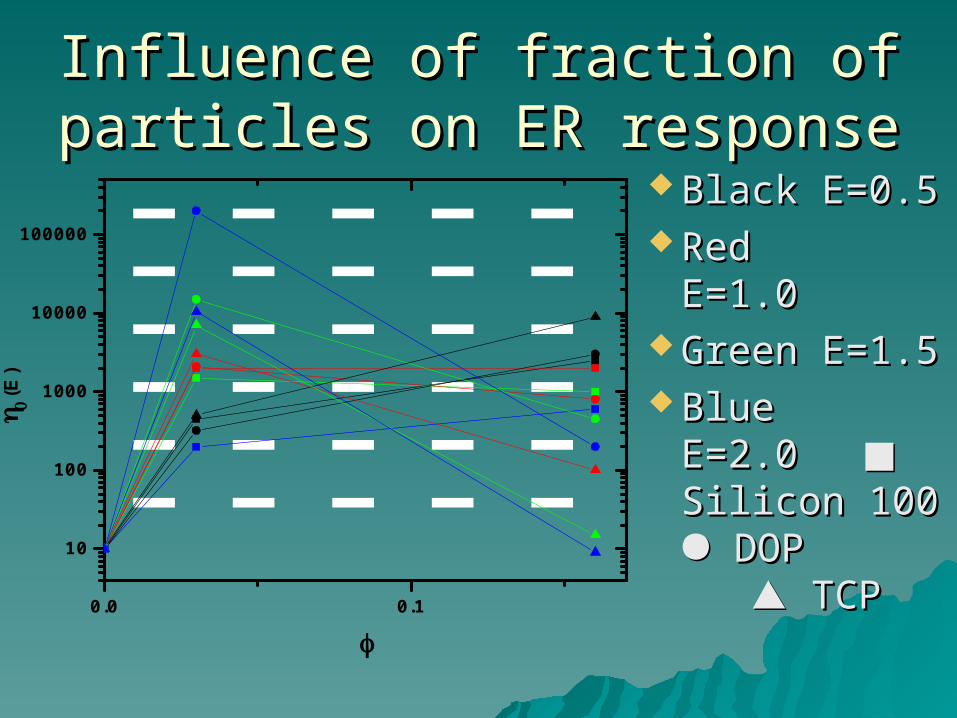
Influence of fraction of particles Influence of fraction of particles on ER responseon ER response
Black E=0.5Black E=0.5Red E=1.0Red E=1.0Green Green
E=1.5E=1.5Blue E=2.0 Blue E=2.0
Silicon Silicon 100 100 DOP DOP TCP TCP
0.0 0.1
10
100
1000
10000
100000
(E
)

Comparison between Comparison between experimental data and model experimental data and model
predictionspredictions
10-6 1x10-51x10-4 10-3 10-2 10-1 100 101 102 103
100
101
102
103
p/
L = 1 x 10⁶
S100, = 0.03
E = kV/mm 0.5 1.5 2.0
L
Mn

Comparison between Comparison between experimental data and model experimental data and model
predictionspredictions
10-2 10-1100
101
102
= 0.03
S100, R2 = 0.99
DOP, R2 = 0.96
TCP, R2 = 0.97
Yie
ld s
tres
s (P
a)
E2

Comparison between Comparison between experimental data and model experimental data and model
predictionspredictions
10-2 10-1100
101
102
= 0.03
S100, R2 = 0.99
DOP, R2 = 0.96
TCP, R2 = 0.97
Yie
ld s
tres
s (P
a)
E2