
Strong Start: Potential Data Sources for Generating ...
39
Potential Data Sources for Generating Baseline Data Julie C. Jacobson Vann, PhD, MS, RN Senior Researcher American Institutes for Research Thomas L. Schlenker, MD, MPH Director of Public Health San Antonio Metropolitan Health District
Transcript of Strong Start: Potential Data Sources for Generating ...
Potential Data Sources for
Generating Baseline Data Julie C. Jacobson Vann, PhD, MS, RN
Senior Researcher
American Institutes for Research
Thomas L. Schlenker, MD, MPH Director of Public Health
San Antonio Metropolitan Health District

Outline
›
›
›
Introduction
Purpose of collecting baseline data
Definition of baseline data
Intervention group
Type of baseline data
Characteristics of baseline data
Potential sources of baseline data
Review of potential data sources

What is Baseline Data
›
Collected before a program begins
Expected outcome(s) of program
Characteristics of people being served
Example:
% of infants born to women served by the program in the past year who were born
prior to 37 weeks gestation

Sample Baseline Data (Hypothetical):
Preterm Births for Medicaid Beneficiaries in Beachville County
2008-2009 2009-2010 2010-2011
% births < 37
weeks EGA:
women < 20
years of age
18.7% 18.9% 17.9%
% births < 37
weeks EGA:
women 20-29
15.6% 14.3% 15.0%
% births < 37
weeks EGA:
women 30-39
16.9% 17.3% 16.2%
% births < 37
weeks EGA:
women ≥ 40
20.4% 19.2% 20.2%

Purpose of Collecting
Baseline Data
Compare what happens before & after
an intervention or program
Assess effect of a program
Foundation for showing performance
improvement
Needs assessment

Sample: Baseline and Post-Intervention Data
(Hypothetical) Preterm Births for Medicaid Beneficiaries in Organic County, Before
& After ABC Program Implementation, in 2 Centers
2010-2012:
Before
Intervention
Began
2013-2014
Intervention
Period
Difference
between pre-
intervention and
intervention
period
% Births < 37 weeks
EGA, born to
Medicaid
beneficiaries,
Center A
14.2% 9.6% -4.6 percentage
points
% Births < 37 weeks
EGA, born to
Medicaid
beneficiaries,
Center B
13.4% 11.3% -2.1 percentage
points

Intervention Group
Group expected to be assigned to the
program or receive the service
Intention-to-treat: group expected to
receive the service

Type of Baseline Data to
Collect
Appropriate for measuring changes as
defined by the program objectives
Outcome measures
Sample characteristics
Proxy measures

Identifying Data Sources
›
›
›
Program data
Alternative data sources
Public sources of data
Data requests
Partner with a local organization

Considerations for Selecting
Baseline Data
›
Obtain within timeline
Accessible
Process to obtain
Years of data available
Data elements
Specificity of data elements

Potential Sources of Data
›
›
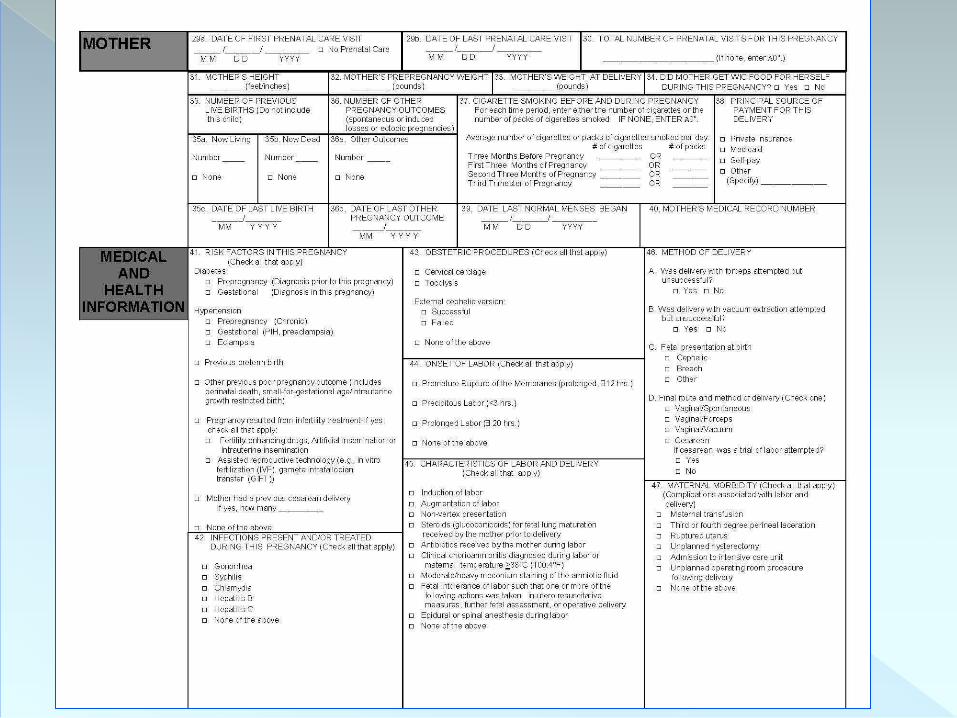
Birth Certificate
Centers for Disease Control & Prevention Natality Public Use File
National Center for Health Statistics State Vital Records & Vital Statistics
Local health department Local WIC office
Pregnancy Risk Assessment Monitoring System (PRAMS)
Pregnancy Nutrition Surveillance System (PNSS)
Local hospital
State Medicaid program
March of Dimes & PeriStats

Centers for Disease Control &
Prevention (CDC)
www.cdc.gov
Data and Statistics (FastStats)
Natality Public Use File (after 2005 does
not contain geographic detail)
“B”, Birth Data, NCVS

National Center for Health
Statistics
Standard Forms (Live Births)
Births Final Data for 2009
Births Preliminary Data for 2010
Related Links – State Health Departments

State Vital Records
›
›
›
›
›
›
Wisconsin Births and Infant Deaths 2010
January, 2012
Birth and Fertility Rates
Characteristics of Mother
Characteristics of Pregnancy and Delivery
Characteristics of Newborn
Mortality
*Statewide vs. Local and Regional

State Vital Records Analysis
›
›
›
›
Special data request:
Report vs. electronic dataset for analysis
Current data
Time to obtain
Cost

Local Health Department
›
›
›
San Antonio Metropolitan Health District
Report – Health Profile 2010
Maternal and Child Indicators: LBW (2), Prem
Report – Births Change 2009-2010 Bexar Co.
Averages and trends
Data Requests: LBW & EGA to order
Medicaid only
Race/Ethnicity
Zip code and census tract

Local WIC Office
Women Infants & Children (WIC)
Program
Supplemental foods, health care
referrals, nutrition education
Many based in local health departments
Birth data for low income families
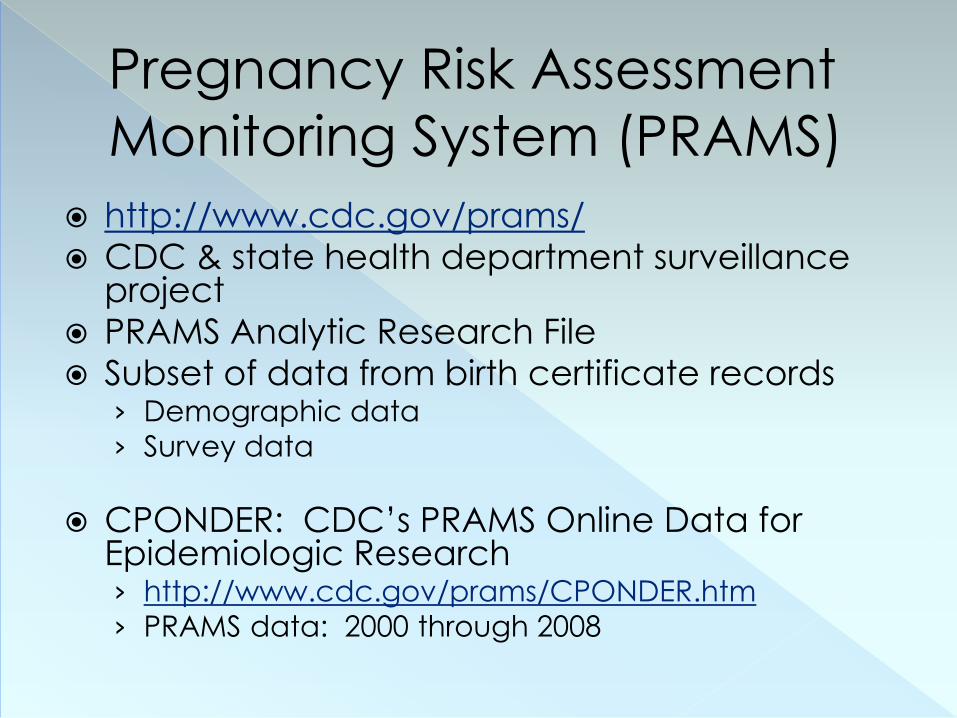
Pregnancy Risk Assessment
Monitoring System (PRAMS)
›
›
›
›
http://www.cdc.gov/prams/
CDC & state health department surveillance project
PRAMS Analytic Research File
Subset of data from birth certificate records Demographic data
Survey data
CPONDER: CDC’s PRAMS Online Data for Epidemiologic Research
http://www.cdc.gov/prams/CPONDER.htm
PRAMS data: 2000 through 2008

Sample CPONDER Data Table:
Green State - 2007 Morbidity - Infant The baby's weight, classified as low birth weight (LBW) if the weight was less
than or equal to 2500 grams or normal birth weight (NBW) if the weight was
greater than 2500 grams
Low Birth Weight (LBW)
< 2,500 grams
Normal Birth Weight
(NBW)
2,500+ grams
Percent 7.8% 92.2%
Confidence Interval
(CI)
7.6 – 7.9% 92.1 – 92.4%
Sample size (n) 657 835

Pregnancy Nutrition
Surveillance System (PNSS)
Program-based public health
surveillance system
http://aspe.hhs.gov/hsp/06/Catalog-Al-
AN-NA/PNSS.htm Monitors risk factors associated with
infant mortality & poor birth outcomes
Low-income women in federally-funded
programs
Voluntary reporting of programs

PNSS (continued)
›
›
›
Data:
Indicators of maternal health & behaviors
Published tables
http://www.cdc.gov/pednss/pnss_tables/ind
ex.htm
Download data:
North Carolina; California; West Virginia
PNSS -- Assessment
Table format
1997-2010
National level data
Some state-level statistics
Birth weight: very low, low, normal, high

PNSS – Sample Data Table 2010 – Comparison of Infant Health Indicators http://www.cdc.gov/pednss/pnss_tables/pdf/national_table8.pdf
Contributor Birthweight
% Low (rank)
Birthweight
% High (rank)
Preterm
% (rank)
State 1 7.5% (16) 6.5% (12) 5.2% (1)
State 2 6.4% (5) 6.8% (15) 9.3% (11)
State 3 6.1% (3) 7.4% (20) 7.4% (3)
State 4 8.2% (23) 6.4% (10) 14.1% (31)

Local Hospital
›
›
Infants born at the facility
Recorded in different ways
Electronically, paper records
Reports to Vital Records
Electronic or hard copy format

Local Hospital – Request
Process
›
›
›
›
Professional contacts
Contact Research Office and/or Office
of Medical Information Management
Be prepared:
Outline what you need
Data elements, timing, population of interest,
research focus
Data availability
Identify request process
Local Hospital – Request
Process -- Example
›
›
›
›
Prepare & submit forms:
Purpose & data needs
List of names & credentials of persons who will access the data
Evidence of human subjects training
Attend panel meeting
Data availability: 4-6 weeks initially
On secured hospital-owned server

Local Hospital -- Assessment
Format: electronic or hard copy
Availability: few days to multiple weeks
Data elements: depends on source
PeriData.Net – Example of
Electronic System
Wisconsin system
Web-based perinatal database
Electronic submission of birth information
Hospital submit data
Hospital own & control their own data

State Medicaid Program
›
Medicaid Claims
Medicaid Eligibility Files
Special program:
Example: Prior authorization for palivizumab
May use existing data sources

State Medicaid Program –
Claims & Eligibility Files
›
›
Medicaid Claims ICD-9-CM Diagnostic Codes
Mother: 644.21: premature birth
Infant: 765.1: prematurity
765.0: extreme immaturity
Infant weight 5th sub-digits: 1: < 500 grams
9: ≥ 2,500 grams
Medicaid Eligibility Files Demographic data
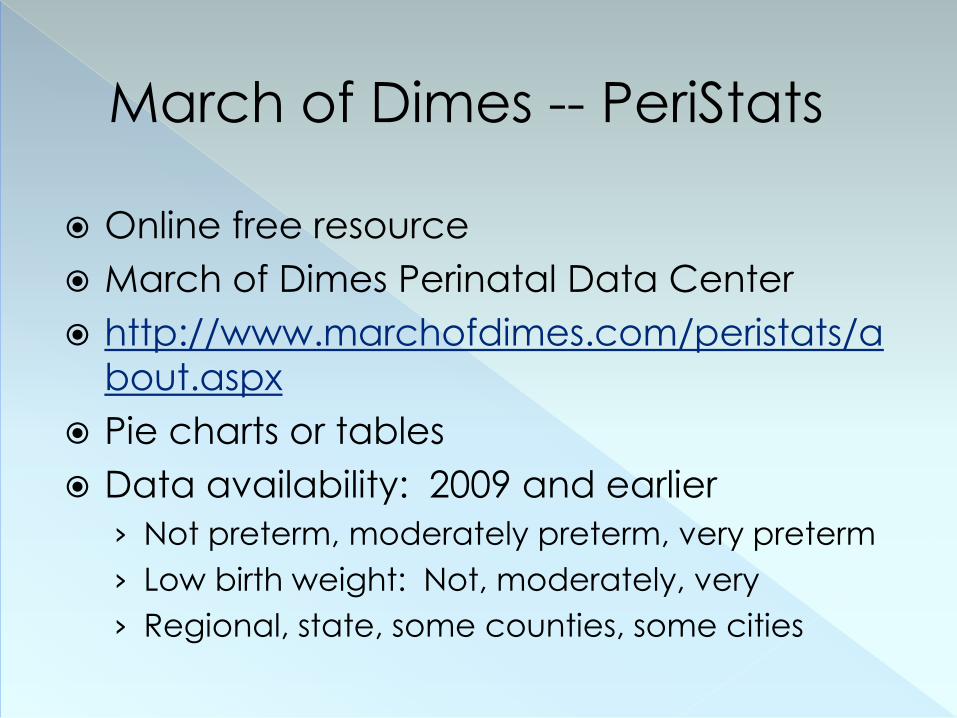
March of Dimes -- PeriStats
›
›
›
Online free resource
March of Dimes Perinatal Data Center
http://www.marchofdimes.com/peristats/a
bout.aspx
Pie charts or tables
Data availability: 2009 and earlier
Not preterm, moderately preterm, very preterm
Low birth weight: Not, moderately, very
Regional, state, some counties, some cities

March of Dimes – Peri-Stats: Low birthweight by race/ethnicity: District of
Columbia, 2007-2009 Average

Other Data Sources
›
Kasehagen, L. (2011). Underutilized MCH Data
Sources. City Lights, 19(2), retrieved from
http://webmedia.unmc.edu/Community/CityMat
ch/CityLights/CityLights201105.pdf
Table 1:
Pregnancy Risk Assessment Monitoring System (PRAMS)
Pregnancy Nutrition Surveillance System (PNSS)
Pediatric Nutrition Surveillance System (PedNSS)
National Survey of Children’s Health (NSCH)

Pediatric Nutrition
Surveillance system (PedNSS)
http://www.health.ny.gov/statistics/prevention/nutrition/pednss/index.htm
Prevalence & trends of nutrition-related indicators
Low-income children attending federally-funded MCH & nutrition programs
State of New York
Birth weight: < 2,500 grams; > 4,000 grams
Data for children < 5 years: birth weight, breast feeding, TV viewing, smoking in household, etc.
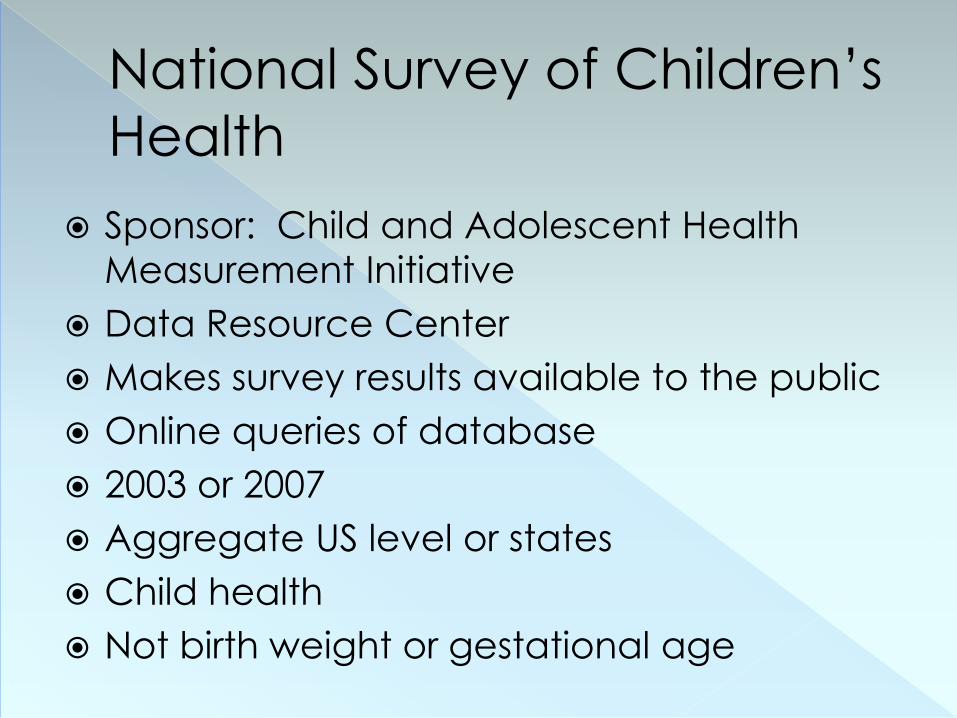
National Survey of Children’s
Health
Sponsor: Child and Adolescent Health
Measurement Initiative
Data Resource Center
Makes survey results available to the public
Online queries of database
2003 or 2007
Aggregate US level or states
Child health
Not birth weight or gestational age


![HYPOTHESIS GENERATING UESTIONNAIRE FOR [ ] …...National Hypothesis Generating Questionnaire v2, OMB No. 0920‐0997, Page 3 of 14 Section 6: SOURCES OF FOOD OUTSIDE THE HOME: Now](https://static.fdocuments.in/doc/165x107/5fe030a622aad66c0624df5e/hypothesis-generating-uestionnaire-for-national-hypothesis-generating-questionnaire.jpg)