Generating a New High Resolution DTM Product from various ...€¦ · Generating a New High...
10
Warriner, Mandlburger 197 Generating a New High Resolution DTM Product from various Data Sources TIM WARRINER 1 , Southampton GOTTFRIED MANDLBURGER 2 , Vienna ABSTRACT This paper discusses two aspects of the new DTM generation project, the product view from the perspective of the owner (Ordnance Survey) and the technical solution for combining DTMs from the system supplier (Inpho). Ordnance Survey (OS) has a long history of providing height information in a national context from both precise geodetic levelling networks and photogrammetrically surveyed contours. The product being discussed here is based on the most recent contour surveys carried out over the period 1970-1983 in support of national mapping series published at 1:10,000 and 1:25,000 scale. Over the life of the product the technical systems used to maintain the data have been updated from analogue capture machines, to analytical and now digital photogrammetry. The most recent development being the purchase of a digital camera. This technology has now come together to create a new height product from both in house data and third party sourced LIDAR. The technical solution to combine the data has been provided by Inpho using the SCOP++ DTM software and the Topographic Data Management system (TopDM) to process the data and place it in a database from which it can be selected for output by accuracy to build the product tiles. This called for some core development work to enhance the system to provide metadata to meet OS business needs and wrapper software to verify and control the input. 1. INTRODUCTION Ordnance Survey has an existing height product which has national coverage of both contours and Digital Terrain Models as 10,548 tiles each covering an area of 5x5km 2 . These were created from contours in the period 1970 to 1983 using aerial photography and were surveyed for use in mapping products at 1:10,000 scale and smaller. The vertical interval was 5m or 10m depending on the ter- rain. The DTM was created using third party software which also allowed the incorporation of spot heights data mined from the more accurate levelling network and those created during the contour survey. The vertical accuracy (rmse) of both products is quoted as being from ±2.5m to ±5.0m. This product has successfully met national needs for a number of years and has been improved in currency with the survey of significant landscape features such as motorway cuttings and mineral extraction sites. As more accurate height information started to become available from LIDAR and other sources the shortcomings of the product were exposed and sales began to suffer. In 2003 it was decided that a move must be made to improve the product as customers were moving to other suppliers. An analysis of what could be done was carried out. The target users of the height data were identi- fied as Insurance Companies, Utilities and National and Local Government Agencies. Insurance companies were already using better height data to be more discriminating in applying flood risk to individual properties rather than groups of properties in the same post code areas. This gave them a commercial advantage over other companies, one company in particular purchased a national height survey with a vertical accuracy of ±1.0m. 1 Ordnance Survey, Southampton 2 Christian Doppler Laboratory for “Spatial Data from Laser Scanning and Remote Sensing”, Vienna University of Technology 'Photogrammetric Week 05' Dieter Fritsch, Ed. Wichmann Verlag, Heidelberg 2005.
Transcript of Generating a New High Resolution DTM Product from various ...€¦ · Generating a New High...

Warriner, Mandlburger 197
Generating a New High Resolution DTM Product from various Data Sources
TIM WARRINER1, Southampton GOTTFRIED MANDLBURGER2, Vienna
ABSTRACT
This paper discusses two aspects of the new DTM generation project, the product view from the perspective of the owner (Ordnance Survey) and the technical solution for combining DTMs from the system supplier (Inpho). Ordnance Survey (OS) has a long history of providing height information in a national context from both precise geodetic levelling networks and photogrammetrically surveyed contours. The product being discussed here is based on the most recent contour surveys carried out over the period 1970-1983 in support of national mapping series published at 1:10,000 and 1:25,000 scale. Over the life of the product the technical systems used to maintain the data have been updated from analogue capture machines, to analytical and now digital photogrammetry. The most recent development being the purchase of a digital camera. This technology has now come together to create a new height product from both in house data and third party sourced LIDAR. The technical solution to combine the data has been provided by Inpho using the SCOP++ DTM software and the Topographic Data Management system (TopDM) to process the data and place it in a database from which it can be selected for output by accuracy to build the product tiles. This called for some core development work to enhance the system to provide metadata to meet OS business needs and wrapper software to verify and control the input.
1. INTRODUCTION Ordnance Survey has an existing height product which has national coverage of both contours and Digital Terrain Models as 10,548 tiles each covering an area of 5x5km2. These were created from contours in the period 1970 to 1983 using aerial photography and were surveyed for use in mapping products at 1:10,000 scale and smaller. The vertical interval was 5m or 10m depending on the ter-rain. The DTM was created using third party software which also allowed the incorporation of spot heights data mined from the more accurate levelling network and those created during the contour survey. The vertical accuracy (rmse) of both products is quoted as being from ±2.5m to ±5.0m.
This product has successfully met national needs for a number of years and has been improved in currency with the survey of significant landscape features such as motorway cuttings and mineral extraction sites. As more accurate height information started to become available from LIDAR and other sources the shortcomings of the product were exposed and sales began to suffer. In 2003 it was decided that a move must be made to improve the product as customers were moving to other suppliers.
An analysis of what could be done was carried out. The target users of the height data were identi-fied as Insurance Companies, Utilities and National and Local Government Agencies. Insurance companies were already using better height data to be more discriminating in applying flood risk to individual properties rather than groups of properties in the same post code areas. This gave them a commercial advantage over other companies, one company in particular purchased a national height survey with a vertical accuracy of ±1.0m.
1 Ordnance Survey, Southampton 2 Christian Doppler Laboratory for “Spatial Data from Laser Scanning and Remote Sensing”, Vienna University of
Technology
'Photogrammetric Week 05' Dieter Fritsch, Ed. Wichmann Verlag, Heidelberg 2005.

198 Warriner, Mandlburger
2. PRODUCT SPECIFICATION Ordnance Survey proposed commencing a height capture programme using its own photogrammet-ric resources but this process was not yet proven and significant coverage of new height data would not be made available for a new product launch in spring 2005. The decision was made to look for additional sources of height data by placing an open tender for height information collected since 1994 and available off the shelf immediately. A number of suppliers responded and a source of LI-DAR data was identified, the data needed further processing to meet our specification in terms of content, for example we needed bridges removing and water surfaces smoothing and filling in.
The screen shots below show how the two products differ in content.
Fig 2.1: Existing height product Fig 2.2: New height product
The above extracts show how the new product adds both accuracy and detail to the height informa-tion. This example uses LIDAR data which clearly shows the river and canal network and an em-bankment across the river valley.
The new product would differ from the existing in that there was no intention to create national coverage rather we would target localities where the data was most useful, in this case urban and floodplain areas. It was also decided to have three levels of accuracy depending on the terrain and to take advantage of the better resolution of the source data by publishing at 2m, 5m or 10m resolu-tion. The product data must be supplied using the existing storage and delivery systems and use as far as possible the existing data format specifications.
The need to retain the existing format was met by making minor changes to the data format to add an accuracy attribute for each post and to allow the data to be supplied at different resolutions. The accuracy attribute is essential as the supplier is not able to provide complete coverage of height data so some infilling from the first generation height product is required to complete the coverage of a product tile.
The screen shots below show how the accuracy layer is represented.
The diagrams (fig. 2.3, 2.4) show the accuracy information and a patch of height data. The triangu-lar area is infilled with lower accuracy data hence the obvious mismatch in the height data. The ex-tent of the tidal data within the river is indicated clearly as both accuracy information and height values.
A change was also made to the position of the DTM posts, the original product has posts at the cor-ner of each cell which introduced the need for precise edge-matching between product tiles. The

Warriner, Mandlburger 199
new product places the post at the center of each cell, this was partly driven by the LIDAR data being supplied in this format and the desire to publish the actual values rather than re-interpolate the data. There were also significant benefits in not having to support precise edge-matching between tiles which would demand greater checking of the output height data.
Fig 2.3: Accuracy Layer Fig 2.4: Height Layer
Product Accuracy
(rmse) Resolution Number
of posts Size as NTF
Urban & Flood plain ±0.5m 2m 6,250,000 46 Mb Rural ±1.0m 5m 1,000,000 7 Mb Mountain & Moor-land
±2.5m 10m 250,000 1.8 Mb
Table 2.1: Product variants and their characteristics
3. CAPTURE PROCESSES
3.1. LIDAR
The LIDAR data was captured using two different sensors. Pre 2001 the sensor was an Optech ALTM 1020 which was a 5 KHz system, since that date an Optech ALTM 2033 has been used. The data was initially captured at 2m resolution but now more data is captured at 1m and smaller for example London at 50cm resolution. The data is post processed using a combination of bespoke routines in an ESRI Arc system plus TerraScan for point classification.
The average rmse for 2000 to 2005 data is =±8.2cm when compared with GPS Ground Surveys used to independently verify the overall accuracy. The data was originally captured for environ-mental research with most targets being water catchment systems and coastal areas. Additional processing was required to bring the content of the data up to the Ordnance Survey product specifi-cation, further routines were developed in Arc to carry this out with delivery being as 2x2km2 Arc Grid ASCII files. This process is expected to take approximately 12 months to create approximately 50,000km2 of height data made available as 5x5km2 product tiles.
Verification that the data meets the product content specification is carried out using Inpho’s DTMaster software, this has provided a valuable tool to independently test both the raw data from

200 Warriner, Mandlburger
the supplier and the product content. It enabled issues with missing and duplicated data to be identi-fied quickly be the problem with the data or the output software.
3.2. Photogrammetry
The in house Photogrammetric flowline uses scanned imagery controlled as a 10x10km2 block with MatchAT software. The resulting orientation data is used on Digital Photogrammetric Workstations running BAE’s Socet Set system where the DTM is created using Automatic Terrain Extraction software. The output from this is checked and improved manually by a team of photogrammetric surveyors adding extra heights and breaklines as required. This data is exported as DXF into the Inpho SCOP++ system from which the product is generated.
Independent checking processes have been used to verify the height accuracy is within the product specification and that the data content is as expected.
The need to supply the product at different resolutions and formats presented issues with the vol-ume of data that would be produced and published. It was decided to create the product tiles once and keep these for supply rather than generate the data for each order from a single stored product tile. The volumes involved dictated a move to use off the shelf data compression routines to reduce the file sizes making storage and product supply volumes lower. The back office systems used for storage, supply and order processing were reworked to meet the changed product specifications.
One other area that demanded a change in processing was the inclusion of third party height data and the need to pay royalties on each tile sold. The product creation system had to record the sup-plier and calculate the percentage of data from that source, it is possible for a single tile to have data from many suppliers. This metadata is transferred to the invoicing system to enable a monthly ac-count of royalties due to be calculated.
The diagram below is a high level system schematic which illustrates the complexity of the creation and publication system required to support the new product, most of these systems were upgraded, the new development was around the DTM creation process.
Fig 3.1: Product creation and supply schematic

Warriner, Mandlburger 201
4. TECHNICAL SOLUTION The task of DTM generation for the new height product is carried out using the Inpho products SCOP++ (DTM interpolation, blending operations, etc.), TopDM (Topographic database manage-ment system) and DTMaster (data checking). Three different flowlines have been designed for the different combinations of input data (section 4.1). Generally a separate DTM layer is created for each class of input data (Profile, photogrammetric and LIDAR data). In areas with existing data from different sources but similar accuracy classes, blending of the DTMs becomes necessary. For this purpose a new mosaicing feature was developed, which is described in section 4.2. After these preparation steps the DTM grids are imported into the TopDM database using different accuracy attributes according to the rmse of the respective source. Finally the new height product is exported from the database in tiles of 5x5km using the “highest priority” selection mode. This means that a grid post is deduced from the most accurate DTM source available (section 4.3). All the required tasks are performed automatically using the batch capabilities of SCOP++ and TopDM.
4.1. Topographic database system
As pointed out in the previous sections the new height product comprises DTM data from various sources. The following table gives an overview of the different data sources available.
Data source Z accuracy (rmse)
Resolution Remark
LIDAR ±0.2m 2m Third party LIDAR data
±0.5m 5m Urban and floodplain area
±1.0m 5m Rural area
Photogrammetric data (Socet Set)
±2.5m 5m Mountain and moorland area
Landform Profile ±5.0m 10m Existing height product
Table 4.1: Data sources and their characteristics
The goal is to combine all data sources in a way that each grid post of the new height product is derived from the most accurate source available.
This principal task is carried out by TopDM (Topographic Data Management, Hochstöger 1996), Inpho’s program system for administration of countrywide digital elevation data. TopDM is based on a geo-relational database (TopDB (Loitsch, Molnar, 1991) or Oracle Spatial) for storing both, geometrical information and additional data characteristics. TopDM is designed to manage primary elevation data (Topographic Data Market) as well as derived products like DTMs. For the creation of the new height product only the DTM administration is used.
Within the Derived Products Market of TopDM the single DTMs are stored in a file system whereas data characteristics are stored in a database table. For each DTM several attributes such as the pla-nar extents, the supplier and owner, the interpolation method, the grid resolution and the z accuracy (rmse) are stored.
Once all available DTMs for a respective area are imported into TopDM and all metadata are cor-rectly assigned a tile of the new height product can be exported from the database using the ‘highest priority’ selection mode. Internally this is done in a two-step process. First the selection criterions specified by the user (tile extents, additional selection attributes) are translated into a SQL condition
202 Warriner, Mandlburger
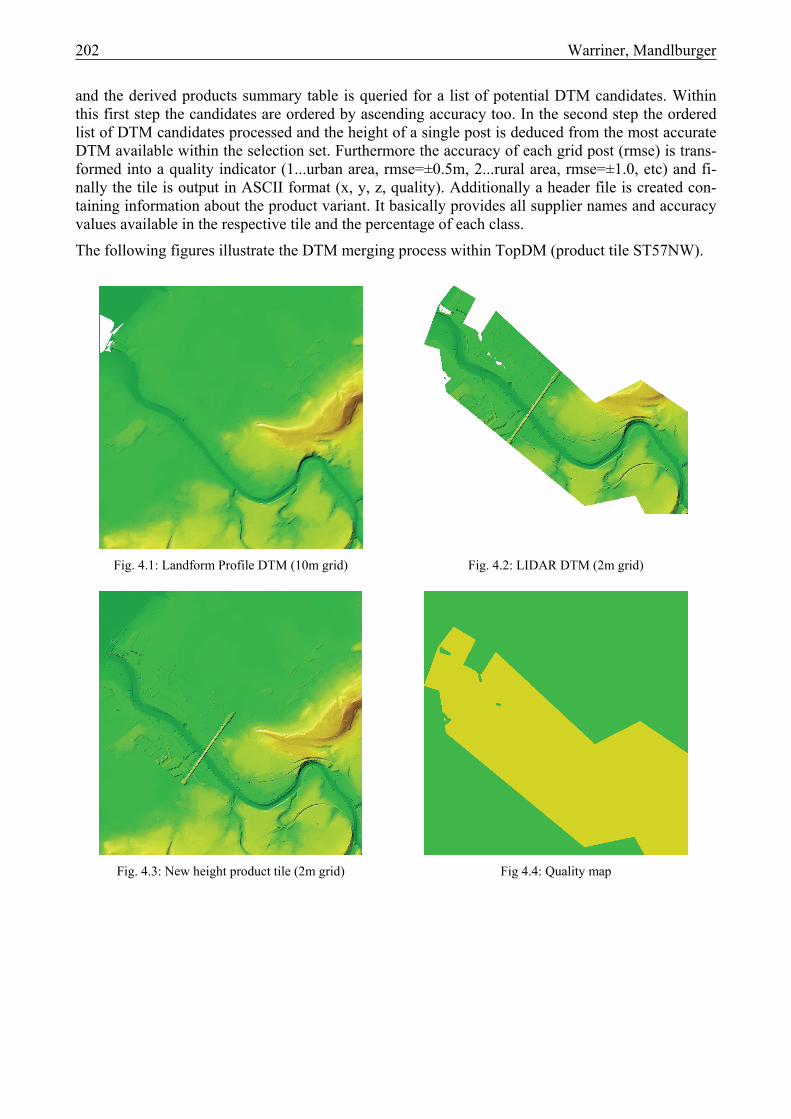
and the derived products summary table is queried for a list of potential DTM candidates. Within this first step the candidates are ordered by ascending accuracy too. In the second step the ordered list of DTM candidates processed and the height of a single post is deduced from the most accurate DTM available within the selection set. Furthermore the accuracy of each grid post (rmse) is trans-formed into a quality indicator (1...urban area, rmse=±0.5m, 2...rural area, rmse=±1.0, etc) and fi-nally the tile is output in ASCII format (x, y, z, quality). Additionally a header file is created con-taining information about the product variant. It basically provides all supplier names and accuracy values available in the respective tile and the percentage of each class.
The following figures illustrate the DTM merging process within TopDM (product tile ST57NW).
Fig. 4.1: Landform Profile DTM (10m grid) Fig. 4.2: LIDAR DTM (2m grid)
Fig. 4.3: New height product tile (2m grid) Fig 4.4: Quality map

Warriner, Mandlburger 203
4.2. General workflow
The different data sources and their characteristics are summarized in table 4.1. According to the three possible combinations of these data sources within one 5x5km2 product tile, three different flowlines have been designed.
• Flowline1: combination of Profile and LIDAR data
• Flowline2: combination of Profile and photogrammetric data
• Flowline3: combination of Profile, photogrammetric and LIDAR data
The general processing sequence is:
1. Conversion of raw data into the native SCOP DTM format using SCOP++
2. Additional preparation steps like blending, splitting of DTMs in SCOP++
3. Import of the SCOP DTMs into the TopDM database including assignment of the appropri-ate metadata (accuracy, supplier, etc.)
4. Export of new height product tiles as described in section 4.1
As far as possible all these steps have been automated using the batch capabilities of SCOP++ and TopDM. The required command procedures (cmF files) are generated by a wrapper program, which is developed by Ordnance Survey. A simple batch file connects the different steps to a complete automatic workflow from the raw data to the new height product tiles.
Flowline1 combines existing Profile data with third party LIDAR data and it is completely auto-mated. First the profile data – given as 5x5km2 x-y-z ASCII files – are converted into the native DTM format of SCOP and subsequently imported into the database. LIDAR data are provided as 2x2km2 DTM grids and can directly be imported into TopDM. The product output is created as de-scribed in section 4.1. If available LIDAR data is favoured over Profile data, even accepting a dis-continuity in the height progression changing from one source to the other since each post is marked with the appropriate quality indicator (see figure 4.3 and 4.4).
Flowline2 is basically processed in the same way as Flowline1 especially concerning Profile data. The photogrammetric data (tiles of 10x10km2 comprising breaklines, additional mass points and a
Fig 4.5: Hybrid DTM (regular 5m grid including breaklines), TR03 area

204 Warriner, Mandlburger
5m grid derived from the Socet Set TIN) are first converted into the native DTM format. The hybrid DTM structure of SCOP based on a regular grid and including intermeshed breaklines (Kraus, 2000) is to the best advantage for this data configuration and enables a high accurate photogram-metric DTM. Before importing into the database the resulting 10x10km2 DTM tiles have to be split up into three partial DTMs (urban area: rmse=±0.5m, rural area: rmse=±1.0m, mountainous area: rmse=±2.5m) . The rest of the processing line is equivalent to Flowline1.
Flowline3 is most demanding since it combines all available data sources. The general workflow is similar to Flowline 1 and 2. The basic difference is that data from different sources but the same quality level (LIDAR and photogrammetric data) have to be blended in such a way, that there is a continuous transition from one data source to the other. The details of blending are described in the next section.
4.3. Blending of DTM data
The basic idea for achieving a smooth transition from one DTM to the other is to blend the z-values of both DTMs within a certain tolerance band in an appropriate way. Mathematically this can be expressed as a weighted average of both z-values where the weights depend on the distance from the center of the tolerance band. The tolerance band itself must surround the domain of the first DTM and may be given as a single closed boundary line. The blending algorithm is capable of han-dling multiple boundaries (tolerance bands) in a single blending process.
Figure 4.6 shows a mosaic of two DTMs (DTM 1...eastern part, DTM 2...western part) which were blended along a single boundary line.
Fig. 4.6: Blending two DTMs with different resolution
Within the tolerance band the weight w1 according to the 1st (inner) DTM starts at 0.0 and gradu-ally increases to 1.0 at the opposite edge of the tolerance band. In the same way the weight w2 ac-cording to the 2nd (outer) DTM decreases from 1.0 to 0.0. The z-values can then be calculated by the formula:
2*21*1 zwzwz +=
10.12 ww −=

Warriner, Mandlburger 205
Different results can be achieved by applying different weight functions. Basically three types of weight functions can be distinguished.
• Jump function
• Linear function
• Curved function
Fig. 4.7: Linear and curved weight function
Figure 4.7 shows that - regardless of the type - the weight function starts with 0.0 at the outer boundary of the tolerance band, increases to 0.5 in the center of the tolerance band and finally reaches 1.0 at the inner band edge. The advantage of the curved weight function is the horizontal tangent at the edges of the tolerance band, which causes a steady change of the elevations as well as the slopes. But this can only be achieved by a steeper increase of the weights (more abrupt transi-tion) in the middle of the tolerance band. Using the linear weight function on the other hand ensures a continuous increase of the weights, which has proved to be best for most applications. Neverthe-less the curved weight function may also be appropriate in some special cases. The jump function is a special case where the weights jump from 0.0 to 1.0 exactly in the middle of the band, which in fact means that there is no blending at all but a direct jump of the z-values from the 1st to the 2nd DTM.
Figures 4.8 and 4.9 show the results of blending low resolution Profile data (10m grid) with high resolution LIDAR data (2m grid) using a jump function (Fig. 4.8) and a linear weight function (Fig. 4.9). Fig. 4.8 is basically equivalent to Fig 4.3 and shows a discontinuity in the height progression whereas Fig 4.9 shows a smooth transition.
Fig. 4.8: Blended DTM (jump function) Fig. 4.9: Blended DTM (linear weight function)
206 Warriner, Mandlburger
5. CONCLUSION
This paper gives a necessarily brief account of the technology used to create a new height product at Ordnance Survey. The work described here was carried out since the beginning of January 2005 and has successfully delivered a fully tested and implemented system for merging height data with the first product tiles being available for supply on 31st May 2005.
In order to develop the system described here a joint approach was taken where following a week of consultancy at Ordnance Survey the detailed requirements were gathered and a number of prototype processes were agreed and specified. These were delivered as interim software releases to enable the wrapper development at Ordnance Survey to progress at the same time. Excellent relations were established between the Inpho and OS developers such that problems were resolved quickly whilst remaining on track to deliver on time.
The solution chosen involved the use of new technology for Ordnance Survey, the decision to go ahead with this approach was made following a successful demonstration of the capabilities of SCOP++. The most important element being the ability to manage the DTMs in a database such that all the source data remains available and selectable using the appropriate query.
Some outstanding functionality remains to be developed which will give a user friendly method of removing DTM tiles from the database. Ordnance Survey have ongoing investigations to establish the most appropriate methods for capturing ±0.5m rmse height data photogrammetrically at which point it may be possible to utilise the SCOP++ interpolation algorithms to create the DTM without importing the 5m grid from Socet Set. This capability will then realise a high quality DTM making best use of the original TIN height source whilst eliminating the facet structure which creates un-wanted artifacts in the data.
6. REFERENCES
Hochstöger, F., 1996. Software for Managing Country-Wide Digital Elevation Data. International Archives for Photogrammetry and Remote Sensing, XXXI, Part B2, Vienna 1996, S.160 - 163.
Kraus, K., 2000. Photogrammetrie, Band 3, Topographische Informationssysteme. Dümmler Ver-lag.
Loitsch, J., Molnar, L., 1991. A Relational Database Management System with Topological Ele-ments and Topological Operators. In: Proceedings of Spatial Data 2000, Department of Photo-grammetry and Surveying, University College London, pp. 260-259.
Web References:
Inpho: http://www.inpho.de Institute of Photogrammetry and Remote Sensing: http://www.ipf.tuwien.ac.at Ordnance Survey: http://www.ordnancesurvey.co.uk