Strategy and Program Assessment -...
102
Strategy and Program Assessment Document Stage: Final December 2005 Nepal: Public Finance Management Assessment This draft is for consultation purposes only and does not necessarily reflect the views of ADB’s Management, Board of Directors, or the Government of [country]. Comments may be submitted to [e-mail address] by [deadline].
Transcript of Strategy and Program Assessment -...

Strategy and Program Assessment
Document Stage: Final December 2005
Nepal: Public Finance Management Assessment
This draft is for consultation purposes only and does not necessarily reflect the views of ADB’s Management, Board of Directors, or the Government of [country]. Comments may be submitted to [e-mail address] by [deadline].

PREFACE As part of the preparation of the Asian Development Bank’s (ADB’s) Country Strategy
and Programming (CSP) and subsequent updates, the ADB commissions various background studies with the objective of identifying constraints to sustainable sector development and recommend measures to address these shortcomings. The findings of these studies provide critical inputs with a view to strengthening the analysis and recommendations of the CSP.
The Public Finance Management Assessment (PFMA) for Nepal was included as one of
a set of studies that would contribute to the Nepal CSP(U). The objective of the PFMA was to identify key constraints and propose recommendations across a spectrum of selected topics of public sector management. The structure of the PFMA is as follows. Chapter 1 presents a background of the socio-economic context in Nepal. Chapter 2 reviews underlying constraints in public finances with a specific focus on fiscal management. Chapter 3 reviews salient features of public resource management including the overall budget framework, revenue mobilization, the medium term expenditure framework. Chapter 4 assesses constraints across treasury and debt management. Chapter 5 reviews key issues in fiscal decentralization. Chapter 6 presents recommendations and conclusions.
The recommendations will serve to strengthening Nepal’s public resource management
policy and institutional framework with the goal of realigning public resources to policy priorities in order to better fulfill the government’s economic and social development objectives. More concretely, the PFMA will provide general guidelines for future ADB assistance in the public sector management activities.
This report was prepared by ADB staff consultant, Mr. Para Suriyaarachchi under the
overall direction of Bruno Carrasco, Principal Financial Economist and Kyung Nam Shin, Public Sector Resource Management Specialist, with assistance from Myra Teresa Mendoza, all from South Asia Department, Governance Finance and Trade Division (SAGF). The field work for the report was undertaken during November - December 2004, and the draft report was completed in the second quarter of 2005. The report has benefited from comments from the Government of Nepal and ADB staff. The views expressed in this report do not necessarily reflect those of ADB or its Board of Directors.
I would also like to acknowledge and express our appreciation for the support given by
many ADB staff members who provided substantial guidance, comments, and advice.
Kunio Senga Director General South Asia Department Asian Development Bank Manila, Philippines December 2005
ii
LIST OF ACRONYMS/ABBREVIATIONS
ADB — Asian Development Bank ADDCN — Association of District Development Committees of Nepal ASCI — Administrative Staff College of India CFAA — Country Financial Accountability Assessment CIAA — Commission for Investigation of Abuse of Authority CPAR — Country Procurement Assessment Review DDC — District Development Committee DFID — Department for International Development DTCO — District Treasury and Controller Office FACD — Foreign Aid Coordination Division FAR — Financial Administration Regulations FCGO — Financial Comptroller General's Office FY — Fiscal Year GDP — Gross Domestic Product GFS — Government Financial Statistics HIPC — Highly Indebted Poor Country IAP — Immediate Action Plan IMF — International Monetary Fund LBFC — Local Bodies Financial Commission LSGA — Local Self Governance Act LTO — Large Tax Payers Office MDAC — Ministerial Development Action Committee MOF — Ministry of Finance MOGA — Ministry of General Administration MOLD — Ministry of Local Development MTEF — Medium Term Expenditure Framework MUAN — Municipalities Association of Nepal NAVIN — National Association of Villages In Nepal NDAC — National Development Action Committee NDF — Nepal Development Forum NDHS — Nepal Demographic Health Survey NEA — Nepal Electricity Authority NLSS — Nepal Living Standards Survey NOC — Nepal Oil Corporation NPC — National Planning Commission NRB — Nepal Rastra Bank NVC — National Vigilance Center OAG — Office of the Auditor General PE — Public Enterprises PERC — Public Expenditure Reform Commission PETS — Public Expenditure Tracking Surveys PMAS — Poverty Monitoring and Analysis System PRSP — Poverty Reduction Strategy Paper RBB — Rastriya Banijya Bank RNAC — Royal Nepal Airlines Corporation SWAP — Sector-Wide Approach VAT — Value Added Tax VDC — Village Development Committee
TABLE OF CONTENTS
Page
Preface i
List of Acronyms/Abbreviations ii
Chapter 1 Background/Socio-Economic Context 1 Introduction 1 Recent Reform Efforts 1 Objectives/Structure of the Report 3
Chapter 2 Deficiencies/Weaknesses of the Public Financial System 3 Introduction 3 Weaknesses in Fiscal Management 3
Chapter 3 Recent Progress in Public Resource Management 5 Introduction 5 Background/Overview--- Changing Dynamics of the Budget
Framework 6
The Planning Process 8 Budgeting and Resource Allocation Process 10 Medium Term Expenditure Framework (MTEF) 11 Predictability of Funding 16 Reforms in Budget Procedures 19 Immediate Action Plan (IAP) 21 Monitoring and Evaluation 21 Auditing and Oversight 23 Procurement Reform 24 Anti-Corruption Reforms 25 Civil Service Reforms 26 Performance of Public Enterprises (PEs) 27 Conclusion 32
Chapter 4 Treasury and Debt Management 32 Introduction 32 Treasury Management 33 Existing Arrangements 33 Problems Associated With the Present System 35 Debt Management 37 Introduction/Divergent Perceptions on Indebtedness 37 The structure of Public Debt and Recent Trends 38 Reliability/Coverage of Debt Data 40 Recent Progress in Improving Debt Management 41 Key Problems and Issues 41
Chapter 5 Decentralization 43 Introduction/Background 43 Progress in the 1990s and early 2000s 43 Recent Developments/Progress 46 Assessment of the Current Situation 48

iv
Conclusion 53
Chapter 6 Recommendations and Conclusions 53 Introduction 53 Overall Budget Framework 54 Revenue Mobilization 55 Regular/Current Expenditure 56 The Medium Term Expenditure Framework (MTEF) 57 Internalization/Ownership 58 Integration of the Regular and Development Budgets 59 Improving Cost Estimates 60 Improving the Prioritization Process 60 Monitoring and Evaluation 61 Poverty Monitoring 63 Expenditure Reporting and Oversight 64 Treasury Management 65 Public Enterprise Reform 66 Decentralization 67
Annexes: Annex 1—Key Actions for the Future Annex 2—Intra Sector Allocations Annex 3—Immediate Action Plans of the Government (FY02/03) Annex 4—Immediate Action Plans of the Government (FY03/04)
71727583
90

CHAPTER 1: BACKGROUND/SOCIO-ECONOMIC CONTEXT
I. INTRODUCTION 1. With a per capita income of $271 per annum, Nepal is the poorest country in the South Asia Region, and one of the poorest countries in the world. Poverty incidence in the country remains high, with about 40% of the population below the poverty line at the beginning of the present decade1. Nepal has implemented several five-year development plans, supported by considerable external assistance, over the past four decades; and significant progress has been achieved from a relatively low base in many areas. Nevertheless, there has been considerable dissatisfaction both among the Nepali public and development partners that progress of overall development/poverty reduction efforts has not been fast enough, particularly against a background of growing Maoist insurgency in many districts of the country. Some2 see the "failure of development" as a prime cause of the rapid spread of the insurgency. The poor development results in turn are seen to be a consequence of continued political instability over the past decade, inadequate government commitment to pursuing appropriate economic policies and reforms, and the failure of public policies and programs to deliver the benefits of public spending to the rural poor. 2. The Nepal Development Forum meetings, held in mid 2000 and early 2002, focused heavily on these issues; and in preparation for the meetings, considerable analytical work was undertaken by development partners. A Public Expenditure Review was carried out by the World Bank in April 2000. Subsequently, the Government of Nepal itself constituted a Public Expenditure Reform Commission in September 2000, and the Commission's report was published in February 2001. Both these documents analyzed in detail the key issues and problems with regard to public resource management, and made several specific recommendations for addressing these shortcomings. Similarly, a joint Country Financial Accountability Assessment (CFAA) was carried out by the Government of Nepal and the World Bank in late 2001, and a Country Procurement Assessment Review (CPAR) was also prepared in 2001. Together, these documents provide a good baseline against which recent efforts to improve public financial management in Nepal can be measured. A. Recent Reform Efforts 3. The Government, to its credit, has taken up the challenge, particularly in the last 2-3 years. The Tenth Plan, (covering the FY02/03-FY06/07 period), which is also the Government's Poverty Reduction Strategy Paper (PRSP), was formulated in 2002; and to help implement it, a Medium Term Expenditure Framework (MTEF) was adopted for the first time in Nepal, as the basis of the Annual Budget, together with major changes in budget procedures, in July 2002. To carry out the strategy/policy initiatives envisaged in the PRSP, the government also formulated a comprehensive reform program and began to vigorously implement it, focusing particularly on key areas, (notably education, health, financial sector, and governance/anti-corruption
1 The 1996 Nepal Living Standards Survey estimated the income poverty rate at 42%. Subsequent estimates by the
National Planning Commission suggested a decline in poverty incidence to 38% by 2000; but, it has been generally believed that, since then, the escalation of the Maoist insurgency, the resulting economic slowdown and displacement of people in the conflict-affected areas may have pushed the poverty rate back up. However, the latest (2004) NLSS, (currently being processed), seems to indicate that, notwithstanding the effects of the conflict, poverty incidence has continued to decline, presumably due to increased inflow of remittances and sustained agricultural growth, both of which benefited rural areas.
2 See Country Assistance Plan for Nepal of UK's Department for International Development, 2003.

2
programs, among others). For this purpose, it also adopted the innovation of an Immediate Action Plan (IAP)—a list of critical reform actions in key areas/sectors—which it undertook to implement and closely monitor each year. A Local Bodies Fiscal Commission was constituted in 2000 in order to help implement the Local Self Governance Act (decentralization) of 1999; and some significant initial progress has been achieved. Initiatives to improve institutional arrangements to strengthen monitoring and evaluation of public spending through the adoption of a Poverty Monitoring and Analysis System (PMAS) were also begun. These efforts have been supported by a number of external donors through financial assistance (a Poverty Reduction Support Credit from the World Bank and a Poverty Reduction and Growth Facility Arrangement by the International Monetary Fund); and increased financial and technical assistance from other donors (notably by the Asian Development Bank in the form of increased project and program lending, and technical assistance for Tenth Plan preparation, for the establishment of an external and domestic debt monitoring system, and for evaluating contingent liabilities of the public sector and accelerating the privatization process—this work is currently in progress—; and by the UK Department for International Development (DFID) for MTEF preparation and facilitating budget reforms, among others. 4. Thus, after several years of slow progress, the last 2–3 years have witnessed a new wave of reforms in Nepal. It is particularly noteworthy that these reforms have been undertaken against a background of frequent government changes, a growing Maoist conflict, and a serious budget crisis, especially in FY02/03. While many countries would have cited these adverse domestic developments as excuses for inaction, the Nepalese government/bureaucracy has used the crisis as an opportunity for introducing critical reforms. The reform efforts in a number of areas have been impressive, (for example, in education, health, planning and budgeting, and the anti-corruption program). But, the benefits from these efforts are not still widely evident, because such efforts will take time to show results and also because, given the continuing conflict, effective implementation of development programs and activities remains a challenge in many parts of the country; and economic activity and investment levels are hampered directly and indirectly by conflict-related disruptions. Nevertheless, Nepal has been able to achieve a modest recovery in economic performance, as GDP grew from a negative –0.6% in FY01/02 by 3.1% and 3.7% p.a. respectively in the last two years, the balance of payments and gross reserves position strengthened, and inflation remained low (around 4% p.a.) by South Asian standards. However, as will be discussed below, much remains to be done to sustain and build on recent progress, in order to achieve the Government's development/poverty reduction goals. 5. There is little doubt that, with a small but growing private sector, the Government will continue to play an important role in socio-economic development and poverty reduction in Nepal. Annual government spending is currently around 18% of GDP; and much of development/capital spending is focused on social and economic infrastructure development, where the private sector's role, though expanding, is still relatively small. But, the growing Maoist conflict has preempted an increasing share of government revenue for security-related expenditures which, together with rising debt service payments, has created considerable fiscal stress, particularly since 2002. While the budget crisis has served as a catalyst for important budget reforms as noted above, the Government has also become increasingly dependent on external aid to an unusual extent, (nearly 70%), for financing development activities in the last two years. This dependence, unavoidable and necessary as it is for the foreseeable future, has created its own problems, such as short-term fiscal vulnerability to unexpected or performance-related slippages in aid availability. Thus, Nepal is currently facing both short-term problems of budget management, as well as more medium to longer-term challenges of strengthening its fiscal management.

3
B. Objectives/Structure of the Report 6. This study seeks to review recent efforts to improve public financial management in Nepal over the past few years, evaluate progress achieved so far, and make practical recommendations for improving fiscal management against a background of political and institutional constraints. Chapters 2 and 3 of the report focus on: (i) Deficiencies in Public Resource Management, and progress of recent public expenditure reforms, (including planning, budgeting, and institutional arrangements for monitoring and evaluation; implementing a Medium Term Expenditure Framework and how effectively it supports the PRSP goals); and (ii) Progress in implementing the key recommendations of the joint Country Financial Accountability Assessment and the Country Procurement Assessment Review in order to improve accountability and transparency of public spending. (iii) It also reviews the performance of Public Enterprises and briefly discusses related issues. Chapter 4 discusses (iv) the Treasury Management System, focusing on how the existing processes/procedures help or hinder cash management and development implementation, and how they can be improved; and (v) Debt Management capacity and related issues, focusing on recent initiatives in this area. (vi) Chapter 5 evaluates recent decentralization efforts, including transfers of both revenue and expenditure functions to sub-national levels and the key political and institutional constraints which currently hamper progress. (vii) Finally, Chapter 6 concludes with practical Recommendations for improving Public Financial Management in Nepal, both in the short term in the context of ongoing instability and conflict, and over the medium to longer term.
CHAPTER 2: DEFICIENCIES/WEAKNESSES OF THE PUBLIC FINANCIAL SYSTEM
I. INTRODUCTION 7. At the beginning of this decade, public financial management in Nepal suffered from a number of systemic/institutional weaknesses. The World Bank's Public Expenditure Review concluded that "There are no simple explanations for the apparent ineffectiveness of public spending in Nepal. A complex web of systemic factors, which cut across virtually all sectors and projects/programs have contributed to poor implementation and development results."3 That report, as well as the government's own Public Expenditure Reform Commission's Report identified and catalogued several major weaknesses, which are summarized below. A. Weaknesses in Fiscal Management 8. A major systemic weakness at the beginning of the present decade had been deficiencies in the planning, budgeting and expenditure management process. These stemmed from many sources: While Nepal had produced several five year plans as the basis of its development strategy, these plans were consistently over-ambitious; they were also unrealistic in terms of implementation/absorptive capacity and resource availability. The country did not, (and still does not), have effective project screening and appraisal systems to select projects and programs on the basis of their economic merits for inclusion in the development program. Thus, the development budget contained too many projects/programs (generally over 700 in the nineties), which could not be adequately funded. As a result, under-funding, fund rationing and poor implementation became hallmarks of the prevailing system, with very few projects/programs completed on time. 3 Nepal Public Expenditure Review, World Bank Report No. 20211-NEP. 11 April 2000.

4
9. Poor institutional arrangements for budgeting and resource allocation helped to aggravate these problems. For example, responsibilities for budget preparation were bifurcated between the Ministry of Finance, (which managed the regular budget) and the National Planning Commission (NPC) which formulated the development budget. There was very little linkage between the two budgets. There was also no systematic basis for prioritizing important development projects and programs for purposes of fund allocation. Although a core program was adopted from time to time, this practice was not consistently followed. As a result, resource allocation in the annual budget for projects, programs and sectors was often done on an ad-hoc incremental basis, based on past implementation performance, political clout and influence, and changing priorities of decision makers, rather than on development priorities. Thus, there was little linkage/connectivity between the (five year) development plans and the annual budget. While there were fund release and management procedures, these often magnified (rather than remedied) the distortions in resource allocation. For instance, since fund availability was almost always less than budgeted, fund rationing was often adopted; and funding was provided to those sectors which had utilized their previous allocations quickly. Thus the fund release system favored quick spenders, rather than development priorities, and sectors such as electricity and local development gained at the expense of agriculture, irrigation and forestry, despite their importance for poverty reduction. 10. Even where resources were allocated and provided, there were considerable intra-sectoral misallocations and inefficiencies in the use of resources. Some notable examples included: agriculture, where a large part of the development budget had been used to subsidize inefficient operations of the Agriculture Inputs Corporation; transport, where a significant proportion of resources had been channeled to unplanned construction of uneconomic (political) road projects; and health, where construction of rural health centers was not supported by adequate trained staff and basic drugs, medicines and equipment. Also, across sectors, funding for operations and maintenance activities had been inadequate. These inefficiencies have been reflected across sectors, sometimes in increased unit costs, but primarily through failure to deliver public services of acceptable quality and regularity. In addition, in a number of instances, the benefits of public spending had accrued largely to the relatively better-off segments of the community and could not be defended on equity grounds. For example, a significant proportion of increased spending on health largely benefited the relatively well-off urban population; and in education, a substantial part of the sectoral budget went into higher education which primarily benefited the upper income groups; while in power, the benefits accrued largely to urban communities; and the rural areas where the majority of the population live, were badly under-served. 11. A persisting concern from an implementation perspective was the lack of ownership of the development program at the various levels. Broadly, at the national level, the ongoing development program was seen as largely "donor driven". Most development projects/programs were included in the development budget at the behest of external donors, financed by them and sometimes directly implemented by them. Different donor procedures for expenditure reporting and disbursements and procurement often took precedence over national ones. Within the government's own program too, the planning and budgeting process and the selection of projects/programs were seen as a "top down" process, with little involvement of local communities and beneficiaries in their selection, design and implementation. As a result, there was considerable questioning of the relevance of development programs and activities; and lack of commitment to, and interest in, their effective implementation, at many levels.

5
12. The funding problems were exacerbated by the poor performance and management of the public sector, particularly public enterprises. The paternalistic role of the public sector was reflected in excessive government presence in many areas, where an emerging private sector could have played an important role. Public enterprises dominated several sectors and areas of the economy, but the performance of the vast majority of them both in terms of financial results and efficient delivery of goods and services was poor. Only a few public enterprises made an operating profit; and the large majority required annual government infusions of capital through operating subsidies, funding of virtually all new investment, and even servicing of their debt service liabilities. This was a continuing drain on the budget, which itself was often short of resources; and contributed significantly to the overall poor public expenditure management. 13. Governance issues have been a major factor undermining the effectiveness of public spending. These have taken many forms, notably (i) excessive political interference at key points in the project cycle; and (ii) increasing corruption. The most common examples have included excessive political interference in the appointments and (frequent) transfers of civil servants and project officials, political involvement even in simple procurement decisions, misuse/diversion of public funds for unauthorized purposes, and Cabinet decisions serving parochial interests. (iii) This led to increased politicization of the civil service and insecurity among public officials; (iv) Created an environment which was conducive to leakages and lack of accountability; (for example, on the revenue side, to collusion between tax officials and tax payers in regard to customs valuation, tax assessment etc; and on the expenditure side, to increased incidence of financial irregularities at various levels). (v) However, the mechanisms/legal safeguards for addressing these deficiencies were weak. For example, although the Auditor General reported numerous financial irregularities, effective steps had not been taken to check such abuses. Similarly, although the Commission for Investigation of Abuse of Authority (CIAA) had filed several cases against various individuals, its success rate in the nineties was very low. 14. While there have been several other factors of a lesser order of magnitude contributing to poor public expenditure management, the lack of coordination among government ministries, departments and agencies; duplication of offices and infrastructure at district levels; an inefficient and unmotivated civil service with ill-matched skills and staffing; and dilatory government procedures and practices, have been frequently noted. Some of these have been since addressed as part of the recent reforms, but some still remain. The Government's efforts to address these major deficiencies over the last 2-3 years are discussed in the next chapter.
CHAPTER 3: RECENT PROGRESS IN PUBLIC RESOURCE MANAGEMENT
I. INTRODUCTION 15. In the last 2–3 years, especially since the Nepal Development Forum meeting held in February 2002, the Government of Nepal has made strong efforts to improve its overall poverty reduction strategies and policies, and enhance the efficiency and effectiveness of its public expenditure program. The Reform Agenda, (which was proposed at that meeting), has been vigorously implemented. The key fiscal reforms, (aimed at addressing the systemic deficiencies identified in Chapter 2 above), include the following: the formulation of a comprehensive, well-articulated Poverty Reduction Strategy Paper (PRSP), which is fully owned by the Government; the adoption of a Medium Term Expenditure Framework (MTEF) to help implement the PRSP's key priorities; reforms in budget management to help rationalize fund release procedures to support the MTEF; introduction of innovative approaches in key sectors in order to

6
operationalize the new implementation strategies and mechanisms envisaged in the PRSP to help improve service delivery in rural areas; and the adoption of an innovative Immediate Action Plan to better monitor the implementation of key reforms. These measures, necessary as they are for addressing prevailing deficiencies in fiscal management, were also inspired by a fiscal crisis which emerged suddenly in 2002. A quick review of the changing dynamics of Nepal's fiscal situation will help to understand the motivation for the recent reforms which are discussed subsequently. A. Background/Overview—Changing Dynamics of the Budget Framework 16. Nepal's main fiscal parameters in the mid nineties and significant changes in the first half of this decade are summarized in Table 1. As to be expected of countries with similar levels of per capita incomes, Nepal's revenue/GDP ratio has been quite low—only around 11% in the mid nineties. Total government expenditures averaged around 18%, and the primary budget deficit (before grants) was around 7% of GDP in FY94/95. Since regular expenditures4 were contained within 9% of GDP, Nepal was able to maintain development spending around 9–10% of GDP. This level of development spending was financed almost equally from domestic and foreign resources. Gross foreign aid inflows were equivalent to about 56% of development spending over the FY94/95–FY99/00 period; but, the contribution of domestic resources (from a revenue surplus of about 2–2.5% of GDP per annum and modest domestic borrowing of around 1.8% of GDP per annum) was still substantial.
Table 1: Changing Dynamics of the Budget Framework, FY94/95-FY04/05 (Rs billion)
Item FY94/95
FY95/96-FY99/00 Average FY00/01 FY01/02 FY02/03 FY03/04 FY04/05
Revenue 24.58 34.27 48.89 50.45 56.23 62.23 70.32Total Expenditure 39.07 55.85 79.84 80.07 84.01 92.11 111.69 Regular 19.27 27.70 42.77 48.59 54.97 59.30 64.49 Development 19.80 28.15 37.07 31.48 29.03 32.81 47.20
Primary Deficit -14.49 -21.58 -30.94 -29.63 -27.78 -29.88 -41.37Financing Dev. Exp. 19.80 28.15 37.07 31.48 29.03 32.81 47.20
Revenue Surplusb 5.31 6.57 6.13 1.86 1.26 2.93 5.83
Domestic Borrowingc 3.24 5.68 12.14 16.24 11.89 7.31 9.06
Foreign Assistanced 11.25 15.90 18.80 13.39 15.89 22.57 32.31As Percentage of GDP (%) Revenue 11.21 11.04 11.90 11.95 12.36 12.57 13.16
4 One of the important recent changes relates to changes in the budget classification itself. Beginning with the
FY04/05 Budget (announced in July 2004), Nepal officially changed its presentation of budget accounts/fiscal data from a "Regular Budget/Development Budget" to a "Recurrent/Capital" classification. However, historical data has not been reclassified so far on the new format. Accordingly, the review and analysis of reforms undertaken in the past few years and their impact can be carried out only on the basis of the "Regular/Development" classification, which is the basis of this report. It is also important to note that the presentation of fiscal data by the Government in its Budget documents and related expenditure/revenue reports are on a gross basis, and are somewhat different from the International Monetary Fund's presentation of fiscal data, which are on a net or consolidated basis (i.e. nets out inter-governmental transactions and debt repayments). In order to make the report more easily understood by its principal users (which includes the Government and local stakeholders in Nepal), the government's database is used for this analysis, rather than the GFS classification.

7
Item FY94/95
FY95/96-FY99/00 Average FY00/01 FY01/02 FY02/03 FY03/04 FY04/05
Total Expenditure 17.82 17.99 19.43 18.96 18.47 18.61 20.90 Regular 8.79 8.92 10.41 11.51 12.08 11.98 12.07 Development 9.03 9.07 9.02 7.45 6.38 6.63 8.83
Primary Deficita -6.61 -6.95 -7.53 -7.02 -6.11 -6.04 -7.74Financing Dev. Exp. 9.03 9.07 9.02 7.45 6.38 6.63 8.83
Revenue Surplusb 2.42 2.12 1.49 0.44 0.28 0.59 1.09
Domestic Borrowingc 1.48 1.83 2.96 3.85 2.61 1.48 1.70
Foreign Assistanced 5.13 5.12 4.58 3.17 3.49 4.56 6.05Memo Item: Aid as % of Dev. Exp. 56.50 56.48 50.70 42.50 54.70 68.80 68.50 GDP(At Producers' prices) 219.18 310.36 410.79 422.30 454.94 494.88 534.47a Before Grants. b Revenue minus regular expenditure. c From bank and non-bank sources and "use of cash balances". d Grants and loans.
17. By the end of the nineties, however, signs of fiscal weakening had begun to emerge—sluggish revenue growth, rising regular expenditures particularly on security and debt servicing, falling aide levels (in relation to GDP) reflecting weak budget implementation and 'aid fatigue'. As aid levels declined by about 1% of GDP to around 4.5% of GDP, domestic borrowing had to be increased to maintain development spending around 9% of GDP. 3.4. The fiscal situation deteriorated further into a full-blown crisis in FY02/03, as the effects of the escalation of the insurgency, global recession and a weakening economy took their toll. Although efforts to increase tax collections helped to improve the revenue/GDP ratio, regular expenditures increased much faster by 2% of GDP (see Table 1). Thus, the revenue surplus virtually disappeared, while foreign assistance also fell further by another 1 ½% of GDP (to around 3% of GDP). To offset these declines, the government resorted to additional domestic borrowing, which rose to nearly 4% of GDP by the end of FY01/02. Nevertheless, development spending fell to 7 ½% of GDP in FY01/02, its lowest level for many years.
Table 2: Functional Classification of Regular Expenditure (%)
Item FY94/95 FY99/00 FY00/01 FY01/02 FY02/03 FY03/04 Social Services 23.1 24.1 25.4 27.5 25.0 23.7 Economic Services 4.3 4.0 3.3 3.3 3.2 4.0 Infrastructure 2.7 2.4 0.5 0.6 0.5 2.0 General Administration 7.2 6.4 6.0 7.2 6.2 4.5 Defense & Security 18.6 19.6 21.0 24.5 24.7 22.2 Debt Servicing 31.6 29.1 24.3 25.1 29.4 27.3 Miscellaneous 12.5 14.3 19.4 11.8 10.8 14.6a Total 100.0 100.0 100.0 100.0 100.0 100.0
a Includes contingencies, a part of which was later utilized for security expenditures.
Note: From FY04/05 onwards, budget details on the basis of regular/development expenditures are no longer provided. Source: Ministry of Finance.
18. Since then, there has been a turn-around of sorts in the last 2 years, mainly due to government efforts which are discussed in the rest of the report. The growth of regular

8
expenditure moderated somewhat, but it still preempted about half of the increase in revenues; and domestic borrowing has been cut back (by nearly 2.5% of the GDP) to 1.5% in FY03/04. The budget reforms (discussed below) have helped to trigger increased external assistance (including budget support), and raise the foreign aid/GDP ratio again by about 1% of GDP by FY03/04. But this came too late to help increase development spending in FY02/03; and in FY03/04, despite improved funding availability, the spread of the conflict has held back development spending to around 6 ½% of GDP. For FY04/05, the Government has announced an ambitious budget which aims at increasing development spending to around 8.8% of GDP, with the help of substantially increased external assistance (by another 1 ½% of GDP to about 6% of GDP). But, as discussed below, this target is unlikely to be realized (para. 116). 19. Some important observations can be made from the above analysis. Clearly, the dynamics of the budget have changed in recent years, with important implications for future policies: (i) The Government's revenue surplus, which was an important source of domestic financing of development activity in the past, has become almost negligible. (ii) Domestic borrowing (from banking and non-banking sources) has been reduced. According to the current policy stance agreed with the IMF, such borrowing will continue to be reduced over the next few years, as part of the PRGF framework. Thus, the domestic contribution to financing development activity has fallen to quite low levels by historical standards. It is therefore important to make strong efforts to increase the revenue ratio and to curtail the growth of regular expenditures, especially on defense and internal security; but this will require an abatement of the conflict, which may take time. (iii) Thus, to finance even a minimum level of development spending for achieving reasonable progress towards PRSP goals, Nepal will need to depend heavily on external financing. It is thus highly unlikely that the present degree of external dependence, (close to 70% of development spending was externally financed in FY03/04 and is projected to be financed in FY04/05 also), can be reduced any time soon. But, to trigger such assistance, Nepal will need to continue to pursue fiscal and other reforms agreed with external donors; and delays in meeting performance criteria themselves can create new sources of fiscal pressures. This indeed could happen this year; and if so, may lead to another cash management crisis (paras. 114–116). 20. The fiscal reforms that were initiated in 2002 (as part of the FY02/03 Budget) represent an important start in this context. It could be argued that, given the fiscal crisis in FY02/03, there was little alternative for the Government but to undertake such reforms. Nevertheless, it is to the credit of the Government that it turned the crisis into an opportunity to carry out much needed reforms against a background of continued conflict and political instability; and that it has stayed the course so far. The remainder of this chapter discusses these recent reform efforts in greater detail. It also reviews the impact of these measures so far, particularly how they have (or have not) helped to address the systemic problems in public financial management earlier.
B. The Planning Process 21. As discussed in Chapter 2, a major factor which contributed to ineffective public resource management in the past has been weaknesses in the planning and budgeting system—over-ambitious development plans, with unrealistic goals and targets, lack of clear priorities and strategic focus, disregard of implementation capacity and resource constraints, and little involvement of local governments, beneficiaries, civil society or development partners, among others. As a result there was little connection between planning, policy making and budgeting (resource allocation) processes. There was also little emphasis on the implementation aspects of the plans, and on monitoring and evaluation to ensure effective

9
delivery of results/outputs. Reforms introduced in the last 2-3 years have begun to address these problems, and significant progress has already been achieved (see below). 22. The Government's Tenth Plan, which is also its Poverty Reduction Strategy Paper (PRSP)5, was finalized in FY02/03, and represents a significant departure from past practices. To quote the Tenth Plan/PRSP—"the Tenth Plan represents a major effort to address these shortcomings. Its distinguishing features include the following: (i) Its has adopted a participatory and relatively more 'bottom up' approach; (ii) It is the product of an extended nation-wide consultation process over two years; and the feedback from the such consultations has been interactively utilized for finalizing the Plan's objectives, targets, policies and programs; (iii) It focuses strategically on the overall poverty reduction strategy and seeks to prioritize sectoral programs and activities accordingly; (iv) It emphasizes results and effective implementation and monitoring mechanisms; (v) It incorporates a credible macroeconomic framework by utilizing alternative scenarios; (vi) The latter is supplemented by a rolling Medium Term Expenditure Framework (MTEF), which will be updated every year, and provides for the first time in Nepal, an effective mechanism to link the annual budget with the Five Year Plan and to make periodic adjustments in programs as needed; and (vii) Finally, as the product of a highly participatory process, it can claim a far higher degree of national ownership and acceptance than earlier plans"6. 23. The Tenth Plan/PRSP's declared objective is to "achieve a remarkable and sustainable reduction in the poverty level from 38% at the beginning of the Plan period to 30% by the end of the Tenth Plan, and to further reduce the poverty ratio to 10% in about fifteen year's time". Since nearly 90% of Nepal's poor live in rural areas, the Plan's poverty reduction strategy is strongly rural-oriented. To reduce (rural) poverty, the Plan/PRSP has adopted a four-pillar strategy: (i) Accelerating income and employment generation through a broad-based pro-poor growth strategy focusing particularly on rural/agriculture growth; (ii) Accelerating social and human development, and provision of rural infrastructure (rural roads, electricity etc), to bring benefits of development/public spending particularly to rural communities; (iii) Targeted programs, as well as programs emphasizing social inclusion, in order to bring the poor, marginalized groups/communities, women and backward regions into the mainstream of development; and (iv) Good governance, to improve efficiency, accountability and delivery of public services and to reduce corruption and misuse of resources. To implement the four-pillar strategy, the Plan also stresses several cross-cutting strategies: (v) Redefining the role of the State and limiting public interventions, particularly in view of resource and implementation constraints; (vi) Promoting community participation and involvement in the choice, design and management of activities at the local levels (in order to improve efficiency and quality of service delivery; (vii) Accelerating the decentralization process (both to improve implementation and promote greater 5 The Tenth Plan/PRSP was prepared under the guidance of a Steering Committee, headed by the Vice-Chairman
of the National Planning Commission (NPC), consisting of Secretaries of line ministries to provide strategic leadership, while Technical Committees headed by the respective Secretaries of the line ministries coordinated the formulation of strategies and programs in each sector, ensuring strong inter-agency participation and ownership. All of the inputs and papers (such as the Interim PRSP, MTEF, sector policy and strategy papers, as well as various drafts of the Plan/PRSP itself), were discussed through public consultations held in different parts of the country, involving a wide range of stakeholders—including representatives from District Development Committees, from deprived communities and backward regions, academia from campuses and schools, NGOs, CBOs, women, political parties, private sector and external development partners. Several regional consultations, including two exclusively for women's groups, were held. No other government publication/policy document has ever been subjected to so much discussion/ dissemination as the Tenth Plan/PRSP.
6 The Tenth Plan/PRSP, pp.5–6.
10
accountability); and (viii) Enlisting the private sector to play a lead role in employment and income generation, and together with NGOs, INGOs, CBOs/SOs, to complement government efforts in service delivery and implementation of activities in key sectors and areas. To help carry out this agenda, the Tenth Plan/PRSP has envisaged a major re-orientation of public expenditure policies and programs; and the MTEF and the Immediate Action Plan (IAP) are two major instruments that have been utilized to this end. 24. The Tenth Plan/PRSP helps to address some of the major concerns with the planning and budgeting system which have been frequently highlighted by development partners in the past: (i) As noted above, it provides a coherent and focused approach, with clearly defined strategies and policies for poverty reduction; (ii) It is fully owned by the government and supported by domestic stakeholders; (iii) Accordingly, it provides a nationally owned framework within which development partners can harmonize their own assistance strategies for poverty reduction in Nepal; and (iv) It has helped to fill a long-standing vacuum in the development management process, with the Government now well-positioned to take over the lead role in deciding project/program priorities and adapting external assistance to fit its own needs. Thus, Nepal can justifiably claim that it is now in charge of its development/poverty reduction strategy, instead of "donor-driven" projects/programs dictating the nature and thrust of the Government's development/poverty reduction effort. A number of major donors have already accepted the PRSP framework and adapted their own assistance strategies to fit within that framework7; but it still remains to be seen whether the Government will manage to get itself into the "driver's seat" in the management of the development process. C. Budgeting and Resource Allocation Process 25. While the formulation of a coherent and focused Poverty Reduction Strategy was a major step forward, the adoption of the key elements of a Medium Term Expenditure Framework (MTEF) provided the missing link between the Plan/PRSP and the annual Budget and its resource allocation process; and made it possible to ensure the implementation of the Plan/PRSP's key priorities. 26. The Government initiated preparatory work for adopting the MTEF approach in November 2001 in parallel with the preparation of the Plan/PRSP; and initial proposals for five important line ministries8 were presented to the Nepal Development Forum (NDF) meeting in February 2002, as a part of the Government's reform agenda. Subsequently, even as the Plan was being finalized, it became evident that a major budget crisis would derail the implementation of the Plan/PRSP (para. 18). The initial resource projections for the FY02/03 Budget, which was to be announced in July 2002, clearly showed that a domestic recession, a stagnation of government revenues and a sharp increase in security-related expenditures, (all of which were directly related to the escalation of the Maoist insurgency), would severely limit the availability of resources for financing the development budget; and that the latter would have to be cut down far below the level of Rs50.5 billion budgeted in FY01/02 (Table 1). Accordingly, MTEF preparation was extended to cover all ministries and sectors; and the MTEF was adopted as the basis for resource allocation in the FY02/03 Budget.
7 Notably, the World Bank, Asian Development Bank and UK, among others. 8 Initially, MTEF preparation focused on five ministries: Education, Health, Agriculture, Irrigation and Physical
Planning and Housing (which also included Drinking Water).

11
D. Medium Term Expenditure Framework (MTEF) 27. It is worth noting that Nepal has opted for a pragmatic phased adoption of the MTEF approach. Unlike many countries which have experimented with operationalizing comprehensive MTEFs, (often with mixed results9), Nepal chose to implement the key elements of an MTEF, adapting it to its own immediate needs and institutional capacity. Thus, initially only the development budget was brought within the MTEF discipline, although the Budget framework took fully into consideration resource availabilities for meeting all (development as well as regular) expenditures. Second, the initial expenditure estimates by the line ministries were prepared on the basis of existing cost parameters, without spending considerable time and resources at the beginning on refining and improving cost coefficients. Third, efforts were made in the beginning to internalize the MTEF preparation process. For example, the preparation of the first MTEF was built into the normal annual budget preparation cycle, with the annual budget call being the basis for the sectoral allocations under the MTEF. Moreover, in order to link the MTEF directly with the Plan/PRSP, the same line ministry teams, (under the direction of their respective line Secretaries), which were involved in the Plan/PRSP preparation and are also normally responsible for the preparation of the annual sectoral budgets/programs, were utilized for MTEF preparation, with assistance from local consultants for providing technical guidance and support. However, as discussed below, this approach was subsequently changed during MTEF 3 preparation; and to ensure effective internalization, the preparation process needs to be better integrated into the budget cycle. 28. The MTEF process essentially involved, among others, the adoption of a realistic and credible budget framework, the prioritization of all programs and activities in the development budget, streamlining/cleaning up the public investment program, and changing budget and fund release procedures to ensure greater predictability in funding for priority activities. These changes are discussed below in some detail. As noted, they have helped to bring about significant improvements in fiscal management in a difficult environment. 29. The first MTEF covering the three-year period FY02/03-FY04/05 was introduced in July 2002 and was the basis of the Development Budget for FY02/03: (i) It introduced a hard budget constraint for the first time in several years, with the size of the development budget set at Rs38.7 billion, well below the preceding year's level of Rs. 50.5 billion; (ii) This in turn necessitated a sharp reduction in the number of projects/programs in the development budget; (iii) In addition, all activities in the development budget were prioritized and ranked into three categories, (on the basis of explicit criteria developed by NPC), in terms of their contribution to poverty reduction (with P1 as the highest and P3 the lowest priority); (iv) All P1 activities were assured funding during the fiscal year to the extent of their budget allocations, while P2 and P3 activities were to be funded only if sufficient funds were available. (iv) To encourage better implementation and also to facilitate cash management, a performance-based fund release system was also introduced. While all P1 projects automatically received their first trimester's allocations, subsequent releases were made contingent on certification by
9 Several developing countries have adopted the MTEF approach in the last decade. In many cases, the degree of
complexity and comprehensiveness was beyond the institutional capacity of the countries; and successful internalization to ensure sustainability became a critical issue.

12
For prioritizing the development budget, detailed guidelines, together with a scoring table, have been provided to line ministries and agencies. The main prioritization criteria include: contribution to national/poverty alleviation goals, contribution to sectoral goals/objectives, contribution to regional development (with districts having lower Human Development Index scores receiving higher priority than others), rationale for government involvement, degree of participation (by civil society/community groups, local governments, private sector etc,), project status (age of project, implementation performance), and certainty of funding (whether funding is assured/committed or not). Marks are assigned for each criteria on a scale of 0-3, with a total score of 21. Each agency is expected to rank each activity/budget line, using a total score of 21, with no discretion to drop any of the criteria. While there was considerable subjectivity in scoring and ranking of activities by agencies early on, the detailed scorecard system allows NPC and MOF to review the agency rankings and agree whether the prioritization is reasonable or not.
line ministries/departments that work programs have been satisfactorily completed. A second rolling 3-year MTEF was prepared a year later for the FY03/04-FY05/06 period. It made the prioritization process more stringent and transparent (by improving the prioritization criteria and introducing a uniform scoring system), and aligned the budget allocations more closely with the PRSP. It also strengthened the analytical rigor of sectoral MTEFs. The third rolling MTEF covering the FY04/05-FY06/07 period was announced in July 2004, and has tried to improve the cost estimation process in a few key sectors. However, it should be noted that, although each of the subsequent MTEFs built on, and generally refined and improved on the preceding MTEFs, overall progress has not been consistently smooth or steady. As discussed in Chapter 6 below, there have been some slippages/backtracking at times, for example, as in the case of MTEF 3 where its budget framework has not been sufficiently realistic and its preparation has not been effectively coordinated with the annual budget cycle. 30. How have these innovations helped to address the prevailing deficiencies in the budgeting system? A number of significant improvements can be pointed out: (i) The annual budget framework has been made more realistic; (ii) The number of projects/programs in the development budget has been significantly reduced; and (iii) Funding for priority activities has substantially increased; (iv) There is also greater predictability of funding for the priority activities; (v) Even more important, activities within the development budget have been more closely aligned with the Plan/PRSP; and the resource allocation pattern among sectors (inter-sector) and within sectors (intra-sector) has improved (see below). 31. Realism of the Budget Framework. Until the last 2 years, government revenue and particularly foreign aid projections in the annual budget were heavily overestimated, allowing the inclusion of hundreds of marginal projects (Table 3). Inevitably, budget outcomes fell far below these unrealistic expectations, especially for foreign aid disbursements and development spending, while domestic borrowing far exceeded the budget targets. The MTEF helped to mitigate these problems in the last two years. In FY02/03, budget targets for revenue, foreign aid and development spending were set at more modest levels. The revenue target was almost achieved. But, aid disbursements still fell significantly short of expectations, largely because anticipated budget support from donors (equivalent to over half the shortfall) did not come through in time. This in turn adversely affected development spending, since the government withheld fund releases to projects/programs, anticipating the funding shortfall. In FY03/04, the outcome has been slightly better. The revenue target has been fully achieved, while shortfalls in aid disbursements and development spending have been smaller. In regard to development expenditure outcome, two facts should be noted: (a) The conflict has made it difficult for the government as well donors to implement programs in some areas; and (b) The development
13
expenditure target included two large projects—Melamchi drinking water and Marsyangdi hydro power—which have been held back by design/implementation problems. When these two projects are excluded, the development expenditure outcome has been better (see Memo Item in Table 3). In the last two years, the Government has also been able to hold domestic borrowing below the budgeted level, and in fact significantly reduce it in FY03/04. However in the FY04/05 Budget, the projected levels of development spending and aid inflows have been set at too high levels, eroding the "hard budget constraint"; and it is very doubtful whether these targets can be achieved, (see below). 32. Another indicator of the degree of realism of the MTEF projections is their consistency/compatibility with the PRSP's budget framework. The PRSP's macroeconomic projections (which had been discussed extensively and agreed with the International Monetary Fund) assume two main scenarios: one for supporting a high growth path (averaging 6.2% per annum) and another consistent with lower growth (averaging 4.3 per annum) and political and resource constraints. The PRSP's key budget parameters for both scenarios, in current prices, (government revenue, regular and development expenditure, and domestic borrowing), are compared with the MTEF budget targets for the FY02/03 to FY04/05 period and actuals for the same variables in Table 4 below. As evident from Table 4, the MTEF's budget projections are closely in line with low case (constrained growth) scenario of the PRSP. Its revenue and domestic borrowing targets, and actual outcomes for the past two years, are better than assumed in the PRSP, while regular expenditures are almost identical with those of the PRSP low case. In the case of development expenditures, MTEF targets assume a 15% implementation shortfall for each year, partly reflecting normal delays and partly the uncertainties with the implementation of two large projects (Melamchi drinking water and Marsyangdi hydro power) noted above. When adjusted for these expected implementation shortfalls, the MTEF's development expenditure target (and actual achievement) is quite close to the PRSP's low case for the past 2 years. However, the current year's (FY04/05) adjusted target, though in line with PRSP, is optimistic for the reasons discussed in para. 116 below.

14
Table 3: Budget Targets Vs. Actuals, FY00/01- FY03/04
(In billion Rs) FY00/01 FY01/02 FY02/03 FY03/04 FY04/05
Item
Budget Actual Change%a
Budget Actual Change%a
Budget Actual Change%a
Budget Actual Change%a
Budget Change%b
Total Expenditure 91.6 79.8 -12.9 99.8 80.1 -19.8 96.1 84.0 -12.6 102.4 92.1 -10.6 111.7 21.3Regular 43.5 42.8 -1.7 49.3 48.6 -1.5 57.4 55.0 -4.2 60.5 59.3 -2.0 64.5 8.8Development 48.1 37.1 -23.0 50.5 31.5 -37.6 38.7 29.0 -25.1 41.8 32.8 -21.5 47.2 43.9
FINANCING Revenue 53.0 48.9 -7.7 60.3 50.4 -16.3 57.2 56.2 -1.7 62.2 62.2 0.0 70.3 13.0Foreign Aid 31.6 18.8 -40.0 30.5 14.4 -53.0 27.0 15.9c -41.1c 28.3 22.6 -20.1 32.3 42.9Domestic Borrowing 7.0 12.1 72.3 9.0 15.3 69.3 12.0 11.9 -0.8 11.8 7.3 -38.1 9.1 24.7Memo Item: Development Expenditure without Melamchi & Marsiyangdi
-
-
-
-
-
-
33.6
27.5
-18.2
35.4
28.4
-19.8
42.7
50.4
a Deviation of actual expenditure from the Budget for same year.
b Increase in FY04/05 Budget over FY03/04 actuals.
c Shortfall partly reflects slippage in the approval of Poverty Reduction Support Credit (PRSC).
Source: Ministry of Finance, (Budget Documents).

15
Table 4: Budget Projections—PRSP vs MTEF, FY02/03–FY04/05 (In billion Rs)
a Adjusted for implementation shortfall. An implementation shortfall of 15% is assumed in Table 4, to allow for normal
implementation delays as well as for uncertainties with the implementation of the Melamchi drinking water and Marsyangdi
hydropower projects.
Item FY02/03 FY03/04 FY04/05 Government Revenue PRSP High Case 53.0 61.4 71.8
Low Case 52.3 58.6 65.5 MTEF Target 57.2 62.2 70.3
(Actual) (56.2) (62.2) (n.a.) Domestic Borrowing PRSP High Case 14.0 12.2 9.8
Low Case 14.0 12.6 10.9 MTEF Target 12.0 11.8 9.1
(Actual) (11.9) (7.3) (n.a.) Regular Expenditure PRSP High Case 57.0 58.6 60.3
Low Case 55.6 59.1 63.5 MTEF Target 57.4 60.5 64.5
(Actual) (55.0) (59.3) (n.a.) Development Expenditure PRSP High Case 32.5 40.9 51.5
Low Case 29.0 35.0 40.5 MTEF Target 38.7 41.8 47.2
Targeted Adjusteda 32.9 35.5 40.1 (Actual) (29.0) (32.8) (n.a.)
Sources: The Tenth Plan/PRSP; MTEF and Budget documents. 33. Streamlining/Cleaning up the Portfolio. To make room for PRSP priorities (and security-related expenditures in the regular budget), a number of low-priority projects were eliminated in the FY02/03 budget/MTEF (Table 5). The Government had already begun to streamline the development program as part of the recommendations of the PERC, and some 83 budget lines were deleted in FY01/02. Since then, an additional 199 projects were eliminated during FY02/03. Although there has been a marginal increase (of 20) in the number of new projects/activities in FY03/04 and FY04/05, the total number of projects has been kept within tight limits. This has helped to double the budget allocation per project compared to earlier years.
Table 5: Key changes on the Development Budget Allocations, FY98/99-FY04/05
Item FY98/99 FY99/00 FY00/01 FY01/02 FY02/03 FY03/04 FY04/05 Dev. Budget (Rs Billion) 37.74 41.85 48.11 50.47 38.68 41.85 47.20 Number of Projects 770 681 715 633 434 443 454 Allocation per Project (Rs Million)
49.01 61.45 67.29 79.73 89.12 94.47 103.97
Source: HMGN Budget Documents. 34. Portfolio cleaning has helped to ensure that the projects/programs remaining in the development budget are largely those that are necessary for achieving the PRSP's poverty reduction objectives. For purposes of funding, these have been ranked further into P1, P2 and P3 in terms of their importance for poverty reduction. The P1 projects now account for 73% of the planned MTEF expenditures, up from 59% in FY02/03 (Table 6); and these are assured of full funding. As noted, P2 and P3 projects/programs will get funded only after releases are made to P1
s. These are also possible candidates for deletion in the future.

16
Table 6: Priority Classification in the MTEF, FY02/03-FY04/05
FY02/03 FY03/04 FY04/05 Item No. of
Projects Amount
(Rs. Billion)
% of Dev.
Budget
Allocation per
Project (Rs.
Million)
No. of Projects
Amount (Rs.
Billion)
% of Dev.
Budget
Allocation per
Project (Rs.
Million)
No. of Projects
Amount (Rs.
Billion)
% of Dev.
Budget
Allocation per
Project (Rs.
Million) Priority One
186 22.82 59 122.7 206 30.34 73 147.3 250 35.88 76 143.5
Priority Two
131 12.76 33 97.4 164 9.75 23 59.5 155 10.06 21 64.9
Priority Three
117 3.09 8 26.5 73 1.75 4 24.1 49 1.26 3 25.7
Total 434 38.68 100 89.1 443 41.84 100 94.5 454 47.20 100 104.0 Source: MTEF. E. Predictability of Funding 35. The MTEF has provided a degree of consistency and predictability in resource allocations and availability, enabling the line ministries to undertake forward planning of their activities on a medium term basis. This can be seen at two levels: (i) at the aggregate and sector levels (see below), and (ii) funding for prioritized activities. As Table 7 (Development Budget projections in successive MTEFs) below indicates, the projections for total development expenditures in the successive MTEFs have fallen within a narrow range, (though there is some question about MTEF 3 target for FY04/05). Thus, the overall sectoral resource envelopes for the line ministries have not been subject to erratic fluctuations; and for those sectors and sub-sectors which are PRSP priorities, the allocations have been reasonably predictable. Line ministries are now fully aware that, if they do not take the MTEF seriously and do not prioritize and justify their funding demands on that basis, they are unlikely to get funding as in the past. Conversely, those line ministries which can develop sector programs to deliver PRSP goals and objectives are now able to secure even substantially increased funding from the Government and external donors. Education and Health are two good examples. Both have been able to develop sector-wide approaches (SWAPs) recently and secure substantially increased medium term commitments from external donors---$159 million for Education and $104 million for Health---, which will allow them to implement and expand their programs in a predictable manner for the next few years.
Table 7: Development Budget Projections in Successive MTEFs
(In billion Rupees)
Item FY02/03 FY03/04 FY04/05 FY05/06 Revenue 56.1 60.2 70.3 79.5 Dev. Exp. MTEF 1 38.7 43.1 49.1 -
MTEF 2 - 41.8 44.5 50.5 MTEF 3 - - 47.2 52.9
Sources: Budget Documents; MTEF.s 36. At the individual program/activity level, funding predictability has improved significantly for priority activities. As Table 8 indicates, about 70-75% of activities in the development budget are now classified as P1
s; and their share in actual expenditures has closely matched their share of budget allocations in the last two years. (In FY02/03, their share of actual expenditures—69%—was slightly less than their allocation share—71%. But, this was due to the implementation shortfalls of the Melamchi and Marsiyangdi
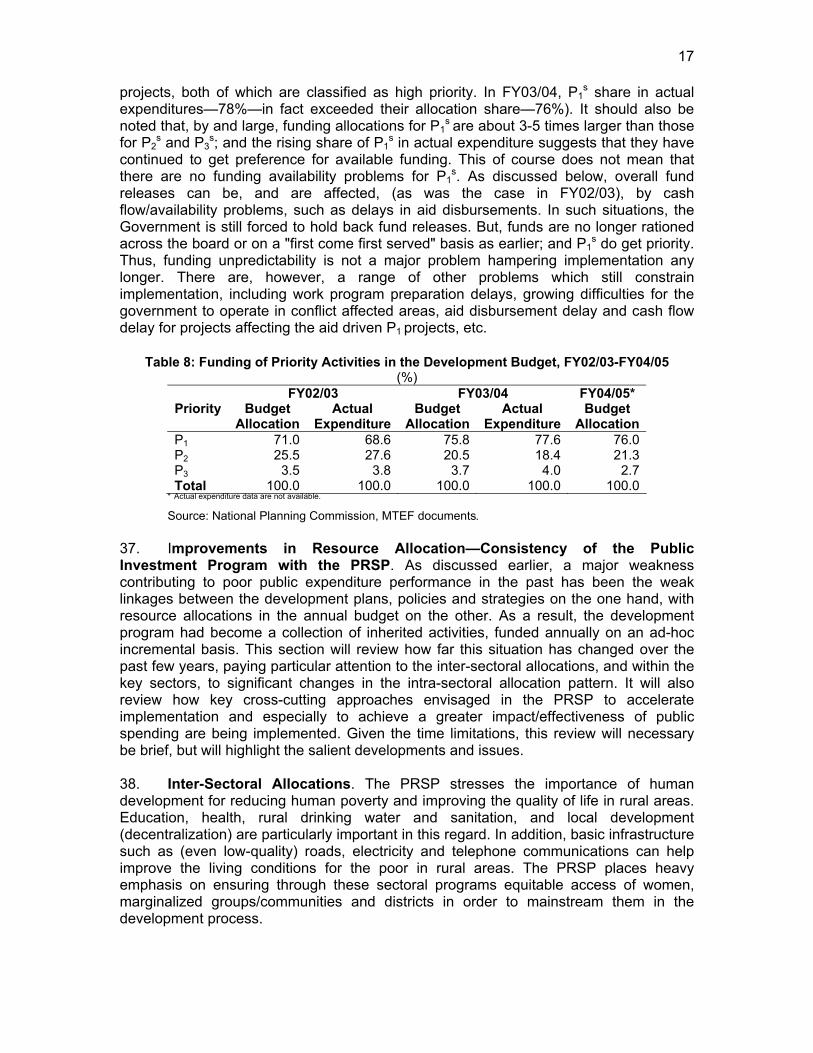
17
projects, both of which are classified as high priority. In FY03/04, P1s share in actual
expenditures—78%—in fact exceeded their allocation share—76%). It should also be noted that, by and large, funding allocations for P1
s are about 3-5 times larger than those for P2
s and P3s; and the rising share of P1
s in actual expenditure suggests that they have continued to get preference for available funding. This of course does not mean that there are no funding availability problems for P1
s. As discussed below, overall fund releases can be, and are affected, (as was the case in FY02/03), by cash flow/availability problems, such as delays in aid disbursements. In such situations, the Government is still forced to hold back fund releases. But, funds are no longer rationed across the board or on a "first come first served" basis as earlier; and P1
s do get priority. Thus, funding unpredictability is not a major problem hampering implementation any longer. There are, however, a range of other problems which still constrain implementation, including work program preparation delays, growing difficulties for the government to operate in conflict affected areas, aid disbursement delay and cash flow delay for projects affecting the aid driven P1 projects, etc.
Table 8: Funding of Priority Activities in the Development Budget, FY02/03-FY04/05 (%)
FY02/03 FY03/04 FY04/05* Priority Budget
Allocation Actual
ExpenditureBudget
AllocationActual
ExpenditureBudget
Allocation P1 71.0 68.6 75.8 77.6 76.0 P2 25.5 27.6 20.5 18.4 21.3 P3 3.5 3.8 3.7 4.0 2.7 Total 100.0 100.0 100.0 100.0 100.0
* Actual expenditure data are not available. Source: National Planning Commission, MTEF documents.
37. Improvements in Resource Allocation—Consistency of the Public Investment Program with the PRSP. As discussed earlier, a major weakness contributing to poor public expenditure performance in the past has been the weak linkages between the development plans, policies and strategies on the one hand, with resource allocations in the annual budget on the other. As a result, the development program had become a collection of inherited activities, funded annually on an ad-hoc incremental basis. This section will review how far this situation has changed over the past few years, paying particular attention to the inter-sectoral allocations, and within the key sectors, to significant changes in the intra-sectoral allocation pattern. It will also review how key cross-cutting approaches envisaged in the PRSP to accelerate implementation and especially to achieve a greater impact/effectiveness of public spending are being implemented. Given the time limitations, this review will necessary be brief, but will highlight the salient developments and issues. 38. Inter-Sectoral Allocations. The PRSP stresses the importance of human development for reducing human poverty and improving the quality of life in rural areas. Education, health, rural drinking water and sanitation, and local development (decentralization) are particularly important in this regard. In addition, basic infrastructure such as (even low-quality) roads, electricity and telephone communications can help improve the living conditions for the poor in rural areas. The PRSP places heavy emphasis on ensuring through these sectoral programs equitable access of women, marginalized groups/communities and districts in order to mainstream them in the development process.

18
39. Government efforts to prioritize and realign programs and activities in line with PRSP goals and strategies have helped to bring about some major shifts in the inter-sectoral composition of the development budget in favor of the main focus areas of the PRSP: (i) The share of the social sectors—education, health, drinking water and local development—has risen from about 35% of actual development expenditure in FY00/01 to 42% in FY02/03; and has further increased to 47% of the development budget allocations in FY04/05 (Table 9). Within this group, the share of the education sector has risen from 7.5% to 13.3%, health from 5.3% to 9.6%, drinking water from 6.5% to 7.6% and local development from 12.5% to13.0% over the period. All four sectors are particularly important for achieving the PRSP's human development and social inclusion goals, and for operationalizing the decentralized, community-managed approaches to improve delivery and efficiency of public services in rural areas. The impressive increases in allocations/expenditures in both education and health also reflect the fact that the recent fiscal reforms have provided a major incentive for the more dynamic10 sectors to adopt sector-wide programs (SWAPS), with substantially increased support from external donors. (ii) To make room for these large increases, the allocation/expenditure shares of virtually all other sectors (except for the communications sector) have been reduced, notably power, (where the completion of the Kaligandaki A project as well as delays in the implementation of the Marsyangdi hydro power project have slowed down
Table 9: Composition of Development Expenditure, FY99/00-FY04/05
(Rs Billion)
Item FY99/00 FY00/01 FY01/02 FY02/03 FY03/04 Budget
FY04/05Budget
Social Services 12.41 12.87 11.53 12.19 17.58 22.38 Education 2.57 2.78 2.76 2.73 4.34 6.26 Health 2.13 1.97 1.88 1.62 3.03 4.51 Drinking Water 2.42 2.41 1.75 2.01 3.46 3.57 Local Development 4.14 4.63 4.16 5.27 5.40 6.14 Other Social Services 1.15 1.08 1.00 0.56 1.36 1.89 Economic Services 8.13 8.70 8.27 6.24 10.17 10.42 Agriculture 2.09 2.33 2.56 1.83 2.20 2.53 Irrigation 3.04 3.95 3.14 2.14 2.70 3.10 Forestry 0.52 0.48 0.63 0.62 0.63 0.67 Other Economic Services 2.48 1.94 1.93 1.65 4.65 4.12 Infrastructure 10.52 12.41 9.18 9.35 13.16 13.35 Roads/Transportation 4.70 5.35 4.52 3.73 5.39 5.66 Communication 0.28 0.24 0.27 1.72 0.85 1.34 Electricity (power) 5.54 6.81 4.40 3.90 6.92 6.35
Others 0.69 3.08 2.50 1.25 0.93 1.05 Total Development Expenditures 31.75 37.07 31.48 29.03 41.85 47.2 Percentage Share (%)
10 In the past, health has been one of the weaker sectors in terms of implementation capacity, fund
utilization and efficiency/effectiveness of public spending. But, recent sector initiatives in terms of forward planning and refocusing the sector program are promising.

19
Item FY99/00 FY00/01 FY01/02 FY02/03 FY03/04 Budget
FY04/05Budget
Social Services 39.08 34.73 36.62 41.98 42.01 47.42 Education 8.11 7.51 8.75 9.40 10.36 13.26 Health 6.70 5.32 5.96 5.58 7.23 9.56 Drinking Water 7.63 6.49 5.55 6.93 8.26 7.56 Local Development 13.03 12.48 13.20 18.14 12.90 13.01 Other Social Services 3.61 2.92 3.16 1.93 3.25 4.00 Economic Services 25.62 23.48 26.26 21.50 24.31 22.08 Agriculture 6.58 6.28 8.14 6.31 5.25 5.36 Irrigation 9.59 10.67 9.98 7.36 6.44 6.57 Forestry 1.63 1.29 2.00 2.15 1.50 1.42 Other Economic Services 7.81 5.23 6.14 5.68 11.12 8.73 Infrastructure 33.12 33.49 29.17 32.20 31.45 28.28 Roads/Transportation 14.79 14.45 14.35 12.83 12.89 11.99 Communication 0.89 0.66 0.86 5.93 2.03 2.84 Electricity (power) 17.44 18.38 13.96 13.44 16.54 13.45 Others 2.19 8.31 7.94 4.32 2.22 2.22 Total 100.00 100.00 100.00 100.00 100.00 100.00 Memo Item: Pro-poor Spending (% of total) 32.80 34.00 36.70 40.40 42.40 n.a.
Source: Budget documents, MTEF. public investment in generation). (iii) The share of transport, also critical for improving rural access, has been held reasonably stable. (iv) But, the expenditure/allocation shares of irrigation and agriculture have fallen, though they are critical for promoting broad-based income and employment growth in rural areas. As discussed below, these are partly the result of policy-induced changes within the sectors, as well as their inability to develop and effectively implement integrated programs to achieve sectoral and PRSP goals (see below). 40. Intra-Sectoral Allocations. A major problem has been the disconnect between the development plans on the one hand and sectoral programs and activities on the other. As discussed in the 2000 PER, there were considerable misallocations of resources within key sectors. The MTEF and its prioritization process have helped to considerably reduce these distortions, align sectoral activities more in line with the overall thrust of the Tenth Plan/PRSP, and improve the internal consistency of sectoral programs. While there is more to do at the sectoral level in further improving the prioritization and better aligning sectoral activities with sector objectives and expected outcomes, the progress that has been achieved so far is significant. The improvements in the major sectors in this regard as well as shortcomings are discussed briefly in Annex 2. F. Reforms in Budget Procedures 41. Changes in existing fund release procedures were an important element of the MTEF reforms introduced in July 2003. Previously, the Government's fund release procedures did not distinguish adequately between development priorities and other activities in releasing funds to them. Although a core program did exist, and priority was given to those in the core program at the beginning of the fiscal year, (core

20
projects/activities received initial releases up to 4 months' requirements, while only two months' requirement was released to others), subsequent releases to projects were largely dependant on spending progress. Those who had spent their initial releases were able to get additional releases irrespective of their priority rating. Thus, this system generally preferred quick spenders rather than priorities, and construction oriented sectors such as power and roads generally benefited at the expense of service-delivery oriented sectors such as health and agriculture. 42. To help fund the PRSP priorities, fund release procedures were changed by linking them directly to the MTEF's prioritization process. Thus, (i) all P1 activities were assured funding, while others were to be funded only if additional funds were available. (ii) Fund releases were tied to performance. Work programs had to be approved before the initial fund release was made at the beginning of the fiscal year, while subsequent releases required the submission of financial reports as well as reporting on physical progress achieved (on the basis of intermediate indicators/norms identified in the work programs) and their certification by appropriate authorities in the line ministries and agencies. Initially, these procedures wee limited to P1 activities, but they were subsequently extended to other activities and also to district and local levels, where the District Treasury and Controller Offices (DTCOs) were made responsible for the release of funds on the basis of monthly expenditure reports and trimesterly progress reports. The Government's Financial Administration Rules were changed in FY02/03 in order to institutionalize these changes. 43. These changes have clearly helped to improve the fund release process for priority development activities. Fund releases are now directly linked to development priorities. In practice, as evident from Table 8 above, the Finance Ministry and its agencies have strictly adhered to the priority classification in releasing funds over the past two years; (actual expenditures in the last two years have corresponded very closely to the priority classification of development activities). This is a major change from the previous practice under which any project would receive funding, (irrespective of their economic merits/justification), so long as they had a budget allocation, they could spend quickly, and could bring political clout and influence on their behalf. As a result, cash management by the Government has also become more rational (see para. 37). Moreover, the new process has strengthened the hands of the FCGO in enforcing reporting requirements. Work programs now have to be prepared by spending units as a pre-condition for the initial fund release, and they have to provide periodic reports to obtain subsequent releases. However, the efforts to link fund releases to performance—to physical/implementation progress11—has a long way to go. Although spending units now submit trimesterly reports on physical progress (which are certified by the line ministries/agencies), there is no capacity for verification of the accuracy of these reports (even on a sample basis) in the FCGO, who are responsible for fund releases. However, FCGO have conducted Public Expenditure Tracking Surveys (PETS) for some sectors and examined the fiduciary risk in those sectors. This is an area which needs to be strengthened, as discussed in para. 139 below.
11 Under the new arrangements, funds will be released immediately if physical achievement/progress is 80%
or more; releases will be subject to review and agreement on further action if progress is between 50% and 80%; and releases will be stopped if progress is below 50%.

21
G. Immediate Action Plan (IAP) 44. As discussed above, the adoption of a Medium Term Expenditure Framework to help implement the Tenth Plan/PRSP was a major achievement by the Government. In addition, the Government also adopted at the same time an Immediate Action Plan (IAP) to translate key policy/strategy initiatives envisaged in the PRSP into concrete actions. The relationship between these key instruments is clearly stated in the Government's Reform Agenda paper (presented to the Nepal Development Forum meeting in May 2004), as quoted below. 45. "From the perspective of the poverty reduction strategy and the structural reform agenda, the three documents should be viewed as an integrated package. The Tenth Plan/PRSP provides the overall vision of the Government to reduce poverty, together with broad strategies and policy directions within a 5-year time frame. The MTEF prioritizes the key activities of the PRSP within a three-year framework, to ensure that they are funded through the annual budget. Thus, the MTEF is the bridge between the PRSP and the annual budget. The IAP, prepared in parallel, prioritizes, key policy interventions and actions to help accelerate the implementation of MTEF/PRSP within a one-year timeframe. Taken together, the three instruments constitute a new and comprehensive approach to implementing poverty reduction/development efforts in Nepal. Indeed, Nepal is the only country in the South Asia region so far with an operational PRSP, MTEF and IAP reinforcing each other. 46. The first IAP for the FY02/03 focused on three main areas, which had been singled out for immediate attention by the NDF: (a) expenditure prioritization (so that key pro-poor and growth-accelerating government expenditures are ring-fenced and are not affected by resource vulnerability), (b) implementation (of new policy initiatives in primary education, primary healthcare, agriculture extension and small infrastructure to improve quality of service delivery at the local level), and (c) accountability measures (to increase accountability for and transparency of public spending and help develop and implement an anti-corruption strategy). The second IAP for FY03/04 closely followed the PRSP's four-pillar format. In addition to the PRSP's four-pillar strategic approach, the IAPs for the last two years also included traditional, structural reform measures; expenditure management; tax, public enterprise and financial sector reforms; measures to improve competitiveness of the private sector; and promote private sector involvement in infrastructure development, among others, to help implement its private-sector led growth and development strategy".12 H. Monitoring and Evaluation 47. In the past, Nepal had some of the key elements needed for monitoring, but these fell considerably short of an effective monitoring system. Moreover, they have not been working well for a number of years. For example, although Ministries/agencies were expected to prepare work programs as the basis for monitoring their implementation progress, these were not often prepared on time. Institutional arrangements for periodic review of implementation progress existed—at the ministry level by Ministerial Development Action Committees (MDAC) every 2 months, and at the 12 "The Reform Agenda—Overview of the Past Performance and Proposals for the Future"; Government of
Nepal, May 2004.

22
Prime Ministerial level by the National Development Action Committee (NDAC) every trimester; but these met infrequently and had gradually fallen into disuse. Annual internal reviews of ministry/agency expenditure reports by the FCGO and external reviews by the Office of the Auditor General (OAG) were carried out, as well as oversight by the Public Accounts Committee and the Parliament (which no longer exist now), but there was little timely follow-up/corrective action. Anti-corruption agencies/mechanisms, which existed, did little to check misuse and leakages of resources. 48. In the past 2-3 years, there have been significant reforms; and much has been done to address these deficiencies. The Government's recent Progress Report on Poverty Reduction,13 summarizes these as follows: "(i) As discussed, fund releases for all activities (at both central and local levels) have been linked to PRSP priorities and performance. Trimesterly releases are contingent on the satisfactory achievement of work plans and agreed intermediate indicators/outputs, based on trimesterly reporting and certification by designated authorities. (ii) Internal capacity for monitoring at key levels—FCGO, NPC, line ministries, DDC levels etc.—are being strengthened. Monitoring and Evaluation Division of the NPC has been substantially strengthened; and within it, a separate unit for poverty monitoring (as distinct from regular project/program monitoring) has been set up; and planning units in the line ministries (which are also closely involved in the preparation of sectoral MTEF's and expenditure prioritization) have been strengthened. (iii) The ministry/national level oversight has been strengthened. The Ministerial Development Action Committees (MDACs) and the National Development Action Committee (at the Prime Ministerial level) have been reactivated and have been meeting regularly. (iv) An overall Poverty Monitoring and Analysis System (PMAS) has been developed, with technical assistance from development partners. Its implementation is expected to help develop an effective management information system (MIS) to help monitor both short term progress as well as systematic evaluation of the impact of poverty reduction efforts and their outcomes. (v) To ensure greater transparency and accountability, a system of making budget allocations and expenditure reports available to the public has been started. (Expenditure reporting at the national/ministry levels is now available on websites). Similarly, an important start has been made in displaying budget allocations, work programs and actual expenditures at most DDCs and VDCs. (vi) An expenditure tracking survey for education sector has already been completed by FCGO, and two others are being undertaken; facilities mapping has been completed in health and education, a NLSS has been completed and its results are being processed; the NLSS together with the Census data, will enable the completion of detailed poverty mapping by the NPC." And, as discussed in paras. 59–61 below, a strong anti-corruption program has been successfully launched and is being implemented. 49. These actions have helped to significantly improve financial monitoring of development activities in Nepal. But, there are a number of areas where much more needs to be done to improve efficiency and accountability of public spending. These are discussed in detail in Chapter 6, but are briefly outlined below: (i) Present capacity for monitoring physical/implementation progress (at FCGO, DTCOs, NPC, line ministries and local levels) is inadequate. This is the result of both inadequate technical skills and human resource capacity at key points, as well as the lack of clear linkages between outputs/intermediate targets, work programs and budget allocations of implementing 13 See "Progress Report on Poverty Reduction", National Planning Commission, May 2004, pp. 46–47.

23
agencies, and insufficient coordination between various line agencies. Efforts have been recently initiated to address this deficiency by developing Business Plans for key line ministries, but this is still work-in-progress; (ii) A PMAS has been introduced, but to make it effective and fully operational, considerable donor support---technical and financial resources, as well as harmonization of ongoing monitoring/survey activities of donors themselves to support the national effort---will be required; (iii) Ensuring greater accountability at local levels, (as implementation of previously centrally run programs are increasingly transferred to local levels), through better financial reporting, supervision and quality control mechanisms, remains a challenge, particularly in the absence of elected local governments. Although the government is now relying increasingly on community management and local involvement to ensure better implementation and accountability in the present political context, more will need to be done to reestablish more conventional financial and accountability controls over time; (iv) Finally, a broad range of oversight institutions are either non-functional or are not performing satisfactorily as per their mandates. These need to be revitalized, or alternative arrangements will need to be considered. (Chapter 6). I. Auditing and Oversight 50. This is one of the critical areas identified in the Country Financial Accountability Assessment (CFAA) for improving accountability and transparency of public spending. However, while there have been significant efforts to improve the institutional capacity of the Office of the Auditor General, Nepal appears to have significantly slipped back in the areas of transparency and oversight, largely due to political developments within the country. 51. Until recently, Nepal had a good institutional framework for auditing and oversight, although in actual functioning, its effectiveness continues to be constrained by the internal political environment. The Office of the Auditor General—an independent constitutional body—has performed well in carrying out its statutory external audit functions. The OAG’s annual report provided the basis for parliamentary scrutiny of expenditure management, particularly by the Public Accounts Committee. While the results of such scrutiny had been somewhat mixed, (corrective and follow-up actions were not always taken by the line ministries/agencies and/or auditees), these institutions helped to enforce a degree of accountability. The CFAA's Action Plan which was endorsed by the Government in 2002, aimed at further strengthening the OAG, improving auditing standards, and increasing transparency through public disclosure of audit reports and follow up actions. Similarly, it also aimed at improving the institutional capacity of the Public Accounts Committee for oversight over public expenditure management. 52. In the case of OAG, its institutional development program is currently under implementation, with IDF grant assistance; and is progressing satisfactorily. As part of this program, audit guidelines are being revised in accordance with international (INTOSAI) standards; draft guidelines on Revenue, Procurement and Project Financial Statements have already been prepared and discussed. (ii) As part of the same initiative, a twinning arrangement with the National Audit Department (NAD) of Malaysia has been established, under which field visits to NAD by senior staff from OAG have already been arranged for on-the-job training. It is expected to help build a core team of trainers within OAG, who in turn are expected to train about 200 OAG staff in implementing the new audit guidelines; (iii) Following up on the other recommendations

24
of the CFAA, independent Auditing and Accounting Boards have been established last year; several accounting and auditing standards have already been published and others are in the process of being finalized. This is a significant achievement within a relatively short period of time; and the challenge now is to enforce the application of these standards, for which continued training and follow-up actions will be needed. (iv) As discussed below, a number of major improvements are under way in the related area of procurement. (v) However, one major area where progress has fallen short is transparency and disclosure. The OAG’s Annual Reports for the past 3 years, viz. 2001, 2002 and 2003, have been submitted to His Majesty the King; but they have not been made public so far, and therefore no actions have been taken to enforce their recommendations regarding corrective actions. Although the Chief Secretary has been following up with the line ministry Secretaries to take necessary actions on the irregularities observed by the Auditor General, the AG’s findings as well as the actions taken are not publicly disclosed now. This is a major lacuna in the accountability structure, which needs to be urgently addressed. To ensure greater transparency, all of OAG’s pending annual reports should be put on its website; but this will require the King's approval, or a decision by the Supreme Court, which is awaited, on a legal motion requesting such publication. In the case of the planned institutional development of the Public Accounts Committee, there has not been any progress. With the dissolution of the Parliament 2 years ago, its oversight function, and the Public Accounts Committee itself, have disappeared. J. Procurement Reform 53. Along with improvements in accounting and auditing, expenditure reporting and transparency requirements, the major recommendations of the CFAA to strengthen public financial management include procurement reform. There are still several problems in this area, including lack of clear and consistent guidelines, observance of existing procedures, differences between national and donor practices and guidelines, political interference in the procurement process and lack of specialized skills in the government agencies which handle procurement matters. These in turn have contributed to lack of transparency and frequent delays in and disputes about contracts, implementation delays, and corruption and leakages. 54. Recent efforts to address these problems have been along two lines: (a) Attempts to revise civil service rules and guidelines in order to clearly define the roles and responsibilities of civil servants and those of the political leadership (such as Ministers) in order to insulate the former from undue interference and prevent the usurpation of their functions and decision-making by the latter. Although legislation has been drafted to this end and submitted to the Cabinet recently, it remains to be seen whether it will be approved any time soon. (b) Implementation of the recommendations of the Country Procurement Assessment Review (CPAR) and the CFAA regarding procurement maters. Progress in regard to (b) has been significant, as elaborated below. 55. National procurement practices, guidelines and laws have been reviewed; and a new procurement law is in the final stages of discussion within the Government. The new law, prepared by a team from the International Law Institute in close collaboration with the FCGO, is modeled on international best practices and adapted to Nepal's requirements; and seeks to establish a consistent legal framework to be followed by all Nepali practitioners. The comments of external development partners, especially the Asian Development Bank and the World Bank---the two largest multilateral partners---

25
have been incorporated; and a final round of consultations with major stakeholders (including government agencies, the private sector, contractors’ association, NGOs, and. external development partners) took place in January. The new law is expected to be finalized in July 2005; and once approved, it is expected to be the basis for all procurement decisions, thereby eliminating a variety of problems and delays associated with existing multiple government/donor practices. A number of multilateral and bilateral donors have already indicated that they would adopt the new procurement framework. Thus, donor harmonization, at least among the major donors, seems to be well advanced in this area. Furthermore, Donor Harmonized Standard Bidding Documents (DHSBDs) are currently being prepared by a task force under FCGO and other relevant ministries. 56. Training of government staff on the new law and procedures has been launched in January, with financial and technical support from the World Bank, (under a Public Procurement Reform Project). 10 out of 30 staff that were trained in Kathmandu have been selected for the “Advanced trainer’s training course.” Initially, in-house training capacity is to be created in the Staff College of Nepal by training 30 trainers; and training has been expanded to cover 210 staff from government departments and agencies over the next 18 months. This will help create a specialized cadre of accredited procurement staff in the government who will be responsible for all procurement work, in place of generalists who now carry out such functions. 57. These reforms will help to significantly improve the capacity for procurement functions within the Government. But, how well they will work depends on the political environment---whether or not the legal changes proposed above will be approved, and in the continued absence of an elected parliament, whether due processes will be followed, and whether transparency requirements will be observed. It will also depend on the priority which the government will give to this initiative by providing adequate budget allocation to NASC to carry out the training, as well as continued technical assistance for it from the donors. K. Anti-Corruption Reforms 58. One major area where effective actions can contribute significantly to improving the efficiency of public spending is controlling corruption and leakages. As noted earlier, although institutional mechanisms for controlling corruption existed, these were not operative. However, the Government has taken a numbers of steps to combat corruption in the past two years, with considerable success: (i) Important legislation enacted in 2002, (including the Impeachment Bill, the Commission for Investigation of Abuse of Authority (CIAA) Second Amendment Bill, the Corruption Control Bill and the Special Court Bill), has clarified the procedures for prosecuting politicians, government officials and the heads of constitutional bodies. They have empowered the CIAA (the only constitutionally independent anti-corruption body in South Asia) to initiate cases against all public officials, including the Prime Minister, the Cabinet and politicians, as well as to take action to prevent corruption, and instruct government departments and agencies to take disciplinary action against staff. (ii) A special court has been set up to look into corruption cases and dispose of them expeditiously. (iii) In April 2002, the Government also established a high level Property Investigation Judicial Commission to examine the property of politicians and bureaucrats who have held positions of authority since 1990. The Commission's findings have been turned over to the CIAA for action. (iv) The CIAA's capacity and resources have been strengthened. It has set up units in 10 districts on a

26
pilot basis, and intends to set up regional offices in all five development regions. (v) In addition, to coordinate the anti-corruption efforts within the government ministries and departments, a National Vigilance Center (NVC) has been established in late 2002 under the Office of the Prime Minister and Council of Ministers. The Center has been entrusted with a variety of tasks, such as making vigilance inquiries; monitoring the submission of property and income statements; conducting technical audits and surprise inspections (for example, in such area as public works); and public awareness building. (vi) To provide impetus to the anti-corruption drive, an anti-corruption strategy, with clearly defined activities, responsible agencies, time frame and co-ordination and follow up mechanisms was formulated in late 2003. Its implementation is being supervised and monitored by the Chief Secretary. (vii) A reform program to restructure and strengthen the judiciary system in order to reduce corruption, ensure greater transparency and expedite the judicial process is near finalization. 59. These initiatives have enabled CIAA to take action against several politicians (including three ex-ministers) and senior officials who have been implicated of corruption. The number of cases filed by CIAA against officials and politicians has risen from 26 in FY00/01 to 61 in FY01/02 and to 147 in FY02/03. As importantly, CIAA has been able to secure convictions in a majority of cases that have been adjudicated so far. Of the 55 cases that have been decided by Special Court in 2003, CIAA was successful in 43, and partially successful in four others---an overall success rate of 85 percent. This has considerably increased CIAA's credibility, judging by the number of complains that have been received from the public. Such complains have nearly doubled from around 2000 in FY00/01 to 3687 in 02/03. 60. The anti-corruption drive has been one of the highlights in Nepal's reform agenda. As part of anti-corruption drive, the Government established the Royal Commission for Corruption Control and tasked to investigate cases of corruption after 1990, which includes actions against several ex-Ministers including former Prime Minister and senior bureaucrats. It is too early to say whether these efforts have helped to significantly reduce corruption; but there is little doubt that they have had a cautionary impact in moderating the culture of impunity which prevailed earlier. Nevertheless, considerable work remains for improving the capacity and resources of anti-corruption institutions. There is also some danger that, in the current climate of conflict and political instability, the implementation of the anti-corruption program may slow down (see below). L. Civil Service Reforms 61. Civil service reforms are in important aspect of recent efforts to improve delivery of public services and increase the efficiency of public spending. Such reforms, supported by donor assistance, have been implemented for some time. Although the size of Nepal's civil service (around 80,000 in the civil service as such, i.e. excluding army, police and teachers), on a per capita basis, is relatively small, (it is only about one-third of Sri Lanka's on a per capita basis), it suffers from a number of weaknesses: inappropriate skill mix, heavy wage compression, low levels of pay and productivity, excessive political interference, among others. The reform program aims at (i) streamlining and "right sizing" the government; and (ii) making the civil service efficient, accountable and transparent, so as to strengthen its capacity for service delivery and to combat corruption.

27
62. Recent efforts at "right sizing" the civil service has focused on reducing about 7500 positions by December 2003. This has been largely achieved, (7000 were eliminated). To address systemic problems, several steps have been taken: (i) A partial decompression of the salary structure was undertaken 3 years ago; but the compression ratio (defined as the ratio of highest to lowest pay grades) is still low (3.3 in Nepal, compared with around 7 in Sri Lanka and 10 in Bangladesh). (ii) A personal Information System has been developed by the Ministry of General Administration (MOGA), to provide accurate information on the payroll system to create a comprehensive human resource data-base (for tracking posts, vacancies transfers, salary and pension liabilities, etc). (iii) Efforts are under way to standardize job descriptions, performance evaluation and promotion criteria. (iv) A governance Road Map has been prepared by MOGA, which will address, among others, efficiency and motivation issues in the civil service. MOGA's road map also includes steps to ensure greater representation of women and disadvantaged groups. (v) Change units (to steer the sectoral governance reform) have been established in several ministries, (e.g. Education, Health, Agriculture, MOGA, and Finance), charged with advancing reforms within their competence. (vi) To reduce political interference in the civil service, a draft governance act which seeks to establish an appropriate division of responsibilities between political and administrative officials has been submitted to the Cabinet some time ago, but it is still to be approved. (vii) A service contracting ordinance, (to contract out to the private sector duties performed by lower level employees, such as office cleaners, messengers, drivers etc.), was passed in 2003, and is being implemented. It is expected to reduce lower grade staff by about 18,000 over three years. 63. Notwithstanding these achievements, overall progress in civil service reforms has been slow. Changing the motivation and service orientation of the civil service remains a challenge, particularly in an environment where the functioning of the bureaucracy has been seriously constrained by the conflict; and it appears that people at large do not see the changes so far affecting them positively. The two biggest challenges for further reform are: (i) Insulating the civil service from political interference, so that it can function better within its present mandate; and (ii) Integrating future reforms with the plans now being prepared to create a Local Government Service Authority (LGSA). When the latter is created, 25,000-30,000 civil servants may have to be transferred to the LGSA; and the size, scope and functions of the civil service will need to restructured accordingly (see below). M. Performance of Public Enterprises (PEs) 64. This has been an area of perennial concern, because of the continuing poor performance of the vast majority of public enterprises in terms of both output/service delivery and their inability to cover even their operating expenses. Public enterprises have been a major drain on the budget, because the government has had to finance every year their operating deficits, capital investment requirements, and even debt servicing liabilities. There is little evidence to suggest that this situation has improved in the last few years. 65. The Government's reform strategy for PEs initially focused mainly on selling off loss-making enterprises to private parties. This approach met with considerable public criticism on the arguments that privatization had not led to any improvement in performance, that many such privatized enterprises have closed down, and that the workers were laid off without adequate compensation. The Government accordingly

28
adopted a multi-pronged strategy towards PE reform. The Government's Reform Agenda paper presented to the Nepal Development Forum in May 2004 summarized the new strategy and the progress achieved up to that time as follows14. "Accordingly, the government is accelerating the pace of privatization. The FY03/04 Budget speech enunciates basically three principles for accelerating the privatization process: (i) high degree of transparency in the process of privatization, (ii) privatization will include not only loss-making enterprises, but also profit making ones, and (iii) maximum use of stock market to offload government holding in the public enterprises thereby increasing public ownership in the assets of enterprises. The government has also approved other modes of disinvestment as alternatives to outright sales of public enterprises: for example, transferring more than 50% of ownership of such enterprises through sales in the stock market, conversion of enterprises into public companies, leasing as well as liquidation. In accordance with this policy: (i) Five enterprises (Nepal Coal Ltd, Hetauda Textile Factory Ltd, Cottage & Handicraft Emporium Ltd, Himal Cement Ltd, and Agricultural Tools Factory) have been closed. Liquidation is legally complicated due to the cumbersome process of asset disposal. Liquidators have been appointed and the liquidation process has reached an advanced stage; (ii) Nepal Coal Ltd.—at the Annual General Meeting, the shareholders decided to liquidate the company on 31 January 2004, and most of the fixed assets have been auctioned. Liquidation is in the final stages; (iii) Cottage and Handicraft Emporuim Ltd.—at the Annual General Meeting, the shareholders decided on 31 January 2003 to liquidate the company. A liquidator was appointed, and employee liability settlement was completed. Activities of the liquidator are in final stages, and selling of assets is ongoing. Assets may be handed over to the Ministry of Industry and Commerce; (iv) Hetauda Texile Ltd.—at the Annual General Meeting, the shareholders decided on 31 January 2003 to liquidate the company. Machinery and equipment was transferred to Industrial Management Committee. A liquidator has been appointed, and activities of the liquidator are in the final stages; (v) Himal Cement Ltd.—the Government instructed the NIDC, a major shareholder of the company to liquidate the company. Employee liability is partly settled, and a labor mediator, with support from DFID, is negotiating with the employees final settlement; (vi) Lumbini Sugar Mill (replacement for Agricultural Tools Factory)—an evaluator was appointed to value the assets of the company. A report has been submitted to the Ministry of Finance in December 2004. The Privatization Committee agreed in February 2005 on the modality of privatization; (vii) The Butwal Power Company has been privatized through share sales; (viii) Bhaktapur Brick Factory—the Government decided to privatize the factory in April 2003 and a Sale Purchase Agreement was signed on 6 January 2004. Consultants were appointed for updating the account to facilitate the final audit. After the completion of the audit, it will go for deregistration; (ix) Birgunj Sugar Factory Ltd.—the Government decided to dissolve the factory on 28 February 2003. A committee was set up to settle the liabilities and ascertain the assets. Almost all the liabilities are settled, except for few remaining employee liabilities. Payment of sugarcane farmers is also completed, and settlement of some employees is pending due to a writ petition in the high court. Rs100 million was released for the payment of employees and third parties. The Government decided on 23 February 2004 to sell the factory and lease the land and building. However, no interest was received and the decision was halted. After the formation of new Government under the chairmanship of High Majesty the King, the Privatization Committee meeting of 21 February 2005 decided to sell the machinery, and the land occupied by the factory; (x) Nepal Rosin and Turpentine—The Government decided to 14 "The Reform Agenda–– Overview of the Past Performance and Proposals for the Future", HMGN, May
2004.

29
start the privatization process on 23 February 2004. Liquidation and sale of assets are being carried out; (xi) An evaluation of the assets and liabilities of Royal Nepal Airlines Corporation (RNAC) is under way, with a view to its transformation into a public company; (xii) Nepal Telecommunications Corporation has recently been converted into a public company and government intends to make its share available to public company by January 2005; (xiii) Shares of Rastriya Beema Sansthan—the state-owned insurance company—will also be offered to the public; (xiv) The Government will continue to evaluate/identify other enterprises which are suitable for divestment; and where privatization is not practical, a policy of ensuring competitive business environment has been adopted for such enterprises. Under this policy, the monopoly of importing petroleum products enjoyed by the Nepal Oil Corporation will be removed by opening up import and distribution of such products to Nepali companies; (xv) Arrears payable to a number of enterprises have been settled, in order to improve their financial position; and (xvi) Performance contracting for top managers of public enterprises is being introduced to improve management for remaining enterprises." 66. Notwithstanding the optimistic tone of the above government statement, the progress achieved so far in implementing the new initiatives is, at best, modest. The liquidation of the above mentioned public enterprises (particularly the disposal of assets) has proved to be cumbersome and time consuming. From 58 public enterprises in 1990, there are now 38 enterprises left in the Government’s list of PEs.. Performance contracts have been initiated in five enterprises, but little progress has been achieved either in introducing professional management, or opening up NOC's petroleum import and distribution monopoly to private operators. In fact, until international oil prices dropped to low forties (dollars per barrel) in December, NOC has been running up a huge operating loss of around Rs. 700 million a month, both because of its internal inefficiencies and because of inadequate adjustments in domestic oil prices and the lack of political will to sustain such adjustments. (Thus, while there have been three price adjustments in the last five months between September 2004 and February 2005, some of the initial increases were rolled back, particularly for Kerosene and LP gas) In addition, in an environment of political change and instability, there has been little enthusiasm among the political leaders for further privatization. Moreover, under existing privatization procedures every important decision must be approved by the Cabinet; and this has been a major source of delay, particularly given the political ambivalence noted above. Hence, there has been no further progress so far this year in privatizing or liquidating public enterprises. 67. Table 10 compares the performance of 38 public enterprises in the last few years with that of a similar number (43) of enterprises in the mid-to-late-nineties. As shown in Table 10, there has been little improvement in the operational results of these enterprises. If at all, the situation has worsened:
(i) According to data published by the Ministry of Finance, 16 out of 38 enterprises made operating profits in FY02/03, (the latest year for which actual reported figures are available), compared to 15 out of 43 in FY97/98. But, it should be noted that these figures are misleading because, according to the accounting practices employed by these enterprises, operational subsides/transfers received by them from the government are counted as part of their revenues. When such subsidies are excluded, the number of public enterprises making genuine operational profits is much smaller.

30
Table 10: Selected Indicators of Financial Performance of Public Enterprises (Rs million)
Item FY94/95 FY97/98 FY02/03 Operating Profit/Loss 1719 1319 -1651
All PEs NTC, NIC 4845 NEA, RBB 2303 3397 -4233 All Others -584 -2078 -2262
Operating Profit ÷ Net Capital (%) 2.9 1.6 -1.1
All PEs NTC, NIC 20.2 NEA, RBB 6.5a 5.5a -5.2 All Others -2.5 -10.7 -5.2
Budgetary Support to PEs 1430 2827 3449
Operating Subsidies 571 988 1206b Share Investments 859 1839 2243b
a: Average for all four enterprises; A separate breakdown for NTC and NIC is not available for these years.
b: Allocated in FY02/03 Budget.
Source: Ministry of Finance. (ii) It should be noted that the bulk of the reported profits were made by two
enterprises—Nepal Telecommunications Corporation (until recently a public monopoly but now transformed into a public company), and the National Insurance Corporation. When these two enterprises are excluded, the other 36 enterprises together made an operating loss of Rs6.5 billion in FY02/03—a much larger loss than what they made five years ago.
(iii) Much of this loss in turn can be attributed to three large enterprises---Nepal oil Corporation (NOC), Nepal Electricity Authority (NEA) and the Rastriya Banijya Bank (RBB), the largest commercial bank in the country. The first two enterprises made profits five years ago, but have become loss-makers since then. All three, being large commercial enterprises, (the first two are also public monopolies), should be making profits, but are not doing so far a variety of reasons. The price of the petroleum products was adjusted three times between September 2004 and February 2005. This change is expected to recover some of the losses of NOC.
(iv) Both NOC and NEA suffer from low levels of internal efficiency---overstaffing, unionization, poor management and accounting practices etc. In the case of NEA, high systems losses, a rapidly rising debt service on past investments, and high costs of power purchases from private generators add to a already high cost structure, which cannot be compensated by tariff adjustments alone, since prevailing electricity tariffs are already substantially higher than in neighboring countries.
(v) NOC, apart from its operational inefficiencies, suffer from two major disadvantages: (i) Government policies which continue to set/subsidize domestic fuel prices below those of neighboring India---with an open border, this directly leads to large scale smuggling of products across the border and shortages within Nepal; and (ii) The lack of timely and adequate adjustments in domestic prices to offset large cost increases associated with the sharp escalation in international oil prices. As a result, NOC's operational losses have increased rapidly in recent years; and it is surviving only by borrowing heavily from the banking system. (These

31
heavy recent losses are not reflected in Table 15 above, which reflects the situation 2 years ago).
(vi) The situation with RBB is somewhat different. RBB, in the late nineties 'reportedly' made operating profits; but in fact it made huge losses, which were concealed by poor accounting and reporting practices of the bank, as it did not properly classify its non-performing loans, which ran into several billion Rupees; and it also did not make adequate provision for such loans. Since then, the bank has been put under external management, its accounting and provisioning practices brought up to international standards, and has begun to make genuine operational profits in the current fiscal year. The reported losses for FY02/03 largely reflect these more recent efforts to improve its accounting and ensure adequate provisioning.
(vii) Operating profits as a percentage of not capital employed appear to have become negative (-1.11%) for all public enterprises in FY02/03. This however, conceals the fact that NTC and NIC made large profits (20.2%) of net capital), while NEA's and NOC's operating losses averaged about –5.2% of net capital employed. For all other (34) enterprises, net operating loss averaged –5.18% of net capital employed, marginally better than in the late nineties, but still a poor result.
(viii) The dependence of public enterprises on the Budget for meeting their operating losses and their investment needs has not improved. Government subsidy allocations to cover operating losses exceeded Rs. 1.2 billion in FY02/03, while "share investments" (an euphemism for capital transfers to cover past losses) amounted to another Rs. 2.2 billion. Virtually all of the PE's investment funding needs (including all of their external borrowing) is funded by the government---to the extent of nearly Rs4.8 billion in FY02/03. In effect, transfers to public enterprises in one form or another totaled over Rs8.0 billion, the equivalent of over 27% of the development budget in FY02/03.
(ix) In terms of accounting and audit performance, there has been some improvement. By June 2004, 24 enterprises had completed their audits up to FY00/02, and a further 6 up to FY00/01. However, Nepal Oil Corporation has not completed its audits for the fiscal years since FY99/00, Royal Nepal Airlines since FY98/99, and the National Insurance Corporation since FY94/95. Consequently, the true financial picture of these enterprises is open to question. Transfer of funds from the National Budget to the public enterprises has been reduced. Table 11 provides a breakdown of these transfers.
Table 11: Total Fund Transfer to PEs from the Government of Nepal
(Rs million) Item Operating/
Transport Subsidy
Capital Subsidy
Share Capital
Total Excluding
Loan
Loan capital
Total
2000/1 268.3 0 1088.8 1357.1 6898.0 8255.1
2001/2 289.5 0 1036 1325.5 4663.3 5988.8 2002/3 241.9 0 319.3 561.2 589.3 1150.5 2003/4 188.9 0 594.8 783.7 1102.4 1886.1 2004/5 (budgeted)
276.4 12.0 135.0 423.4 373.4 796.8
Source: Comptroller General Office

32
F. Conclusion 68. Over the past 2–3 years, Nepal has made considerable progress in addressing the key problems which have hampered public financial management in the past. In particular, the Government has formulated a well-articulated poverty reduction strategy and introduced the key elements of a Medium Term Expenditure Framework, together with an Immediate Action Plan (of key policy changes and implementation actions) to help implement the PRSP. The development program has been prioritized, so that sectoral allocations in the annual Budget are now better aligned with the PRSP, the content and internal consistency of key sectoral programs have been improved, and funding for priority activities have been made more predictable. A comprehensive monitoring framework has been formulated and is being gradually implemented. Important initiatives have also been taken to increase the involvement of local communities in the implementation and management of activities in key areas---such as primary education, health and drinking water; and external assistance to support these activities has increased substantially. Notwithstanding these improvements, much remains to be done to enhance the effectiveness of public spending and improve the delivery of public services to rural communities. In particular, the implementation of development programs is being hampered by the spread of the Maoist conflict, and continuing political instability. The monitoring and evaluation system needs to be strengthened to ensure that pubic spending actually leads to better development results. The fiscal situation remains fragile, given the increased demands for current expenditures and the heavy dependence on external assistance. This makes it even more necessary to sustain reforms in key areas, in order to cope with prospective fiscal problems, to safeguard and reinforce the improvements in development management that have been made so far, and to ensure that poverty reduction efforts can be continued even in an environment of fiscal and political uncertainties. Chapter 6 discusses key actions that will be needed in this context.
CHAPTER 4: TREASURY AND DEBT MANAGEMENT
I. INTRODUCTION 69. Treasury and debt management are important aspects of public financial management in Nepal, as in other countries. They are particularly important in Nepal because, judging by past experience, annual budgets are often over-ambitious and unrealistic; and their implementation, as announced, can create serious borrowing/macroeconomic problems. One of the main lessons to be learned from the Asian Crisis a few years ago and the experience of many developing (particularly HIPC15) countries is also the need for prudent domestic and external debt management. On the positive side, good treasury and debt management can provide important benefits, for example by facilitating better implementation of the budget, ensuring effective use of cash resources by the government, maximizing earnings/returns from cash balances and providing incentives to spending agencies to manage their funds efficiently. This chapter reviews the existing arrangements in Nepal for Treasury and Debt Management, briefly discusses the key problems and issues associated with the current system, and makes some recommendations for their improvement. 15 Highly Indebted Poor Countries. But, Nepal is not one of them.

33
A. Treasury Management
1. Existing Arrangements 70. Under existing arrangements, the Ministry of Finance (MOF) is primarily responsible for financial management—budgeting, accounting, treasury management and domestic and external debt management. In this context, the Financial Procedures Act, 1999 together with the Financial Administration Regulations (FAR) 1998, specifies the responsibilities of the Ministry of Finance, the Financial Comptroller General Office (FCGO), the District Treasury and Comptroller Office (DTCO), other central level agencies, and operating level entities. It prescribes financial procedures relating to collection, disbursement, recording, internal control, checking, internal auditing, independent audit by the Office of the Auditor General (OAG), and the clearing of irregularities. Overall cash and debt management is handled by the MOF through the FCGO. The Financial Procedures Act also designates the Secretary of Finance as the Chief Accounting Officer; and he is accountable for all accounting units in or under his Ministry/Authority; for administering expenditures within the limits of approved budget allocations; regulating the collection of revenues into the Consolidated Fund; maintaining accounts; and submitting overall expenditure statements. The FCGO, an independent department under the MOF, is the central accounting organ of the government and the custodian of the government treasury. The FCGO is responsible for the accounting of all loans, investments and treasury funds, and for carrying out internal audits of all public expenditures. 71. For purposes of budget management, once the budget is approved and allocations are finalized, the Secretary of Finance issues authorizations to spend to the Secretaries of Line Ministries and Heads of Constitutional bodies, who in turn issue authorizations to spend to the respective heads of agencies/spending units under them. The FCGO then releases funds (on the basis of approved budget allocations) to nearly 4,000 paying offices in 75 districts through its district level offices—DTCOss. The FCGO is also responsible for ensuring that accounts are properly maintained; and for the management of accounting personnel and internal audit of all operating entities; for overseeing of all government expenditure against budget, tracking revenue collection and other receipts, and preparing consolidated financial statements; and for ensuring timely repayment of internal and external debts. It consolidates monthly cash flow information of the government and produces reports on time, and upon completion of the financial year, submits for auditing to the OAG the national statement of receipts and expenditures. With respect to the responsibilities for collecting, monitoring and recording of revenues; maintaining records of inventories, expenditures and unsettled irregularities, according to the Fiscal Procedures Act in 1998 and Financial Administration Rules in 1999, these are under the Chief Accounting Officer (Secretary of the line ministry) and any responsible person who is given the authority by the Chief Accounting Officer. 72. Nepal has a cash based accounting system. Although government regulations allow for debtors (for example, outstanding staff advances) and creditors (for example, suppliers not paid until the next fiscal year), the cash basis of accounting does not provide for such items to be recognized in government financial statements. There is also no system for preparing their consolidated financial statements, and for their certification by the Auditor General. Although the existing system has been improved

34
over the years, Nepal is not ready yet to switch over to an accrual accounting system. This may be too ambitious a task, considering the present capacity level. However, there is a plan to study the best accounting system for government transactions on the basis of International Public Sector Accounting Standards (IPSASs) and Generally Accepted Accounting Principles (GAAPs) practices. Given the present institutional and human resource capacity level, the Government is considering a task force for the study of the best international practices of government accounting and recommending an updated roadmap over the medium term for implementation. 73. For purposes of treasury management, Nepal maintains a Consolidated Fund into which, according to Article 74 of the Constitution, all revenues received by the Government (except those of religious endowments), all loans raised on the security of revenues and all payments received in repayment of any loan made under the authority of any Act, must be deposited. Similarly, payments made from the Consolidated Fund are limited specifically to expenditures under an Appropriation Act, monies directly charged to the Fund (such as expenditures of the Royal Family and of Constitutional bodies is called Non-Votable Accounts), and funds required on a Vote of Account (i.e. for advancing funds to agencies/spending units before the Budget/Appropriations Bill is approved), or a Vote of Credit (for example in a national emergency). Thus, all monies received must be reflected in the budget; and they can be spent only if they are included in the budget. In other words, treasury management primarily involves the planning, budgeting and execution of inflows into and outflows from the Consolidated Fund. There are, however, a few exceptions. Some extra-budgetary funds exist, which are not reflected in the budget, (such as substantial technical assistance received from external donors), as well as revenues which go into a growing number of Revolving Funds (such as the Road Maintenance Fund, Heavy Equipment Fund, Health Tax Fund, Alcohol Control Fund etc); and expenditures out of these revolving funds which are not reflected in the Budget. Such off-budget expenditures out of revolving funds are estimated at about 0.4% of GDP annually. 74. Within this framework, the FCGO uses a number of expedients to manage the cash position, some of which have been discussed earlier. The first is the formulation of a cash budget within the overall budget, (the latter also contains significant non-cash elements, such as commodity grants/loans and direct payments from external donors which do not have a direct impact on the government's cash transactions), with identified sources of cash (such as, program loans, budget support etc) which are allocated to various expenditure activities. This cash budget estimate is collected from various sources, updated regularly and monitored closely. The second is the fund-release system, which is managed flexibly as an effective instrument for cash management, as cash availability changes. Thus, even though large budget allocations for particular spending units may have been approved through the annual Appropriation Bill, the actual release of cash to the spending units may be quite different, depending on cash availability and the objectives of the fund release system. Typically in the past, the FCGO and DTCOs released initially one-sixth of the approved allocations to spending units, and subsequent releases/reimbursements were made every month based on the expenditure statements provided by such units. Moreover, depending on cash availability, these subsequent releases were rationed on a "first-come-first-served/spent" basis. But, this system has now changed, as discussed above, with priority being given to P1 activities if cash shortages are expected.
35
75. This system allows the FCGO to maintain effective control of cash management (though it has undesirable effects on budget implementation); and any increases over approved borrowing limits and recourse to overdrafts have to be authorized by the Secretary of Finance. The system works on the basis of imprest account principle, in that funds, which are initially released into thousands of accounts, are replenished only when statements of expenditures are provided. Thus, there is no automaticity in the subsequent release of remaining allocations. Through this expedient, the accumulation of funds in the accounts of spending units is minimized (except for the initial release). Moreover, the system does not allow for the carry over of unspent funds into the next fiscal year. While facilitating control of cash management, this however creates its own problems (see below), particularly through the bunching of expenditures in the last trimester of the fiscal year. As noted, the DTCOs are responsible for providing monthly accounts of the funds released, the FCGO for consolidating them and providing monthly reports, the Nepal Rastra Bank (NRB) and its regional offices for clearing the accounts daily and providing weekly statements, and the FCGO for reconciling its expenditure statements with those of the NRB. 76. It is important to recognize two special factors, which complicate cash management in Nepal,: (i) The first is remoteness/lack of access of some parts of the country which make daily accounts reconciliation and monitoring difficult. Some remote districts still do not have electricity and access to communications, though the situation is improving over time. (ii) The second is Nepal's heavy dependence on external assistance; and the nature and timing of aid disbursements create special challenges (which are discussed below) for cash/treasury management.
2. Problems Associated With the Present System 77. A number of problems can be pointed, relating to the coverage of budget expenditure; those created by geography/distance and lack of communications/technology; aid management; and the seasonality pattern of government revenues and expenditures. These are discussed briefly below. 78. Though not a major problem yet, the growing amount of off-budget expenditures and receipts can undercuts budget discipline. The number and scale of extra-budgetary revolving funds have increased over time; and they are not subject to the same reporting and accountability discipline as other government expenditures. As discussed in Chapter 6, such expenditures should also be brought within the budget. On the receipts side, a large part of technical assistance provided by donors (over $100 million a year, as reflected in donors' reports on their aid disbursements) does not go through the budget. Efforts are beginning only now to bring in such technical assistance into the budget. 79. One of the major consequences of inadequate communications and connectivity (in terms of lack of road access, electricity and office automation/technology) in the past has been the delays in getting expenditure reports from the more remote districts and difficulties in accounts reconciliation on a timely basis for purposes of treasury management. Apart from creating a large float (of released funds, for which expenditure statements were not available in time), this created the potential for carry over of expenditures (incurred, but not reported) into the next fiscal year. Several steps have been taken to address this problem. (i) "Freezing" of expenditures, by issuing instructions to paying offices to stop issuing checks after a cut-off date (for example, two months before the closure of the fiscal year); and (ii) Reducing the validity of the checks

36
progressively from roughly three months after the closure of the fiscal year, to only one month now. While this arrangement created difficulties for budget implementation in the affected districts in the last two months of the fiscal year, the carry over float on "Freeze Accounts" (checks issued, but not yet cleared at the end of the fiscal year) was substantial---as much as 2-3% of total expenditures in the nineties. Since then, further steps have been taken to reduce the freeze accounts. As noted, the validity of check issues is now restricted to only one month; computerization of DTCOs has been speeded up, with 67 out of 75 districts covering over 95% of budget expenditures connected electronically; and the carried over expenditures are charged to the new fiscal year's allocations, thereby reducing the incentives for such carryover. As a result, the "freeze account" carry over balances has now been reduced to below 1 ½% of the estimated FY03/04 expenditures. 80. A second, even larger, problem earlier had been the delays in obtaining reimbursements on a timely basis for expenditures carried out with funds advanced from the treasury accounts. Apart from delays/time lags in getting reimbursements from donors (which tied up the government's limited cash resources for several months), a related problem was that some of the incurred expenditures were not eligible for reimbursement, either because of differences between donors' practices and the government's accounting practices, or because expenditures were misclassified, or were spent on ineligible/inappropriate items. Such disallowed/unreimbursable amounts were quite significant in the nineties, as much as 3-4% of development spending in some years. Recent actions have again helped to address both types of problems. For example, over the past few years, some of the donors have established imprest accounts from which funds could be withdrawn for carrying out the agreed activities without locking up the treasury's own funds. Even more significant, the government's accounting and expenditure reporting framework itself has been improved by developing and adopting a government wide accounting and reporting format; which in turn has enabled major donors to use the government's expenditure reporting and monitoring system for making reimbursements. Thus a new reimbursement release system is in place, which is both faster and more efficient; and the unclaimable amounts (which effectively used up the government's own funds) have declined to negligible levels. 81. Perhaps the most important problem which affects cash management is the nature of external assistance and the timing of cash aid disbursements. This has a direct bearing, on the symmetry of cash inflows into and outflows from the consolidated fund, which is at the very essence of the treasury function. As discussed in Chapter 6, given the rapid erosion of the revenue surplus and the restraints on domestic borrowing, the cash budget is heavily dependent on cash grants and loans, (including debt relief grants, budget support and program support) from donors. Moreover, for purposes of budget management, these funding sources are earmarked for/allocated to designated activities by the government. Any delays in disbursements of these loans and grants therefore directly affect fund releases to those activities, reduce the predictability of funding, which undermines cash management in FCGO, for priority activities and adversely affect overall budget implementation. It is of course possible to cushion the impact such delays through (short term) recourse to overdrafts from the central bank, and by releasing the funds to highest priority activities, rather than on the basis of tying specific activities to external funding sources. 82. A related issue is the symmetry between the Government's own fund flows—i.e. between government revenues and cash expenditures from the Consolidated Fund. As

37
indicated in Table 12, in a way, there is already a high degree of symmetry between revenue inflows and expenditure outflows. Typically, revenue inflow is the slowest in the first quarter, picks up a little in the second trimester, but accelerates sharply, with 42-44% of all revenue coming in the third trimester. The expenditure outflow pattern broadly corresponds to the revenue pattern, with the bulk of the expenditures (42-44% of regular expenditures and 57-61% of development) bunching in the third trimester. This of course puts enormous pressure on treasury management, apart from the fact that such bunching contributes to implementation delays and poor quality of the work that is carried out. Also, the bunching of spending can often lead, given cash management problems, to unanticipated domestic borrowing, as well as deferment of payments/carry over of (incurred) expenditures into the next fiscal year.
Table 12: Government Operation-Cash Budget, FY01/02-FY04/05 (% of Fiscal Year Total)
FY01/02 FY02/03 FY03/04 FY04/05 Item
1st Trimester
2nd Trimester
3rd Trimester
1st Trimester
2nd Trimester
3rd Trimester
1st Trimester
2nd Trimester
3rd Trimester
1st Trimester
Release 32 30 39 31 30 39 30 29 41 26 Total Expenditure
26 28 46 26 27 47 26 27 47 21
Regular 29 29 42 29 27 44 29 28 43 Development 16 27 57 11 28 61 11 28 60
Revenue 27 44 29 25 31 44 26 32 42 24 Source: Ministry of Finance. 83. For purposes of improving budget implementation, it is necessary, as discussed elsewhere, to advance the budget preparation cycle and begin to implement (priority) development activities from the beginning of the fiscal year itself. If this were to be done, however, the traditional expenditure (treasury outflow) pattern will change, with more releases and spending taken place in the first and second trimesters and less bunching in the third trimester. This will of course mean that there will be greater (rather than less) imbalance between revenue flows into, and expenditure outflows/fund releases from, the Consolidated Fund. Therefore, advancing the budget preparation and the expenditure cycles would be possible only if such imbalance could be offset by other means; i.e. if there is greater predictability of (cash) aid financing, and such aid would become available early in the fiscal year; and/or if the government's short term borrowing strategy can be changed, so that it can borrow more (for example, overdrafts from the central bank) early in the fiscal year and reduce such borrowing later in the fiscal year as financing from other sources (revenues and cash aid from external donors) materialize. This of course will be a challenge for the Government, external donors and the IMF. B. Debt Management
1. Introduction/Divergent Perceptions on Indebtedness 84. From a position of relative economic isolation in the sixties (with few economic ties and aid from the outside world), Nepal has become steadily dependant on external aid to finance fiscal and external deficits. As a result, the public debt (including external and domestic) stock has grown rapidly, especially over the past two decades. Thus, the ratio of the stock of total outstanding debt to GDP has risen from around 33% in FY84/85 to 66% in FY94/95, and remained at that level through the end of the decade (Table 12). This rapid rise in indebtedness has given rise to serious concerns at the beginning of this decade among both the Nepali public and other stakeholders that Nepal is heading into a “debt trap”; and given the poor development results (from aid as well as from

38
overall public spending) noted earlier, many had begun to question the usefulness of aid itself, and external borrowing in particular. 85. Reviewing the situation at the beginning of this decade, the World Bank’s 2000 PER concluded that: (i) By conventional standards, (Nepal external debt stock was around 50% of GDP and the ratio of debt service to exports of goods and services around 7-8% at that time), Nepal’s debt ratios are still relatively low; (ii) This was largely because the bulk of Nepal’s external debt was contracted on concessional terms (at around ¾ to 1% p.a.), and its non concessional borrowing is negligible; and the present value of its external debt service (around 118% of exports and 31% of GNP at that time) was not high; (iii) Accordingly, Nepal is a “less indebted developing country”, rather than a Highly Indebted Poor Country (HIPC); and that (iv) Contrary to popular perceptions, Nepal is unlikely to get into debt servicing problems, “if it continued to maintain a prudent stance on short term and commercial borrowing”. The report however counseled the need to monitor the situation closely, since the favorable position noted at the time could change rapidly, particularly if the exchange rate were to depreciate rapidly, government borrowing were to accelerate, or if revenues were to stagnate. 86. These concerns have been shared by ADB missions which visited Nepal in December 2001 and September/October 2002. They noted that domestic borrowing as a share of total government debt has increased significantly from 19% in the 1990s to 27% in FY01/02, the government’s debt service absorbs roughly one third (actually one fourth in that year) of government revenues, the ratio of total debt stock to government revenue is already very high, the sharp downturn in the economy had adversely affected the government’s fiscal position, and that the situation is not likely to be reversed in the near future. Accordingly, the latter mission noted that “it is imperative that public debt be managed efficiently to enable the Government to maximize development impact without undermining the country’s ability to meet its medium and long term obligations”. The report went on to recommend technical assistance to improve the government’s capacity for debt management, which is currently being implemented. Against this background, the following section briefly evaluates recent trends in public indebtedness over the past few years, what has been done so far to improve debt management under the TA project, and key issues/potential problems for the future.
2. The structure of Public Debt and Recent Trends 87. Table 13 below—Public Debt and Key Vulnerability indicators—helps to understand the changing structure of public debt in Nepal and whether the situation has changed for the better or not. A few key points can be made on the basis of the information presented in Table 13:
(i) As noted earlier, public debt as a ratio of GDP rose rapidly from the mid eighties to mid nineties, but has virtually leveled out since then. In fact, after peaking at nearly 70% of GDP in FY01/02, the debt ratio has declined significantly to 64% of GDP by the end of FY03/04. Thus, the concerns noted at the beginning of the decade have not been borne out so far. This is in large part due to absorptive capacity and political constraints which prevented the effective implementation of development programs and slowed down disbursements of committed aid.
(ii) The bulk of the outstanding public debt is foreign debt. The latter grew rapidly through the nineties to 81% of the total debt by FY97/98; but has

39
tapered off since then, as the implementation of the development program and associated foreign aid disbursements slowed down. Conversely, domestic borrowing has increased steadily, particularly in the last few years, (except in FY03/04), as the government tried to compensate for aid shortfalls through recourse to increased domestic borrowing.
(iii) Nepal’s debt service payments have also increased rapidly after FY94/95, almost tripling in the last ten years, in nominal terms. However, the total debt service as a percentage of GDP, still remains manageable—around 3.5% of GDP in FY03/04. This in part reflects the maturing of the structure of foreign debt; the grace periods on loans contracted in the early eighties have expired, and more and more loans are being added each year to the portfolio of external loans that needs to be serviced.
(iv) Interestingly, the debt service on domestic debt (which accounts for only 27% of the total debt) is now larger than the servicing costs of external debt (73% of the total). This is because average interest rates payable on domestic debt are much higher than those charged on foreign borrowings; for example, the current rates payable by the Government on Development Bonds range from 3.0–8.0%, on National Savings Certificates from 6.5-13.0% and on 91day Treasury Bills 1.5%, compared with ¾ to 1.0% paid by the Government on foreign loans from multilateral lenders).
(v) Total debt service as a percentage of government revenue has increased somewhat (from 24 to 27-28%) in the last two years, indicating that the budget has become more vulnerable in terms of its repayment capacity; apart from the rise in nominal debt service payments, this also reflects the stagnation of government revenues, especially in the last few years.
(vi) However, notwithstanding the rise in total debt service payments, service payments on external debt are still very manageable, as evident from key vulnerability indicators. For example, Nepal’s ratio of external debt service to exports of goods and services (including factor incomes, but not foreign grants) is only around 4-5%; and external debt service in relation to gross foreign exchange reserves of the country is only about 6-7%. (It could be argued that exports of goods and services, including factor incomes/remittances from abroad, are a better vulnerability measure for Nepal than exports of goods and non factor services alone, because inflows of remittances have been rising rapidly and they are now a predictable source of external financing of the trade deficit in the balance of payments). Thus, the servicing of external debt is unlikely to be a problem in the near future from a balance of payments perspective; but, it could be a serious problem from a fiscal viewpoint, particularly if revenue growth were to slow down.

40
Table 13: Public Debt and Key Vulnerability Indicators
(Rs billion) Item FY84/85 FY94/95 FY97/98 FY00/01 FY01/02 FY02/03 FY03/04
Total Public Debt 15.23 145.06 199.62 260.45 293.75 308.08 318.91External 9.20 113.00 161.21 200.40 220.13 223.43 232.77Domestic 6.03 32.06 38.41 60.05 73.62 84.65 86.13
Total Debt Service 0.68 6.08 7.68 10.39 12.21 16.18 17.34External 0.19 2.98 4.20 6.20 6.57 7.52 8.52Domestic 0.49 3.10 3.48 4.19 5.64 8.66 8.82
GDP at Producers' Prices 46.58 219.18 300.85 410.79 422.30 454.94 494.88Exports (Goods & NFS) 5.37 n.a. n.a. 99.61 81.49 77.28 88.22Exports (Goods and Servicesa) n.a. n.a. n.a. 141.78 139.00 138.97 154.74Government Revenue 3.92 24.58 32.94 48.89 50.45 56.23 62.27Gross Foreign Ex. Reserves 2.60 43.86 66.11 106.19 107.00 109.31 130.96
Key Ratios (In Percent) Total Debt ÷ GDP 32.7 66.2 66.4 63.4 69.6 67.7 64.4Ext. Debt ÷ Total Debt 60.4 77.9 80.8 77.0 74.9 72.5 73.0Total Debt Service ÷ GDP 1.5 2.8 2.6 2.5 2.9 3.6 3.5Ext. Debt Service÷ Revenue 17.4 24.7 23.3 21.3 24.2 28.8 27.9Ext. Debt Service÷ XGNFS 3.5 n.a. n.a. 6.2 8.1 9.7 9.7Ext. Debt Service÷ XG &Sa n.a. n.a. n.a. 4.4 4.7 5.4 5.5Ext. Debt Service÷ Gross Res. 26.2 6.7 6.4 5.8 6.1 6.9 6.5
XGNFS= Exports of Goods and Non Factor Services. a Exports of goods and services (including factor income but not grants). Source: Economic Survey; Debt Monitoring Unit, Ministry of Finance.
3. Reliability/Coverage of Debt Data 88. While the key indicators suggest a reasonably comfortable position, an important question is whether the coverage of debt data is adequate and whether the estimates accurately portray the country’s indebtedness. Both questions can be answered affirmatively. Unlike many countries in the Asian region, in Nepal the Government is primarily responsible for all external borrowing. The current Central Bank regulations preclude foreign borrowing by the private sector. While there have been some private borrowing in the past, (for example, for the Jyoti Spinning Mills and Gorkhali Rubber), these have been relatively small, and underwritten by the Government. The outstanding amount of such borrowing is quite small, (less than $10 million). Similarly, public enterprises also cannot borrow abroad on their own account. The Government officially borrows on their behalf for their investment needs and onlends to such enterprises, and is also responsible for their external debt servicing. Finally, all short term borrowing, (including any commercial borrowing/trading credits), of the Government itself is closely monitored by the IMF. Such short term debt, including outstanding trade credits and amortizations due the following year, is estimated at about 2.4% of GDP currently by the IMF. All of the above (including publicly guaranteed debt) are included in the public debt estimates shown in Table 13 above, which is therefore comprehensive in coverage. 89. However, there have been concerns in the past about the timeliness and updating of the data. Until recently an effective system for recording and maintaining such data on a regular basis was absent. A debt monitoring system was set up in the Economic Affairs and Policy Analysis Division (EAPAD) of the Ministry of Finance in 1997 with technical assistance from UK’s Department for International Development (DFID). It updated the debt data through 1999, but gradually became dysfunctional thereafter. Several reasons have been attributed for this untimely demise: The system

41
was set up by external and domestic consultants, with little involvement of government staff; hence it was not adequately internalized; it was not user-friendly; the inability to retain trained staff due to frequent staff turnover; lack of coordination among the key government agencies involved, and the lack of demand for the outputs of the debt monitoring system from key officials within the government itself; among others. In the meantime, the responsibility for the debt management function remained diffused and fragmented among three separate government agencies—EAPAD, which is responsible for aid negotiations and securing new commitments of debt, FCGO which is responsible for recording aid disbursements and managing external debt payments, and the Nepal Rastra Bank (NRB) which is responsible for all domestic debt operations on behalf of the Government and for recoding of aid receipts through banking channels. In the absence of clear delineation of responsibilities and lack of coordination among these agencies, the recording of public debt has not been done on a systematic basis in the past. This problem however is being addressed under a new technical assistance project for debt management financed by the Asian Development Bank (see below); and leading to an updating of coverage and recording of debt data.
4. Recent Progress in Improving Debt Management 90. The ADB’s new TA project, which was started in late 2003, seeks to address these problems. Its key objectives include: Enhancing debt monitoring and management capacity within the Government by introducing and upgrading the CS-DRMS to its latest user friendly window version of 2000+ v 1.1; Strengthening the legal, institutional and regulatory framework for debt management by instituting a public debt management law, which among others will define institutional responsibilities; Building institutional capacity and skills through appropriate training and establishing linkages with similar institutions abroad; Developing capacity within the Government for debt analysis and management; Internalizing the new system; and Establishing new mechanisms for disseminating and making more effective use of the outputs of the new system. The project is expected to be completed by the end of 2005. 91. Considerable progress has already been made in implementing the project. Its major achievements to date include: installing more user friendly software (replacing the earlier UNIX based system with a Windows based system for using the Commonwealth Secretariat’s Debt Reporting/Management System); and ensuring greater internalization by primarily using government staff and making sure that all debt recording functions are carried out by them. A cohesive institutional and legal framework has been prepared and is under discussion. A draft debt management law has also been prepared and is being discussed. Public dissemination seminars of the outputs of the new system are being carried out. For enhancing the analytical capability of the institutions under consideration, and a macroeconomic model was also developed with user friendly interface for making forecasts and debt sustainability analysis.
5. Key Problems and Issues 92. The recent initiatives will help considerably to improve the debt management capacity in Nepal over time; but, there are several challenges to be overcome in this regard. For example, ensuring retention of trained staff, improving institutional coordination among key government agencies, creating a demand for the outputs of the debt management unit and creating analytical capacity within the Government will be important challenges. There is also some question whether new institutions need to be created as envisaged under the project, and whether they will be effective.

42 Table 14: Foreign Loan and Debt Servicing
(Rs million) Item FY94/95 FY95/96 FY96/97 FY97/98 FY98/99 FY99/00 FY00/01 FY01/02 FY02/03 FY03/04*
Direct Outstanding Upto Last Year
120555.9
125214.1 150126.8
161813.6
182001.8 193793.8 214821.8 222733.9 238530.6Borrowing 7312.2 9463.9 8963.9 13850.9 10839.5 12362.4 11104.3 10049.5 6192.4 9383.3Repayments 1827.1 1986.6 2101.2 2779.0 3195.3 3679.9 4499.4 4750.1 5496.2 2704.3Interest Payments 1156.2 1306.3 1246.7 1420.8 1548.6 1640.1 1700.7 1816.0 2021.6 1057.5Net Outstanding 112990.0 128033.2 132076.8 161198.7 169457.8 190684.3 200398.7 220121.2 223430.1 245209.6Indirect Outstanding Upto Last Year
12.0 12.3 11.2 10.5 9.3 8.1 6.9 5.7 4.4 3.1
Borrowing 0.0 0.0 0.0 0.0 0.0 0.0 0.0 0.0 0.0 0.0Repayments 1.1 1.1 1.2 1.2 1.2 1.2 1.2 1.3 1.3 1.3Interest Payments 0.3 0.3 0.3 0.2 0.4 0.2 0.1 0.1 0.1 0.1Net Outstanding 10.9 11.2 10.0 9.3 8.1 6.9 5.7 4.4 3.1 1.8Total Foreign Loans Outstanding Upto Last Year
107516.9 120568.2 125225.3 150137.3
161822.9
182009.9 193800.7 214827.5 222738.3 238533.7
Borrowing 7312.2 9463.9 8963.9 13850.9 10839.5 12362.4 11104.3 10049.5 6192.4 9383.3Repayments 1828.2 1987.7 2102.4 2780.2 3196.5 3681.1 4500.6 4751.4 5497.5 2705.6Interest Payments 1156.5 1316.6 1247.0 1421.0 1549.0 1640.3 1700.8 1816.1 2021.7 1057.6Net Outstanding 113000.9
128044.4
132086.8
161208.0
169465.9
190691.2
200404.4
220125.6
223433.2
245211.4
* First Eight MonthsNote: Outstanding amounts may change due to exchange rate fluctuations. Source: Financial Comptroller General Office.
107504.9
Table 15: Domestic Debt of the Government
(Rs million) Item FY94/95 FY95/96 FY96/97 FY97/98 FY98/99 FY99/00 FY00/01 FY01/02 FY02/03 FY03/04
Treasury Bills 6392.5 7142.5 8092.5 9182.5 17586.9 21026.9 27610.8 41106.5 48860.7 46830.0Development Bonds 4122.2 3672.2
3042.2 3302.2 3872.2 4262.2 5962.2 11090.7 16059.2 16059.0National Savings Certificates
6076.4 7376.5
8736.5
9886.4
10426.4
11526.5
12476.4
11536.1
9629.8
9629.8
Public Saving Cards - - - - - - - 628.1 931.1 1178.9Special Bonds 15466.7 16050.7
16019.7
16035.6
17784.1
17541.4
13994.3
9259.3
9164.5
9323.2
Memo Item: Nepal Rastra Bank 16328.0 17543.5 18066.1 15965.1 22115.7 20362.7 17399.7 24122.3 23685.7 17558.5Commercial Banks
8189.3 7540.0 7737.8 10280.6 12659.1 18176.6 25392.9 29361.2 39469.3 42662.7
Others
7540.5 9158.4 10087.0 12161.0 14894.8 15817.7 17251.1 20137.2 21490.3 22799.7Total 32057.8 34241.9 35890.9 38406.7 49669.6 54357.0 60043.7 73620.7 84645.3 83020.9Source: Nepal Rastra Bank.

43
CHAPTER 5: DECENTRALIZATION IN NEPAL
I. INTRODUCTION/BACKGROUND 93. The benefits of decentralization for promoting democratic governance, increasing community participation in development, improving service delivery to local communities and for enhancing accountability and transparency in the use of public resources, among others, are now widely understood almost everywhere. Notwithstanding these benefits, serious efforts to promote decentralization in Nepal started rather late, beginning with the Democracy movement in 1990. As discussed below, after a slow start, significant progress was made in the 1990s and early 2000s; but, since then the pace of decentralization has stalled, due to the same factors which have hampered political and economic development at the national level—the dissolution of elected bodies, continuing political instability and particularly the Maoist conflict. As a result, promoting decentralization (through effective devolution of expenditure responsibilities and revenue assignments to local bodies) and fostering participation of local communities in development activities and democratic governance remain a major challenge. This chapter briefly reviews the early efforts to promote decentralization during the last decade and the early years of this decade; current problems and weaknesses which hamper these efforts; and the main elements of the reform agenda which will need to be pursued, as and when conditions improve, to revitalize the decentralization process in Nepal. A. Progress in the 1990s and early 2000s16 94. The initial efforts to promote peoples’ participation in development started in the early 1960s under the Panchayat system, when elected district, village and municipality level Panchayats were given limited responsibilities for undertaking local level programs and levying local taxes. However, the Panchayats remained very largely extensions of the central government, and were primarily centrally driven. Later reforms in the 1980s introduced further progress by putting all district level line agencies under the umbrella of district level Panchayats; but, it gave little emphasis to promoting local governance and fiscal decentralization. Moreover, many of the key issues with regard to decentralization, such as the roles and tasks of local bodies, their relationships with the line agencies, overlaps in functions and responsibilities, and accountability arrangements remained unresolved. 95. The main impetus for decentralization came with the success of the Democracy Movement and the promulgation of a new Constitution in 1990. The latter explicitly recognized “wider participation of the people in the governance of the country and by way of decentralization” as an explicit state policy. It also created the legal and organizational structure for decentralization. Three separate Acts in 1992 created a two-tier local government structure of District Development Committees (DDCs) at the higher level, and Village Development Committees (VDCs) and Municipalities at the lower level; and local elections were held in 1992. However, it did little to clarify the roles and responsibilities of local bodies, to improve their decision making powers, or to realign implementation responsibilities from sectoral/line agency levels to local bodies. Nevertheless, it helped to create a strong constituency for decentralization—representatives of local government associations, elected officials, national level political parties who saw potential benefits (at least for themselves) in furthering
16 For a more detailed account, see “Decentralization in Nepal: Prospects and Challenges—Findings and
Recommendations of a Joint HMGN-Donor Review,” March 2001.
44
decentralization, and a growing body of other (Nepali as well donor) stakeholders, who increasingly viewed participatory local level development as an effective alternative to an inefficient central government. Increasing pressure by such groups led to the creation in 1996 of a high level Decentralization Coordination Committee chaired by the Prime Minister. Based on the recommendations of the Committee, (the Ninth Plan in parallel recommended greater devolution of powers to local bodies, along with adequate supporting mechanisms and increased role for the private sector and civil society), the Local Self Governance Act (LSGA), was promulgated in 1999. 96. The LSGA marks a major milestone in the decentralization process in Nepal. The LSGA and its administrative (Local Self Governance) Regulations of 1999 built on and improved the existing legal framework for decentralization. Some of its major features and contributions/achievements include the following:17
(i) It legitimized the concept of self governance and the devolution of (expenditure and revenue raising) functions to local bodies, including most of the proposals espoused in the Ninth Plan in this regard, as well as the structure of local level institutions for political governance.
(ii) For the first time, it enumerated the objectives, principles, duties and responsibilities and inter-agency relationships for local governance in the country. For example, it defined the tasks/responsibilities of the central government for furthering the decentralization process (implementation of policy, providing financial support, monitoring, supervision, capacity building etc); and conferred in principle wide sectoral authority (for example, for delivering local level healthcare, education and agricultural extension services, raising revenue through local levies, and local level planning and programming of service delivery activities) to local bodies. It also empowered local bodies to undertake periodic local level expenditure planning, prepare their programs on the basis of local priorities, and set up organizational structures, (for example, setting up District Technical Offices within DDCs), to carry out these activities.
(iii) It provided for financial support to local bodies through revenue assignments, central government grants and domestic borrowing; operational autonomy to set up organizational structures/positions; for accountability and transparency mechanisms, for setting up a local government service cadre, and for ensuring representation of women and disadvantaged groups, among others.
(iv) It helped develop a “Decentralization Implementation Plan” (DIP), with short and long term actions aimed at speeding up the decentralization process; and a Decentralization Implementation Monitoring Committee (DIMC) was set up under the chairmanship of the Prime Minister, together with a Working Committee (DIMWC) to oversee its implementation.
(v) It also provided for a Local Bodies Finance Commission, to make recommendations to promote fiscal autonomy and fiscal decentralization.
97. The LSGA, its associated regulations and follow up government actions provided the enabling framework within which the local government system evolved over the next few years. The two-tier local government structure was reaffirmed, with 75 District Development Committees (DDCs) in the top tier and 3913 Village Development Committees (VDCs) and 58
17 See “Decentralization in Nepal-Retrospect and Prospect”, Discussion Paper presented by the Government of
Nepal to the Nepal Development Forum in May, 2004.

45
Municipalities at the next level.18 This in turn enabled the evolution of three national level associations of local bodies—Association of District Development Committees in Nepal (ADDCN), National Association of Villages in Nepal (NAVIN) and Municipal Association of Nepal (MUAN)—which became focal points for policy dialogue with the central government and lobbies for accelerating the decentralization process. The DDCs have become the focal points of decentralized planning and coordination, (most of the DDCs now prepare their own periodic development plans), and implementation of development activities involving people’s participation at the district level. A single window financing framework, (the District Development Fund), has been set up as envisaged in the LSGA, to institutionalize and manage all funds received at the district level19. And, capacity building at both DDC and VDC levels has been carried out, with extensive financial and technical support from several external donors20, and by the Government. The Ministry of Local Development (MOLD) has been formally vested with this task, together with technical support from line ministries. Accordingly, the Secretaries of all DDCs and a technical officer for each VDC have been provided by MOLD, while there is also provision for deputation of other government officials to local bodies, as well as for the creation of a separate local government service. (It is also worth noting that external development partners have played a major facilitating role in fostering the decentralization process through technical assistance and advice, training, funding and catalytic, pro-active advocacy in support of participatory development involving local bodies, community groups and local level organizations). 98. Notwithstanding its legal significance as an enabling framework, the LSGA has suffered from a number of shortcomings. These have been catalogued in the Joint HMGN-Donor Review cited earlier, and are briefly summarized below: (i) The LSGA did not go far enough in providing a clear and strategic framework and a time bound action plan for implementation. (ii) Several inconsistencies between LSGA and other existing laws and guidelines, (as well as contradictions between decentralization policy and prevailing practices), hampered effective implementation. (iii) The actual devolution of expenditure functions/responsibilities to local bodies (local level service delivery in primary education and basic healthcare, and agricultural extension services) was far more limited than envisaged in the LSGA; and even that did not actually happen till much later (see below). There was also considerable overlap and duplication of functions between the line agencies and local bodies; (iv) Funding was inadequate for carrying out even the devolved functions, in part due to budget constraints of the central government; while necessary technical support was not provided by line agencies; and (v) Capacity building efforts have been inadequate and uncoordinated. While some of these problems have been partially addressed since, many of them and other weaknesses remain, as discussed below. (vi) Despite donor/government efforts to help build capacity of local bodies, technical capacity of such bodies to plan, design and implement devolved activities remains highly inadequate.
18 The DDCs are further divided into 9-17 Illakas and VDCs into 9 wards each, while the Municipalities have a
minimum of 9 wards or more, depending on their population, area, level of development, resources and service needs.
19 All grants from the central government, revenue sharing, internally generated income, funds received from line agencies for carrying out devolved functions, any contributions from donors (for example for capacity building work), and all borrowing, if any, are channeled through the DDF.
20 Notably by the UNDP, DANIDA, SNV, GTZ, SDC, CARE and UNCDF.

46
B. Recent Developments/Progress 99. The first 2–3 years following the enactment of the LSGA and related reforms have been characterized, as noted, by significant progress; but the most recent 2–3 year period has witnessed a loss of momentum in the decentralization process. While there have been important positive developments during this period in some areas, these have been outweighed by other negative developments which, figuratively speaking, have put the clock back. 100. Among the positive developments, several recent initiatives have helped to reinforce the decentralization process by expanding expenditure functions and responsibilities of local bodies and enhancing their resource base:
(i) In FY02/03, some of the areas identified in the LSGA for devolution to local bodies—primary education, primary health, and agricultural extension—were actually devolved to local bodies. (Postal services were also listed as a devolved responsibility, but was not handed over).
(ii) The Government’s Tenth Plan/Poverty Reduction Strategy Paper (PRSP) for the 2002–2007 period, finalized in 2003, strongly supports decentralization as one of its key cross-cutting strategies for reducing rural poverty. It emphasizes decentralized provision of essential public services and infrastructure (in areas such as primary education, primary healthcare, drinking water, extension services and rural roads, among others), through local governments, private sector, community groups, NGOs and Support Organizations (SOs) for improving service delivery to rural communities and for ensuring greater accountability and transparency. While actually helping to bring about devolution of functions (and resources to finance them) in the identified areas, this should further legitimize, and add momentum to the pace of, decentralization in the future, when the country environment improves.
(iii) In pursuance of this policy, in FY2003 and 2004, 1100 primary schools (roughly 4% of primary schools in the country) and 1168 sub health posts in 26 districts (roughly 37 % of all SHPs) were transferred to community management, under the supervision of VDCs. The government’s announced policy is to progressively transfer the remaining primary schools and sub health posts to community management over time. The Government has also recently announced the transfer of responsibilities for the construction and maintenance of rural/agricultural roads to local bodies. A somewhat different approach is being adopted in rural drinking water where NGOs and SOs are being utilized to design and implement rural drinking water schemes on the basis of demand from local communities.
(iv) The Government has also increasingly emphasized the involvement of the private sector, NGOs, Community Based Organizations (CBOs) and SOs for carrying out development work, (for example, in road building, rehabilitation and reconstruction activities, etc.), particularly in conflict-affected areas. Since it has become extremely difficult for the central government agencies and even local bodies to operate in such areas, this is presently the only effective alternative for the government for carrying out development activities. While this directly increases the degree of community involvement and participation, it would also help strengthen local governance, since the supervision and management of such activities would eventually devolve to local bodies.

47
(v) A Local Bodies Financial Commission (LBFC) was constituted in 2002, a detailed road map for fiscal devolution has been prepared and adopted in February 2003, and a permanent secretariat to help implement its recommendations was created in July 2003.
(vi) Following up on the recommendations of the LSGA and the LBFC, additional resources have been provided recently to local bodies through revenue sharing. Through this mechanism, local bodies are now entitled to 50% of royalties from hydropower and mining, 30% of the tourism fee (including mountaineering and trekking fees), up to 90% of the land registration fees and 10% of the revenue from forestry products. A formula based block grant allocation system for unconditional grants21 to DDCs has been introduced recently on an experimental basis for 20 districts (see below). Similarly, in the FY04/05 Budget, allocations for rehabilitation and reconstruction and for infrastructure building to the Mid and Far West regions have been substantially increased. In addition, the scope of “conditional grants” to DDCs and VDCs has substantially increased, since the resources for carrying out devolved activities are now channeled through these institutions.
(vii) Encouraged by the Tenth Plan’s commitment to decentralization, district level planning has expanded significantly. Most DDCs have prepared their periodic plans, which are now used as an input into the budget preparation process. However, the consultation process needs to be improved, particularly given the absence of active local government associations.
(viii) A number of preparatory activities are currently under way which will eventually help accelerate the decentralization/devolution process. For example, draft amendments for the removal of provisions in existing laws which conflict with the LSGA (10 out of 23) have been prepared, and are awaiting Parliamentary approval. Studies are under way to assess economic viability of districts and their organizational development; and on budgeting, audit and capacity development needs of DDCs; drafting of a human resource development plan for local bodies as well as for MOLD; formulation of guidelines for the preparation of periodic plans by VDCs and Municipalities; preparing a strategy for local infrastructure development, and gender mainstreaming at the local level, among others. A District Management Information System (DMIS) is being set up on an experimental basis in two districts; a Geographical Information System (GIS) has been initiated at the district level; and poverty maps are being produced for some districts.
101. These recent initiatives are noteworthy, because they are being taken amidst political instability and conflict (see below), and particularly in the absence of elected governments and advocacy groups who would normally lobby for such changes. As in other areas noted earlier, these reforms have been driven largely by change leaders in the bureaucracy itself. However they have been overshadowed by a number of negative developments:
(i) First and foremost is the absence of elected local governments since 2002. The five-year term of elected local bodies (DDCs, VDCs and Municipalities) expired in July, 2002; and local elections have not been held since, initially because of the
21 Conditional grants are tied to the implementation of specific activities, while unconditional grants are freely and
flexibly useable by the recipients for any development activities according to their priorities.

48
conflict and later also because of the dissolution of the Parliament and ensuing political instability. In the absence of elected representatives, the Government (His Majesty the King) has appointed officials to administer the local bodies. While the local bodies continue to function under their leadership, a number of problems which have a direct impact on the decentralization process are evident: (i) The moral legitimacy conferred by the electoral process is obviously lacking. Moreover, in the absence of elected local officials or their associations who used to be the major advocacy/lobbying groups for decentralization earlier, the demand for faster decentralization and devolution is missing.
(ii) The administered local bodies more or less function like the centrally appointed bodies of earlier days. The degree of accountability of appointed officials and boards to local communities has been significantly reduced; such boards are also more amenable to domination by local elites; generally, financial accountability and transparency is low; and reported incidences of irregularities and leakages have increased.
(iii) Even more damaging has been the spread of the conflict. Local bodies, as well as central government agencies, cannot function effectively in areas which are controlled or contested by the Maoists; and the extent of such areas has increased steadily. Infrastructures at both district and village levels (including office buildings, as well as administrative files and records, health centers, schools, local power and telecommunications installations etc) have been destroyed by the Maoists in many areas; and many (ex as well as incumbent) functionaries of local bodies (most of whom are associated with political parties) have been killed.
102. All of this have had a severe disruptive effect on the activities of local governments. In conflict affected areas, the operational effectiveness of local governments has been significantly reduced; they, as well as local NGOs and SOs who are increasingly utilized by the government for development work, can function largely to the extent they are allowed to do so by the Maoists, or can reach accommodations with them. This situation has had several negative effects: Since their activities are no longer expanding rapidly (or are being forcibly curtailed), fund allocations to them as well as the devolution of expenditure functions are not growing as they potentially can. Several donors as well as the government have cut back their development/capacity building activities in such areas. This in turn is undermining the capacity building efforts of local bodies, which are critical for promoting successful decentralization. As noted above, the absence of elected participatory local governments has also reduced accountability and transparency at the local level. Thus, the decentralization process is effectively on hold. C. Assessment of the Current Situation 103. Looking back over the past decade and a half, there has been noteworthy progress. The importance of, and the need for, decentralization has been clearly recognized; and explicitly incorporated in the development strategy of the Government and by development partners; the legal and institutional framework for decentralization has been created, (political decentralization); some of the expenditure/service delivery functions which are particularly important for rural areas have been transferred to local bodies and communities, (administrative decentralization); and their resource base has been improved to some extent, (financial decentralization). In addition, several initiatives are under way to strengthen the capacity of local

49
bodies, and to more generally accelerate the decentralization process. Notwithstanding this progress, many problems and deficiencies remain unresolved22. 104. An important indicator of recent progress in decentralization is the degree of vertical imbalance in the mobilization and use of resources by the central government and by local bodies. The absence of consolidated nation-wide data for all local bodies makes it difficult to provide precise estimates in this regard. But, it should be noted that internal generation of resources by local bodies is quite low in Nepal (see below), and that most of their resources (over 90% on average) are obtained from the central government as unconditional grants (freely spendable) and conditional grants (which are tied to specific activities) channeled through the Ministry of Local Development (MOLD). Thus the annual budget allocations and expenditures of MOLD are a good proxy for the trends in local bodies’ finances (Table 16). 105. Given the absence of elected local bodies until 1990 and the slow pace of devolution since, the central government continues to be the primary mobilizer and user of government resources in Nepal. Following the formation of elected local bodies in 1992, expenditure shares of Local Development rose to around 7% of total government expenditures in FY95/96, mainly due to the allocation of unconditional block grants to local bodies. These block grants however have been frozen at that level since then (at Rs. 500,000 per VDC, and an average of Rs. 10.8 million per DDC and Rs. 3.6 million per Municipality). The additional funding to local bodies are now provided through
Table 16: Expenditures on Local Development (Rs million)
Year
Total Govt. Expenditure
Allocations to Local Bodiesa
ChanneledThrough MLDb
Total Local Development
Local Dev. as % of Govt. Expenditure
FY90/91 23,549 - 328 328 1.39 FY92/93 30,898 n.a. 666 666 2.16 FY94/95 39,060 1,752 654 2,406 6.16 FY95/96 46,542 2,643 722 3,365 7.23 FY98/99 59,579 2,755 1,082 3,837 6.44 FY01/02 80,072 3,056 1,120 4,176 5.22 FY02/03 84,006 2,966 1,603 4,569 5.44 FY03/04 92,107 2,958 2,733 5,691 5.52 FY04/05c 111,690 2,966 3,197 6,163 7.00
a Unconditional grants to DDCs, VDCs and municipalities.
b Residual, i.e. Conditional grants for projects/programs channeled through MLD by government and donors.
c Budget Allocation.
conditional grants (financed both by the Government and external donors and channeled through MOLD) for specific project/program related activities. These include, for example, funding for capacity building programs by donors, as well as rural development, infrastructure building and targeted poverty programs carried out with the involvement of both local bodies and community groups. Even with the recent expansion of these programs, the share of local bodies in total government expenditures is now around 5-6%. When additional funding for 22 This and the Recommendations section in Chapter 6 draw heavily on several reports that have been prepared at
various times on decentralization issues in Nepal. In particular, the following reports should be noted: (i) “Report on the Expenditure Assignment Study”, April, 2004; “Report on Expenditure Effectiveness of Local Bodies and Assessment of Expenditure Needs of Devolved Tasks”, November 2004, (both prepared for the Local Bodies Fiscal Commission/Decentralization Advisory Support Unit); and “Decentralization in Nepal”, May 2004, HMGN; cited earlier.

50
recently devolved activities (such as primary schools, sub health posts and agricultural extension, which are channeled through line agencies rather than MOLD) are added, the share of local bodies would rise by another 1–1.5% to about 7% of government expenditures in FY03/04—still a low level. 106. Vertical imbalances between central and local levels are even greater with regard to revenue generation; local bodies currently generate only about 1–2% of total government revenue. The revenue base of local bodies has been traditionally very small, both because of lack of revenue assignments (in a strongly centralized system) and the very weak capacity at local levels. Until a few years ago, the Octroi–a transit tax on goods entering jurisdictions of municipalities–accounted for about 70% of the self generated revenue of such bodies; but it was abolished a few years ago because of its distortionary effects on trade and investment. Although the central government transferred some additional sources of revenue, such as land and property taxes, to local bodies, (but without providing the necessary staffing and technical resources to administer them), collections from new revenue sources have declined. Local bodies presently lack trained revenue staff, properly maintained cadastral and revenue records and experience and knowledge with regard to property valuation in order to effectively exploit these new revenue sources. Moreover, the current revenue sources assigned to local bodies, such as property and vehicles taxes and professional tax, are not very elastic. The government’s efforts to supplement local bodies’ revenues through revenue sharing (of centrally collected electricity royalties, tourism and trekking fees etc, which are then passed on to local bodies), will help to provide some additional resources; but they will not help build local capacity for administering local taxes. 107. The current fiscal transfer system also does not provide incentives to local bodies to increase revenue mobilization or to enhance capacity building. This is because local bodies can continue to depend on central government grants to meet not only their development/capital needs but also their recurrent expenditures. On average, over half of unconditional grants to local bodies and most of their internally generated resources are spent on administrative overheads and other recurrent expenditures. The proportion is even larger—as much as 80%—in the case of smaller VDCs. This in turn weakens expenditure discipline and financial management, particularly in the absence of timely (and accurate) expenditure reporting and effective monitoring and supervision. Recognizing these problems, as noted, unconditional grants have been more or less frozen over the past few years, and additional resources are being provided increasingly as conditional grants. 108. The current transfer system also does not address the problems of horizontal imbalances and fiscal equalization. There are wide disparities among DDCs, VDCs and Municipalities in terms of level development, resource generation capacity and project/program implementation and expenditure management capacity. The larger and better-endowed local bodies located in economically better off areas are able to hire better qualified/trained staff, as well as additional staff to carry out their functions more effectively; but the smaller units, as well as those located in less developed areas, are less able to do so. Providing equal amounts to all DDCs and VDCs (as in the case of unconditional grants) does not help address the (equalization) needs of the poorer and backward districts and VDCs. Accordingly, the Government is now experimenting with a new formula-based approach for providing grants to districts. The new formula has weights of 50% for the level of development of districts, based on the district level Human Development Index, 20% for population; 10%, for area, and 20% for the district-wise Cost Index. Thus, the new grant formula gives priority and more resources to the less developed districts and the more remote areas where the cost of construction/development
51
activities are generally higher. Depending on how the new approach works out, the Government expects to eventually extend it to cover all districts. 109. Why has progress in decentralization been slow? While there have been many reasons, the key contributory factors are summarized below:
(i) As noted, although the LSGA provides a good enabling framework, it has lacked a well articulated time-bound implementation plan. Although it has assigned various functions and responsibilities to the central government and its agencies and local bodies, there is considerable overlapping of functions and responsibilities between the line agencies and DDCs, and between the two tiers of local bodies themselves; and the responsibility/accountability for various tasks and activities often has not been clear, thereby hindering the devolution process.
(ii) Higher level commitment to decentralization has been sporadic and at times lacking. For example, at the political level, while elected governments recognized the benefits of decentralization for building political support for themselves at the local level, some sought to strengthen DDCs while others favored VDCs; and this in turn created considerable ambivalence in supporting programs championed by others. At the bureaucratic level, there has been considerable reluctance on the part of line ministries and agencies to let go of their traditional functions and sources of power; and in the absence of a clear implementation plan, each line ministry/agency interpreted the national commitment to decentralization in its own way. This lack of commitment is reflected in the functioning of the Decentralization Implementation Monitoring Committee (DIMC) itself. Set up directly under the Prime Minister to monitor progress and to make appropriate recommendations for accelerating decentralization, DIMC has not met for the past 2.5 years.
(iii) The real drive for decentralization, as noted, came from below through demand pressure from local bodies and elected representatives. Thus progress often reflected the “ tug and pull” from up and below. Following the expiration of the terms of elected bodies two years ago, however, the demand pull from below has been missing. The main recent support for decentralization has come from the efforts of reformers within the government who see it as an important instrument for improving rural service delivery and implementing development activities in a limited way in a conflict environment.
(iv) When functions and activities were actually devolved to local bodies, this was often done without transferring adequate budgets and technical resources (especially trained manpower) to carry out such tasks, (for example, in the case of assignment of land revenue taxes, or agricultural extension activities). Frequently, local bodies were not prepared to take over such tasks. Sometimes, devolution simply meant the transfer of line agency budgets for assigned tasks to the District Development Funds (DDFs); and the DDCs promptly channeled the funds back to the line agency, effectively hiring the latter to implement the task, with the DDCs in theory being responsible for the ‘devolved’ activity, (as, for example, in rural roads). While this situation has improved somewhat recently, the transfer of technical resources and manpower remains a problem. Moreover, often where technical staff are deputed to local bodies, they remain answerable to the line agencies rather than to the local bodies, (as in the case of Secretaries of DDCs).
(v) As noted, the capacity of local bodies for internal revenue generation through effective exercise of their taxation powers remains weak. Many local bodies,

52
particularly at the VDC level, are too small in terms of size and resources available to them, in order to build up the required core staff and skills; and as noted earlier, there are also no incentives for them to do so.
(vi) Indeed, the biggest obstacle to faster decentralization/devolution is the lack of capacity of many local bodies to effectively carry out their primary function—planning, implementation and management of devolved functions; compliance with required standards for accounting, financial reporting and auditing; and ensuring accountability and transparency. Over the past few years, training/capacity building programs carried out with financial and technical assistance from external donors have helped to improve the situation in several DDCs and VDCs, (see below). Most DDCs now prepare their periodic plans and have set up their internal audit units, as well as sectoral units to carry out their key activities. Notwithstanding these improvements, there are persisting deficiencies: A large number of VDCs have not been covered by donor assisted capacity building/training programs23; accounting and reporting formats are not consistently followed; record keeping and periodic reporting are not adequate in coverage and quality, (many local bodies do not provide information on how they utilize internally generated resources); expenditure norms set by MLD for the use of grant funds, (for example, the limits set on the use of such funds for financing recurrent expenditures, or the requirement that they spend 25% of such funds on the social sectors), are not adhered to; among others. The expenditure allocation process at local levels leaves much to be desired; and project selection and prioritization need considerable improvement. Whenever there is significant community participation, (largely the result of training and capacity building and involvement of Support Organizations), however, accountability and transparency have been better. But, as noted earlier, in the absence of elected local bodies, financial discipline and accountability have reportedly deteriorated.
(vii) The capacity of MOLD—the apex ministry which is responsible for overseeing progress of local bodies—to effectively supervise and monitor them is inadequate. MOLD does not have the staff, skills and the capacity both to monitor local bodies and to implement a rapidly expanding program of activities. Part of the problem of non compliance of reporting and accounting standards by local bodies lies in the fact that MOLD’s own capacity to supervise and monitor them is limited. (For example, even where the DDCs have carried out their internal audits, such reports have not been reviewed by MOLD. These deficiencies and capacity constraints in turn are perceived negatively by line agencies, who use such shortcomings and the lack of readiness of local bodies as a potent argument for slowing down the devolution process.
(viii) The representation of women and disadvantaged groups in local bodies is still low, although some progress has been made recently, particularly through the involvement of community groups. But, the decision making processes continue to be dominated by local elites, particularly in the absence of elected representation.
23 For example, although the main nation wide capacity building programs—the UNDP’s Participatory District
Development Program (PDDP) and Local Governance Program (LGP)—covered 60 of the 75 districts, a large number of VDCs even in these districts were not included in these programs. There is also no overall policy framework and strategy with specific goals and timeframe for capacity building and personnel development/staffing of local bodies.

53
D. Conclusion 110. Since the early 1990s, Nepal has made significant progress in decentralization. Political developments in the country however have slowed down the momentum in the last few years. The results of decentralization efforts so far have been mixed. The legal and institutional framework for local governance has been created, some devolution of functions and responsibilities to local bodies has been made, and promising results in the form of improvements in the delivery of essential social services to rural communities are already evident. Nevertheless, it is also possible to point out several shortcomings: weak expenditure management, inadequate coverage and low quality of expenditure reporting, the need for improved accounting and transparency arrangements etc. Also, revenue mobilization by local bodies is very low; and there is little incentive for them under existing arrangements to improve their capacity and performance. To accelerate the decentralization/devolution process in a credible and accountable manner in Nepal, the enabling environment should be improved through the restoration of elected local bodies and a measure of political stability and peace. However, it is difficult to predict how long this will take. In the meantime, several things can be done to prepare the basis for faster and more sustainable devolution. The most important of these include: Rethinking/reevaluation of the present decentralization strategy so that devolution can be made in a phased manner to the stronger local bodies first, while helping others to improve their capacity for assuming such responsibilities as they become more mature and viable; redefining/rezoning the administrative district system to create more viable units; developing a clear action plan for phased devolution, (clearly defining the functions and responsibilities of various levels of government and identifying which sectors and activities should be devolved, to whom and when); improving the legal framework for decentralization (by removing conflicting provisions in other laws and regulations);.capacity building of local bodies in a phased manner (through a well designed training program), so that they are better able to carry out the devolved functions, among others. Such changes will help to link additional devolution to capacity improvements of local bodies, and make the decentralization process more performance oriented and fiscally sustainable. The existing fiscal transfer system should also be reviewed and modified, so that it provides more incentives to local bodies to improve their performance and capacity building efforts.
CHAPTER 6: RECOMMENDATIONS AND CONCLUSIONS
I. INTRODUCTION 111. The key conclusions of the preceding chapters are that, in the past 2–3 years, Nepal has achieved significant progress in improving its public financial management, despite frequent changes of governments and the escalation of the Maoist insurgency. This is more than what Nepal had achieved in the previous decade, and more than most countries would have done in similar circumstances. The advances made, under pressure, in some areas such as education and health sector reforms, particularly in adopting new implementation modalities envisaged in the PRSP---such as promoting community management and enlisting NGOs, CBOs and SOs to carry out development work in conflict areas etc., have been innovative and path-breaking. They have enabled the Government over the past 2-3 years to focus on poverty reduction, despite growing fiscal problems, while maintaining macroeconomic stability. Moreover, this effort has been largely home grown, driven primarily by Nepali reformers who took advantage of the fiscal crisis for pushing through necessary reforms, rather than using it as an excuse for inaction.
54
112. These efforts have built a good base which future reformers can build on to further reduce poverty in Nepal. But, the country now seems to be at an important crossroads. The political and economic situation remains fragile and the progress that has been achieved so far is at risk. It is indeed possible that the reform process could slow down for a number of reasons; and if that happens, external support which has been propping up the budget could erode quickly. If external assistance were to decline significantly below current levels, the sustainability of fiscal stability, development spending, and the pace of poverty reduction would be seriously affected. 113. The greatest source of uncertainty is whether there will be an early resolution to the conflict and ultimately a return to political stability. Apart from this uncertainty and ensuing downside risks to public finance and macroeconomic stability should the conflict prolong itself, there are underlying structural issues which could weaken the fiscal situation over the next few years (the medium term) and beyond. As discussed above, Nepal's budget structure has changed significantly in the past few years. Development spending is now heavily dependent on external assistance (to the extent of nearly 70%). Unless there is a structural improvement in the trajectory of revenue and regular expenditures over the next few years, the dependence on aid cannot be reduced; and any shortfall in budget support and/or other types of aid will reduce development spending more than proportionately. 114. Nepal thus needs to take early action to address short-term budget management problems, as well as to improve efficiency/effectiveness of public spending over the near to medium term. In the absence of such action, the fiscal situation can deteriorate into a crisis. The immediate need is to take necessary actions to fulfill the budget support conditionalities under the PSM and PRSC agreements. If this cannot be done, then it will be necessary to tightly manage the cash position, so that at least the P1 activities can be funded within the much-reduced level of cash availability. Since P1
s now account for 75% for the FY04/05 Budget, it is doubtful whether all the P1
s can be protected. Therefore, the Mid Year Review of the Budget will need to be used to realistically assess the resource situation; and depending on this assessment, decisions will need to be made about how many and which P1
s can fully protected and funding of P2
sand P3s will probably have to be stopped. This would of course mean that
additional demands for recurrent expenditures should not be accommodated at this time; and that decisions such as adequate adjustments of oil prices should be made in a timely manner. 115. Looking beyond the immediate problem of managing this year's budget, efforts will be needed to improve resource mobilization, limit spending (both regular/current and development/capital) within the levels of resource availability and to improve the efficiency/effectiveness of public spending. These actions will have to be taken as a matter of urgency, against a background of continuing conflict and political instability. Nepal cannot wait for better times to implement reforms, because no one can predict how long the wait will be; and the fiscal situation can unravel if corrective actions are not taken in time. The key actions which are needed are summarized below.
A. Overall Budget Framework
116. Given the uncertainties discussed above, it is essential to have a realistic and credible budget framework as the basis of the annual budget and the MTEF. This year's experience highlights this need. As noted above, the development budget target of Rs. 47.2 billion was ambitious to begin with, and according to current indications, it is clearly out of reach. Moreover, if this practice is continued, it will undermine the credibility and usefulness of the MTEF approach. For next year, a much tighter resource envelope should be set, based on a more
55
realistic projection of likely revenues and aid disbursements. As discussed below, it is desirable to involve the external partners in this process in order to increase the reliability of the aid estimates. To the extent that such aid disbursements (particularly budget support and sector program support) are contingent on the timely performance of agreed conditionalities, the latter should be explicitly included in the Immediate Action Program (IAP) and monitored closely. Although some of this is already being done, a major problem seems to be that, at the higher political levels, there seems to either a lack of awareness or appreciation of the resource constraints, of the extreme dependence of the budget on external assistance for achieving even a minimum level of development activities and the performance requirements for ensuring the timely availability of such assistance. To overcome this problem, it would be necessary to discuss the resource estimates (budget framework) and the performance requirements (the IAP) very early with the political leadership, so that the implications for budget management of a failure to carryout the reform commitments or of additional expenditure commitments are clearly understood by all those who matter. This will also help increase the transparency of, and accountability for, the budget management process. Periodic joint reviews of IAP and aid disbursement progress by the government and key external partners would help to identify emerging problems and alert the political leadership to take corrective actions before it becomes too late. This is being done now; but the results of such reviews and the need for corrective actions should be brought to the attention of political leadership and disseminated more widely.
B. Revenue Mobilization
117. The need for strong efforts to strengthen revenue mobilization cannot be overemphasized. As discussed, Nepal's external dependence has increased not only because of the recent sharp increase in regular/recurrent expenditures, but also because of its inadequate revenue performance24. Given the structural change in its budget structure, Nepal will continue to be heavily dependent on external aid for quite some time. But to minimize this dependence and to eventually assume greater degree of self reliance for its expenditure program, the tax effort will need to improve considerably from now on. 118. Nepal has vigorously implemented tax reforms over the past few years. For example, a Value Added Tax (VAT) was adopted in 1997, tariffs on imports have been rationalized and progressively reduced over time, and important reforms in income taxes (through a New Income Tax Act of 2002) have been initiated. These have helped to improve the tax/GDP ratio as noted over the past few years, and have also helped to reduce the heavy dependence of the revenue system on imports. Nevertheless, the tax base is still narrow, and tax administration remains weak. 119. While the revenue performance must be improved for the reasons discussed above, this will be a challenging task for several reasons: (i) The ongoing conflict (and political instability) will adversely affect economic growth, in turn undermining the scope for revenue gains. Moreover, since the business community is being effectively taxed twice now, (once by the government and a second time by the Maoists who extort “protection money”), increasing the tax burden on businesses will be more difficult. (ii) Some of the fast growing sources of income
24 By international standards, Nepal's revenue/GDP ratio (around 12% of GDP) is about average for a country of its
per capita income level. But, there are countries with lower levels of per capita income who have performed (some significantly) better than Nepal. See the World Development Report, 2004.
25 “Nepal: Next Steps in Tax Reform”, IMF, 2003; “Reform Agenda –Overview of Past Performance and Proposals for the Future”, HMGN, 2004; and Report of the Fiscal Reform Task Force, HMGN, 2002.

56
(such as remittances from abroad and small scale commercial agriculture) are presently outside the reach of the tax system; and it is not easy to bring them into the tax net without undermining incentives and encouraging leakages (particularly of remittances) into unofficial channels. (iii) As noted, Nepal’s import tariffs are already low by South Asian standards, limiting the potential for revenue gains from such taxes; and (iv) Some of the central government taxes (such as land and property taxes) have already been transferred to local bodies; and more such transfers could be expected in the future. 120. Notwithstanding these constraints, more could be done to improve revenue collections in the short to medium term. To this end, several measures have been identified in recent government and IMF reports25: (i) Widening the tax base by increasing the coverage of the VAT and eliminating VAT and customs exemptions. (ii)Strengthening the tax administration by implementing the recommendations of the Fiscal Reform Task Force, specifically by making the newly established Large Tax Payers Office (LTO) fully operational, staffing it with adequate staff, training and providing performance based incentives. (iii) Implementing the three-year Customs Modernization Plan which, among others, seeks to improve and regularly update the import valuation system, strengthen customs administration and improve its supervision, monitoring and incentive systems; and (iv) increasing tax rates, particularly VAT and excise, to the extent they are politically feasible. C. Regular/Current Expenditure 121. Moving to a current/capital expenditure classification in line with accepted international Government Financial Statistics (GFS) standards can have important benefits for Nepal. Apart from enabling international comparability of fiscal data, such a classification provides a better basis for budgeting, evaluating resource needs of projects/programs in an integrated manner, and for assessing how effectively resources are being used and for what purposes. It also makes it easier to move to sectoral programs and greater performance orientation. Recognizing these benefits, Nepal has already moved to a current/capital (from regular and development) expenditure classification in line with generally accepted international standards on GFS, consolidation of accounts, and accounting disclosure, beginning with the FY04/05 budget, which was announced in July 2004. The Government has also indicated that it will integrate the current/capital (regular/development) budgets in the MTEF which will be prepared for next fiscal year (FY05/06). The discussion in the following pages relates to the improvements that will be needed in this context26. 122. Making a realistic assessment of regular/current expenditures and restraining their growth to reasonable levels is critical for improving public resource management. Looking at next year and beyond, there are several sources of structural increases, as well as expenditure commitments of a more short-term/temporary nature, which will need to be managed carefully:
26 In terms of expenditures aggregate, these classifications are fairly close. For example, in FY02/03, current
expenditure, on GFS basis, was Rs52.1 billion, as compared with regular expenditure of Rs55 billion on government basis; but capital expenditure and net lending was Rs20.9 billion, compared with development spending of Rs29.0 billion. There are however major differences in underlying concepts (net vs. gross) and analytical significance between the two classifications. Roughly about 75% of the development expenditure in the government classification represents capital expenditures on the GFS format.

57
(i) The major source of pressure is security expenditures related to the ongoing conflict. For example, there are additional demands for 23,000 more security forces (army and police) which, if granted, will add about Rs2.5 billion a year to regular/current expenditures. (Initial costs, which include costs of training and arms and equipment are likely to be around Rs4–4.5 billion).
(ii) Normal wage drift/annual increments for government employees (excluding teachers etc) of the order to 5–6% p.a., could add about Rs1.5 billion annually.
(iii) Possible pay increases depending on the recommendations of the Pay Commission. Although the latter's intention is to recoup much of the pay increase from efficiency gains/cost reductions elsewhere, it is highly likely to entail a net addition to the wage bill.
(iv) The growing cost of servicing external and domestic debt. (The increase over the past 2 years has averaged Rs1.5 billion a year).
(v) The recurrent cost implications of new sector programs in education and health (for hiring more teachers and health workers, grants to schools for recurrent expenditures, and scholarships to girls etc). Although these expenditures will be financed for the next five years by donor support under SWAPs, they will become the government's direct responsibility after that.
123. There are of course a number of other demands/claims which will increase regular/current expenditures on a year-to-year basis, if continued. These include among others, compensation to victims of the ongoing conflict, accumulated claims of RNA for under-funded past expenditures (Rs2.9 billion is being claimed for last year), liabilities which arise from unplanned/unbudgeted political commitments, partly in the absence of adequate awareness/appreciation of the fragility of the fiscal situation, and of course annual operating losses of several loss-making public corporations (which are eventually met from the development budget). The operating loss of the Nepal Oil Corporation alone, resulting from delays in price adjustments, has averaged about Rs700 million a month in recent months, and will ultimately have to be met from government resources. 124. To find offsets to these temporary and structural regular/current expenditure increases, (for example, through possible cost savings from budget integration, reducing existing practices of over-funding of activity costs through improved unit costing, re-examining/streamlining the role and functions of the public sector and potential cost-savings in various areas/activities), is a major challenge for the new High Level Public Expenditure Commission (HLPEC), which has been constituted recently. The Commission will need to realistically assess expenditure requirements, identify and recommend corrective measures wherever necessary to limit regular/current expenditure growth well within the bounds of revenue growth, help develop a sustainable budget framework, and help ensure discipline and accountability. This is also a major aspect of the future work program for improving the MTEF process (see below). D. The Medium Term Expenditure Framework (MTEF) 125. Although considerable progress has been achieved over the past 2–3 years in introducing a medium term framework for the development budget, as discussed in Chapter 3, much more needs to be done to improve and expand this process in order to enhance the efficiency and effectiveness of public spending. Such improvements are also critical for dealing with the current fiscal problems. There are several areas where other improvements can be made.

58
126. First is the adoption of a more realistic and credible budget framework which is endorsed early on at the higher political levels, as discussed earlier. This would help the administration to reintroduce the "hard budget" constraint, and resist political pressures for new spending initiatives, and maintain control over the expenditure program. Second the MTEF needs to be broadened by bringing in regular/current expenditures also within its discipline during the next budget preparation cycle, as already indicated by the government. Issues related to such integration are discussed below. Third, a number of procedural and substantive improvements can be made to consolidate the progress that has been achieved so far, and to help widen and deepen the MTEF process. 127. As noted earlier, the budget is vulnerable to both structural expenditure pressures, as well as to cyclical imbalances of a more ephemeral nature. The former, if properly assessed in advance, can be built into the medium term budget framework. The latter (as in the case of oil price swings) is more difficult to predict. While there are mechanisms at present to deal with such imbalances, (for example by reducing funding to lower priority activities within the budget, or by shifting the financing burden temporarily to the banking system as in the case of loss-making public enterprises), they have predictable costs. In the short term they preempt resources from desirable development activities in the budget, and over the medium to longer term they add to the (contingent) liabilities of the government. It is therefore important to distinguish between such structural and cyclical factors, and devise mechanisms (for example, by implementing an automatic price adjustment mechanism for petroleum products- -see below) to effectively deal with the latter as cyclical fluctuations arise, so that the rest of the budget will not be held hostage to such changes. It is also desirable to gradually move, over the longer term, from the current narrow focus on the central government budget, to a wider public sector budgeting concept, which takes into account the finances of the central government, public enterprises and eventually local governments. Focusing on the broader public sector deficit, rather than the narrower central government deficit, would help to reduce the exposure of the government to hidden risks (such as contingent liabilities which are not adequately tracked or recognized), and help avoid unpleasant surprises. This is however a matter for the medium to longer term, since considerable preparation and data improvements are needed before such a transition can take place. E. Internalization/Ownership 128. Nepal has so far prepared and implemented MTEFs in 3 successive years; but the timetable and modalities of their preparation have not been consistently fitted into the budget preparation cycle. Consequently, there are questions about the degree of line ministry involvement in and ownership of the MTEF process. To ensure that the MTEF is fully accepted and effectively used by line ministries, it is necessary to internalize the MTEF preparation and build it into the budget cycle. 129. A quick review of the preparation process of the three MTEFs helps illustrate this point. The preparation of MTEF 1 (initially for five key ministries) was initiated under the overall guidance of an external consultant in November 2001; and first drafts were prepared by line ministry teams, assisted by one local consultant/resource person for each ministry by end January 2002. It was then used as the basis for budget discussions and incorporated into the FY02/03 budget which was announced in July 2002. MTEF 2 was prepared primarily by the line ministry teams under the overall guidance of National Planning Commission staff, and utilized very few local consultants. It started in March/April 2003, still early in the budget cycle; and was reasonably well internalized, in terms of ownership and timing. MTEF 3 started late in May 2004, and was mainly prepared by a large team of local consultants. Though a much better

59
product than the first two MTEFs, it was not, however, fitted adequately into the budget preparation cycle, nor did it sufficiently involve the line ministry teams, thereby raising questions about its ownership by the latter. 130. For ensuring effective internalization, MTEF preparation should begin, based on preliminary sector ceilings, as early as November each year, and by line ministry teams, with local consultant inputs only where necessary. There is now enough capacity for this in line ministries and the NPC who could guide the process. The initial draft, prepared by end January, could then be used as a strategic phase to budget preparation, which normally starts in February. Such early preparation will be useful and necessary now, particularly because of the additional work involved in integrating the regular and development budgets and the move towards performance/activity based budgeting as discussed below. Once the normal budget preparation starts in February, the initial draft could be further refined and be the basis of budget discussions between the Ministry of Finance/NPC and the line ministries. This would help solve problems of ownership and internalization, while facilitating budget preparation. F. Integration of the Regular and Development Budgets 131. While resource allocation and predictability of resources for line ministries have improved significantly, there is little evidence that operational efficiency in the delivery of outputs and services has similarly improved. The integration of the regular and development budgets, strengthening the prioritization and screening process, improving cost estimates and moving towards a performance/activity based budgeting and monitoring system would help improve results in this regard. 132. Integrating the regular and development (or current and capital) budgets is not simply a matter of putting these two budgets together. There are several issues to be addressed in this context, relating to the process, leadership and focus of activities, among others. A major difference is that traditionally allocations in the regular budget have been provided on an incremental basis, while the development budget has mainly focused on new construction without adequately focusing on the operational needs of service delivery activities. Budget integration would allow/require the line ministries to take a holistic view of what inputs/resources they will need to carry out service delivery activities from existing assets/infrastructure, as well as to carry out new capital/construction activities. The business plan preparation now under way, on a pilot basis, in five line ministries (education, health, drinking water, agriculture and irrigation) is also moving in the same direction. Its main goal is to ensure that each ministry clearly defines its objectives and intermediate targets/indicators to be achieved, and the key activities which would be needed for this purpose, and prepare their work programs, inputs and financial requirements/budgets accordingly, which will in turn provide a sound basis for monitoring financial performance and physical/progress. The challenge in the short term for the Finance Ministry and the NPC, which have been approving regular and development budgets more or less independently so far, would be to work together as teams and set mutually agreed ceilings for the line ministries for the integrated activities. Over time, however, the question of which institution should take the lead role in the budget preparation process will need to be resolved. While a joint team approach may be appropriate now, given the current expertise of the NPC with the development budget (and the relative lack of it in the Finance Ministry), the leadership is likely to gradually shift to the Ministry of Finance. The experience in many other countries clearly shows that budget integration is more effective when the combined (current and capital) is placed under one Minister/Ministry - -generally Finance, which is responsible for

60
the budget.27 NPC then should focus its attention largely on defining the macro framework, sectoral priorities and policies, and poverty monitoring and evaluation. The eventual efficiency gains/cost savings from budget integration should be significant---through reducing duplication of staff and overheads, rationalization of activities and inputs, reducing waste, and ensuring greater accountability for processes, tasks and outputs. It should also help provide a better basis for monitoring progress and improving accountability. G. Improving Cost Estimates 133. Nepal has so far opted for a phased adoption of the MTEF approach. It has not spent a lot of time and resources on refining cost estimates at the initial stages. Over the past year, however, some work has been started on improving cost estimates. Unit costs have been worked out as bench marks for eight sectors. This should now be extended to the other sectors also, field tested on a selective basis to verify/validate them, and improved over time to ensure accuracy of sectoral budget estimates over a few years. This would help minimize budget padding and improve cost-effectiveness of sectoral programs. H. Improving the Prioritization Process 134. From the beginning of the MTEF process, a set of prioritization criteria has been adopted, and tailored to meet the country situation and needs. It has helped considerably to align the public expenditure program with the PRSP priorities, and has also been used as a screening mechanism for keeping out new spending initiatives. However, there are some doubts about the robustness of the prioritization for line item control of sectoral budgets. It is claimed that line ministries do not consistently apply the criteria, or that they manipulate it to get a favored activity classified as a P1 by adding specific poverty components to it. Admittedly in MTEF 1, prioritization was somewhat haphazard, since the criteria was not consistently followed; but in MTEF 2 and MTEF 3, the criteria was modified and improved, and a uniform scoring table (which could be checked out for accuracy/subjectivity of marking) has been used. But, there is still considerable scope for improvement. Moreover, in the budget itself, there is no explicit code for readily identifying poverty-focused expenditures. The introduction of a poverty code will help to monitor "pro-poor" expenditures more easily. 135. The screening process for purposes of project selection (for inclusion in the MTEF) also needs to be strengthened. In the past, while there were formal procedures, these were not strictly applied; and new projects were included in the budget without proper evaluation. To protect the integrity of the MTEF, a project evaluation and screening process should be formally adopted; and the evaluation criteria can be strengthened by incorporating the prioritization criteria, suitably modified, for evaluating new projects/activities. Objectives/activity based work program preparation should also be undertaken as part of the project preparation and approval process, so that the new projects are ready for implementation on a monitorable basis, when they are included in the MTEF. This will ensure that the new projects/activities that are included in the MTEF each year are genuinely P1
s. Such an approach will help to systematize the critical review of costs and benefits of new activities, establish discipline over the review process and help avoid political queue jumping, (which happens often, whenever a new government assumes office). 27 There are many examples in developing countries of fragmentation of planning, budgeting, implementation and
expenditure management functions between different government ministries and agencies under more than one Minister. Such arrangements often suffer from rivalry and competition (among Ministries and Ministers), and lack of effective coordination. Placing the key functions as separate divisions under one Minister is usually more effective.
61
I. Monitoring and Evaluation 136. Achieving operational efficiency is the most challenging aspect of the MTEF at this time, when it is approaching its fourth preparation cycle. What this means in practice is that funds made available to line ministries (for prioritized activities on an assured basis) are in fact used for implementing those activities and deliver the promised outputs/benefits (as indicated in the annual work programs) to intended beneficiaries in a timely manner. The improvements in unit costing (discussed above) are further aimed at ensuring that such delivery takes place in a cost-effective manner. To ensure that this truly happens, an effective monitoring system which would help verify whether the budget allocations are being properly utilized for approved purposes (financial progress), and whether such expenditures actually produce the expected outputs and services (physical/implementation progress), is essential. For these purposes, the current system in Nepal requires monthly reporting by the implementing units on financial progress (how previously related budget allocations have been spent), as well as trimesterly reporting of physical/implementation progress. The work programs which are prepared as an essential part of the budget cycle are the basis of this verification process. The new fund release procedures which were introduced in FY02/03, (linking fund releases directly to the priority classification and to the provision of reports on financial and physical/implementation progress), are an attempt to enforce such a system. 137. In itself, as noted, this attempt to link budgets to outputs and outcomes is a radical departure from traditional input-oriented budgeting approach. However, while some important benefits have been achieved, (for example, by channeling funds to priorities), the new system still does not work as intended.28 138. There are several reasons for this, most of which relate to institutional weaknesses and deficiencies: The Financial Comptroller General’s Office (FCGO) and its District Level Offices (DTCOs), who are responsible for fund releases and ensuring that the above system works well, are reasonably well equipped to carry out financial monitoring, but not for implementation/physical monitoring. There is very little verification of physical/implementation monitoring at present; and the FCGO and DTCOs primarily rely on the certification of implementation progress by appropriate agency heads. This is partly the result of inadequate staffing and capacity for such verification, lack of an inspection orientation, as well as other problems (see below). This however allows spending units to make inaccurate reports, so long as they know that there will be no verification. This is a systematic problem which affects implementation at all levels, (perhaps with the exception of community managed activities where there is relatively more community pressure for results). Hence, the end results of the new system in terms of accountability for service/output delivery are not much different from the previous system, i.e., "releases are largely utilized, but without enough accountability for
28 To implement a performance based budgeting system, some key requirements are needed: (i) A clear agreement
on how the budget allocation would be spent, on what activities, and what they will produce within the budget period (i.e, a work program broken down into activities which will be financed, together with implementation/output targets and their time phasing); (ii) Agreed measurable indicators/criteria and reporting arrangements, (iii) Capacity within the monitoring agency to check whether the agreed targets/indicators are being met; and (iv) Feedback of ‘performance’ to budget authorities to adjust subsequent allocations. At present, in Nepal some of these key elements are missing. The Business Plans initiative now under way for five ministries on a pilot basis is an important beginning towards meeting the first two requirements. However, the monitoring capacity to implement such an approach is not there, as discussed in this section.

62
results". If it all, the situation appears to have deteriorated in recent months, as the spread of the conflict has limited the normal supervision activities carried out by departments; and the quality of work in many areas (such as road construction) appears to have deteriorated. These problems will not be effectively addressed until the monitoring system changes from implicit acceptance of certified reports to verification. The present certification system by appropriate authorities, based on monitoring and supervision by line ministries/departments should of course continue, since they should be primarily responsible for the supervision and management of activities under them; but to ensure credibility of such certification, verification at least on a sample basis and at reasonable intervals by the FCGO is essential. Otherwise, the new fund release system also will not be effective and is likely to lose its credibility. 139. Even though the FCGO is an independent institution headed by the Financial Comptroller General, and is not under the Ministry of Finance, a major weakness of the FCGO in this regard, apart from inadequate capacity and the absence of a verification orientation, is its relationship with the Ministry of Finance. The head of the FCGO, a special class designate who is equivalent to the Secretary level, currently reports directly to the Finance Secretary. This in effect makes the FCGO very much a junior partner and undercuts the morale and efficiency of its staff. To make the FCGO’s role more effective, it is desirable to make the FCGO more independent. Its functions should be redefined to focus equally on monitoring of implementation/physical progress, as much as on financial monitoring; and it should be adequately staffed and trained for this purpose. The head of the FCGO should be re-designated, for example, as "Secretary, Expenditure Management and Progress Monitoring", and made directly accountable to the Finance Minister for budget implementation. Thus, while the Finance Ministry would be responsible for preparing and managing the integrated budget and maintaining fiscal discipline, including issuance of financial rules, regulations and guidelines, an independent FCGO could implement/enforce the budget allocations and guidelines set by the Finance Ministry. 140. At present, the NPC is also responsible for monitoring implementation of the Development Budget and for providing feedback to the higher (national) level monitoring committee chaired by the Prime Minister. But, NPC's monitoring capacity is also severely limited, and it suffers from the same weaknesses: lack of staff with requisite skills, absence of field/verification orientation, excessive reliance on line ministry reporting (whom it is supposed to check) on progress, and weak operational linkages with FCGO's financial reporting. There is also some confusion and overlap of functions with the National Vigilance Center, which also is now expected to carry out some monitoring functions. This overlapping system needs to be clarified and redefined; and to the extent that the FCGO is vested with the primary responsibility for verification of physical/implementation progress, NPC would play a lesser role in that regard. For example, the NPC should focus more on poverty monitoring. In addition, while the NPC should continue to carry out its overall servicing functions for the higher level Committees (NDAC and MDACs), it should work closely with the FCGO relying on the latter for progress monitoring. For this purpose, as well as to implement the ambitious PMAS agenda for poverty monitoring, the NPC's monitoring capacity should be strengthened. 141. The higher level monitoring-- at the ministerial level by Ministerial Development Action Committee (MDAC) chaired by respective Ministers, and the National Development Action Committee (NDAC) chaired by the Prime Minister, are still not functioning well. Although they have been reactivated, after falling into disuse a few years ago, they still do not meet regularly in order to be effective. Part of the reason for these lapses may be the diversion of attention of the Prime Minister and the Ministers to pressing political matters, as well as frequent changes in the Council of Ministers, distracting them from focusing on key development issues. This trend

63
is likely to continue until a greater degree of political stability is achieved. The MDAC last met over four months ago and the NDAC over seven months ago, instead of the expected 2 and 4 months frequency respectively. This is illustrative of the inadequate attention being paid to the monitoring function, which needs to be corrected if implementation progress is to improve. 142. Another major reason for the absence of an effective physical/implementation progress monitoring system has been the lack of a timely and systematic information base (across the ministries, departments and agencies) for such monitoring. Although each spending unit is expected to prepare its work program early in the fiscal year indicating activities to be undertaken with the budget allocations and get it approved before funds are released, this has not been done on a timely basis. Moreover, the work programs often lack specificity and clarity about what they plan to achieve. The preparation of output/activity based business plans for five line ministries (discussed above) is an important beginning towards addressing this need. But, it is important to recognize that this approach will need to be implemented in a phased manner, until capacity is built up as suggested above. 143. Another change that can help to speed up implementation and enhance operational efficiency is to advance the budget preparation cycle. Traditionally in Nepal, implementation activities do not begin until the end of the first trimester, and then expenditures pick up dramatically in the third trimester, in a "spending frenzy" to utilize the budget allocations before the fiscal year ends. The 3–4 month delay in starting up activities so far every fiscal year is often explained by the fact that after the Budget is announced in early/mid July, parliamentary deliberations take about 3 months; and work programs are finalized only after the budget is formally approved around October. With no Parliament sitting now, this is no longer a valid reason; nor should it be one even when a new Parliament is reconstituted/reconvened. In practice, when the budget is approved, the individual agency/activity allocations are hardly ever changed, so that work program finalization and implementation can begin much earlier. Under the new procedures, even though spending units are assured of quick funding, the implementation/expenditure cycle has not changed so far. In each of the last 3 years, the actual pattern of implementation/expenditure has remained much the same as in earlier years. This in turn contributes to implementation delays, bunching of activities in the third trimester and underutilization of allocated funds virtually across all sectors. To ensure that implementation activities can begin early, the government should consider advancing the budget preparation and work program cycle by about 3 months at least. J. Poverty Monitoring 144. Following the formulation of the Tenth Plan/PRSP, the Government has made new arrangements specifically for poverty monitoring. A separate poverty-monitoring unit has been created within the Monitoring and Evaluation Division of the NPC. In addition, the Government has also prepared a comprehensive national framework—Poverty Monitoring and Analysis System (PMAS)29—for this purpose, and begun to implement it. The PMAS aims at supplementing poverty monitoring information collected through normal monitoring activities and processes of the Government through an array of periodic, specialized and longer-term surveys. For example, a Nepal Living Standards Survey (NLSS) is planned every 6 years; national household surveys every 5–6 years; a Nepal Demographic Health Survey (NDHS) every 3 years; Public Expenditure Tracking Surveys (PETS) for a specific sector/sectors every year, (three have already been conducted over the past year for education, health and rural roads); 29 See "Poverty Monitoring and Analysis System, Framework Document", National Planning Commission, May 2004.

64
and special surveys for monitoring targeted programs for the poor, (for example, surveys are currently under way in two districts focusing on scholarships for targeted groups and supply of school text books); and service delivery impact surveys, (one is currently under way in Siraha district covering education, health, drinking water and agriculture). PETS is a sample survey based on an evaluation monitoring system whereas IAS is a detailed population survey of the expenditure system. Both PETS and IAS will need to be strengthened in order to enhance MTEF operations including better reporting between NPC and the line ministries. In particular, PETS will need to be strengthened for the purpose of improving the monitoring of physical progress of the priority sector projects as well as addressing the fiduciary risk of the investments on such projects. In addition, the scope of the Internal Audit System (IAS) will need to be reformed to include overall monitoring of all projects. A proposal to implement a District PMAS in collaboration with the Ministry of Local Development (MOLD) is also under consideration. These survey-based information is being supplemented by participatory and qualitative information collected through other stakeholders, such as donors and NGOs and INGOs. 145. This represents significant progress so far. Particularly noteworthy is that fact broad agreement has been reached with key donors (who had earlier conducted separate specialized national surveys of their own) to streamline their activities within the overall national framework. Nevertheless, much remains to be done: developing domestic capacity to carry out an ambitious program of periodic surveys; analyzing data and information and providing feed back the policy and decision makers; securing technical and financial support for carrying out the work, particularly in light of resource constraints noted earlier; and coordinating/harmonizing donors' activities to support/supplement the government's efforts. In addition, as noted above, poverty information tracking under the regular expenditure monitoring system of the government will need to be improved, for example, by introducing poverty codes into the budget classification. K. Expenditure Reporting and Oversight 146. Compared to the situation a few years ago, there are significant improvements in the expenditure reporting process. Key government documents such as, Budget documents, MTEF, PRSP, PMAS, Development Forum documentation are all available on the websites of the Ministry of Finance and NPC. The Government's budget classification has also been improved with the adoption of the current/capital classification, and summary information in the GFS format is also available. But, more could be done to improve transparency through disclosure of additional information (see below). 147. As discussed earlier, a major deficiency of the present system from a transparency perspective is the absence of effective oversight mechanisms. While the Auditor General's Annual Report from 2001–2003 have been released to the public, however, IAS need to be strengthened to improve OAG reporting. In the meantime, other means to strengthen public dissemination should be pursued including providing greater disclosure of budget/expenditure and audit information to the public as an alternative option. For example, the Auditor General's Annual Report should be put on the OAG’s website; and line Secretaries should be required to ensure that corrective actions are taken at the ministry levels on major audit violations (above specified limits). Line ministries should monitor the status of actions taken against OAG’s recommendations and report publicly the status of such actions taken through their websites. Key recommendations agreed in the CFAA Development Action Plan pertaining to improving financial accountability should be monitored, implemented and publicly reported through the MOF website.

65
148. Public disclosure of expenditure reporting by line ministries as well as special surveys (such as PETS) carried out from time to time will help to further enhance transparency and accountability. For example, business plans of line ministries, work programs, expenditure statements and reports on financial and implementation/physical progress should be disclosed through their respective websites. Similarly, FCGO's annual budget report on overall government expenditure performance should also disseminated over its website. L. Treasury management 149. As discussed, Nepal has made significant progress in addressing problems which hampered cash management earlier. An improved accounting framework and computerization of DTCOs now enable more comprehensive and timely expenditure reporting and monitoring. Procedural improvements with regard to freeze accounts and payment procedures as well as the adoption of the government's expenditure reporting system for reimbursements by the major donors have helped to reduce the end year float, carry over of 'unbudgeted' expenditures into the next fiscal year, and the volume of reimbursement claims that is disallowed annually. All these have helped to reduce the amount of cash balances that used to be tied up, for one reason or another, in earlier years. 150. However, a number of improvements can be made to further improve cash management. (i) The process of computerization and linking the remaining eight districts electronically would help improve information flows and expedite monthly and annual account reconciliation. This in turn would help to reduce the freeze accounts/carry over of 'unbudgeted expenditures'. (ii) The new procurement law and regulations together with recent improvements in accounting and expenditure reporting will need to be supported by stronger monitoring and verification capability in the FCGO and the DTCOs. Together, these improvements should encourage the adoption by the remaining donors of the government's accounting and reporting system as the basis for reimbursement decisions. This in turn should help expedite processing and further reduce ineligible claims. (iii) Even more critical for cash management decisions are ensuring greater predictability of aid disbursements, particularly cash aid through budget support, sector support and program loans. While the timing of actual disbursements would depend on the fulfillment of related conditionalities by the government, as discussed, greater donor involvement in the estimation/planning of such disbursements and periodic joint reviews of progress will help to firm up such estimates and facilitate contingency planning. (iv)Given the uncertainties relating to cash aid inflows, greater attention will be needed in regard to domestic resource mobilization policy including decisions on the quantum and timing of issuance of Treasury bills and bonds and the extent to which these funds are properly synchronized with the expenditure patterns. This is particularly important if the budget preparation cycle is advanced, and the implementation process begins earlier in the first trimester itself. The Government then will need to borrow more early in the fiscal year; and the trimesterly borrowing ceilings agreed with the IMF will need to adjust accordingly. However, this should not be at the expense of the agreed annual ceiling; and the government will need to exercise even greater discipline in cash budget planning and expenditure management to ensure that a hard budget constraint is set at the very beginning and that recourse to overdrafts will be limited to financing only those activities which are high priorities. (v) Finally, the overall budget framework itself can, and should, be improved by bringing revenue and expenditure items which are currently "off-budget" within the budget framework. Thus, all revolving funds should be brought within the Consolidated Fund and allocated through the Appropriation Bill in order to improve accountability and budget discipline over public resources; and the receipts of such funds, as well as the large amounts of technical assistance provided by the donors, should brought within the budget. A start has already been made in this direction, as some of the larger donors have

66
agreed to place funds for technical assistance in a separate fund, to be appropriated by the Government according to its needs. But, the good administrative arrangements need to be developed for this purpose to ensure that professional expertise, both domestic and foreign, can be hired expeditiously, as required. M. Public Enterprise reform 151. As discussed above, public enterprises continue to be a major drain on the budget, which the Government can ill-afford, particularly in view of the difficult fiscal outlook for this year and at least the next few years. PEs' losses could be higher if early actions are not taken to address the problems of the larger enterprises, such as the NOC and NEA. Although the Government has so far encouraged NOC to finance its operating losses through bank borrowing and has avoided providing direct government guarantees to lenders, such losses will eventually be a charge on the government budget. Similarly, there are other possible contingent liabilities30, since PEs' reported assets are significantly below actual liabilities when accrued taxes and employee obligations are included, all of which eventually will have to be borne by the government. 152. Given the history of poor performance, it is not realistic to expect that the Government's current strategy of half-hearted privatization through divestment of minority shares in the share market and by improving management and results of others through performance contracts will help to improve PEs' performance significantly. International experience shows that the first modality is useful in bringing in strategic partner/s to restructure the enterprise and improve its management before divestment; but this cannot be achieved by share transfers to multiple minority shareholders. The second modality may involve considerable efforts and oversight, but may not help improve performance commensurately. Keeping existing PEs alive as they are is also not a viable option, as noted above. Accordingly, the only economically rational and logical option is for the government to accelerate the privatization process. In practice this will mean that the problems of the larger 4-5 enterprises (NOC, NEA, NTC, RBB and Royal Nepal Airlines [RNAC]) will need to be addressed squarely, since they own the bulk of the PEs current assets; while a separate strategy will need to be developed to deal with smaller ones through divestment or liquidation. 153. Work is currently under way in Nepal, (with assistance from the Asian Development Bank), to formulate such a strategy for accelerating public enterprise reform and privatization; and this review therefore does not seek to make hasty recommendations of its own. Nevertheless, a few comments on much needed measures are still in order. For example, much work has already been done to restructure and improve the management and operational procedures of the two large banks (RBB, and Nepal Bank Limited—in which the government now holds minority shares) under a financial sector reform project; and the eventual privatization or liquidation of RBB could be dealt with separately as part of that project, as planned. But the real issue here is for the government to effectively support the ongoing efforts of the banks to recover non-performing loans from well-connected defaulters, enforce black-listing procedures and help ensure the speedy resolution of court cases to facilitate the loan recovery process. The 30 There are no firm estimates of contingent liabilities of the public enterprises or of the government at this time. A
study is currently under way; but its results are still not available. "A study commissioned by the UK's Department for International Development (DFID) some time ago estimated the unfunded liability for staff retrenchment and income taxes to exceed $300 million for all PEs"—cited by a draft consultant report "Nepal—Public Enterprise Reform and Privatization", 2004.
67
divestment of NTC is already under way, with encouraging results so far. But, privatization of NOC, NEA and RNAC will face major challenges, particularly of securing political will and commitment for their privatization. Moreover, in the case of NOC, irrespective of the timing/phasing of privatization plans, action should be taken to effectively implement the automatic price adjustment mechanism31 which has been introduced recently, in order to ensure that NOC will not continue to incur further losses. Moreover, information on the automatic price adjustment mechanism together with external oil price trends should be disseminated widely to the public, so that the need for price adjustments is better understood by the latter and political resistance minimized. In the case of both NEA and NOC, opening up public sector monopolies to competition both by allowing private sector entry and by unbundling some of their operations (for example, both power and oil distribution) as planned, are essential to create a more competitive environment, as an essential part of the privatization process. 154. The current thinking underlying public enterprise reform/privatization program formulation recognizes the need to address key problems which have stymied reform efforts so far: the lack of political will and commitment to privatization (by short-lived governments); excessive bureaucratic procedures which require Cabinet approval for even minor decisions involving privatization, (leading to long delays and political interference in decision-making); laws and regulations which impede the privatization process; and inadequate professional capacity to carry out the actual preparatory work, among others. Privatization through the regular bureaucratic process has been slow and difficult to implement; and the need for an alternative approach through the medium of an independent high level Commission is being explored. The key recommendations, drawing on the successful experience of a number of countries such as Sri Lanka, Malaysia, Chile and New Zealand, are likely to include: the announcement of a clearly articulated privatization policy, together with a specific list of enterprises to be privatized, which would be approved by the Cabinet at the outset; the formulation of a small Privatization Committee, (headed by the Chief Secretary and including a few key Secretaries, for example, Finance, Law and Justice and Labor, head of the Privatization Agency, and a representative from the private sector/academia), who would be responsible for the preparation of privatization proposals for Cabinet approval and will have the mandate to actually carry out all preparatory and processing work up to the stage of final approval of privatization by the Cabinet, the creation of a Privatization Agency (staffed by a small nucleus of staff, who will sub-contract preparatory work to specialized professionals) which will provide the necessary support to the Privatization Committee, and will also supervise and manage (with the help of professional boards to be approved) the enterprises to be privatized; supporting legal and regulatory changes to facilitate the privatization process; clear and transparent procedures to be followed for privatization-related activities; and an effective public information campaign to explain the privatization program and policies fully to all stakeholders and the public, among others. Given the privatization from the regular bureaucratic process in Nepal has been slow and realized to be difficult to implement, alternate transparent and independent high-level commission approach may need to be explored. While it is not possible to comment on the specifics of this approach until the proposals are finalized, it does appear to be pragmatic and intrinsically sound; and should be given urgent consideration by the Government.
31 Proposals for the automatic adjustments of oil prices have been submitted to the Cabinet some time ago; but no
action has been taken for several months, mainly for political reasons.

68
N. 155Nepandpaspreslocaotheservthe funcgovboabeedecwill 156envan iandensoveredunot instsitudiscunti 157achThedevis nto alocaappsupentinecreso 158phawhidevdeveco
Decentralization
. The key conclusion of the foregoing analysis is that the decentralization process in al has lost momentum due to the absence of elected local bodies, the effects of the conflict the lack of a political environment which is genuinely supportive of decentralization. In the t, the momentum for decentralization has primarily come from a few important sources: sure from the top from political parties and leaders; demand from bottom up from elected l bodies, their representatives and associations; and also laterally from external donors and r stakeholders who viewed decentralization as an important instrument of improving rural ices and poverty reduction. Recent political developments in the country have eliminated for present the first two sources of support, while the Maoist conflict has sharply curtailed the tioning of local bodies as well as the capacity building activities of donors. Thus, local
ernance has effectively reverted to the pre-1990 situation, with appointed officials and rds (lacking popular support and moral legitimacy) running local bodies. Although there have n encouraging recent reforms which would help to lay the groundwork for faster entralization, to make significant headway in the future, the underlying political environment need to change.
. For accelerating the decentralization process in the longer term, a more conducive ironment is needed. In this context, the restoration of the electoral process in the country is mportant requirement. This will help to bring back the key pressure groups (political parties elected local bodies) to nudge the devolution process forward and, equally importantly, to ure greater accountability and transparency through increased community participation and rsight. The attainment of a measure of peace and political stability through a cessation or ction of the conflict is equally important. If this does not happen, even elected bodies may
be able to function effectively. However, it is difficult to predict how long the ongoing political ability and conflict will continue in Nepal. The recent events in the country suggest that this ation may continue for some time, possibly for the next three years. This section briefly usses what can be done pragmatically to prepare for faster decentralization and devolution l the internal situation improves.
. Even if the local bodies are elected again and a measure of peace and stability is ieved, several things must still be done to make the decentralization process work better. se relate to the overall strategy for decentralization, as well as to the pace and mechanics of olution. Recent experience suggests that a major rethinking of the decentralization strategy ow needed. The current strategy is to devolve functions and responsibilities simultaneously ll local bodies, irrespective of their capacity. Thus, devolution is foisted even upon those l bodies, who are not ready, or are ill-equipped for it. This approach may have been ropriate in the early stages to ensure nation-wide participation as well as to build broad port for the decentralization process; but, at this time it has the effect of slowing down the re process. Also, at a time when the country is facing serious fiscal difficulties, it is essary to ensure that functions and resources are devolved to only those who can use such urces effectively.
. The major exception to the uniform decentralization/devolution strategy has been the sed hand-over of primary schools and sub health posts to communities in selected districts ch are willing to take them over. This approach should be adapted, in a modified form, to the olution process also. The major modification /change that ought to be considered is that olution should be made to those districts (and VDCs and Municipalities within them) who are nomically viable, better prepared in terms management capacity and accountability
69
requirements, and are willing to assume additional devolved functions. Thus, devolution can be phased in, or implemented in stages, depending on the capacity of local bodies. Those with stronger management capacity and economic viability would receive greater devolved functions and resources, while others get them when their capacity improves. Thus, progress in decentralization can be linked to performance and capacity building; and this approach can be developed into a reward/incentive system for local bodies to perform better. 159. It could be argued that such a system will favor districts which are already better off in terms of capacity and resources, and therefore will exacerbate regional/district level disparities (horizontal imbalances). This of course is true; but, it can be offset by providing equalization grants to the less developed districts. (The new formula-based approach for grant funding which is now being experimented seeks to address such imbalances). Such equalization grants however should be given as conditional grants (tied to specific projects/programs), rather than as unconditional grants; and should be implemented through other mechanisms also, (such as line agencies, the private sector, NGOs, community groups etc. since local bodies are assumed to have limited capacity to carry out such functions. At the same time, special attention will need to be given to the capacity building of such districts, so that, over time, they will be able to take over more devolved functions and responsibilities. 160. To help implement such a strategy, several key actions are needed:
(i) Consolidate the existing 75 districts into a fewer number of administratively and economically viable units (re-zoning of administrative districts), and ensure that they have sufficient resources to hire enough staff and skills/capacity to carry out the devolved functions.
(ii) As part of this process, one variant could be to consolidate and classify all districts into three categories: (i) Category 1 to include those that are strong enough to take over more devolved functions; (ii) Category 2 to comprise those who are not quite ready, but are able to graduate in time; and (iii) Category 3, to include the weaker and more backward districts which are least ready for, and capable of, taking over additional devolution, but who should be targeted for more intensive capacity building efforts, (as well as for more conditional equalization grants).
(iii) Clearly define functions and responsibilities assigned to various levels of government, in order to eliminate existing overlaps. The conflicting provisions which currently exist in various laws and regulations that are at variance with the LSGA should be amended/eliminated as part of this process.
(iv) Establish a clear plan indicating which sectors and activities/functions will be devolved to each level, together with clear indications of the performance requirements for the graduation process (see below). Studies have been recently completed for expenditure assignment or are under way to review the administrative zoning aspects; these studies should provide a good basis to help develop the modalities for the new approach. In addition, the DIMC should be reactivated to help implement these arrangements.
(v) Strengthen capacity building for resource mobilization, expenditure management, (including project design, selection and prioritization and implementation), and accounting and reporting. Establish clear guidelines regarding performance standards and reporting and transparency requirements.
(vi) Establish a comprehensive and coordinated training program, which covers all districts, with funding and technical support from donors. Donors should be encouraged to contribute to a common T.A./training pool, rather than running

70
separate programs on their own. While all districts should receive such training for capacity building, it should be prioritized to support those receiving additional devolution, while paying special attention to the needs of the least developed districts.
(vii) Provide effective arrangements for staffing (technical, financial and accounting) and personnel management. Establish a Local Government Civil Service for this purpose; transfer technical staff from line ministries to districts along with the devolution of functions, and make them accountable to local bodies rather than central agencies. This would involve reassignment of large numbers of central government staff over time; and given the inability of the government to maintain redundant staff at any level (whether local or national) for fiscal reasons, a thorough assessment of the staffing needs of the central government and its agencies should also be undertaken at the same time (see below).
(viii) Review and clarify the roles of the line ministries and agencies on the basis of the overall devolution/decentralization plan (see above). In particular, clarify the role and functions of MOLD and strengthen its capacity so that it can focus on its primary role---supervision, monitoring and capacity building of local bodies. Simultaneously, the capacity of both the district level offices of the FCGO as well as the Auditor General’s Office should be strengthened, in order to ensure compliance with accounting and auditing requirements. As noted above, the functions and responsibilities of line agencies should be reviewed and refocused to provide technical support to and supervision of local bodies as an important part of their work.
(ix) Establish an incentive framework for local bodies, which would include both rewards for good performance and penalties for non compliance. Local bodies should be subject to the same financial discipline that is now being enforced at the central level. It is therefore important that devolution, capacity building and accountability should go hand in hand; and the adoption of a phased approach to decentralization is aimed at ensuring such discipline. Accordingly, once tasks and resources are devolved to local bodies, the accounting and reporting requirements should be strictly enforced; and fund releases to local bodies should be withheld in cases of non compliance, as in the case of line agencies. At the same time, the existing funding mechanisms to local bodies should be reviewed to address both equalization and incentive aspects. The amount of unconditional grants should be related to performance in capacity building and accountability improvements; those local bodies who are able to use funds better and are more accountable should receive proportionately more unconditional grants than their counterparts. Conversely, local bodies with less capacity and accountability for expenditure management should be receiving proportionately more conditional grants (if justified by equalization considerations), which would be implemented through alternative arrangements (see above) and monitored closely. Performance norms for both unconditional and conditional grants, as well as for the mobilization of revenues through assigned taxes should be set for local bodies, so that they have a clear understanding of what is expected of them.
(x) Provide matching grants, linked to the attainment of performance benchmarks, to local bodies to encourage them to do better. Such matching funds could be as additional unconditional grants which can be spent on discretionary local priorities, so long as adequate accounting is provided for the amounts spent. Similarly, additional revenue assignments should also be linked to the degree of success of local bodies in collecting taxes from existing sources, in order to provide incentives for improved performance.
71
ANNEXES

72 Annex 1
ANNEX 1: IMPROVING PUBLIC FINANCIAL MANAGEMENT KEY ACTIONS FOR THE FUTURE
Area Key Actions Time Frame Short Term Budget Management
•
•
Fulfill budget support conditionalities to ensure projected aid disbursements; If not feasible, reprogram spending priorities;
• Advance preparation of Mid Year Budget Review, • Restrain additional current exp. demands; • Further prioritize P1
s, and stop funding others;
Immediately
Budget Framework/Resource Estimates
• Ensure realistic and credible budget framework; resource estimates;
• Set much tighter Resource Envelope for next year (FY05/06);
• Involve external partners in aid estimation process; • Incorporate all trigger conditions for securing aid in
IAP; • Discuss Budget framework and IAP (trigger
conditions) with political leadership early and reach agreement;
• Periodic (trimesterly) joint review of progress by government and major external partners;
Annually Annually Annually Annually Quarterly
Revenue Mobilization • Take measures recommended by Taxation Reform Task Force and the IMF to broaden tax base and strengthen tax administration;
• Fully operatinalize Large Tax payers’ Office; • Implement Three Year Customs Reform Plan,
regularly update import valuation system; • Expand training, supervision and monitoring of staff,
and introduce performance-based incentive system;
Annually Ongoing Ongoing Ongoing, FY05/06
Regular/Current Expenditure
• PERC/MOF to review expenditure commitments made so far, in order to assess implications for next budget and for medium long term;
• Estimate legitimate needs, based on budget integration and unit costing;
• Restrain wage increases within cost savings through staff reductions and contracting out support functions and revenue increases;
Immediately FY05/06 Budget FY05/06 Budget
MTEF Process • On the basis of above actions, set/restore "hard budget" constraint for next budget and MTEF 4 for FY 05/06-FY07/08;
Short Term
MTEF Preparation •
• •
•
Fully internalize preparation. MTEF to be prepared by line ministry teams, with NPC guidance, and using consultants; Integrate MTEF into the budget preparation cycle; Advance MTEF/budget cycle from FY06/07 onwards; MTEF preparation to begin in November; MTEF/Budget to be announced by May each year; Prepare work programs and approve them implementation at start of new fiscal year;
Short Term Annually Annually

Annex 1 73
Area Key Actions Time Frame Budget Integration •
•
Fully integrate regular/current and Development/Capital budgets; Prepare MTEF 4 for all expenditures;
Short Term Annually
Unit Costing •
•
Require all Ministries to specify cost assumption underlying their expenditure requests/work programs; Revise/update annually, on the basis of actual costs and field testing;
Short Term Annually
Expenditure Prioritization
• Review prioritization criteria and apply them more rigorously to match PRSP;
• Set P is at a more manageable level (e.g. at 60% instead of current 75%);
• Introduce poverty codes in the MTEF and Budget;
Short Term Short Term Short Term
Project Screening and Evaluation
•
•
Introduce explicit screening and approval system for new projects; Ensure implementation plan and annual work programs are prepared at time of project approval;
Short Term Short Term
Business Plan Preparation
•
• •
Prepare business plans for MTEF 4 for five key sectors, (linking outputs/intermediate indicators, activities, and budgets); Prepare work program on the basis of business plan; Extend business plan preparation to all line ministries;
Short Term Short Term Short Term
Monitoring and Evaluation
• To improve credibility of monitoring process, introduce verification of physical /implementation progress on sample basis:
• Redefine role and functions of FCGO, with necessary staffing and training to carry out verification functions;
Short Term Short Term
Poverty Monitoring • Effectively implement the Poverty Monitoring and Analysis System (PMAS);
• Strengthen capacity at various levels (especially Poverty Monitoring Unit in NPC);
• NPC to focus more on Poverty Monitoring, implementation of PMAS system, and servicing NDAC and MDACs;
Short-to Medium Term Short-to Medium Term Short-to Medium Term
Expenditure Reporting and Oversight
• To increase transparency, make work plans and expenditure reports of all line ministries available to the public on their web sites;
• Make available AGO’s annual report and follow up actions taken by ministries on AGO’s web site;
• Strengthen AGO through adequate staffing, training and financial resources;
Short-to Medium Term Immediate Ongoing
Treasury Management •
•
•
•
•
•
Reduce “off budget” expenditures by bringing revolving funds and related revenues and technical assistance funding into the budget; Connect and computerize remaining DTCOs;
Adoption by remaining donors of the government's accounting and procurement framework as the basis for reimbursements; Advance the budget preparation cycle in order to avoid bunching of expenditures in third trimester; Ensure greater predictability of cash aid from donors (as discussed above); Change domestic borrowing pattern accordingly to smoothen likely imbalances between cash inflows and outflows; Adjust trimesterly ceilings accordingly;
Medium Term Dependent on progress of rural electrification. Medium Term Medium Term Medium Term
Public Enterprise Reform/Privatization
• Formulate new privatization policy, with a specific list of public enterprises to be privatized and obtain
Short Term .

74 Annex 1
Area Key Actions Time Frame Cabinet approval, (as recommended by ongoing T.A.);
•
• •
•
•
Establish new institutional arrangements and transparent procedures (as recommended by the study) to accelerate process work and reduce political interference in the privatization process; Implement new policy; Without waiting for new policy, implement automatic price adjustment formula for oil products, to prevent further losses by NOC; Implement unbundling of distribution functions of NEA and NOC both to increase operational efficiency/reduce losses, as well as to create a more competitive environment; Enforce blacklisting and legal action against defaulters in order to help banks recover non-performing loans;
Short Term . Medium Term Immediate. Short Term Medium Term
Decentralization Improve enabling environment: • •
Restore elected bodies; Take steps to mitigate conflict;
Modify existing decentralization strategy and adopt new approach of phased devolution only to viable units: • Consolidate 75 districts into more viable units, rank
local bodies into 3 groups according to capacity; devolve additional functions to viable units with sufficient capacity (as they graduate from lower categories);
• Clearly define functions and responsibilities of various levels of government; eliminate overlaps and provisions in other laws which conflict with LSGA;
• Establish clear plan for phased devolution: which sectors and activities, and when; Set criteria for graduation from one category to higher.
• Strengthen capacity building through comprehensive training program; Prioritize training to recipients of immediate devolution and capacity building of the weakest units (category 3);
• Provide adequate staffing and technical support; Set up local; government civil service; Reassign central staff to local service; Parallel reduction in central staff;
• Clarify/redefine MLD role; Strengthen MLD capacity; line ministries to provide technical support; Strengthen FCGO/AGO;
• Establish incentive framework for local bodies: link additional devolution and unconditional grants to capacity building and accountability performance.
Medium Term Over the next 2 years, Short-to Medium Term Short-to Medium Term Short-to Medium Term Short-to MediumTerm Start soon as possible. Strengthen and expand program annually to reach all local bodies. Short-to Medium Term

Annex 2 75
ANNEX 2: INTRA-SECTORAL ALLOCATIONS
I. INTRODUCTION 1. A major problem has been the disconnect between the development plans on the one hand and sectoral programs and activities on the other. As discussed in PER, there were considerable misallocations of resources within key sectors. The MTEF and its prioritization process have helped to considerably reduce these distortions, align sectoral activities more in line with the overall thrust of the Tenth Plan/PRSP, and improve the internal consistency of sectoral programs. While there is more to do at the sectoral level in further improving the prioritization and better aligning sectoral activities with sector objectives and expected outcomes, the progress that has been achieved so far is significant. The improvements in the major sectors in this regard as well as shortcomings are discussed briefly below. 2. Intra-Sectoral Allocations. The education sector has made commendable progress in realigning its sector program and budget allocations to support PRSP goals. The main focus of the education sector program is to improve access to, and quality of primary education for all children and expand literacy programs (to help improve livelihoods of deprived groups, women and the disadvantaged). It also pays increasing attention to secondary (especially lower secondary) education, while encouraging vocational and technical training and higher education, particularly through increased private sector participation. To bring about improvements in access and quality of primary (and secondary education), it has adopted a strategy of decentralizing school management to school management committees and transferring to them the responsibility for recruitment and supervision of teachers. Public funding is being provided for these activities, for necessary recurrent expenditures, construction of physical infrastructure, providing attendance incentives (cash grants and school meals) for girls and children from disadvantaged groups, and for teacher training and curricula improvement. All of this has been integrated within the framework of an "Education for All" (EFA) sector program, which has been formally adopted by the Government and is being financed (from FY04/05 onwards) by a consortium of five external donors. And, as a part of higher education reforms, grades 11 and 12 which were earlier included in higher education, will be integrated in the higher secondary level. 3. Resource allocation within the education sector has been realigned to support these policy and program changes within the sector. (Annex 2-Table 1 includes both development and regular expenditures, since about 80% of the sector expenditures are typically regular/recurrent in nature). While the education sector development budget has nearly doubled in the last five years, 60% of this increase has been channeled to primary education; and the share of primary education in the sector budget has accordingly risen from 50% in FY99/00 to 55-59% in the last two years. Similarly, the share of secondary education has increased steadily from 20% to nearly 25%. The major reduction in funding has been for higher education, (included in Table 10 "under technical and higher"), where private investment is being encouraged and has increased rapidly in the last few years. The share of technical and higher education in public spending thus fallen from 24% in FY99/00 to 16% in FY04/05, with higher education proper falling from about ___% in FY99/00 to about 6% currently.

76 Annex 2
Table A2.1: Changes in the Education Sector Budget
Item
FY99/00 FY00/01 FY01/02 FY02/03 FY03/04 Estimate
FY04/05Budget
Education Sector (Rs. billion) 9.3 11.0 13.0 13.2 14.4 17.9Of which "pro-poor" (Rs. billion) 7.1 8.8 10.5 10.9 11.6 14.6Expenditure Shares (%)
Primary Education 49.5 53.6 53.8 59.1 57.6 55.0Secondary Education 20.4 21.8 22.3 22.7 22.2 24.6Technical and Higher Education
23.7 20.0 19.3 17.4 18.7 16.2
Educational Development 6.4 4.6 4.6 0.8 1.5 4.2Total 100.0 100.0 100.0 100 100.0 100.0Source: Budget Documents. 4. Health is a major sector which is pivotal to the poverty reduction effort. At the beginning of the decade, as pointed out in the Public Expenditure Review, the sector suffered from several weaknesses: (i) Overall expenditures on health (a little over $3 per capita per annum) was very low even by the average developing country standards; (ii) Rural areas which are far more dependant on publicly provided health care, were badly underserved, in terms of access to/coverage and quality of such services, (due to poorly trained and inadequate staff; lack of even basic drugs and medicines in health centers, absenteeism of health workers etc; (iii) The pattern of public expenditures in the health sector had become increasingly skewed the wrong way; in FY97/98 nearly half (45%) was spent on hospitals which generally benefited the relatively better off urban population; while (iv) health services (such as family planning, safe motherhood and child health, control of communicable diseases, HIV/AIDS etc) were poorly funded, (53% of health sector spending); (v) Management capacity for supervision and regulation of service providers in the health system was poor; and (vi) The sector was one of the least efficient in utilizing its sectoral budget allocations, (less than 70% utilization rate). 5. The Tenth Plan/PRSP seeks to address these deficiencies and to bring about major improvements in the delivery of health care to rural areas. Its key sectoral objectives include: extending essential health care services to all, with special emphasis on the rural poor, expanding maternal and child health and family planning services particularly for the rural population, and ensuring effective control of communicable diseases (such as Malaria, Tuberculosis and HIV/AIDS). To achieve these objectives, a range of programs/activities are to be undertaken: construction of 250 new sub-health posts to increase access; local recruitment and adequate staffing and training of health workers; expanding supply of drugs and medicines to improve quality of services; expanding maternal, child health and immunization programs and strengthening health planning, supervision and monitoring mechanisms, among others. 6. To help carry out this program, during the budget crisis of FY02/03, (the first year of the Plan/PRSP), health sector spending was protected at prevailing levels; and a number of important policy and operational changes were made in the health sector: The sectoral development program was prioritized, with the key activities identified above rated as P1
s, and given priority in funding; (ii) The main spending cuts in the sector fell on hospitals and hospital construction; (iii) As in education, a major policy shift was made in 2002 to improve delivery of health services in rural areas and its efficiency and accountability by decentralizing the operation and management of sub-health posts to community management, together with financial and human resources, in 10 districts. This program is being significantly expanded; and another 10 districts were brought under community management (bringing the total to 20, out of

Annex 2 77
75 districts) by FY03/04; (iv) In parallel, the procurement of drugs and medicines (previously centrally procured) has been decentralized to the district level; and the number of health facilities equipped with 15 of the most essential drugs has been increased to over 40% of all such facilities; (v) A programme to upgrade all MCHWs to ANMs has been initiated; (vi) The health sector has been opened up for private provision of (commercial) hospital services; (vii) As the fiscal situation improved, allocations for the health sector have been substantially increased (Table 11); and (viii) Recently (in November 2004), a comprehensive sector-wide approach (SWAP) to deliver "Essential Health Care for All" has been adopted, with considerably increased financial assistance from external donors.
Table A2.2: Changing Composition of Health Sector Expenditure
Item FY98/99 FY00/01 FY01/02 FY02/03 FY03/04 FY04/05BudgetIn Billion Rupees Total Health Sector 2.71 3.52 3.86 3.65 4.46 6.70Of which 'Pro-poor'
n.a. 2.03 2.14 2.51 2.97 4.73
Percentage Share (%) Health Services 52.9 69.0 66.1 70.0 68.8 77.6Hospitals 45.2 26.7 30.6 27.7 29.4 19.7Other (Admin. etc) 1.9 4.3 3.3 2.3 1.8 2.7Total 100.0 100.0 100.0 100.0 100.0 100.0
Source: Budget Documents. 7. As evident from Annex 2-Table 2, recent efforts through the MTEF prioritization have helped to significantly improve resource allocation within the sector. While the overall resource allocation for health nearly doubled between FY00/01 and FY04/05, the bulk of this increase (87%) was allocated to health services to support the PRSP priorities. Conversely, the share of hospitals (mostly serving urban communities) has declined progressively. The MTEF process has also facilitated the adoption of the SWAP approach; and, together with new modalities for service delivery through community management, holds out considerable promise for improving efficiency of public spending and accountability in the sector. However, there are major challenges to be addressed in the sector for improving its implementation and absorptive capacity and its technical capacity for management, supervision and regulation of the sector. 8. Drinking water. The Tenth Plan/PRSP gives high priority to the drinking water sector, along with education and health, to improve rural poverty/living standards. The key sector targets include raising national drinking water coverage from a reported 72% (rural 70.9%) in 2002 to 85% by 2007 and sanitation coverage from 25% to 50%. However, effective coverage is believed to be significantly less than indicated above, since 10% of the constructed systems need major rehabilitation and 50% major repairs. 9. Apart from inadequate coverage and poor quality/frequency of service, there have been several problems within the sector: The past investment pattern has been driven largely by urban demands and needs, for which most of the sector's resources had been allocated. However, implementation performance as well as utilization of available funds for urban (and rural) improvements had been unsatisfactory, due to weak and inefficient implementing institutions and lack of focus on necessary improvements in the major urban distribution system, while sufficient attention and resources were not given to meeting rural needs. The adoption of the demand-led community management approach, however, has helped to improve coverage and sustainability of rural schemes in some areas.
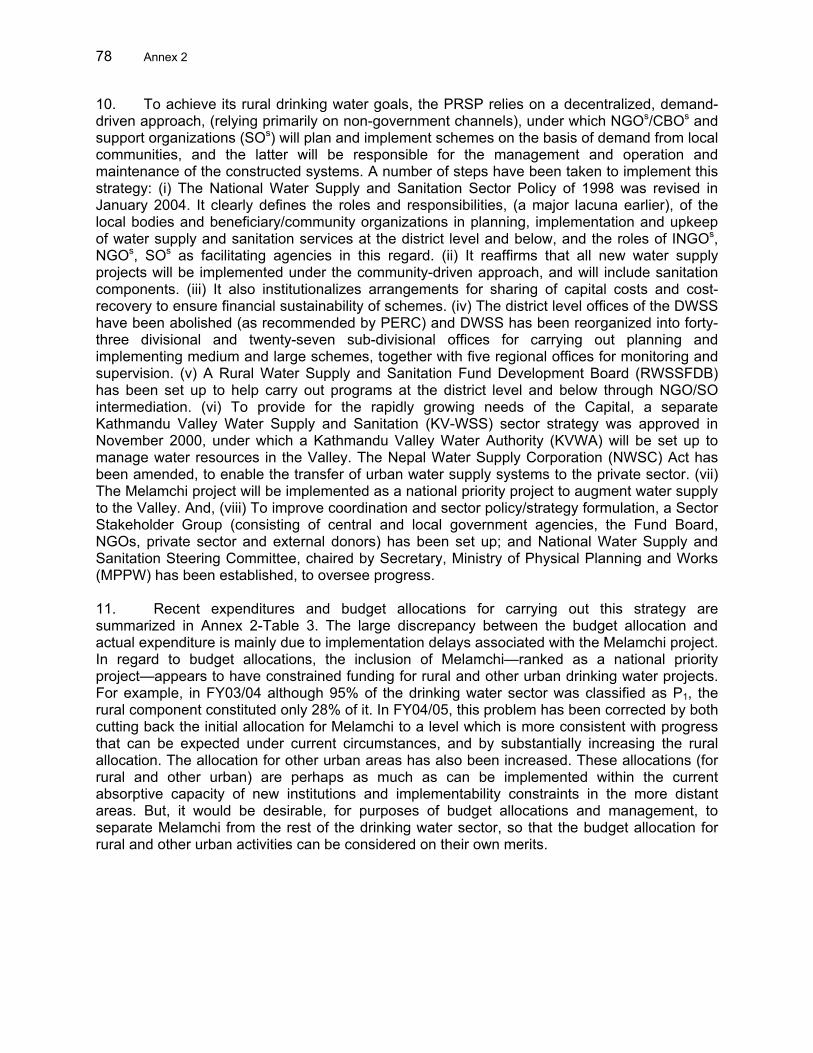
78 Annex 2
10. To achieve its rural drinking water goals, the PRSP relies on a decentralized, demand-driven approach, (relying primarily on non-government channels), under which NGOs/CBOs and support organizations (SOs) will plan and implement schemes on the basis of demand from local communities, and the latter will be responsible for the management and operation and maintenance of the constructed systems. A number of steps have been taken to implement this strategy: (i) The National Water Supply and Sanitation Sector Policy of 1998 was revised in January 2004. It clearly defines the roles and responsibilities, (a major lacuna earlier), of the local bodies and beneficiary/community organizations in planning, implementation and upkeep of water supply and sanitation services at the district level and below, and the roles of INGOs, NGOs, SOs as facilitating agencies in this regard. (ii) It reaffirms that all new water supply projects will be implemented under the community-driven approach, and will include sanitation components. (iii) It also institutionalizes arrangements for sharing of capital costs and cost-recovery to ensure financial sustainability of schemes. (iv) The district level offices of the DWSS have been abolished (as recommended by PERC) and DWSS has been reorganized into forty-three divisional and twenty-seven sub-divisional offices for carrying out planning and implementing medium and large schemes, together with five regional offices for monitoring and supervision. (v) A Rural Water Supply and Sanitation Fund Development Board (RWSSFDB) has been set up to help carry out programs at the district level and below through NGO/SO intermediation. (vi) To provide for the rapidly growing needs of the Capital, a separate Kathmandu Valley Water Supply and Sanitation (KV-WSS) sector strategy was approved in November 2000, under which a Kathmandu Valley Water Authority (KVWA) will be set up to manage water resources in the Valley. The Nepal Water Supply Corporation (NWSC) Act has been amended, to enable the transfer of urban water supply systems to the private sector. (vii) The Melamchi project will be implemented as a national priority project to augment water supply to the Valley. And, (viii) To improve coordination and sector policy/strategy formulation, a Sector Stakeholder Group (consisting of central and local government agencies, the Fund Board, NGOs, private sector and external donors) has been set up; and National Water Supply and Sanitation Steering Committee, chaired by Secretary, Ministry of Physical Planning and Works (MPPW) has been established, to oversee progress. 11. Recent expenditures and budget allocations for carrying out this strategy are summarized in Annex 2-Table 3. The large discrepancy between the budget allocation and actual expenditure is mainly due to implementation delays associated with the Melamchi project. In regard to budget allocations, the inclusion of Melamchi—ranked as a national priority project—appears to have constrained funding for rural and other urban drinking water projects. For example, in FY03/04 although 95% of the drinking water sector was classified as P1, the rural component constituted only 28% of it. In FY04/05, this problem has been corrected by both cutting back the initial allocation for Melamchi to a level which is more consistent with progress that can be expected under current circumstances, and by substantially increasing the rural allocation. The allocation for other urban areas has also been increased. These allocations (for rural and other urban) are perhaps as much as can be implemented within the current absorptive capacity of new institutions and implementability constraints in the more distant areas. But, it would be desirable, for purposes of budget allocations and management, to separate Melamchi from the rest of the drinking water sector, so that the budget allocation for rural and other urban activities can be considered on their own merits.

Annex 2 79
Table A2.3: Expenditure and Budget Allocations for Drinking Water
(Rs billion) Item FY99/00 FY00/01 FY01/02 FY02/03 FY03/04 Est. FY04/05 Budget Budget Allocation 2.71 3.84 3.99 3.77 3.46 3.59
Melamchi 0.44 1.16 1.43 1.82 1.27 1.02 Other 2.27 2.68 2.56 1.95 2.19 2.57
Actual Expenditure 2.49 2.51 2.01 2.15 2.23 n.a. Rural 1.62 1.65 1.15 0.96 0.91 1.75a Melamchi 0.35 0.38 0.57 0.64 0.86 1.02a Other Urban 0.41 0.39 0.22 0.49 0.37 0.66a Other 0.11 0.09 0.07 0.06 0.09 0.16a
Memo Item: Pro-poor Expenditure n.a. n.a. n.a. 0.96 0.91 1.75a aBudget Allocation. Source: Budget Documents.
12. Agriculture, Irrigation and Forestry (broadly subsumed under Rural Development) are central to the PRSP's first pillar---promoting broad-based economic growth in rural areas in order to increase income and employment generation/livelihoods for the rural poor and ensure food security. To accurate agricultural growth, the PRSP relies on the effective implementation of the Agricultural Perspective Plan---diversifying and commercializing agriculture (cereal production in the Terai, and livestock, horticulture and high value crops by developing 'pocket agriculture' in the Hills and Mountains); and increasing agricultural productivity through expanded provision of modern inputs, technology, rural infrastructure and marketing. Irrigation is expected to support this strategy through provision of complementary irrigation facilities (expanding year round irrigated area through new projects, and rehabilitation of existing ones and improved maintenance), while forestry is expected to provide an important source of livelihoods and income generation for the rural poor (through the expansion of community and leasehold programs). In each sector, the PRSP expects the private sector to play an increasingly larger role, (for example, in the delivery of inputs, services, marketing and research in agriculture; user group involvement in administering and operating rehabilitated irrigation systems, private sector involvement in new irrigation projects and managing public systems; and in managing the forestry resources transferred to them). 13. Total expenditure on rural development and its major sub-sectors are summarized in Annex 2-Table 4. For both agriculture and irrigation, despite their importance for promoting rural income growth and poverty reduction, absolute level of expenditures declined in nominal terms in the last two years; while forestry spending increased steadily in nominal terms. In the FY04/05 Budget, allocations for agriculture and irrigation have been increased in nominal terms, more or less to the levels at the beginning of the decade, (implying a significant reduction in real terms), while the forestry allocation rose further by about 10% in nominal terms. But, it is unlikely that actual expenditures will reach anywhere close to this level, for reasons discussed in paras. 14–17 below. It should be also noted that for all three sub-sectors, the development budget accounts for the bulk (over 90%) of total expenditures.
Table A2.4: Expenditure and Budget Allocations for Rural Development (Rs billion)
Item FY99/00 FY00/01 FY01/02 FY02/03 FY03/04 FY04/05 Rural Development 6.68 7.84 7.60 5.96 5.89 7.92
Of which Pro-poor 3.04 3.93 3.96 3.10 2.89 4.13 Agriculture 2.37 2.52 2.79 1.97 2.07 2.68
Of which Agriculture Activities 1.36 1.02 1.20 0.85 0.99 1.24 Livestock 0.49 0.70 0.78 0.58 0.52 0.68

80 Annex 2
Item FY99/00 FY00/01 FY01/02 FY02/03 FY03/04 FY04/05 Other 0.52 0.80 0.81 0.55 0.56 0.76
Irrigation 3.02 4.02 3.17 2.34 2.10 3.34
Of which Surface schemes 2.60 3.43 2.69 1.61 1.24 1.79 Ground Water 0.09 0.15 0.12 0.15 0.18 0.67
Forestry 1.29 1.30 1.64 1.65 1.71 1.90 Source: Ministry of Finance, Budget documents. 14. In agriculture, as well as in irrigation (see below), the observed declines in recent expenditure levels reflect some important recent policy changes, as well as sector-specific factors. For example, as noted in the Public Expenditure Review, at the beginning of this decade, "a substantial part of expenditures in agriculture had been on fertilizer and seed subsidies (20-30% of the sector allocation), research and extension services (20-40%), and livestock (another 18-24%). But over the last few years, fertilizer subsidies have been eliminated, and the role of both Agriculture Inputs Corporation (AIC) and Nepal Food Corporation (NFC) have been streamlined and substantially reduced. This is also true of extension services below district levels which have been transferred to District Development Committees. This has helped to reduce public expenditure in agriculture in the past few years. The new policy changes have also provided some significant benefits in terms of improved fertilizer distribution (by the private sector) and increased private involvement in extension services; and this has contributed significantly to the growth of commercial crops in the Terai, and some hill areas. However, the implementation of the APP---the cornerstone of the agricultural acceleration strategy---still lags significantly behind targets as well as requirements. The development of pocket agriculture and complementary irrigation (see below) in particular has been slow. The Ministry of Agriculture has not shown so far the dynamism, leadership and the vision that is needed to help accelerate the implementation of agriculture sector programs; and this has also been an important factor contributing to the decline in the expenditure share of agriculture. While there are obvious problems, such as the lack of co-ordination among the key ministries involved in the sector (see below), the Ministry of Agriculture has not been able so far to come up with effective programs to scale up sectoral (especially APP) activities and address the coordination problems, even though the development of an integrated sector program for this purpose is an important part of the Government's Reform Agenda1. The Ministry has announced new Agricultural Policies from time to time, including one to promote commercialization of agriculture just recently. But, what is now needed is a comprehensive implementation program to effectively implement the policies which are already in place; and the preparation of activity-based Business Plans, (a new initiative which has just been started in preparation for the next budget), should allow the Ministry the opportunity to do so. 15. In irrigation, the recent reduction in sectoral spending reflects similar changes in policies, and particularly the completion of ongoing large surface irrigation projects. The sector's current emphasis is on rehabilitation and maintenance of the existing system and extending small irrigation schemes/facilities, which will be less resource/expenditure intensive than the construction of large surface irrigation schemes. But, the drop in expenditure levels also reflects the poor performance of the sector in ground water development, which is critical to the effective implementation of the APP. This is in large part the result of sector policies which, in order to eliminate irrigation subsidies, substantially reduced the prevailing subsidy on deep tubewells 1 "The Reform Agenda–––Overview of the Past Performance and Proposals for the Future", HMGN, May 2004;
presented to the Nepal Development Forum Meeting, May 5-6, 2004.

Annex 2 81
and removed it altogether on shallow tubewells. What this policy change has done in practice, (despite good intentions), is to introduce new and bigger distortions in the sector. For example, surface irrigation, (which is highly capital intensive and far more expensive in terms of capital costs), is fully provided by the Government (i.e., the Government bears 100% of the cost). Similarly, while there are regulations for cost recovery, they are not effectively implemented, so that actual cost recovery covers only a fraction (allegedly less than 10%) of the operational cost of such schemes. In effect, while surface irrigation is almost free to the farmer, (in other words fully 'subsidized' by the government), under current policy shallow tubewells are fully charged to the farmer, (even though they are the least cost option in the short to medium term), and deep tubewells partially so. These distortions have sharply reduced ground water development (especially shallow tubewells), undermining the effective implementation of the APP, in addition to the institutional limitations noted above. Both to help improve agricultural growth as well as to remove intra-sectoral distortions in resource allocation in irrigation from a public expenditure perspective, these policy distortions need to be corrected. 16. The new National Water Plan, currently being drafted, recognizes these problems. In addition to longer term optimization of Nepal's irrigation potential (through the development of surface schemes which however will take considerable time---possibly decades---and huge investments), it also recognizes the need to balance short term requirements of providing complementary irrigation relatively quickly for accelerating agricultural growth, (for which groundwater development is better suited). It has therefore proposed a policy of not discriminating against sources of water through discriminatory policies (by ensuring government provision of capital costs of irrigation development from all sources), while leaving the operational costs to the farmers. This is of course not the most rational or economically optimal policy; but it appears to be significantly better than the current policy, and should help speed up ground water development. 17. In forestry, development expenditure is only about 40% of the total sector allocation; and much of the balance is for meeting the operational costs/wages of forest guards. The development component has risen by about 7% per annum in nominal terms in recent years, (i.e. about 2% p.a. in real terms). But, the expansion of community and leasehold programs has been slow, despite their obvious importance for poverty reduction. There are two major factors which have contributed to this trend: (i) The rapid spread of the conflict has limited the pace of development of these programs, even though they are highly desirable; and (ii) The ambivalence of forestry officials towards the expansion of these programs even under more normal circumstances. As and when a measure of peace is achieved, it is essential that greater priority and resources by given to the expansion of community and leasehold forestry programs. A. Local Development 18. Along with education and health, local development has consistently received strong support in terms of budget allocations and fund releases, (except in FY 01/02 when fund releases were temporarily reduced). Decentralization of central government functions and responsibilities to local bodies has been an important policy objective by itself, as well as an instrument to help improve service delivery to rural communities. Accordingly, funding for local bodies (DDCs, VDCs and municipalities) and for devolved local level functions are channeled through the Ministry of Local Development (MLD), which is the apex ministry responsible for supervision and monitoring of local bodies and decentralization activities. More recently, government efforts to initiate/expand income generation, infrastructure development and rehabilitation activities in conflict-affected areas have also led to a significant increase in funding for the local development sector. In the latest FY04/05 Budget, substantially increased

82 Annex 2
allocations have been provided for rehabilitation and reconstruction activities, participatory development, social mobilization and targeted programs through MLD. Much of the expenditure in the sector (close to 90%) are classified as pro-poor. Thus, the increased support for the sector (see Annex 2-Table 5), at least on the face of it, seems broadly consistent with the PRSP and the government's approach/policy stance on conflict management through development.
Table A.5: Government Expenditure /Allocations for Local Development (Rs billion)
Item FY99/00 FY00/01 FY01/02 FY02/03 FY03/04 Estimate
FY04/05 Budget
Local Development 4.10 4.55 3.78 4.84 5.29 6.16 Of which Pro-poor 3.71 4.05 2.83 3.22 4.71 5.62
Source: Ministry of Finance, Budget Documents. 19. Thus, the situation with regard to local development seems to be exactly the reverse of that of agriculture and irrigation—strong political support and government commitment to allocate and release more funds to the sector. There are, however, several risks which need to be recognized, particularly in view of the fiscal outlook (see below): First, is the implementability of the programs to the extent envisaged or funded, given the constraints imposed by the conflict. In many areas, the government administration/bureaucratic system cannot function outside the district headquarters, and in some cases even there. Thus, despite the genuine desire to scale up development activities in conflict areas, this is only possible to the extent that NGOs, CBOs and SOs can carry out such activities, or allowed to do so by the Maoists. Thus, the scale of operation is significantly limited. Second, elected local bodies no longer exist. While appointed officials now manage the local administrations, they are not subject to the same accountability arrangements as earlier. There is thus considerably more scope for leakages and corruption; and there is general recognition that such leakages have indeed increased. Third, expenditure reporting and monitoring mechanisms are weak, even under the best of circumstances. These are not systematically complied with, and are not credible, in the absence of capacity for, and actual, verification. The only safeguard is direct community involvement; but this alone is not adequate. Fourth, given the uncertainties about the fund availability for the budget at this time, pushing more money into local development activities (where they may not be spent well) will mean that other priority activities will have to be cut back, even more than necessary. Tighter control of local development spending on the basis of ability to carry out programs/implementability is therefore necessary.

Annex 3: Immediate Action Plan (IAP) FY02/03
Annex 3
83
Actions Time Frame Immediate Indicators Outcome Expected Progress A. Prioritization • 1. Prioritization of all
expenditures, especially development activities, in 2002/03 budgets to make the budget realistic and also to reflect increased requirements for security by dropping low priority activities.
Immediate Number of projects reduced to an affordable limit by applying appropriate criteria. Flow of resources for priority projects and security needs ensured.
Effectiveness of public expenditure management improved.
• The 10th Plan/ PRSP and the MTEF guided budget preparation for the fiscal year 2002/03.
• Investing for peace is the top priority of the budget of this fiscal
year. The issue of fungibility has been addressed by allocating full funding for the security needs.
• The number of projects were reduced to 470 from last years' 630.
A total of 160 projects dropped applying two sets of criteria i.e. Relevance and Exclusion.
• For the first time, the government came up with a separate annex
(Annex-4) for 100 priority projects (P1) in the Income and Expenditure Statement for the fiscal year 2002/03, commonly known as "Red Book" covering 7 sectors (Education, Drinking Water, Health, Agriculture and Cooperatives, Irrigation, Roads and Power & Energy).
• Prioritizing exercise in the remaining sectors has been completed.
The government has come up with a revised and updated MTEF (2002/03-2004/5). This draft MTEF was discussed in a workshop among participants from civil society, media, government ministries and donor community. Workshop was proved useful in further improving and reshaping the MTEF. Also, useful written suggestions were received from the participants including donors' representatives. The government has already adopted the final MTEF. MTEF encompasses all the sectors comprising about 202 priority one (P1) projects.
• Arrangements have been made to ensure necessary budgets and
timely release to priority one (P1) projects. Now, the NPC and MOF are closely monitoring releases and reviewing project performance.
2. Resource allocation will be
made consistent with the decentralization policy by:
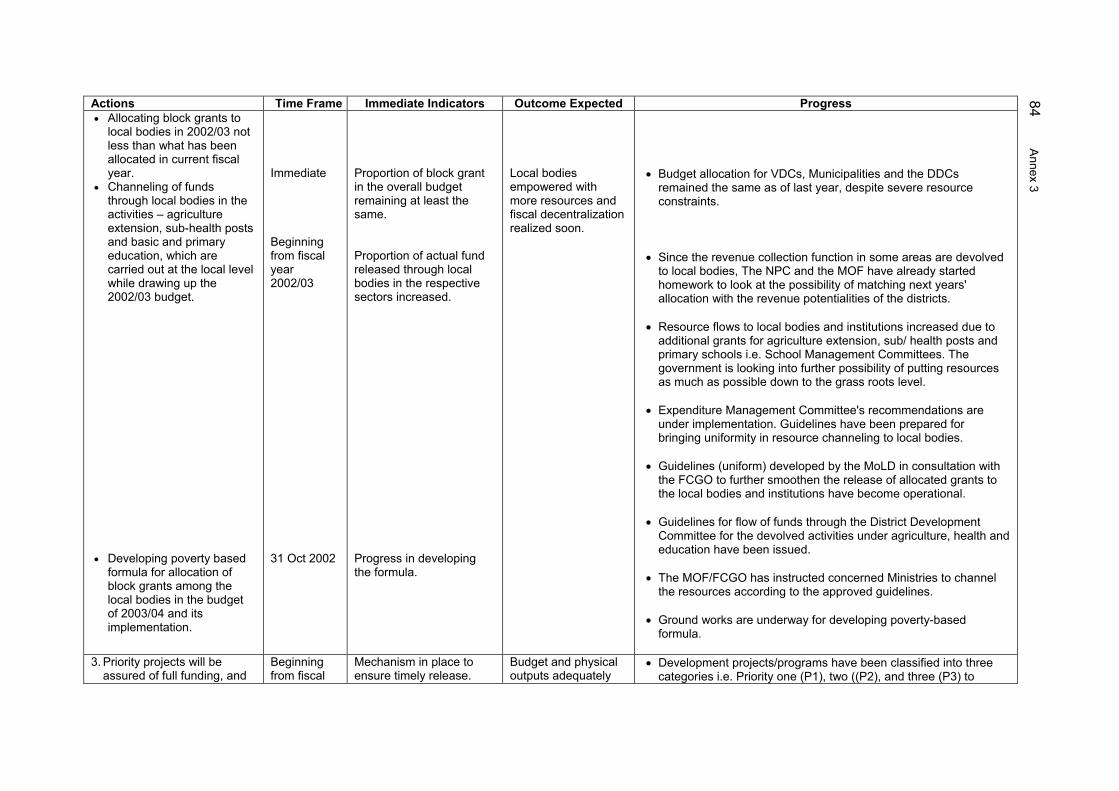
84 A
nnex 3 Actions Time Frame Immediate Indicators Outcome Expected Progress •
•
Allocating block grants to local bodies in 2002/03 not less than what has been allocated in current fiscal year. Channeling of funds through local bodies in the activities – agriculture extension, sub-health posts and basic and primary education, which are carried out at the local level while drawing up the 2002/03 budget.
• Developing poverty based
formula for allocation of block grants among the local bodies in the budget of 2003/04 and its implementation.
Immediate Beginning from fiscal year 2002/03 31 Oct 2002
Proportion of block grant in the overall budget remaining at least the same. Proportion of actual fund released through local bodies in the respective sectors increased. Progress in developing the formula.
Local bodies empowered with more resources and fiscal decentralization realized soon.
• Budget allocation for VDCs, Municipalities and the DDCs
remained the same as of last year, despite severe resource constraints.
• Since the revenue collection function in some areas are devolved
to local bodies, The NPC and the MOF have already started homework to look at the possibility of matching next years' allocation with the revenue potentialities of the districts.
• Resource flows to local bodies and institutions increased due to additional grants for agriculture extension, sub/ health posts and primary schools i.e. School Management Committees. The government is looking into further possibility of putting resources as much as possible down to the grass roots level.
• Expenditure Management Committee's recommendations are under implementation. Guidelines have been prepared for bringing uniformity in resource channeling to local bodies.
• Guidelines (uniform) developed by the MoLD in consultation with the FCGO to further smoothen the release of allocated grants to the local bodies and institutions have become operational.
• Guidelines for flow of funds through the District Development Committee for the devolved activities under agriculture, health and education have been issued.
• The MOF/FCGO has instructed concerned Ministries to channel
the resources according to the approved guidelines.
• Ground works are underway for developing poverty-based formula.
3. Priority projects will be
assured of full funding, and Beginning from fiscal
Mechanism in place to ensure timely release.
Budget and physical outputs adequately
• Development projects/programs have been classified into three categories i.e. Priority one (P1), two ((P2), and three (P3) to

A
nnex 3
Actions Time Frame Immediate Indicators Outcome Expected Progress
85
the release will be based on meeting agreed performance indicators.
year 2002/03
Percentage of actual fund release as compared with allocation.
tied-up. handle the limited cash positions of the government. • Projects in Priority one (P1) have been allocated approximately 56
percent of the development expenditure. One-third of the allocation in the beginning of the fiscal year was made automatic release.
• Annual as well as trimester work plan/program of projects have been approved by the NPC.
• Resources alteration or adhoc virements from projects in Priority one (P1)) is not permitted without NPC's prior approval.
• Relevant Ministries developed performance indicators / benchmarks for monitoring the outcomes in close collaboration with the NPC.
• To monitor especially physical progress and to match release with performance, review format provided in Financial Administration Regulation (Annex-2) and Weightage Progress Report have been merged and a new and improved monitoring format has been developed. A system of budget release for the projects based on performance from the second trimester is already in place. And, the Ministries are working closely with the NPC/MOF to further streamline the release especially to the local bodies.
• System to ensure sufficient funds to priority one (P1) projects has
been put in place. Directives to release funds on the basis of performance against approved indicators have been issued to the District Treasury Offices (DTCO) in all 75 districts.
• According to the directives, projects having first-trimester progress
with 80 percent or more would get automatic release in the second trimester, progress with more than 50 percent and less than 80 percent would get release on the basis of the Ministerial level commitment to recover progress in the second trimester and progress with less than 50 percent would be subjected to detail scrutiny to decide on level of budget release.
• Similar process would take place for the third-trimester budget
release.

86 A
nnex 3 Actions Time Frame Immediate Indicators Outcome Expected Progress
• With regard to budget release specific responsibilities of NPC, MOF, FCGO, line Ministries and Project Offices have been outlined in the directives.
• A team is working on to improve the budget classifications system i.e. recurrent and capital.
B. Implementation Education 4. Formulation of procedures
for transferring management of primary schools to communities.
5. Transfer of public primary
schools to community management and regular grants to school management committees in the form of block grants.
6. Recruitment of primary
teachers handed over to school management committee in community schools.
16 Jul 2002 17 Jul 2002 17 Aug 2002
Agreement formats, outline of roles and responsibilities of communities and local bodies etc. are arranged. 100 primary schools handed over to school management committees and these schools receive HMG regular block grant. Measures in place for recruitment of teachers in these schools (100) by school management committees.
Greater community control over the management of the schools ensured and quality of education improved.
• Guidelines / Procedures for handover of Primary Schools with
regard to school selection criteria, authority of School Management Committees (SMC), role and responsibilities of concerned agencies, auditing and accounting and agreement formats have been approved by HMG. This has been made public and circulated through District Education Offices.
• Draft Amendment Bill to Education Act has already been
forwarded to the Ministry of Law, Justice and Parliamentary Affairs to facilitate schools transfer within the legal framework. 150 Schools in various districts have been approved for hand-over. And, more than 55 schools have been handed over. Agreements between the School Management Committee and the District Education Office are being expedited. To speed up the process of the handover, the Ministry of Education is sending facilitators from the centre to those districts where agreements are being processed. A 3-days training on schools management was conducted. In the meantime, Ministry of Education is further working on handing over 95 more schools as early as possible.
7. Freezing the recruitment of
primary school teachers by the HMG.
Immediately • Provision of block grant to SMC has been made in the budget and the mechanism is in operation and serving regular block grants to SMC.
• Recruitment of Primary School teachers has been frozen through
income and expenditure statement as well. No primary teacher has been recruited since the announcement of the IAP.
• Communication strategies are being designed to facilitate school
transfers. These strategies will disseminate incentive structure, need for communities' involvement, etc to encourage communities to take over the primary schools by School Management Committees.

A
nnex 3
Actions Time Frame Immediate Indicators Outcome Expected Progress Health 8. Management of sub-
health posts by local committees.
9. Verification of attendance
of staff at sub-health posts by the VDCs before issuing pay cheques to them.
10. Arrangement for
compulsory public notice in the sub-health posts regarding the range of services, fees, and opening hours to be verified by VDCs and DHO.
Civil Service Reform 11. Gradual elimination of
vacant civil service positions.
17 Aug 2002 Beginning from fiscal year 2002/2003 17 Jul 2002 Immediate
Local Health Service Institution Operating and Management Committees functioning at least 20 sub-health posts in 10 districts. Measure in place for such verification. Level of compliance by sub health posts At least 7,500 vacant civil service positions will be eliminated by September 2002.
Greater community control over the management of sub-health-posts ensured and delivery of primary health care services improved. Size of bureaucracy streamlined
• Management of 80 sub- health posts -- all 38 of Jhapa district, all
12 of Bhaktapur district and 30 out of 32 of Chitwan district -- have been handed over to the Local Health Service Institutions Operating and Management Committees (LHIO&MC).
• All sub-health posts of Morang, Sunsari, Mahottari, Rupandehi,
Kaski, Kapilbastu, Banke, and Kanchanpur districts are being selected for management handover to the LHIO&MC and are expected to take full responsibility before July 2003.
• Guidelines for management handover of sub-health posts have been prepared and disseminated. Orientation programs are being conducted for Management Committees.
• Authorization letter including instruction to FCGO, MoLD and the MoH to comply with the arrangements of verification of attendance and salary payment has already been made. The government is closely monitoring this arrangement and the Ministry of Health has reported that this arrangement is working well.
• MoLD and MoH have already been instructed to make arrangements for public notification of sub-health post related information and monitoring of the same. MOH has also instructed to its district units accordingly. District Health Offices (DHO) are preparing such notice boards and sending to the sub-health posts.
• 7,500 vacant positions in civil service have been eliminated.
• Further review of other positions and their elimination is expected to be completed by the end of February.
C. Accountability 12. Publishing annual budget
and report of actual expenditure (by local bodies and by line agencies) analyzed by districts at least quarterly.
Beginning from fiscal year 2002/03
Level of compliance by such institutions in publishing their budgets.
Greater accountability of government service providers to intended beneficiaries.
• MOF has issued the letter of authorization containing instructions to carry out these actions to all ministries. Accordingly, the line ministries have also instructed their district offices. FCGO is carrying out this activity.
87

88 A
nnex 3 Actions Time Frame Immediate Indicators Outcome Expected Progress 13. Making arrangement for
posting of budget allocation and expenditures at DDC/VDC offices, health posts, schools.
Within two month of fiscal year 2002/03
Level of compliance in posting of budget
Transparency in budget allocation enhanced.
• MOF has issued the letter of authorization containing instructions to carry out these actions to all ministries. Survey is being carried out to verify the compliance. As reported by DTCOs, most of the districts have complied with this arrangement.
14. Carrying out expenditure tracking exercise to establish the extent to which Government funds actually reach the points of service delivery.
17 Sep 2002 Result of at least one sample from fiscal year 2001/02 data made public.
Trickle down of resources at the actual point of service delivery assessed.
• Under expenditure tracking, 56 Primary Schools are being selected for survey in the first phase covering all 14 zones. Utilization or the expenditure will be judged against the services provided or produced. Pilot testing has been completed. Data is being collected by from the field. Analysis with results as well as recommendations will be finalized by February 2003.
15. No significant increase in the government arrears of public utilities (electricity and drinking water)
17 Sep 2002 Settlement of accounts with NEA, DWC and so on.
Financial health of these entities maintained.
• Three separate Committees on Arrears Settlement comprising representatives from MOF, FCGO, concerned ministries and Public Enterprises have been working on the issue of settling arrears of Nepal Electricity Authority, Nepal Telecommunication Corporation and the Nepal Water Supply Corporation. Committees have come up with preliminary reports with figures to be settled down. Settlements of arrears are being finalized.
16. Adopting a time bound
Action Plan for implementing major recommendations of Country Procurement Assessment Review.
17 Jul 2002
Action plan in place and some small amendments to be made in Financial Administration Rules, 1999.
Public procurement becomes efficient, transparent and accountable.
• CPAR action plan has been finalized. • Financial administration rules and regulations are being reviewed
for necessary amendment and improvements, particularly in areas of procurement.
• Steering committee has already been formed to draft Public Procurement Bill. The Committee has already begun its work. And, preparation of procurement legislation will be completed by April 2003.
• Also, MOF/FCGO are designing a training programme to be given to some 230 people to make them Procurement Expert.
17. Public Works Guidelines
(PWG) made operational 17 Jul 2002 HMG has already
approved. Guidelines will be in operation.
Public works become more effective and transparent
• PWG has been formally circulated by the MPPW. A separate Committee has been set up within the Ministry to monitor compliances. The Project Chief or the Officials concerned have been made responsible to follow these guidelines. In the mean time the Ministry of Physical Planning and Works is planning to establish a special cell and the cell will conduct technical audit of the public works to ensure the quality. Orientation workshops are being conducted to make PWG more users friendly.

A
nnex 3
Actions Time Frame Immediate Indicators Outcome Expected Progress 18. Adopting a time-bound
Action Plan for implementing major recommendations of CFAA and commencement of its implementation.
17 Jul 2002 Action Plan in place and implementation started.
Government financial accountability improved. • Development of Action Plan (DAP) monitoring sub-committee
formed and begun its work. This sub-committee is reporting to Reform Monitoring Committee (RMC).
• RMC is monitoring the implementation of CFAA Action Plan.
19. Developing a comprehensive Anti-corruption Strategy (ACS) and progress in the implementation of such strategy
• Action Plan for implementing CFAA has been adopted and implementation initiated.
17 Aug 2002
Progress in development of anti-corruption strategy and implementation of the strategy
State of governance improved.
• Anti-corruption Strategy (ACS) has been submitted to the cabinet for approval. In preparing this strategies suggestions from a wide range of stakeholders including Pro-public, Transparency international and donor community were considered. A committee under the chairmanship of the Chief Secretary is preparing a time bound action plan. Actions proposed in the action plan will be monitored and evaluated by the National Vigilance Centre.
Key elements of the ACS include: • Establishment of a National Vigilance Centre (NVC). • Citizen's Charter • Time bound services delivery mechanism • Public awareness campaign • Action against bank defaulters • Action against misuse of funds as reported by AGO
The government has also prepared strategic communication and outreach program with a view to build upon the positive experience of the past and scale up the implementation of HMG’s agenda of reforms and poverty reduction in the Tenth Five Year Plan and operationalized through annual Immediate Action Plans.
89
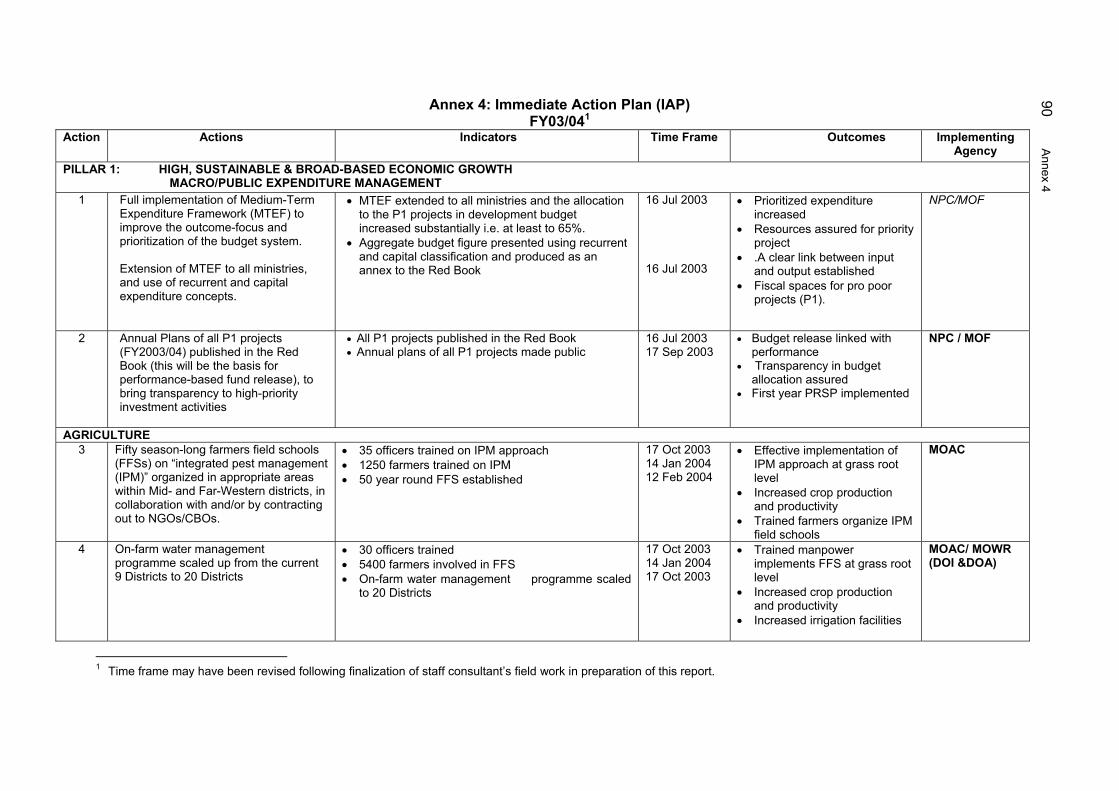
Annex 4: Immediate Action Plan (IAP) 90 A
nnex 4
FY03/04 1
Action Actions Time Frame Outcomes Implementing Agency
PILLAR 1: HIGH, SUSTAINABLE & BROAD-BASED ECONOMIC GROWTH MACRO/PUBLIC EXPENDITURE MANAGEMENT
1 Full implementation of Medium-Term Expenditure Framework (MTEF) to improve the outcome-focus and prioritization of the budget system. Extension of MTEF to all ministries, and use of recurrent and capital expenditure concepts.
• MTEF extended to all ministries and the allocation to the P1 projects in development budget increased substantially i.e. at least to 65%.
• Aggregate budget figure presented using recurrent and capital classification and produced as an annex to the Red Book
16 Jul 2003 16 Jul 2003
• Prioritized expenditure increased
• Resources assured for priority project
• Fiscal spaces for pro poor projects (P1).
NPC/MOF
2 Annual Plans of all P1 projects (FY2003/04) published in the Red Book (this will be the basis for performance-based fund release), to bring transparency to high-priority investment activities
• Annual plans of all P1 projects made public 16 Jul 2003 17 Sep 2003
• Budget release linked with performance
• Transparency in budget allocation assured
• First year PRSP implemented
NPC / MOF
AGRICULTURE 3 Fifty season-long farmers field schools
(FFSs) on “integrated pest management (IPM)” organized in appropriate areas within Mid- and Far-Western districts, in collaboration with and/or by contracting out to NGOs/CBOs.
• 1250 farmers trained on IPM • 50 year round FFS established
17 Oct 2003 14 Jan 2004 12 Feb 2004
Indicators
• .A clear link between input and output established
• All P1 projects published in the Red Book
MOAC • 35 officers trained on IPM approach • Effective implementation of IPM approach at grass root level
• Increased crop production and productivity
• Trained farmers organize IPM field schools
4 On-farm water managementprogramme scaled up from the current 9 Districts to 20 Districts
• 30 officers trained • 5400 farmers involved in FFS • On-farm water management programme scaled
to 20 Districts
17 Oct 2003 • Trained manpower implements FFS at grass root level
14 Jan 2004 17 Oct 2003 • Increased crop production
and productivity • Increased irrigation facilities
MOAC/ MOWR (DOI &DOA)
1 Time frame may have been revised following finalization of staff consultant’s field work in preparation of this report.
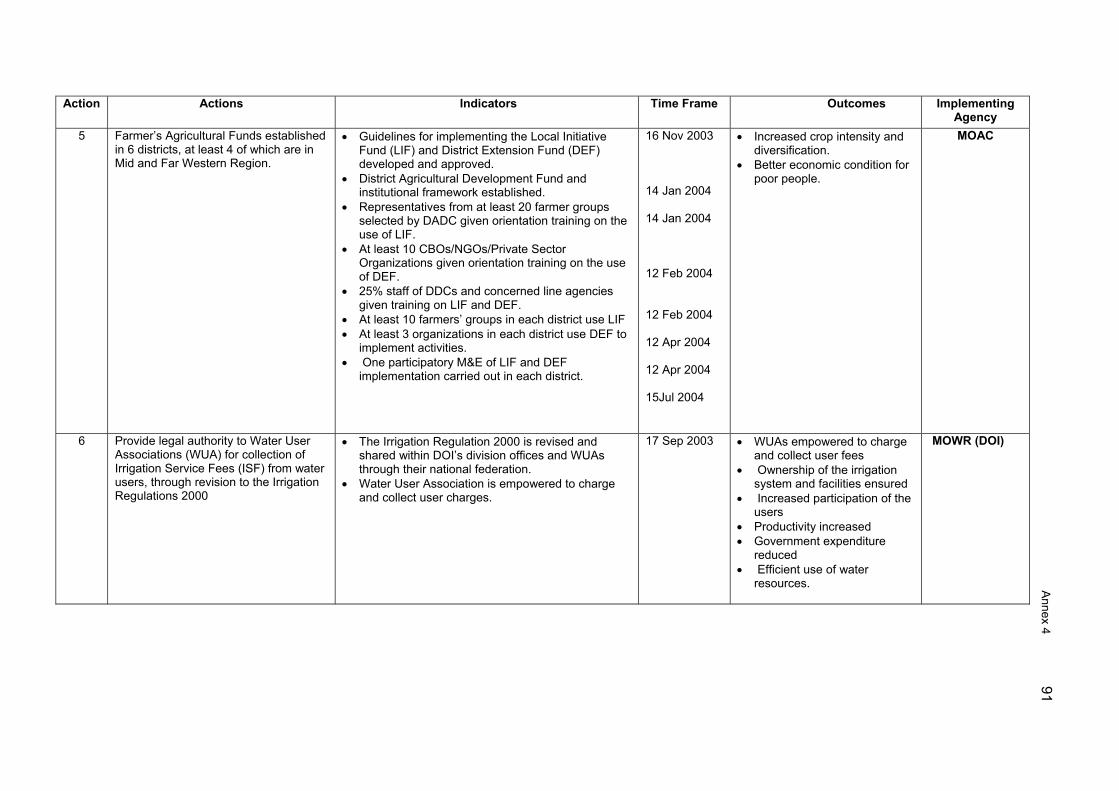
Action Actions Time Frame Outcomes Implementing Agency
Indicators
5
Annex 4
Farmer’s Agricultural Funds established in 6 districts, at least 4 of which are in Mid and Far Western Region.
• Guidelines for implementing the Local Initiative Fund (LIF) and District Extension Fund (DEF) developed and approved.
• District Agricultural Development Fund and institutional framework established.
• At least 10 CBOs/NGOs/Private Sector Organizations given orientation training on the use of DEF.
• 25% staff of DDCs and concerned line agencies given training on LIF and DEF.
• At least 10 farmers’ groups in each district use LIF • At least 3 organizations in each district use DEF to
implement activities. • One participatory M&E of LIF and DEF
implementation carried out in each district.
16 Nov 2003
14 Jan 2004
14 Jan 2004
12 Feb 2004 12 Feb 2004
12 Apr 2004
15Jul 2004
• Increased crop intensity and diversification.
• Better economic condition for poor people.
MOAC
6 Provide legal authority to Water User Associations (WUA) for collection of Irrigation Service Fees (ISF) from water users, through revision to the Irrigation Regulations 2000
• The Irrigation Regulation 2000 is revised and shared within DOI’s division offices and WUAs through their national federation.
• Water User Association is empowered to charge and collect user charges.
17 Sep 2003
• WUAs empowered to charge and collect user fees
• Ownership of the irrigation system and facilities ensured
• Increased participation of the users
• Productivity increased • Government expenditure
reduced • Efficient use of water
resources.
MOWR (DOI)
• Representatives from at least 20 farmer groups
selected by DADC given orientation training on the use of LIF.
12 Apr 2004
91

92 Action Actions Indicators Time Frame Outcomes Implementing
Agency PUBLIC ENTERPRISES RATIONALISATION
7 Reconstitute the boards of all Public Enterprises (PEs) with professionals as set out in the Cabinet decision of 17 December 2002
The boards of all PEs listed in the 2002 Yellow Book reconstituted as set out in the Cabinet decision – no more than 5 members in each board (chairman, general manager, representatives of MOF and line ministry, and an expert in the concerned sector), and the selection of chairmen and GMs based on the procedure specified in the Cabinet decision.
17 Oct 2003 Professional management in PEs leading to improved performances of PEs and positive impact on the budget.
Cabinet Secretariat / MOF
8 Passage/issuance of Bank and Financial Institutions Act/Ordinance to protect depositors from fraudulent or irresponsible banking practices, and safeguard the integrity of the financial system.
• Acts / Ordinance enacted • Implementation of Acts / Ordinances with
immediate effect
17 Oct 2003 Integrity of financial system safeguarded
NRB/MOF
INFRASTRUCTURE DEVELOPMENT 9 Roads Board operationalised and
funded with a special fuel levy as authorized in the previous annual budgets: annual maintenance plan received from Road agencies and reviewed by the Roads Board.
• Annual maintenance plan prepared • Fuel tax levied • Road board operationalised
17 Aug 2003 • Burden on Public Treasury lessened.
• Quality of roads improved with timely maintenance
• 90% of the strategic road network is in good/fair condition and 50% of rural roads in good/fair condition in 3 years of operation.
• Roads Board publishes annual report on its performance and financial audit.
MPPW(DOR) / MOF
Annex 4

Action Actions Indicators Time Frame Outcomes Implementing Agency
Annex 4
MACRO/PUBLIC EXPENDITURE MANAGEMENT 10 Responsibility for distribution
of electricity to local consumers handed over from NEA to 25 cooperatives/user groups/private entities.
• NEA Board approval of NEA by-laws for bulk electricity distribution
• Hand-over of electricity distribution to 25 cooperatives/user groups in rural areas and the handover agreements concluded
17 Oct 2003 • Increased consumer connection rate
• Reduced non technical loss • Improved load factor • Reduced operation and
maintenance cost • Improved service reliability • Increase in rural electrification
coverage • Reduced burden on NEA and
the Government
MOWR (NEA)
PILLAR 2: DEVELOPMENT OF SOCIAL SECTOR AND RURAL INFRASTRUCTURE (HEALTH, EDUCATION, WATER SUPPLY & SANITATION) HEALTH
11 The essential health services package (EHSP) implemented: • Upgrade MCHW to ANM • Sub Health Post Building
Construction • Immunization against Japanese
Encephalitis • Sub health post hand over
• 150 MCHW upgraded to ANM. • 250 sub health posts constructed. • 250000 persons vaccinated. • 500 SHP managed by community
15 Jun 2005 15 Jun 2005 14 Jun 2004 14 Jun 2004
• Increased allocation from HMGN in the Health Sector for EHSP combined with increased level of resource commitment from health group of donors for EHSP to implement Health Sector Strategy of HMGN.
• Changed role of central, regional and district level officials of MOH for partnership with local NGOs/private agencies, for decentralized service delivery.
• Strengthened human resource management & development at the service delivery, planning and programme implementation levels.
MOH
93
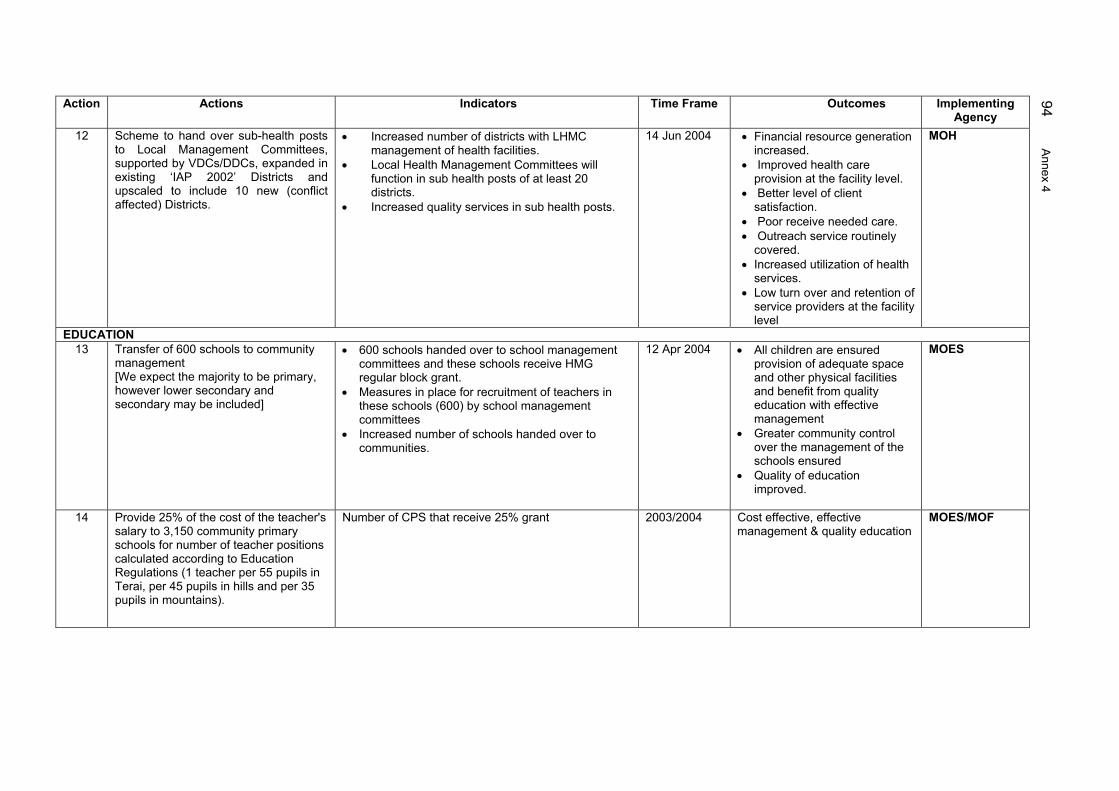
94 Action Actions Indicators Time Frame Outcomes Implementing
Agency
Annex 4
12 Scheme to hand over sub-health posts to Local Management Committees, supported by VDCs/DDCs, expanded in existing ‘IAP 2002’ Districts and upscaled to include 10 new (conflict affected) Districts.
• Increased number of districts with LHMC management of health facilities.
• Local Health Management Committees will function in sub health posts of at least 20 districts.
• Increased quality services in sub health posts.
14 Jun 2004 • Financial resource generation increased.
• Improved health care provision at the facility level.
• Better level of client satisfaction.
• Poor receive needed care. • Outreach service routinely
covered. • Increased utilization of health
services. • Low turn over and retention of
service providers at the facility level
MOH
EDUCATION 13 Transfer of 600 schools to community
management [We expect the majority to be primary, however lower secondary and secondary may be included]
• 600 schools handed over to school management committees and these schools receive HMG regular block grant.
• Measures in place for recruitment of teachers in these schools (600) by school management committees
• Increased number of schools handed over to communities.
12 Apr 2004 • All children are ensured provision of adequate space and other physical facilities and benefit from quality education with effective management
• Greater community control over the management of the schools ensured
• Quality of education improved.
MOES
14 Provide 25% of the cost of the teacher's salary to 3,150 community primary schools for number of teacher positions calculated according to Education Regulations (1 teacher per 55 pupils in Terai, per 45 pupils in hills and per 35 pupils in mountains).
Number of CPS that receive 25% grant 2003/2004 Cost effective, effective management & quality education
MOES/MOF

Action Actions Indicators Time Frame Outcomes Implementing Agency
Annex 4
95
15 Transfer responsibility for school feeding in primary schools (from PSNFP) to District Education Officers in 21 districts, and school feeding for 450,000 children made an integral part of school management in primary schools in these districts.
450,000 school children receiving food. 14 Jan 2004 • Children benefit from the programme
• Enrolment increased. • Drop out rate decreased.
MOES
PILLAR 3:SOCIAL INCLUSION & TARGETTED PROGRAMMES 16 An autonomous and accountable
Poverty Alleviation Fund (PAF) fully functioning.
• A legislation imparting strong autonomy to the Board with a professional secretariat to enable it to operate independently, flexibly and effectively
• Act enacted
14 Jan 2004 • Poverty Reduction Programmes and Projects coordinated.
• Ensure adequate funding for the pro poor projects and programmes
NPC/MOF /MOLD
17 Affirmative action policies and programmes to promote the participation of women, Janajati and Dalit groups in civil service approved and implemented
• Training provided to 250 women/Dalit/ Janajati graduates.
• Training provided to 500 under graduate women/Dalit/Janajati graduates.
16 Aug 2004 • Increased number of women/Dalits/Janajatis in the civil service.
• Women/Dalits/Janajatis empowered.
• Women/Dalits/Janajatis employees have greater access to the decision making level.
• Women/Dalits/Janajatis mainstreamed in national development
MOGA MWCSW MOLD
18 Public spending in Mid- and Far- West increased and an appropriate monitoring system set up.
• Allocation increased. • Part 2 of the Programme Book (Districts) of the
NPC made public • Increased level and share of funds disbursed
through District treasury and the Comptroller Offices in the regions
17 Aug 2003 • Socio economic condition of the people improved.
• Improved service delivery
NPC

96 Action Actions Indicators Time Frame Outcomes Implementing
Agency
Annex 4
PILLAR 4: GOOD GOVERNANCE, (ANTICORRUPTION/TRANSPARENCY) 19 Legal action against the major bank
defaulters (at RBB and NBL) and parties responsible for the major irregularities and cases of embezzlement identified in the Auditor General’s report.
• List of the defaulters made public. • Cases/ enforcement results published in the
national dailies. • Legal action initiated against those involved in the
major case of embezzlements as reported in the AG report.
17 Oct 2003 • Numbers of defaulters reduced.
• Improved financial health of the RBB and the NBL.
• Irregularities minimized. • Productivity of the
expenditure increased and service delivery improved.
• More robust financial sector.
NRB/Different Ministries /CIAA
PILLAR 4: GOOD GOVERNANCE, DECENTRALIZATION 20 Fiscal decentralization framework
developed and implementation initiated from the fiscal year 2003/04, including release of conditional/unconditional grants to local Government for poverty alleviating activities. LBFCs capacity developed in the process.
• Framework in place. • Conditional/unconditional grant provided to local
bodies in Health, Agriculture, Education and infrastructure continued thereafter.
• Poverty sensitive DDC grant formula implemented.
• LBFC secretariat physically functional.
17 Sep 2003 17 Sep 2003 14 Jan 2004 14 Jan 2004
Local bodies empowered with more resources and fiscal decentralization.
MOLD/MOF/ NPC
21 Tourism fees shared with concerned DDCs as provided in the Local Self Governance Regulation (LSGR).
• Sharing of tourism fees announced in FY2004/05 budget.
• Identification of various tourism fees to be shared with DDCs.
• A clear mechanism established for sharing the fees with DDCs, including opening of necessary accounts and a formula for sharing the proceeds among DDCs where more than one DDC is involved.
• Monitoring system in place to ensure DDCs receive the funds
16 Aug 2004
DDCs receive revenue from their own revenue base for local development activities.
MOLD/ MOCTCA
22 A local civil service commission established, and implementation initiated from the fiscal year 2003/04
• Draft concept paper prepared. • Personnel related to devolved functions made
fully accountable to LBs • Bill approved
17 Aug 2003 17 Aug 2003 16 Aug 2004
Qualified personnel at the local level.
MOLD

Action Actions Indicators Time Frame Outcomes Implementing Agency
Annex 4
OTHERS 23 Human Rights Action Plan prepared in
order to improve HMGNs human rights record including provision of sufficient funds so as to implement it.
• Finalisation of National Human Rights Action Plan.
• Necessary fund arranged.
17 Sep 2003 • Human rights of the people protected.
• Efficient and effective functioning of the National Human Rights Commission.
Cabinet Secretariat/ MOF/NHRC/ MOHA
24 Police reform to achieve a professional, modernized police force supported by establishing an independent Police Commission
• Enactment of Ordinance. • Formation of Police Service Commission.
17 Oct 2003 16 Aug 2004
Nepal Police Force will change to Nepal Police Service and practice Community Policing as their preferred style
MOHA
97