CONSTRUCTION PRODUCTIVITY ADVANCEMENT RESEARCH (CPAR… · CONSTRUCTION PRODUCTIVITY ADVANCEMENT...
170
US Army Corps of Engineers Construction Engineering Research Laboratories USACERL Technical Report 98/81 June 1998 CONSTRUCTION PRODUCTIVITY ADVANCEMENT RESEARCH (CPAR) PROGRAM Composite Grids for Reinforcement of Concrete Structures by Piyush K. Dutta, David M. Bailey, Stephen W. Tsai, David W. Jensen, John R. Hayes Jr., Willie E. McDonald, Craig W. Smart, Tracy Colwell, Jason S. Earl, and Hong-Ji Chen Approved for public release; distribution is unlimited. A Corps/Industry Partnership To Advance Construction Productivity and Reduce Costs Cvl
Transcript of CONSTRUCTION PRODUCTIVITY ADVANCEMENT RESEARCH (CPAR… · CONSTRUCTION PRODUCTIVITY ADVANCEMENT...

US Army Corps of Engineers Construction Engineering Research Laboratories
USACERL Technical Report 98/81 June 1998
CONSTRUCTION PRODUCTIVITY ADVANCEMENT RESEARCH (CPAR) PROGRAM
Composite Grids for Reinforcement of Concrete Structures
by Piyush K. Dutta, David M. Bailey, Stephen W. Tsai,
David W. Jensen, John R. Hayes Jr., Willie E. McDonald, Craig W. Smart, Tracy Colwell, Jason S. Earl, and Hong-Ji Chen
Approved for public release; distribution is unlimited.
A Corps/Industry Partnership To Advance Construction Productivity and Reduce Costs
Cvl

The contents of this report are not to be used for advertising, publication, or promotional purposes. Citation of trade names does not constitute an official endorsement or approval of the use of such commercial products. The findings of this report are not to be construed as an official Department of the Army position, unless so designated by other authorized documents.
DESTROY THIS REPORT WHEN IT IS NO LONGER NEEDED
DO NOT RETURN IT TO THE ORIGINATOR
REPORT DOCUMENTATION PAGE Form Approved OMB No. 0704-0188
Public reporting burden for this collection of information is estimated to average 1 hour per response, including the time for reviewing instructions, searching existing data sources, gathering and maintaining the data needed, and completing and reviewing the collection of information. Send comments regarding this burden estimate or any other aspect of this collection of information, including suggestions for reducing this burden, to Washington Headquarters Services, Directorate for information Operations and Reports, 1215 Jefferson Davis Highway, Suite 1204, Arlington, VA 22202-4302, and to the Office of Management and Budget, Paperwork Reduction Project (0704-0188), Washington, DC 20503.
1. AGENCY USE ONLY (Leave Blank) 2. REPORT DATE June 1998
4. TITLE AND SUBTITLE
Composite Grids for Reinforcement of Concrete Structures
3. REPORT TYPE AND DATES COVERED Final
6. AUTHOR(S)
Piyush K. Dutta, David M. Bailey, Stephen W. Tsai, David W. Jensen, John R. Hayes Jr., Willie E. McDonald, Craig W. Smart, Trac
7. PERFORMING ORGANIZATION NAME(S) AND ADDRESS(ES)
U.S. Army Construction Engineering Research Laboratories (USACERL) P.O. Box 9005 Champaign, IL 61826-9005
9. SPONSORING / MONITORING AGENCY NAME(S) AND ADDRESS(ES)
Headquarters, U.S. Army Corps of Engineers ATTN: (CEMP-CE) 20 Massachusetts Avenue NW Washington, DC 20314-1000
5. FUNDING NUMBERS
CPAR LX4
8. PERFORMING ORGANIZATION REPORT NUMBER
TR 98/81
10. SPONSORING / MONITORING AGENCY REPORT NUMBER
11. SUPPLEMENTARY NOTES
Copies are available from the National Technical Information Service, 5285 Port Royal Road, Springfield, VA 22161.
12a. DISTRIBUTION / AVAILABILITY STATEMENT
Approved for public release; distribution is unlimited.
12b. DISTRIBUTION CODE
13. ABSTRACT (Maximum 200 words)
This research investigated a new concept that uses fiber-reinforced plastic (FRP) composite grid to reinforce concrete structural members. Prefabricated two- and three-dimensional FRP grid structures were investigated as a possible alternative to conventional one-dimensional steel reinforcement rods. Currently available commercial grid manufacturing techniques were found to be inadequate due to material flaws, poor fiber volume fraction, and low strength and stiffness. Through laboratory investigations, significant improvements in fiber volume fraction in orthogrid and isogrid systems were achieved. Laboratory-scale samples demonstrated excellent results under loading tests.
Concurrent investigations showed that although the FRP grid-reinforced concrete is more flexible than steel-reinforced concrete, its postfailure deformation was pseudo-ductile, characterized by continuous structural deformation through multiple low-level brittle failures before the onset of catastrophic failure. It was also found that a combined concrete/composite reinforcement structure, with a higher volume of FRP composite fraction in the concrete, would substantially increase stiffness, load capacity, and postfailure concrete containment.
This study addressed not only the possible replacement of steel reinforcement with composite grids, but also investigated enhancement of the composite application through load-sharing with steel reinforcement in a complementary fashion. Various manufacturing improvements also were explored, including the novel use of disposable toolings.
14. SUBJECTTERMS
CPAR composite materials fiber-reinforced plastic (FRP)
concrete structural engineering
17. SECURITY CLASSIFICATION OF REPORT
Unclassified
18. SECURITY CLASSIFICATION OF THIS PAGE
Unclassified NSN 7540-01-280-5500
19. SECURITY CLASSIFICATION OF ABSTRACT
Unclassified
15. NUMBER OF PAGES 172
16. PRICE CODE
20. LIMITATION OF ABSTRACT
SAR Standard Form 298 (Rev. 2-89) Prescribed by ANSI Std 239-18 298-102

jv USACERL TR 98/81
Foreword
This study was conducted for Headquarters, U.S. Army Corps of Engineers (HQUSACE) under the Construction Productivity Advancement Research (CPAR) Work Unit LX4, "Composite Grid/Frame Reinforcement for Concrete Structures." The U.S. Army Construction Engineering Research Laboratories (USACERL) was the Corps Partner and the U.S. Army Cold Regions Research and Engineering Laboratory (USACRREL) was a Corps Partner participant. The technical monitors were M.K. Lee (CECW-EG), D. Chen (CEMP-ET), and T. Wilford (CEMP-CE).
This work was executed through a CPAR Cooperative Research and Development Agreement (CPAR-CRDA) between the Materials Science and Technologies Division (FL-M), USACERL, and the Composites Design Center, Stanford University (SU). The USACERL Principal Investigator was David M. Bailey, CECER-FL-M, and the co-Principal Investigator was Dr. Piyush Dutta, USACRREL. The SU Principal Investigator was Dr. Stephen W. Tsai. The following industry firms and other organizations participating with the CPAR Industry Partner are acknowledged for their technical contributions and in-kind support for this project:
Brigham Young University—David Jensen, testing and analyses RL Industries, Fairfield, OH—Steven Linnemann (President), filament winding
Fiberflex, Houston, TX—Steve Morris (Vice President), pultruded FRP rods
TPI, Warren, RI—Everett Pearson (President), vacuum infiltration processing
Fibergrate, Richardson, TX—composite grating
University of Zaragoza, Spain—Prof. Antonio Miravete, composites applications
Kanazawa Institute of Technology, Japan—Prof. Yasushi Miyano, life prediction modeling
Hong Kong University of Science and Technology—Prof. Ricky Lee, grid design
Hanyang University, Seoul, Korea—Prof. Sung-Kyu Ha, analytical modeling
SAMTECH, Liege, Belgium—Yves Lombard, finite element analysis
Dr. Ilker R. Adiguzel is Acting Chief, CECER-FL-M, and L. Michael Golish is Acting Operations Chief, CECER-FL-M. The USACERL technical editor was Gordon L. Cohen, Technical Information Team.
COL James A. Walter is the Commander of USACERL, and Dr. Michael J. O'Connor is Director.

USACERLTR-98/81
Contents
SF298 iii
Foreword iv
List of Tables and Figures ix
1 Introduction 1
Background 1
Objective 2
Approach 2
Units of Weight and Measure 2
2 Technology Overview 4
Steel-Reinforced Concrete 5
Durability of Steel Reinforcement 6
Fiber Reinforced Plastic (FRP) Composites 7
FRP Reinforcement for Concrete 8
FRPRebar g
Bonded FRP Plates 11
Durability of FRP 12
General Aging 13
Moisture 13
Freeze-ThawEffects 14
Ultraviolet Radiation 15
Alkaline Environment. 75
Creep Behavior. 15
Fatigue 17
Fire Hazards and Flammability. 18
Economics of FRP Reinforcement 18
3 Grid Reinforcement Concept 20
Review of Composite Grid Reinforcement Research 21
Grid Geometry and Design 23
Grid Types and Terminology 24
Grids as Structures 25
Composite Material Grids 26

vi USACERL TR 98/81
Previous Composite Grids 27
Properties and Behavior of Composite Grids as Concrete Reinforcement 28
Ductility 28
Strength and Stiffness 28
FRP Reinforcement Bond Characteristics 29
Flexural Behavior. 30
Analysis Of Grid Reinforcement 33
Geometric Parameters 34
Mechanical Properties of Grids 35
Stiffness of Quasi-lsotropic Laminates 36
Stiffness of Isogrids 37
Composite Grid Reinforcement Design Approach 38
GENLAM Modeling for Concrete-Filled Grids 39
Manufacturing the Composite Grids 42
BYU Direct Crossover Interlaced Joints 43
Lay-up Procedure 43
Cure Procedure 44
Strain Gage Placement 44
Stanford Pin Enhanced Geometry (PEG) Process 45
PEG Assembly. 46
Manufacture of Large Orthogrid (n/2) Structures 48
Manufacture of Large Isogrid (n/3) Structures 48
Stanford Tooling-Reinforced Interlaced Grid (TRIG) Process 49
TRIG Manufacturing Methodology 49
Advantages of the TRIG Method. 50
Disadvantages of the TRIG Process 51
Integration of PEG Techniques into the TRIG System 51
Load Testing of TRIG Grids 51
Material Properties 52
Panel Properties 52
Concept Development for Full-Scale TRIG Grid Production 54
Grid-Reinforced Concrete (GRC) Panels 56
GRC Testing at BYU 56
Description of Test Specimen Geometry. 57
The Test Matrix 57
Manufacturing the Concrete Beams 58
Test Fixture Setup 59
Flexural Specimen Testing 59
Test Results 60

USACERLTR-98/81 vii
Results from Steel Rebar Reinforced Beams 61
Results from Commercial Carbon Grid Reinforced Beams 62
Results from Commercial GFRP Grid Reinforced Beams 62
Results from BYU Plain Carbon Grid Reinforced Beams 62
Results from BYU Deformed Carbon Grid Reinforced Beams. '. 63
Results from Hybrid Carbon/Steel Grid Reinforced Beams 63
Results from Steel Grid Reinforced Beams 63
Overall Comparison 63
GRC Investigations at Stanford 65
Testing 65
Model Via GENLAM '. 66
Demonstration and Result. 68
GRC Panel Testing at Stanford 69
Grid Behavior. 70
GRC Behavior 70
GRC Toughness 70
GRC Concrete Containment 71
Summary 71
7 Column-Reinforcing Grids 72
StackedJoint Grids 72
Stacked Joint Grid Specimen Manufacturing 73
Test Matrix 74
Manufacturing the Concrete Columns 74
Curing 75
Compression Samples 75
Experimental Procedure 76
First-Generation Columns, 2.0 in. Spacing 77
First-Generation Columns, 4.0 in. Spacing 77
Second-Generation Stacked Joint Grids 78
Discussion of Results 79
Failure Modes 79
Stress-Strain Behavior. 79
Load Transfer Effects. 80
8 Conclusions, Recommendations, and Commercialization 81
Conclusions 81
Design Issues 82
Manufacturing Issues ;....83
Recommendations 84
Technology Transfer and Commercialization 85

viii USACERL TR 98/81
References 86
Tables and Figures Cited in Report 93
Distribution

USACERLTR-98/81 ix
List of Tables and Figures
Tables
Table 1. Tensile strength and bending requirements of concrete reinforcing steel (billet steel bars) 95
Table 2. Comparison of mechanical properties of steel and FRP rebar (Faza 1995) 96
Table 3. Fire tests of building materials 96
Table 4. Comparisons of stiffness of isotropic laminates and isogrids for three materials on absolute and specific bases 97
Table 5. Reinforcement areas and theoretical mechanical properties 97
Table 6. Comparison of ultimate load, effective stiffness, deflection, and toughness results for all beams 98
Table 7. GENLAM materials 98
Table 8. 13 mm beam lay-ups 98
Table 9. 38 mm beam lay-ups 99
Table 10. Grid-only load/deflection slopes 99
Table 11. Average load-deflection slopes of GRC panels and frames 99
Table 12. Concrete column specimens included in test matrix 100
Table 13. Comparisons of column specimens A, B, C, and K 100
Table 14. Comparisons of column specimens D, E, F, and K 101
Table 15. Comparisons of column specimens G, H, I, M, and P. 101
Figures
Figure 1. Deformed steel reinforcing bars 102
Figure 2. FRP tensile coupon test specimens 102
Figure 3. Commercially available FRP reinforcing rods 103
Figure 4. Moisture absorption of polymer composites 103
Figure 5. Schematic showing isometric view of isogrid structure 104
Figure 6. Schematic showing isometric view of orthogrid structure 104
Figure 7. Basic grid structure and terminology. 105
Figure 8. Example of isogrid configuration 105
Figure 9. Plot of specific strength and specific stiffness for FRP and metals 106
USACERL TR 98/81
Figure 10. Interlace of fiber rovings through anode 106
Figure 11. Typical steel and FRP stress-strain characteristics 107
Figure 12. Results of bending tests of steel, cfrp and hfrp specimens 107
Figure 13. Configurations for square grids, angle grids, and isogrids 108
Figure 14. Rib areal fractions of square grids and isogrids 108
Figure 15. Definition of area fraction (f) of square and isogrids 108
Figure 16. Isogrid portrayed as a regrouped laminate 109
Figure 17. Beam diagram for modeling 109
Figure 18. Composite grids with slotted joints 110
Figure 19. Typical relations for orthogrid 111
Figure 20. Isogrid with offset nodes 111
Figure 21. Interlaced nodes 112
Figure 22. Geometry of the plain (a) and deformed (b) orthogrids 113
Figure 23. Molds for plain (top) and deformed (bottom) orthogrids 113
Figure 24. Schematic drawing of winding process 114
Figure 25. Placement of strain gages and fiber optic sensors 114
Figure 26. Rib flaws 114
Figure 27. Central node pin 115
Figure 28. Central node pin with 1.3-degree lead-in angle 115
Figure 29. Two lay-up methods 116
Figure 30. First PEG specimen 116
Figure 31. PEG mold design steps 117
Figure 32. Sample PEG winding pattern 118
Figure 33. PEG Isogrid mold and specimen 118
Figure34. 7X7TRIGpanel 119
Figure 35. TRIG panel mold 119
Figure 36. Conventional processing cycle 120
Figure 37. TRIG processing cycle 120
Figure 38. Test specimens — commercial, reinforced commercial, and TRIG grids. ...121
Figure 39. Tensile modulus of test specimens 121
Figure 40. Panel bending test 122
Figure 41. Panel twisting test 122
Figure 42. Results from panel bending test 122
Figure 43. Results from panel twisting test 123
Figure 44. Tooling for grid block 123
Figure 45. Grid mold 123
Figure 46. Sliced grid block 124
USACERLTR-98/81 xi
Figure 47. Cross-section of reinforced concrete beams 124
Figure 48. Test configuration for reinforced concrete beams 125
Figure 49. Uneven crack distribution in grid-reinforced concrete 126
Figure 50. Four-point load test fixture 126
Figure 51. Deflection lever arm 127
Figure 52. Load-deflection curve showing calculation of effective stiffness 127
Figure 53. Load vs deflection for steel rebar reinforced beam 128
Figure 54. Expanded load vs deflection for steel rebar reinforced beam 128
Figure 55. Load vs deflection for commercial carbon grid reinforced beam 129
Figure 56. Expanded load vs deflection for commercial carbon grid reinforced beam 129
Figure 57. Load vs deflection for fiberglass grid reinforced beams 130
Figure 58. Expanded load vs deflection for fiberglass grid reinforced beams 130
Figure 59. Load vs deflection for in-house plain carbon grid reinforced beams 131
Figure 60. Expanded load vs deflection for in-house plain carbon grid reinforced beams 131
Figure 61. Load vs deflection for in-house deformed carbon grid reinforced beams 132
Figure 62. Expanded load vs deflection for in-house deformed carbon grid reinforced beams 132
Figure 63. Load vs deflection for in-house hybrid carbon grid reinforced beams 133
Figure 64. Expanded load vs deflection for in-house hybrid carbon/steel grid reinforce beams 133
Figure 65. Load vs deflection for steel grid reinforced beams 134
Figure 66. Expanded load vs deflection for steel grid reinforced beams 134
Figure 67. Overall load vs deflection comparison 135
Figure 68. Expanded load vs deflection comparison 135
Figure 69. Identification of load and deflection values for crack propagation photographs 136
Figure 70. Crack propagation in in-house carbon grid reinforced beam at 6000 lb 136
Figure 71. Crack propagation in in-house carbon grid reinforced beam at 13,000 lb. 137
Figure 72. Crack propagation in in-house carbon grid reinforced beam at 17,600 lb (failure) 137
Figure 73. Effective precracking stiffness of the different beams tested (each symbol represents results from a single test) 138
Figure 74. Concrete compressive strength for each beam type 138
Figure 75. Post-cracking effective stiffness of the different beams tested 139
Figure 76. Axial rigidity (EA) of reinforcement 139
xii USACERL TR 98/81
Figure 77. Linear relationship between post-cracking stiffness and reinforcement rigidity. 140
Figure 78. Ultimate load vs toughness for the different beam types tested 140
Figure 79. Grid reinforced concrete slab (concrete contained within a bi-grid frame) 141
Figure 80. Bi-grid frame construction 141
Figure 81. Thick GRC slab 142
Figure 82. GRC testing methods (the upper two test compressive and tensile properties; beams test stiffness models; panels test GRC structural behavior) 142
Figure 83. GRC beam cross-sections 143
Figure 84. 13 mm GRC beam data 143
Figure 85. GRC compression test specimen 143
Figure 86. Basic laminate and expected stress distribution 144
Figure 87. Modified material stacking sequences 144
Figure 88. 13 mm beam stress distribution 144
Figure 89. 13 mm beam predicted results 145
Figure 90. 38 mm beam stress distribution 145
Figure 91. 38 mm beam predicted vs. experimental results 145
Figure 92. Summary of final beam lay-ups 146
Figure 93. Panel bending and twisting tests 146
Figure 94. Testing data for grid structures 146
Figure 95. Grid vs GRC load/deflection slopes 147
Figure 96. Testing data for grid structures 147
Figure 97. Failure curve of a 38 mm dual-grid GRC panel (toughness is demonstrated through the post-yield behavior) 148
Figure 98. Failure toughness of GRC panels (demonstrating repeatability of the GRC toughness in multiple panel thicknesses and loading conditions) 148
Figure 99. Concrete containment through first yield in a 13 mm panel 149
Figure 100. Concrete containment through failure in 13 mm panel 149
Figure 101. Concrete containment through failure in a 38 mm panel 149
Figure 102. Stacked joint grid 150
Figure 103. Stacked joint grids of various geometric configurations 151
Figure 104. End failure for of a first-generation column 152
Figure 105. Load vs time graph for 2.0 in. spacing of fiber-reinforced columns 152
Figure 106. Stress vs longi strain for 2.0 in. spacing of fiber-reinforced columns 153
Figure 107. Stress vs circ strain graph for 2.0 in. spacing of fiber-reinforced columns - 153
Figure 108. Stress vs longi strain graph for 4.0 in. spacing of fiber-reinforced columns 154
USACERLTR-98/81 xiü
Figure 109. Stress vs circ strain graph for 4.0 in. spacing of fiber-reinforced columns 154
Figure 110. Load vs time for second-generation fiber-reinforced columns 155
Figure 111. Stress vs circ strain for second-generation composite fiber-reinforced column 155
Figure 112. Stress vs longi strain for second generation composite fiber reinforced column 156
Figure 113. Ultimate load vs number of longis for fiber-reinforced concrete columns 156
Figure 114. Comparison of stacked grid composite grid structures in concrete columns 157
Figure 115. Separation of external concrete from composite 157
USACERLTR-98/81
1 Introduction
Background
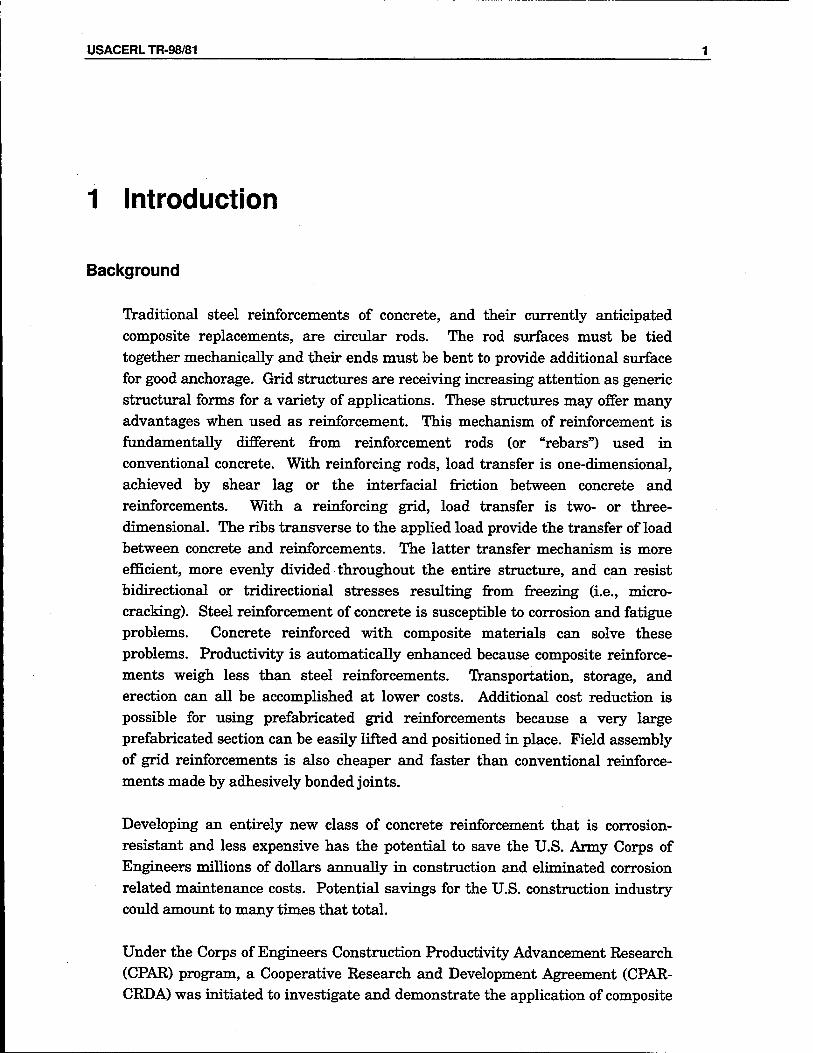
Traditional steel reinforcements of concrete, and their currently anticipated composite replacements, are circular rods. The rod surfaces must be tied together mechanically and their ends must be bent to provide additional surface for good anchorage. Grid structures are receiving increasing attention as generic structural forms for a variety of applications. These structures may offer many advantages when used as reinforcement. This mechanism of reinforcement is fundamentally different from reinforcement rods (or "rebars") used in conventional concrete. With reinforcing rods, load transfer is one-dimensional, achieved by shear lag or the interfacial friction between concrete and reinforcements. With a reinforcing grid, load transfer is two- or three- dimensional. The ribs transverse to the applied load provide the transfer of load between concrete and reinforcements. The latter transfer mechanism is more efficient, more evenly divided throughout the entire structure, and can resist bidirectional or tridirectional stresses resulting from freezing (i.e., micro- cracking). Steel reinforcement of concrete is susceptible to corrosion and fatigue problems. Concrete reinforced with composite materials can solve these problems. Productivity is automatically enhanced because composite reinforce- ments weigh less than steel reinforcements. Transportation, storage, and erection can all be accomplished at lower costs. Additional cost reduction is possible for using prefabricated grid reinforcements because a very large prefabricated section can be easily lifted and positioned in place. Field assembly of grid reinforcements is also cheaper and faster than conventional reinforce- ments made by adhesively bonded joints.
Developing an entirely new class of concrete reinforcement that is corrosion- resistant and less expensive has the potential to save the U.S. Army Corps of Engineers millions of dollars annually in construction and eliminated corrosion related maintenance costs. Potential savings for the U.S. construction industry could amount to many times that total.
Under the Corps of Engineers Construction Productivity Advancement Research (CPAR) program, a Cooperative Research and Development Agreement (CPAR- CRDA) was initiated to investigate and demonstrate the application of composite

USACERL TR 98/81
grid reinforcement in a full-scale reinforced concrete structure. The Corps partner laboratories were the U.S. Army Construction Engineering Research Laboratories (USACERL) and the Cold Regions Research and Engineering Laboratory (USACRREL). The industry partner was the Composites Design Center, at Stanford University, CA.
Objective
The objective of this research was to develop and demonstrate the use of grid/frame1 structures made of unidirectional composite materials as reinforce-
ments for concrete.
Approach
The project was divided into the following tasks
• Survey and evaluate existing methods of concrete reinforcement and identify physical performance requirements for composite grid frames.
• Develop preliminary designs for family of grid/frame systems. • Perform lab-scale mechanical performance and environmental exposure tests
on grid/frame specimens. • Develop software package for designing composite grid frames for structural
concrete applications. • Design and construct full-scale demonstration of a composite grid/frame
reinforced concrete structure. • Monitor and evaluate performance. • Complete final technical report.
Units of Weight and Measure
U.S. standard units of measure are used throughout this report. A table of conversion factors for Standard International (SI) units is provided below.
' In this report, "grid/frames" are referred to as "grids" for brevity.

USACERLTR-98/81
SI conversion factors
1 in. = 25.4 cm 1ft = 0.305 m 1 sq in. = 6.452 cm2
1 sqft = 0.093 m2
11b = 0.453 kg 1 kip = 453 kg 1 psi = 6.89 kPa °F = (°Cx1.8) + 32
USACERL TR 98/81
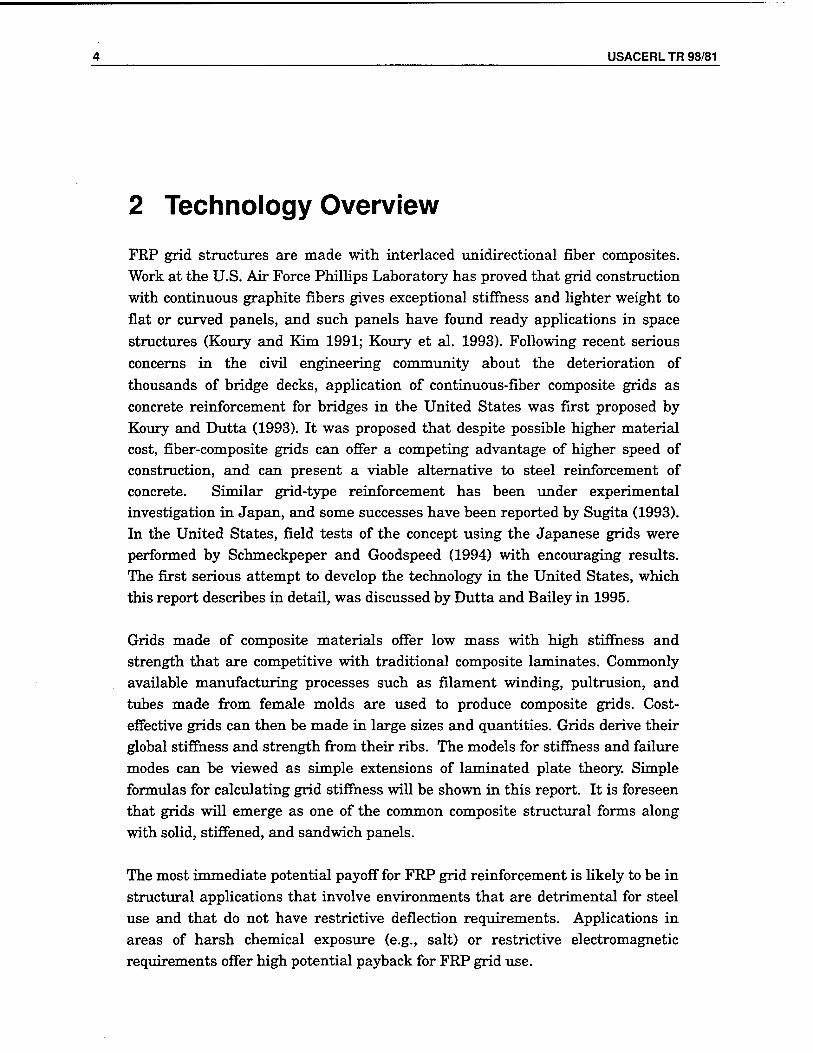
2 Technology Overview
FRP grid structures are made with interlaced unidirectional fiber composites. Work at the U.S. Air Force Phillips Laboratory has proved that grid construction with continuous graphite fibers gives exceptional stiffness and lighter weight to flat or curved panels, and such panels have found ready applications in space structures (Koury and Kim 1991; Koury et al. 1993). Following recent serious concerns in the civil engineering community about the deterioration of thousands of bridge decks, application of continuous-fiber composite grids as concrete reinforcement for bridges in the United States was first proposed by Koury and Dutta (1993). It was proposed that despite possible higher material cost, fiber-composite grids can offer a competing advantage of higher speed of construction, and can present a viable alternative to steel reinforcement of concrete. Similar grid-type reinforcement has been under experimental investigation in Japan, and some successes have been reported by Sugita (1993). In the United States, field tests of the concept using the Japanese grids were performed by Schmeckpeper and Goodspeed (1994) with encouraging results. The first serious attempt to develop the technology in the United States, which this report describes in detail, was discussed by Dutta and Bailey in 1995.
Grids made of composite materials offer low mass with high stiffness and strength that are competitive with traditional composite laminates. Commonly available manufacturing processes such as filament winding, pultrusion, and tubes made from female molds are used to produce composite grids. Cost- effective grids can then be made in large sizes and quantities. Grids derive their global stiffness and strength from their ribs. The models for stiffness and failure modes can be viewed as simple extensions of laminated plate theory. Simple formulas for calculating grid stiffness will be shown in this report. It is foreseen that grids will emerge as one of the common composite structural forms along with solid, stiffened, and sandwich panels.
The most immediate potential payoff for FRP grid reinforcement is likely to be in structural applications that involve environments that are detrimental for steel use and that do not have restrictive deflection requirements. Applications in areas of harsh chemical exposure (e.g., salt) or restrictive electromagnetic requirements offer high potential payback for FRP grid use.
USACERLTR-98/81
In order for the FRP grid technology to gain widespread acceptance it will be necessary to develop viable grid manufacturing processes. Such processes must lower the direct cost of manufacture as well as the cost of field usage. To facilitate field use, the manufacturing process must be sufficiently flexible to permit grid size and fiber volume to be varied in a manner that supports the structural design process.
This chapter presents a brief overview of why reinforcement of concrete is needed, how the reinforcing steel gets corroded, how corrosion affects the structure, and why the alternative reinforcing material (FRP composite) would be more suitable. Finally, the anticipated problems and durability issues of the FRP composites are discussed.
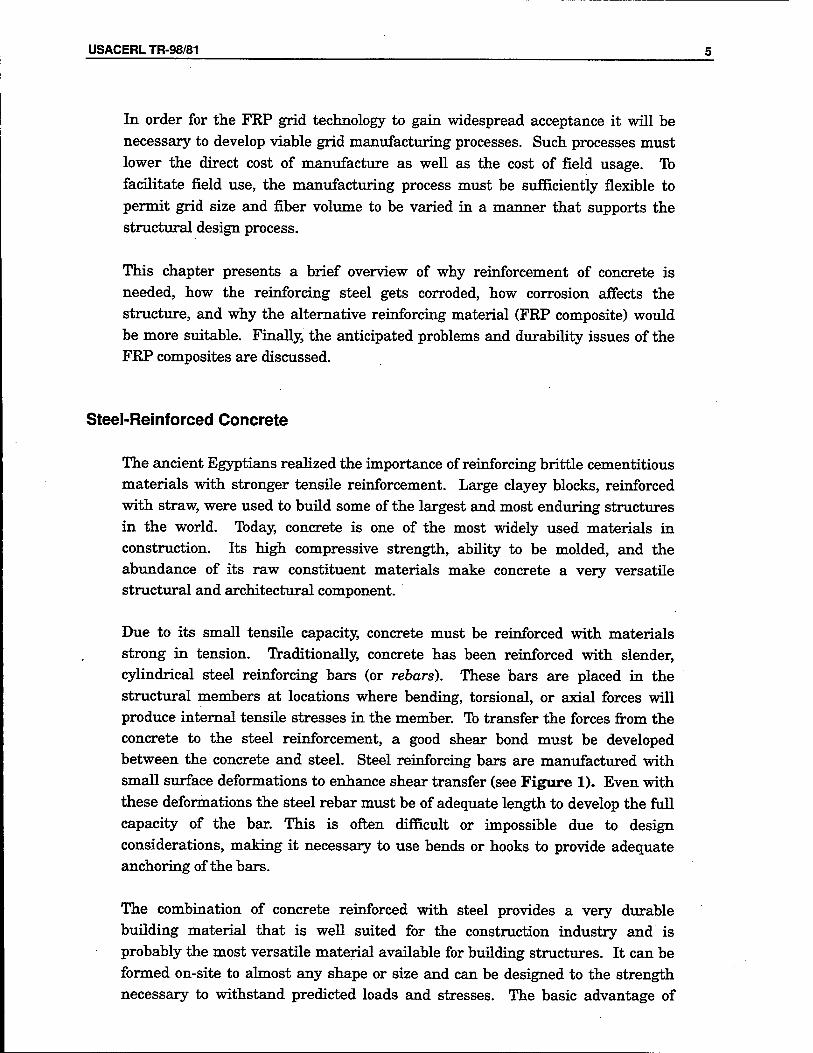
Steel-Reinforced Concrete
The ancient Egyptians realized the importance of reinforcing brittle cementitious materials with stronger tensile reinforcement. Large clayey blocks, reinforced with straw, were used to build some of the largest and most enduring structures in the world. Today, concrete is one of the most widely used materials in construction. Its high compressive strength, ability to be molded, and the abundance of its raw constituent materials make concrete a very versatile structural and architectural component.
Due to its small tensile capacity, concrete must be reinforced with materials strong in tension. Traditionally, concrete has been reinforced with slender, cylindrical steel reinforcing bars (or rebars). These bars are placed in the structural members at locations where bending, torsional, or axial forces will produce internal tensile stresses in the member. To transfer the forces from the concrete to the steel reinforcement, a good shear bond must be developed between the concrete and steel. Steel reinforcing bars are manufactured with small surface deformations to enhance shear transfer (see Figure 1). Even with these deformations the steel rebar must be of adequate length to develop the full capacity of the bar. This is often difficult or impossible due to design considerations, making it necessary to use bends or hooks to provide adequate anchoring of the bars.
The combination of concrete reinforced with steel provides a very durable building material that is well suited for the construction industry and is probably the most versatile material available for building structures. It can be formed on-site to almost any shape or size and can be designed to the strength necessary to withstand predicted loads and stresses. The basic advantage of
USACERL TR 98/81
reinforcing concrete with steel is to compensate for its weak tensile strength. Another important advantage includes reduction in the likelihood of catastrophic failure due to the ductile properties of steel and the consequent reduction and control of cracking in the concrete.
Durability of Steel Reinforcement
In ideal terms, the combination of steel and concrete are complementary. The properties of reinforcing steel are given in Table 1. The steel provides the strength and the alkaline nature of the concrete provides the passivation to protect against oxidation (rusting) of the reinforcing steel. However, in order for this complementary system to properly function, deteriorative environments within the concrete surrounding the steel must be prevented. Deteriorative conditions created by factors inherent in the concrete and by imposed environmental conditions subsequently lead to corrosion of the reinforcing steel. The effects of steel corrosion not only compromise the integrity of the reinforcing steel but also, in turn, further aggravate and accelerate deterioration within the
concrete.
Steel corrosion is the result of iron oxide scale (rust) formation on the surface of the steel that normally develops when steel is exposed to air. During the hydration of concrete, alkaline compounds are liberated from the cement component, and these form a protective film around the reinforcing steel. Within this matrix, approximate pH values between 12.5 and 13.6 allow the steel to remain passive. The cement matrix also provides a barrier against the intrusion of moisture and oxygen, thus providing physical and chemical protection of the steel. However, aggressive deteriorative agents that attack and destroy the cement matrix (e.g., acids, chlorides, sulfates, etc.) cause reduction in pH values and subsequent depassivation of the steel. Therefore, it is important that the integrity of the cement matrix (and thus the state of passivity) remains intact to avoid initiation of steel corrosion. The prevention of corrosion is highly dependent on the properties of the surrounding concrete. Such properties include concrete cover, water/cement ratio, permeability, and consolidation. Common factors that promote aggressive attacks include improper mix design, poor placement techniques, and contaminated materials.
Significant problems involving corrosion of reinforcing steel began to emerge in the 1960s. Solutions to the problem have included galvanization of the reinforcing steel, polymer concrete, epoxy-coated rebar, low-permeability concrete, and FRP rebar. The galvanized reinforcing steel has been found to lose its corrosion protection due to an electrolytic reaction between the steel and the
USACERLTR-98/81
zinc-based coatings. Polymer concrete has been found not to be compatible with steel reinforcement because of the large differences in thermal properties. Epoxy-coated rebar is used widely today despite concerns about damage from nicks and scratches that could lead to corrosion concentrations and doubtful bond (development length) properties. The cost of low-permeability concrete is almost twice that of standard concrete, but it is still a common remedy for corrosion problems. Composite reinforcements are currently making their way into the spotlight.
Fiber Reinforced Plastic (FRP) Composites
The class of materials designated as FRP composites has been defined by the American Concrete Institute (ACI 440R-3, 1996) as "a polymer matrix, whether thermosetting (e.g., polyester, vinylester, epoxy, phenolic) or thermoplastic (e.g., nylon, PET), which is reinforced by fibers (e.g., aramid, carbon, glass)." Glass- fiber reinforced plastics are usually referred as GFRP and carbon-fiber reinforced plastics are called CFRP. The performance of any FRP composite depends on the materials of which the composite is made, the arrangement of the fibers, and the interaction of the fibers with the matrix.
The most common types of FRP used in civil and structural applications today use glass fibers within a vinyl ester resin matrix. Glass fibers are used because of their low price and high strength. The tradeoff between glass and other fibers is price for stiffness. Carbon fibers provide significantly higher stiffness, but at a much higher price. As new applications evolve and as new processing methods are developed, the price of carbon fibers is expected to come down. When this happens carbon will become the fiber of choice. "Vinyl ester resins are slightly more expensive than other resins, such as polyesters. The high strength and durability of vinyl ester resins, however, warrant the extra costs.
Composite structures can be fabricated by many methods. In civil engineering applications it is essential that the most cost-effective method is followed. The current methods of producing composite structures include pultrusion, filament winding, resin transfer molding (RTM), fiber placement and other lay up processes. In all these processes the aim is to achieve a balanced stiffness and strength in multiple directions. For this purpose it is essential that unidirectional fibers be placed in multiple directions. Such homogeneous structure inhibits delamination failure. Construction applications of FRP composites have been recently surveyed by Kant et al. (1997).
USACERL TR 98/81
The mechanisms that contribute to the composites failure are well known. They include (1) chemical or physical changes, or microcracks of polymer matrix, (2) loss of adhesion (debonding) at the fiber/matrix interface, and (3) reduction of fiber strength and modulus. These processes contribute to the growth of flaws or cracks that can result in eventual failure. For unidirectional composites, the compressive failure mechanisms include microbuckling of fibers (Rosen 1965; Greszczuk 1975; Davis 1975; Hahn and Williams 1984), kink banding (Berg and Salama 1973; Hahn et al. 1986), matrix yielding (Piggott 1981), and shear through both the fiber and matrix (Hancox 1975). The tensile failure is accompanied by brittle failure of the matrix, fiber pullout, interface matrix shear
failure, and constituent debonding (Chamis 1974). However, in most cases of multidirectionally reinforced composites, the initial failure takes the form of cracking of constituent plies; that is, cracks appear parallel to fibers long before the final failure of the laminate. The initial failure is very often referred as the first-ply failure (FPF). The FRP tensile coupon test specimen on the left in Figure 2 shows an examples of the first ply failure, and the coupon on the right shows the complete failure.
FRP Reinforcement for Concrete
While there have been numerous papers written on the topic of composite reinforcement, the concept is still relatively new and unexplored. ACI Committee 440 has recently reported on the general aspects of using FRP for concrete reinforcement (ACI 440R-96). This committee's report summarizes the findings of research that has been done to date on all types of composite reinforcement for concrete structures. While most of the previous work has been done on FRP reinforcing bars, which are modeled after deformed steel reinforcing bars, many of the conclusions are applicable to other types of composite reinforcement as well.
Advantages of composite reinforcement for concrete include corrosion resistance, high specific strength, high specific stiffness, electromagnetic permeability, and impact resistance. In fact, the largest market today for composite reinforcing is in the medical fields. The use of composite reinforcement around MRI (magnetic resonance imaging) medical equipment eliminates the magnetic interference found with steel reinforcement. However, the primary motivation for research in this field has been the durability or corrosion problems associated with steel rebar.
In 1986, the first FRP reinforced concrete bridge was built in Germany (ACI 440R-96; Taerue 1993). At the end of 1993 there were nine companies actively
USACERLTR-98/81
marketing FRP reinforcing bars in North America. As the demand increases for composite reinforcement the market will respond with high-quality, readily available products as well as high-tech, cost effective manufacturing techniques.
The ACI report concludes that the basic engineering principles generally applied to the design of steel-reinforced concrete can effectively be used to design FRP- reinforced concrete. These principles include (1) stress equilibrium on the cross- section, (2) strain compatibility between the reinforcement and the concrete, (3) the Kirchoff hypothesis (plane sections remain plane) and, for the concrete, (4) the Whitney rectangular stress block to approximate the concrete stress distribution. Designers are warned of the differences between steel and FRP reinforcement, the main difference being the lack of ductility in advanced composites. The ACI report suggests that adequate reduction factors or possibly limiting ultimate strains might compensate for the lack of warning prior to failure. Lack of energy absorption due to elastic response also needs to be accounted for in seismically excited structures. In any case, designers should be familiar with the engineering characteristics of the materials in their designs and apply appropriate factors of safety. The following sections summarize some of the research taking place in the field of FRP reinforcement of concrete.
FRP Rebar
Perhaps the most common type of composite reinforcement currently being implemented is composite reinforcing bars (Bakis 1993). These commercially available FRP reinforcing bars, one type of which is shown in Figure 3, generally mimic steel rebar in their shape and size. The bars are made by pultruding fibers and resin through a round die to produce slender, cylindrical rods of unidirectional fibers. An additional bundle of fibers wrapped helically around the rods produces a spiral deformation to provide a good bond between reinforcement and concrete. Research conducted by Larralde et al. (1989) investigated the similarities between composite and steel rebar reinforced beams. Their results showed that theoretical values for ultimate load and deflections did not correlate with actual values. The difference in ultimate loads is attributed to the failure mode being controlled by diagonal tension rather than tensile failure of the reinforcement. Research by Chaalal and Benmokrane (1996) showed a much better correlation between both ultimate load and ACI deflection predictions. The ACI code, however, overestimates the effective moment of inertia and does not account for a significantly larger number of cracks in the FRP reinforced beams.
Wu et al. (1990) have reported that E-glass reinforced composite bars may have tensile strength in excess of 100 ksi and longitudinal elastic modulus of about
10 USACERL TR 98/81
7500 ksi. In tensile tests the bars fail without any significant yield (brittle failure). Table 2 gives a comparison of mechanical properties of the steel rebars and the FRP rebars.
Currently there are several FRP rebar companies actively marketing their products in the United States. Most FRP rebars contain by volume about 55 percent E-glass fiber and about 45 percent thermoset resin. Faza (1995) has reported a number of successful applications of rebars in the United States. These include applications in seawalls, medical MRI facilities, reactor pads, compass calibration pads, mill roofs, laser test facilities, highway barriers, residential foundations, and bridge decks.
One of the most critical developments necessary for successful large-scale applications of FRP rebars is improvement of FRP bond strength with concrete. As stated before, some designs provide a helically convex surface made with a strand spirally-wound and cured on the surface. Other designs use sand or grit coating on the rebars. A recent design includes a pultruded, ribbed surface. The authors are not aware of comparative survey data on the bond quality of these various surface modifications.
There are several major barriers to widespread FRP rebar applications, including lack of sufficient durability or performance data under extreme environments. Creep, fatigue, and corrosion from concrete's alkaline environment need to be investigated. Kumar et al. (1995) have studied the fatigue performance of concrete slabs with FRP rebars and concluded that the loss of stiffness was significant. Other impediments to the widespread use of FRP rebars include high material costs, lack of design guidelines, and lack of product quality and industry standardization. Recently, standardizing committees have been formed by ACI, ASTM2, and ASCE3 to address the issues of developing materials standards, test methods, design specifications, and design guidelines. Some researchers (Faza 1995; Kumar et al. 1995) have recently presented equations for evaluating FRP rebars and designing with them.
2 ASTM: American Society for Testing and Materials. 3 ASCE: American Society of Civil Engineers.
USACERLTR-98/81 11
Bonded FRP Plates
A vast majority of aerospace applications employ composite materials in a laminated form. Thin sheets of unidirectional fibers preimpregnated with resin are stacked on top of one another and bonded together through curing to form a two-dimensional composite member.
Similar to the bonding of steel plates for repairing concrete structures, FRP laminates have also been considered for use in such repairs. The associated advantages as described before are obvious in terms of lighter weight and corrosion resistance. In Switzerland very promising results have been obtained by using CFRP for concrete repair (Meier and Kaiser 1991). Because such repairs involve only small amount of FRP composites, the high-cost carbon fiber composites are the most preferred system. Prestressing of the bonded strengthening elements improves the performance. In the United States, similar work has been reported by Triantafillou and Plevris (1991). They have shown that strengthening or repair by FRP bonding to the concrete structure can improve the load-carrying capacity as well as the stiffness. Concerns in this technique revolve around the behavior under sustained loading, fatigue, thermal cycling, and humidity cycling. Recently Shahawy (1995) reported results for load cycling of a few FRP-repaired beams which clearly show a substantial increase in both the stiffness and the ultimate strength capacity of the repaired beams.
Research conducted by the Florida Department of Transportation Structures Research Center and the Florida Atlantic University Department of Ocean Engineering (Shahawy et al. 1996) and at the University of Delaware (Kaliakin 1996) shows the effectiveness of this type of strengthening. Both research efforts effectively predicted the behavior of composite-strengthened beams using non- linear finite element analysis. The research done at the Florida Department of Transportation and Florida Atlantic University focused on tension reinforcement and strengthening by applying composite laminates to the bottom surface of rectangular beams. The University of Delaware, on the other hand, wrapped composite plies around the web of reinforced concrete tee beams resulting in both tensile and shear reinforcement. Both experiments resulted in significantly increased stiffness and strength. Recently, research under a separate CPAR task group produced a technical report documenting concrete repair and external concrete reinforcement (Marshall 1998).
A widely used technique for retrofit of concrete columns is the placement of cylindrical steel jackets around the existing columns (Priestley and Seible 1991). To create a constraining effect, epoxy or concrete is pumped into the gap between the existing column and the jacket. A major disadvantage of this method is that
12 USACERL TR 98/81
it is very time-consuming and difficult. Furthermore, the steel jackets ultimately corrode. However, the confining action is effective in increasing both compressive strength and ductility of concrete structure. The use of FRP composite wraps as confining layers for concrete columns has thus become an increasingly popular idea in recent years (Harmon and Slattery 1992; Priestly et al. 1992; Hasegawa et al. 1992; Katsumata et al. 1988; Karbhari et al. 1993; Ma 1993).
Various FRP materials for column wrappings have been tried in the recent past. These include glass, aramid, and CFRP. The efficiency of the process depends on the final compaction of the fabric on the column. Most commonly used methods of wrapping include a variation of hand lay-up and wet lay-up/winding. An automated lay-up/winding system has also been developed. To improve the compaction of the FRP on the concrete column, Karbhari et al. (1993) have recently reported the resin-infusion technique. In this process the resin is injected under a vacuum film using a resin distribution medium. Since the vacuum is maintained until the resin is cured, the compaction level is generally high.
Durability of FRP
The durability issue of FRP composites has remained an open question to composite structural designers. Durability of FRP composites has recently been reviewed by several researchers (GangaRao et al. 1995; Dutta 1995; Dutta and Hui 1996; GangaRao and Dutta 1996). Many factors play roles in reducing the life of an engineering component.
Characteristics of most materials change by interaction with their surroundings over time. For example, oxidation of steel leads to rusting; rubber ages and becomes brittle under the effect of ozone; and loss of water leads wood to split. Therefore, before using composites, the designer must know what changes are likely to occur to FRP composites under given service conditions.
It is also important to define the effective service life of the materials. Polymeric composite materials may not fail or separate under a certain service loading condition, but can continue to deform or deflect beyond an acceptable limit. Thus, the effective service life ceases when a predetermined material deformation or deflection limit is exceeded.
Environment plays a crucial role in changing the properties of polymer matrix composites. The environment includes both the ambient environment and the
USACERLTR-98/81 13
mechanical loading environment, because both can affect the durability of composites. Considering the ambient environment, both matrix and fibers may be affected by moisture, temperature, solar ultraviolet (UV) radiation, and presence of degrading chemicals like salts or alkalis. Repeated excursions to very high and low temperatures (freeze-thaw cycling) may introduce some changes. Under a mechanical loading environment, as for steel, repeated loading may introduce fatigue in composites. A sustained load over time may cause the material to creep. The following discussions briefly summarize the effects of various service factors that affect the durability of FRP composites.
General Aging
Durability of FRP composites must be considered in the context of the role of the polymer matrix. It is normal for all polymers to undergo an extremely slow change of chemical (molecular) structure. The ambient environment—mainly the temperature and humidity—controls this change, which is known as the process of aging. When a polymer is cooled below its glass transition temperature, the material does not achieve instantaneous thermodynamic equilibrium. Instead, its free volume equilibrium evolves over time, and during this time the mechanical properties can change (Monaghan and Brinson 1994). As a result of physical aging, some polymers can become suffer and brittle, which can influence the matrix-dominated properties. However, the effects on the fiber-dominated properties will be minimal.
Moisture
Polymer matrix composites absorb moisture by instantaneous surface absorption and diffusion. Initially the absorption rate is high, then the rate slows down as the material approaches the saturation point (equüibrium). The time to reach the saturation point depends on material thickness and the ambient temperature. Drying can reverse the process but may not result in complete reattainment of the original properties.
The uptake of water by polymer composites in general follows the generalized Fick's Law of Diffusion. Figure 4a and 4b, extracted from a recent publication by Dutta and Hui (1997b), shows the typical Fickian behavior of two different FRP's. Figure 4a shows the moisture absorption rate of a 0.25 in. thick gel- coated FRP laminate and Figure 4b gives the moisture absorption rate of a commercially available FRP rebar. In reality, however, the exact rate of moisture uptake depends on several factors, including void content, fiber type, resin type, temperature, applied stress level, presence of microcracks, and thermal spikes.
14 USACERL TR 98/81
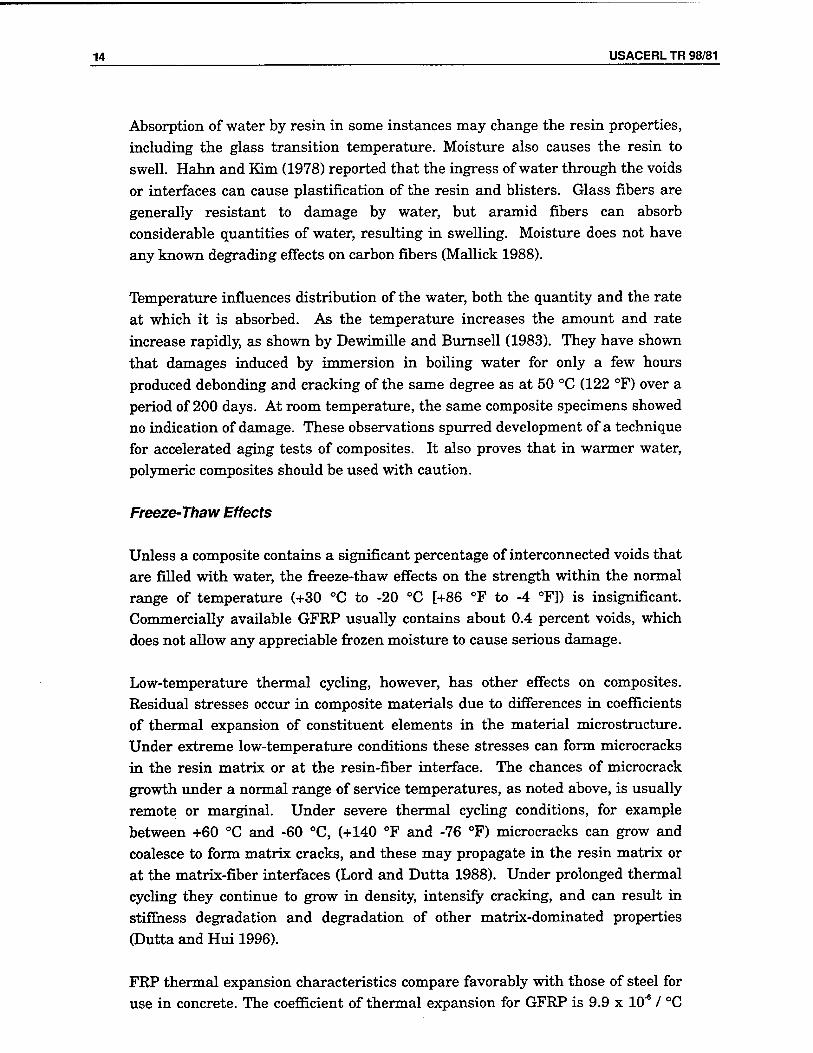
Absorption of water by resin in some instances may change the resin properties, including the glass transition temperature. Moisture also causes the resin to swell. Hahn and Kim (1978) reported that the ingress of water through the voids or interfaces can cause plastification of the resin and blisters. Glass fibers are generally resistant to damage by water, but aramid fibers can absorb considerable quantities of water, resulting in swelling. Moisture does not have any known degrading effects on carbon fibers (Mallick 1988).
Temperature influences distribution of the water, both the quantity and the rate at which it is absorbed. As the temperature increases the amount and rate increase rapidly, as shown by Dewimille and Burnsell (1983). They have shown that damages induced by immersion in boiling water for only a few hours produced debonding and cracking of the same degree as at 50 °C (122 °F) over a period of 200 days. At room temperature, the same composite specimens showed no indication of damage. These observations spurred development of a technique for accelerated aging tests of composites. It also proves that in warmer water, polymeric composites should be used with caution.
Freeze-Thaw Effects
Unless a composite contains a significant percentage of interconnected voids that are filled with water, the freeze-thaw effects on the strength within the normal range of temperature (+30 °C to -20 °C [+86 °F to -4 °F]) is insignificant. Commercially available GFRP usually contains about 0.4 percent voids, which does not allow any appreciable frozen moisture to cause serious damage.
Low-temperature thermal cycling, however, has other effects on composites. Residual stresses occur in composite materials due to differences in coefficients of thermal expansion of constituent elements in the material microstructure. Under extreme low-temperature conditions these stresses can form microcracks in the resin matrix or at the resin-fiber interface. The chances of microcrack growth under a normal range of service temperatures, as noted above, is usually remote or marginal. Under severe thermal cycling conditions, for example between +60 °C and -60 °C, (+140 °F and -76 °F) microcracks can grow and coalesce to form matrix cracks, and these may propagate in the resin matrix or at the matrix-fiber interfaces (Lord and Dutta 1988). Under prolonged thermal cycling they continue to grow in density, intensify cracking, and can result in stiffness degradation and degradation of other matrix-dominated properties (Dutta and Hui 1996).
FRP thermal expansion characteristics compare favorably with those of steel for use in concrete. The coefficient of thermal expansion for GFRP is 9.9 x 10"6 / °C
USACERLTR-98/81 15
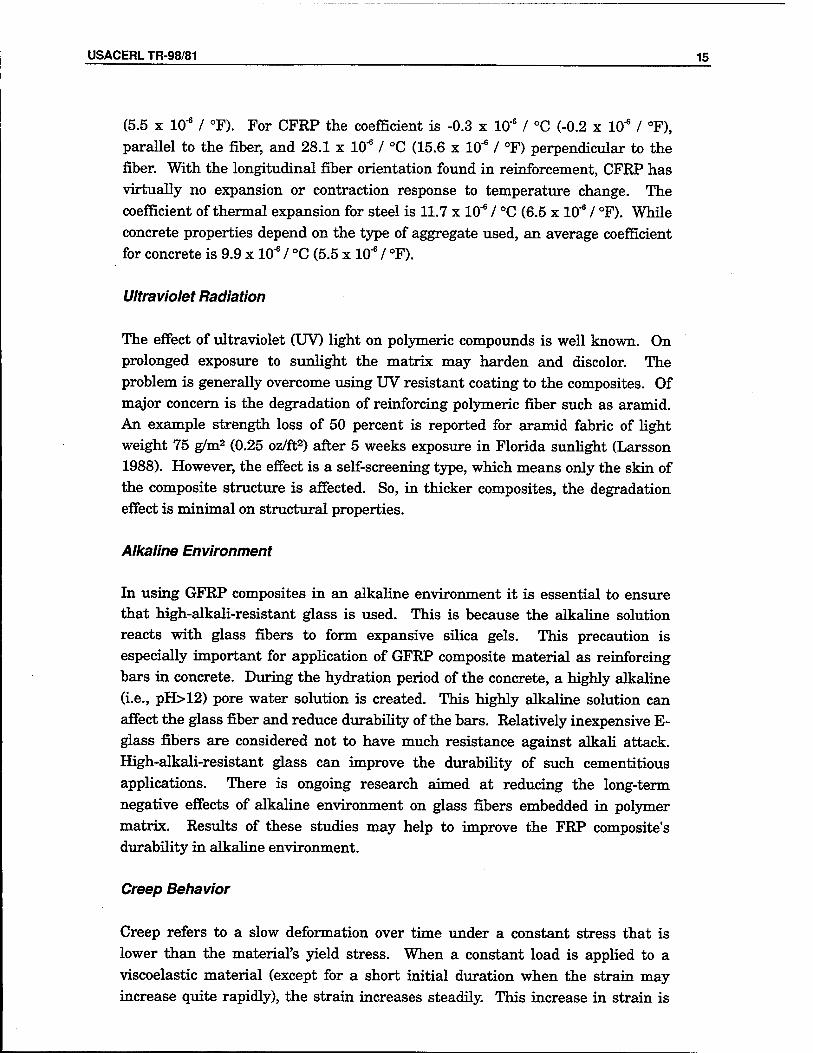
(5.5 x 10"6 / °F). For CFRP the coefficient is -0.3 x 10s / °C (-0.2 x 10⁻⁶ / °F), parallel to the fiber, and 28.1 x 10"6 / °C (15.6 x 10"6 / °F) perpendicular to the fiber. With the longitudinal fiber orientation found in reinforcement, CFRP has virtually no expansion or contraction response to temperature change. The coefficient of thermal expansion for steel is 11.7 x 10"6 / °C (6.5 x 10'6 / °F). While concrete properties depend on the type of aggregate used, an average coefficient for concrete is 9.9 x 10"6 / °C (5.5 x 10"6 / °F).
Ultraviolet Radiation
The effect of ultraviolet (UV) light on polymeric compounds is well known. On prolonged exposure to sunlight the matrix may harden and discolor. The problem is generally overcome using UV resistant coating to the composites. Of major concern is the degradation of reinforcing polymeric fiber such as aramid. An example strength loss of 50 percent is reported for aramid fabric of light weight 75 g/m2 (0.25 oz/ft2) after 5 weeks exposure in Florida sunlight (Larsson 1988). However, the effect is a self-screening type, which means only the skin of the composite structure is affected. So, in thicker composites, the degradation effect is minimal on structural properties.
Alkaline Environment
In using GFRP composites in an alkaline environment it is essential to ensure that high-alkali-resistant glass is used. This is because the alkaline solution reacts with glass fibers to form expansive silica gels. This precaution is especially important for application of GFRP composite material as reinforcing bars in concrete. During the hydration period of the concrete, a highly alkaline (i.e., pH>12) pore water solution is created. This highly alkaline solution can affect the glass fiber and reduce durability of the bars. Relatively inexpensive E- glass fibers are considered not to have much resistance against alkali attack. High-alkali-resistant glass can improve the durability of such cementitious applications. There is ongoing research aimed at reducing the long-term negative effects of alkaline environment on glass fibers embedded in polymer matrix. Results of these studies may help to improve the FRP composite's durability in alkaline environment.
Creep Behavior
Creep refers to a slow deformation over time under a constant stress that is lower than the material's yield stress. When a constant load is applied to a viscoelastic material (except for a short initial duration when the strain may increase quite rapidly), the strain increases steadily. This increase in strain is
16 USACERL TR 98/81
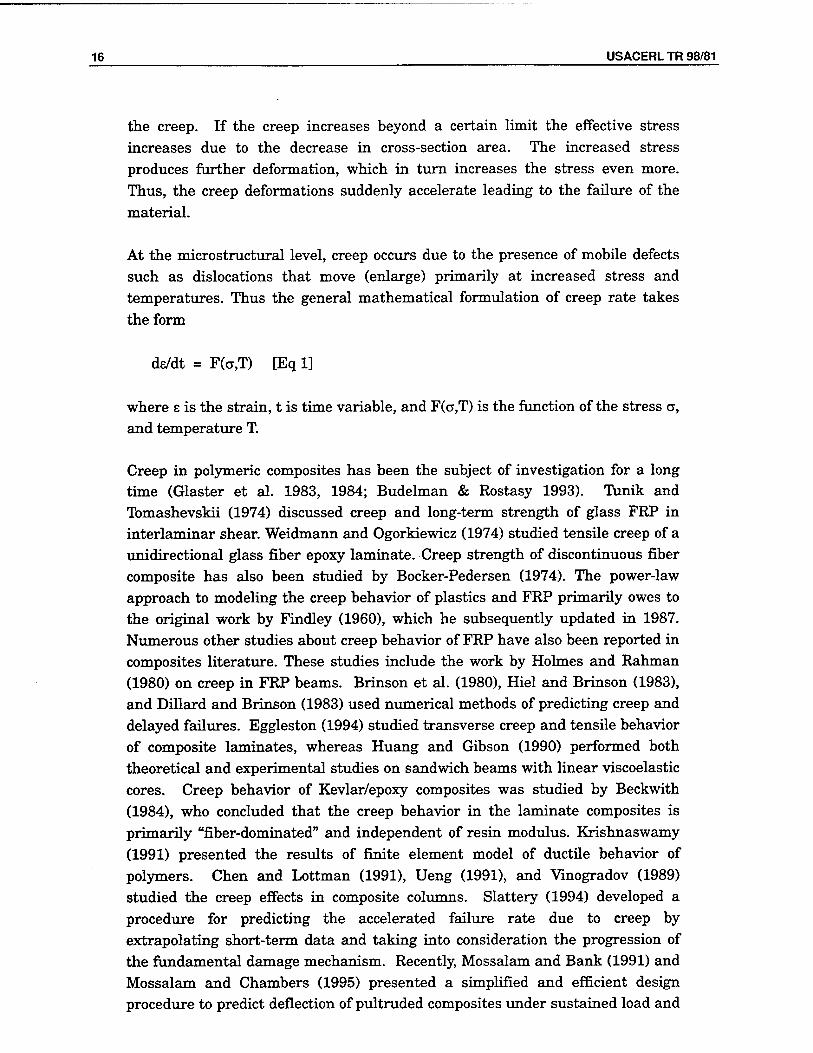
the creep. If the creep increases beyond a certain limit the effective stress increases due to the decrease in cross-section area. The increased stress produces further deformation, which in turn increases the stress even more. Thus, the creep deformations suddenly accelerate leading to the failure of the material.
At the microstructural level, creep occurs due to the presence of mobile defects such as dislocations that move (enlarge) primarily at increased stress and temperatures. Thus the general mathematical formulation of creep rate takes the form
ds/dt = F(a,T) [Eq 1]
where e is the strain, t is time variable, and F(a,T) is the function of the stress a, and temperature T.
Creep in polymeric composites has been the subject of investigation for a long time (Glaster et al. 1983, 1984; Budelman & Rostasy 1993). Tunik and Tomashevskii (1974) discussed creep and long-term strength of glass FRP in interlaminar shear. Weidmann and Ogorkiewicz (1974) studied tensile creep of a unidirectional glass fiber epoxy laminate. Creep strength of discontinuous fiber composite has also been studied by Bocker-Pedersen (1974). The power-law approach to modeling the creep behavior of plastics and FRP primarily owes to the original work by Findley (1960), which he subsequently updated in 1987. Numerous other studies about creep behavior of FRP have also been reported in composites literature. These studies include the work by Holmes and Rahman (1980) on creep in FRP beams. Brinson et al. (1980), Hiel and Brinson (1983), and Dillard and Brinson (1983) used numerical methods of predicting creep and delayed failures. Eggleston (1994) studied transverse creep and tensile behavior of composite laminates, whereas Huang and Gibson (1990) performed both theoretical and experimental studies on sandwich beams with linear viscoelastic cores. Creep behavior of Kevlar/epoxy composites was studied by Beckwith (1984), who concluded that the creep behavior in the laminate composites is primarily "fiber-dominated" and independent of resin modulus. Krishnaswamy (1991) presented the results of finite element model of ductile behavior of polymers. Chen and Lottman (1991), Ueng (1991), and Vinogradov (1989) studied the creep effects in composite columns. Slattery (1994) developed a procedure for predicting the accelerated failure rate due to creep by extrapolating short-term data and taking into consideration the progression of the fundamental damage mechanism. Recently, Mossalam and Bank (1991) and Mossalam and Chambers (1995) presented a simplified and efficient design procedure to predict deflection of pultruded composites under sustained load and
USACERLTR-98/81 17
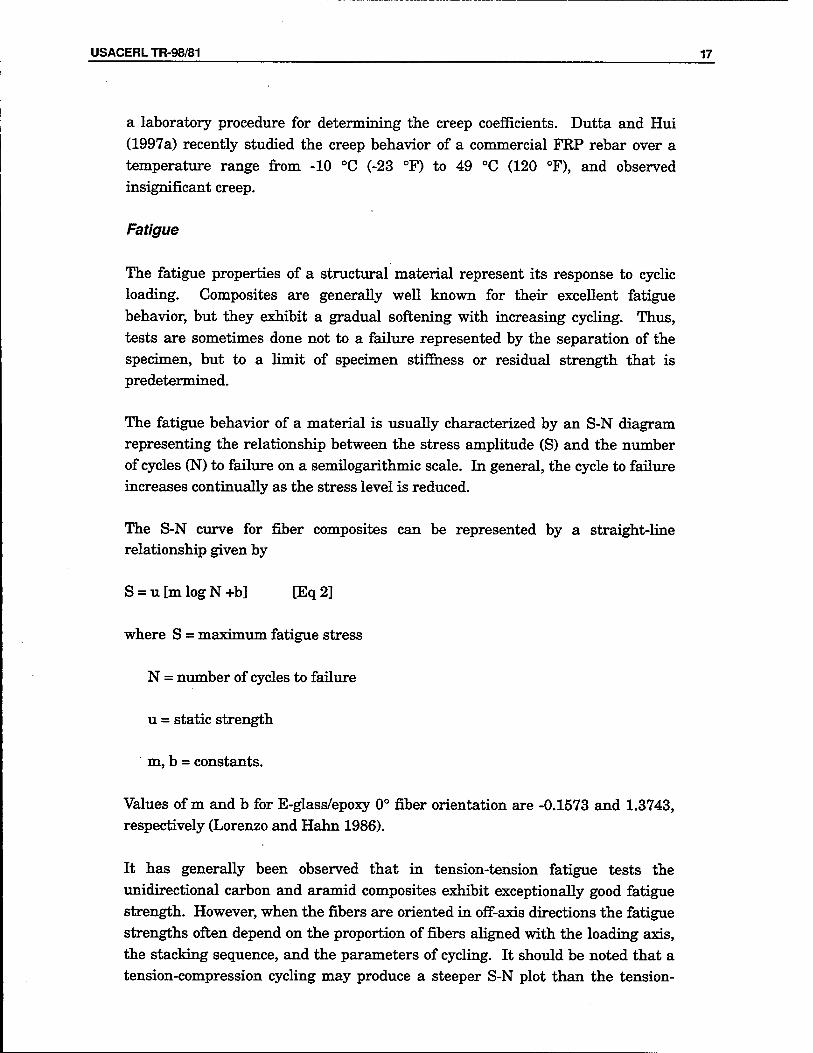
a laboratory procedure for determining the creep coefficients. Dutta and Hui (1997a) recently studied the creep behavior of a commercial FRP rebar over a temperature range from -10 °C (-23 °F) to 49 °C (120 °F), and observed insignificant creep.
Fatigue
The fatigue properties of a structural material represent its response to cyclic loading. Composites are generally well known for their excellent fatigue behavior, but they exhibit a gradual softening with increasing cycling. Thus, tests are sometimes done not to a failure represented by the separation of the specimen, but to a limit of specimen stiffness or residual strength that is predetermined.
The fatigue behavior of a material is usually characterized by an S-N diagram representing the relationship between the stress amplitude (S) and the number of cycles (N) to failure on a semilogarithmic scale. In general, the cycle to failure increases continually as the stress level is reduced.
The S-N curve for fiber composites can be represented by a straight-line relationship given by
S = u[mlogN+b] [Eq2]
where S = maximum fatigue stress
N = number of cycles to failure
u = static strength
m, b = constants.
Values of m and b for E-glass/epoxy 0° fiber orientation are -0.1573 and 1.3743, respectively (Lorenzo and Hahn 1986).
It has generally been observed that in tension-tension fatigue tests the unidirectional carbon and aramid composites exhibit exceptionally good fatigue strength. However, when the fibers are oriented in off-axis directions the fatigue strengths often depend on the proportion of fibers aligned with the loading axis, the stacking sequence, and the parameters of cycling. It should be noted that a tension-compression cycling may produce a steeper S-N plot than the tension-
18 USACERL TR 98/81
tension cycling. The fatigue performance of both E- and S- glass fiber reinforced composites are poorer than those of carbon or aramid composites (Mallick 1988).
Fire Hazards and Flammability
FRP Composites used for any structural construction must comply with local construction code requirements, including fire safety and other life-safety specifications. Where fire hazards exist the fire hazard characteristics— including the intended use of the structure to be designed; potential ignition sources; potential mode of flame and smoke spread; and means for detection, suppression, and extinguishment—must be identified and the proper building code and other fire code requirements determined. Heger (1981) has summarized the specific standards for plastics in a model building code. The following is a typical example:
The approved plastic materials shall be those that have self ignition temperature of 650 °F or greater when tested in accordance with the Uniform Building Code (U.B.C.) Standard 52-3 (ASTM D1929) and a smoke density rating not greater then 450 (ASTM E84). Approved plastic shall be classified in accordance with U.B.C. Standard 52-4 (ASTM E84).
Fire tests for FRP composites are to be based on end use, quantity, location, and special requirements by the owner. After identifying the fire hazard, a suitable test method must be either selected from standard tests, or developed for the specific need. These include ignition tests, flame spread tests, extinguishment, smoke evaluation, tests for toxicity, and fire endurance. Table 3 summarizes some of the standard fire tests. A review of industry literature on FRP composites shows that flammability properties are usually specified by the manufacturers.
Economics of FRP Reinforcement
In selecting an FRP reinforcement technology one must note that while cost of materials is an important criterion, it does not constitute the total cost of the project. Besides material cost, the designer should also consider the related costs of installation, maintenance over time, replacement of debilitated materials and worker safety. In many instances it has been shown that when life-cycle costs are considered, the FRP composite costs come out to be lower, especially in labor- intensive operations (Fibergrate 1993).
USACERLTR-98/81 19
In relative terms, the conventional steel-reinforced concrete structure is not expensive. Given the limitations of FRP materials that are outlined herein, there will not be many immediate applications where FRP use will be more economical than steel, except where the local environment creates conditions under which steel is not economical Economics will most readily favor FRP grid use in environments that create steel corrosion problems. The most obvious examples are marine environments and highway bridge decks. In highway bridge deck applications, where underlying girders may provide sufficient support to minimize deck deflection problems, FRP grid may prove to be effective in regions where road salt is heavily used. There will, for example, be some direct construction cost savings associated with the need for less reinforcing bar placement labor.
The critical issue here is the viability of manufacturing FRP grid on a large scale. Current manufacturing processes for composite materials and structures are based on weaving, braiding, pultrusion, and/or lamination. They require expensive facilities, manufacturing equipment, and processing. As a result, total processing costs amount to many times the material cost. However, this report will illustrate that the cost of manufacturing composite grids can be reduced to the level of material cost. In such a case, composite structures can then compete against more conventional materials.
20 USACERL TR 98/81
3 Grid Reinforcement Concept
Unidirectional composite grid-reinforced concrete structures provide a wide range of potential applications. These include concrete decks and slabs, curtain walls, highway bridge decks, and support and lining of underground tunnels or oil storage rock cavities. The advantages include the suppression of delamination and built-in redundancy. Corrosion and fatigue resistances of
composite materials can be claimed for the grids. In general, the grid
structure—being lightweight and formed into either curved or flat plates in factories—drastically reduces assembly work at the construction site. Offsite construction will allow for better quality control of the products. Because of its corrosion resistance it is a promising technology for reinforcing concrete in ocean coastal regions, and in cold regions of the world where corrosive salts are used for deicing roads.
In 1964 the National Aeronautics and Space Administration (NASA) began to search for an efficient geometry to be used in aerospace structural applications. The result was "a lattice of intersecting ribs forming an array of equilateral triangles" termed the "Isogrid" (see Figure 5). This proved to be a lightweight, economical, and efficient load carrying geometry (McDonnell Douglas Astronautics 1975; Kouri and Dutta 1993; Kouri et al. 1993). Researchers in the area of composite reinforcement for concrete would see this two-dimensional grid structure as a possible alternative to conventional one-dimensional steel reinforcement. A two-dimensional orthogrid structure (see Figure 6) makes it possible to take advantage of the unidirectional strength characteristics of advanced composite materials. The longitudinal ribs provide high strength and stiffness in two perpendicular directions. This makes the grid very suitable for applications such as bridge decks, flat slabs, walls, shear walls, and dams. The two-dimensional nature also allows for structures to be designed as two- dimensional elements rather than one-dimensional elements in two directions. While the orthogrid efficiently resists normal forces in two orthogonal directions, the isogrid may provide improved shear resistance for shear wall applications.
It is also possible that FRP grids could be employed in seismically active areas to provide confinement for reinforced concrete frame elements, particularly bridge and building columns. Recent earthquake experience (Northridge, CA and Kobe Japan) shows that confining frame elements—particularly columns—can greatly enhance their ductility during earthquake-induced motions. FRP wraps are
USACERLTR-98/81 21
already being employed as retrofits to older structures. FRP grids may provide good confinement mechanisms in both new construction and retrofits if the proper combinations of strength and stiffness can be developed.
The use of composites in aerospace applications came about because of their high strength and stiffness per unit weight. In the case of reinforced concrete, a more lightweight reinforcement does not significantly affect the overall weight of the structure. While the specific strength and stiffness do not in themselves warrant the use of composites, they are added benefits to a noncorrosive concrete reinforcement. The inherent geometry of an orthogrid structure also provides a more reliable load transfer mechanism than do steel reinforcing bars. The internal loads in the beam can be transferred through bearing on the orthogrid cross-members rather than through shear development along the length of the bars. Furthermore, composite manufacturing usually employs a "build-up" approach where materials are combined and added rather than cut or machined. This allows for geometric alterations, such as surface deformations, that can enhance the bond characteristics between the concrete and the composite grid.
Finally, composite grid reinforcement has the potential to significantly reduce labor costs. The tying of steel rebar is a tedious and labor-intensive process. Premanufactured grids can simply be cut and placed as a continuous sheet of reinforcement. Transportation costs would also be reduced significantly because of weight reduction in the reinforcement. Also, because the grid reinforcement will not corrode, the life of the structure can dramatically be increased and the maintenance costs significantly reduced. The high composite material costs can be offset by lower overall costs for the structure. The noncorrosive nature, high specific strength, high specific stiffness, and moldability make composites a natural choice for critical applications where corrosion is a problem.
Review of Composite Grid Reinforcement Research
Early research in the field of composite grid reinforcement of concrete was reported by Sugita et al. (1992) of Japan, who work with a New Fiber Composite Material for Reinforced Concrete (NEFMAC) grid made of either carbon fibers or a hybrid combination of carbon and glass fibers in a polymeric matrix. Its primary use is to reinforce concrete. The applications to date include rein- forcement for tunnel lining, shotcrete reinforcement, LPG tanks, fender plates, and precast curtain walls (none of which are primary structural components). Other types of commercial FRP grids include IMCO (molded grating), DURADEK (pultruded grating), SAFE-T-GRATE, KORDEK (rectangular grating), KORLOK (pultruded grating), and custom-manufactured grids.
22 USACERL TR 98/81
The design of reinforced concrete structure requires that flexural behavior be understood. The flexural behavior of a reinforced concrete beam can be characterized by its ultimate strength, failure mode, stiffness (or amount of deflection), and predictability. The following paragraphs summarize the results of research related to composite grid reinforcement.
Composite materials generally have a higher ultimate strength than steel, which allows for higher ultimate loads in composite-reinforced concrete. Bank, Xi, and Mosallam (1991) tested a wide range of pultruded and molded gratings embedded in concrete beams. All but one of the grid-reinforced beams exceeded the ultimate strength of the steel reinforced beam. Schmeckpeper and Goodspeed (1994) compared beams reinforced with NEFMAC composite grids with beams reinforced with an equivalent amount of steel based on axial rigidity of the reinforcement. Their results showed significantly higher ultimate strengths with the composite-grid-reinforced beams over the steel-reinforced beams. In both research efforts the higher composite tensile strength resulted in shear failure modes rather than tensile failure of the reinforcement.
Composite materials have the unique characteristic of a modulus of elasticity that can vary over a wide range depending on the amount and type of fibers used as well as the manufacturing process employed. Typical carbon fibers have a tensile modulus, similar to steel, around 29 x 106 pounds per square inch (psi). Once the fibers are embedded in a polymer matrix, the effective stiffness of the composite is lower than that of steel. This means that generally, in order to obtain a composite reinforcement with an equivalent stiffness to steel, a larger cross-sectional area must be employed. As stated earlier, Shmeckpeper and Goodspeed (1994) were able to compare composite grid reinforcement and steel reinforcement having equal stiffnesses. The results showed that the beams had the same load/deflection behavior up to the point where the steel yielded. The results from Bank, Xi, and Mosallam (1991) showed the effects of varying reinforcement stiffnesses. Some of the beams reinforced with the commercially available grids approached the stiffness of the steel-reinforced beams. Larralde and Zervai (1991) took a different approach by comparing the flexural behavior of FRP grating materials alone and embedded in concrete. The purpose of the tests was to show that FRP structural grating which was designed to carry load independently can be enhanced by adding concrete. The authors concluded that concrete can be used to enhance the stiffness of the FRP grids and that using the gratings for concrete reinforcement in corrosive applications is feasible.
As stated previously, the general principles and theories currently applied to the design of reinforced concrete structures can be effectively applied to composite reinforcement as well. Banthia(1995) tested the flexural response of reinforced
USACERLTR-98/81 23
concrete slabs and found that current code equations can effectively and accurately be applied to FRP-reinforced concrete. Shmeckpeper and Goodspeed (1994) investigated beams reinforced with NEFMAC grids and also concluded that the flexural behavior can be predicted with current design procedures. In another article, however, Goodspeed et al. (1991) found that the actual deflections were slightly greater than predicted.
Sugita (1993) and Sugita et al. (1992) indicate that the Japanese have also explored the use of FRP-grid reinforcement for shotcrete applications. The prefabricated nature of the grid lowers construction effort. The flexible nature of the grid that results from its low stiffness permits easier placement on non- planar surfaces such as those found in tunnels. These researchers have also found that the higher flexibility of the FRP grid results in fewer voids in the shotcrete matrix that later require filling, further reducing construction costs. This may indicate a viable use for FRP reinforcement in constructing concrete elements with curved surfaces (e.g., domes, etc.).
The variability in the types of composite grids available has created some problems for research in the area of composite-grid-reinforced concrete. As can be inferred from the work that has been done, there is not a well established basis for comparison. For the most part researchers have used what is commercially available. This includes pultruded sections with mechanically attached crossmembers, molded gratings, different fibers, different volume fractions, and different spacings. Despite the difficulties, the past research has been fairly successful as a preliminary investigation. Researchers have shown that the fundamental principles used in design of reinforced concrete structures are directly applicable to composite reinforcement in concrete.
Grid Geometry and Design
Grid design is not a new structural concept (Meyer 1973). As noted, astronautical engineers use such lattices to stiffen spacecraft solar cell arrays. Aeronautical engineers stiffen fuselage and engine components with them. Architectural engineers reinforce vertical structures and towers with frame elements. Facility design engineers employ them as flooring and catwalks. Civil engineers use them in numerous applications, ranging from sewer grates to bridges. The grid lattice structures are generally created by bonding together isotropic material beams. Unfortunately, isotropic materials are not optimal for use in grid structures because multidirectional strength and stiffness properties are wasted in beams sustaining mostly unidirectional load. Moreover, the secondary processing required to bond the beams together at each crossover
24 USACERL TR 98/81
point is highly labor-intensive. It appears that successful exploitation of grid structures leads to better material utilization and more efficient manufacturing methods.
Advanced fiber-matrix composite materials are uniquely suitable for structures subjected primarily to unidirectional loading. The fibers, such as E-glass and graphite, are unidirectional in strength and stiffness. This implies that a grid structure, with unidirectional loads in the beams, would make full use of the material's capabilities. With such materials available, the challenge is to develop manufacturing processes that efficiently utilize the materials to produce lattice structures with uniformly high properties at all points, provide controlled final part geometry without post-processing, and reduce or eliminate manufacturing waste material to reduce costs.
Grid Types and Terminology
The basic grid is a latticework of rigid, interconnecting beams in two, three, or four groups and directions. Figure 7 demonstrates the most basic grid structure and the terminology used to describe it. Nodes, ribs, beams, and cells are the grid structure elements. Nodes are the crossover points, ribs are the linear segments that span adjacent nodes, and beams are a collection of aligned ribs and nodes. Cells are the spaces enclosed between ribs. Structurally related terms are center-to-center, in-plane, and out-of-plane. Center-to-center indicates the distance between the centers of adjacent parallel beams. In-plane actions take place within the plane of the grid. Out-of-plane actions occur orthogonal to the plane of the grid. Element-level terms describe the rib cross-sectional dimensions where width is an in-plane measurement while depth (thickness) is out-of-plane.
The displayed grid segment comprises of many beams placed in a bidirectional pattern, giving rise to the reference term of bi-grid. A special case of the bi-grid is one in which the beams intersect orthogonally with equal spacing. In this configuration, there are two identical mechanical directions, and the terms orthogrid and %I2 structure are applied.
Tri-grids are the next level of complexity, with three beam groups and directions. A special case of this tri-grid is known as an isogrid or TC/3 structure. The isogrid has three identical mechanical directions from the uniform distribution of beams at 0 degrees / ± 60 degrees to form equilateral pockets. Figure 8 shows an example of this grid type.
USACERLTR-98/81 25
A final grid configuration, the quadri-grid, uses four beam groups. When equally distributed at 0/±45/90 degrees, this grid has four equivalent directions and is labeled as a TC/4 structure. The main benefit of this structure over the isogrid is not in the mechanical performance, but rather in the usefulness of the geometry. A rectangular plate cut from an isogrid has only two sides along which beams span the entire distance, which makes joining to surrounding structures difficult. The same size plate cut from a TC/4 grid can have beams spanning the entire perimeter, allowing for simple joining to surrounding structures.
Grids as Structures
Grids are generally added to solid panels and shells to increase out-of-plane flexural stiffness with minimal added weight. A simpler method is to use a grid only, designing the beams to support both flexural and in-plane loads. Such a grid would be an independent structural element with unassisted load-bearing capability in all directions. The expected benefits of this configuration may be seen by comparing grids to sandwich structures, in which the cells are filled. Problems with sandwich structures include core moisture entrapment and bonds between the skin and core, which cannot be inspected. Conversely, grid structures have open cells that facilitate inspection and moisture escape. Grids also solve such vexing applications problems such as providing for passage of wires, pipes, and fluids through a structure.
Making a structurally independent grid requires proper design of both the beam and grid geometries. The design of the beam geometry must provide significant moments of inertia to resist flexural loads and nominal cross-sectional area to handle axial loads. The grid geometry must have a beam pattern that generates balanced reinforcement against all possible in-plane loads. The isogrid is the best configuration for this purpose. The McDonnell Douglas Special Space Programs (Kouri and Dutta 1993) found "the isogrid lattice to be a complete structure by itself; that is, it can effectively resist tension, compression, shear, and bending loads" while also being "torsionally stiff" (McDonnell Douglas 1981). Chen (1995) investigated the relative mechanical competitiveness of solid panels, sandwich panels, and isogrid panels—all configurations in both isotropic materials and composites. He discovered that isogrids made from unidirectional fiber composites have (1) the highest in-plane strength with stiffness only slightly reduced from other configurations, (2) flexural strength greater than solid panels and similar to sandwiches, and (3) minimal hygrothermal response.
Grids, which are structurally complete, have the possibility of being used in many applications from high-tech aircraft primary or secondary structures and
26 USACERL TR 98/81
jet engine components to low-tech cargo containers and concrete reinforcement. However, cost generally limits their use. Isotropie grids are usually made from separate beams that are clamped and bonded together at crossover points. Straight beams may be easy to manufacture, but the clamp and bond procedure is time-intensive and strewn with opportunities for error. More complex and costly beams are necessary if constant thickness is desired, for example, when the beams are shaped to pass through each other in key-and-hole fashion. In higher quality no-bond methods, a solid panel is machined down to a grid, removing all pocket material. This takes a considerable amount of time and the vast majority of original material becomes scrap. Isotropie materials are not efficient for application to grid structures.
Composite Material Grids
Laminated structures are a standard design when using advanced composite (fiber-matrix) materials. Sheets (plies) of aligned fibers are stacked, each aligned in a specified direction to optimize structural strength and stiffness in multidirectional load cases. This method of generating composite structures is well established but not without its difficulties. Panel design is often driven by transverse properties since the lamination is subject to damage at the interface of cross-aligned plies. This occurs because the brittle matrix is the only bonding agent in these interfaces. Conversely, plies with parallel fibers tend to bond both adhesively and mechanically. Fibers in these unidirectional plies tend to cross and reinforce the interface, as if the plies were sewn together. These aligned plies are rarely susceptible to delamination damage. Different from laminates, grid structures take advantage of both the fiber-aligned damage resilience through unidirectional beams, and fiber-unaligned multidirectional strength through multidirectional beam configurations. Unidirectional fiber ribs also allow for failure strains to be determined mostly by the fiber rather than the matrix properties.
As noted above, structurally independent grids need to be manufactured from beams with axial properties sufficient to resist in-plane tension, compression, shear, and torsion. Isotropie materials best resist these in-plane loads as solid plates rather than as grids. Advanced composite materials have many characteristics that make the grid configuration reasonable. Grid beam elements inherently bear loads in a single direction, as do composites fibers. Metal, however, is a tridirectional material, which means that the grid configuration uses only one-third of the metal's load-carrying capacity. In the single direction of interest, the specific strength (strength/weight) and stiffness (modulus/weight) of unidirectional composites are many times greater than
USACERLTR-98/81 27
standard metals. Even after reducing the properties to account for multi- direction beam alignments, the ideal composite grid structures perform better than metal grids, as seen in Figure 9. The concern for isotropic behavior is also resolved by composites in the grid configuration because the isogrid pattern displays isotropic panel behavior, as would a solid metal panel. Thus, combining the material benefits of unidirectional composite beams with the geometric benefits of the isogrid pattern, advanced composite materials are ideally suited for making structurally independent grids.
Manufacturing is also a major consideration driving the exploration of composite grids. Currently, metal grids are manufactured either by bonding together individual metal beams or by machining a grid from a solid metal panel. Both methods have problems with respect to cost, time, implementation effort, and opportunities for error. Composite grid manufacturing can provide net shape parts directly from the mold without secondary processing steps. Filament winding and tow placement methods may be used to provide continuous fiber deposition for low cost at a high production rate. Composite grids can be manufactured in patterns providing the desired unidirectional beams, interlaced at the nodes at each layer, as seen in Figure 10. These interlaced nodes are susceptible to damage similar to laminated panels, but nodal delamination failures are generally non-propagating because the unidirectional ribs are not susceptible to delamination.
Previous Composite Grids
Various commercial and research attempts have been made to manufacture composites grid structures. Most have restricted themselves to a simple orthogrid structure, and have achieved only limited success. The methods have spanned a wide variety of processes, from filament winding to fiber draping, and from using molds of rigid metal to soft silicon rubber. Several companies have succeeded in producing orthogrid structures for commercial sale. However, they produce only flat orthogrid structures that do not utilize the fibers to their best advantage. The issues of distributed fiber crossovers and achieving high-density interlacing still remains. Typical specimens from these companies have fiber volumes of Vf node = 45 percent and Vf rib = 25 percent—much lower than the desired quantity of Vf total = 55 percent.
One research group with moderate success is the U.S. Air Force (USAF) Phillips Laboratories. Work there has centered on flat panel isogrids for use as solar panel stiffeners. The method developed in this lab uses an inverted master mold of steel to generate silicon rubber molds. These silicon molds make up to six
28 USACERL TR 98/81
panels before they are terminally damaged and discarded. Because the silicon is soft, tight control of the various grid dimensions is impossible; and the rib width is exceedingly thin. The width limits the grids to use as stiffening agents for solid panels rather than as complete structures with in-plane strength and stiffness properties able to resist axial loads without excessive deformation. Finally, the USAF Phillips isogrids have offset beam groups designed so that all three do not cross through a single node center (Koury and Dutta 1993). This approach generates two different cell shapes, making multigrid joining and modular repair difficult.
Properties and Behavior of Composite Grids as Concrete Reinforcement
In general, reinforcement in concrete structural elements is used to sustain tensile forces while the concrete sustains compressive forces. Concrete is significantly stronger in compression than it is in tension; conventional structural design procedures usually ignore its tensile strength. Whether the reinforcement used in an element is placed for flexural tension, shear (diagonal tension), or confinement, it is there to provide tensile strength. Conventional steel reinforcement also provides deformation ductility to structural elements through its ability to sustain large strains after its initial yield. Some of the key properties to consider in evaluating concrete reinforcement materials include ductility, tensile strength and stiffness, the mechanism for force transfer between the reinforcement and surrounding concrete (i.e., bond), and flexure.
Ductility
FRP composites are typically elastic in their tensile stress-strain characteristics up to the point of fiber rupture. Each individual fiber fails completely, with no ductility. The literature generally suggests that, in aggregate, bundles of plastic fibers will fail sequentially, so that behavior somewhat resembling ductility occurs. This "pseudo-ductility" is random and depends heavily upon the fabrication process. This phenomenon is not as pronounced or as predictable as the yielding found in steel. Therefore, FRP reinforcement cannot be relied upon to provide the hysteretic behavior found with steel reinforcement.
Strength and Stiffness
A report by the American Concrete Institute (ACI-440R 1995) indicates that individual E-glass fibers in FRP rebars, which may be considered as the baseline reference material, have tensile strengths of approximately 3.5 GPa (500 ksi)
USACERLTR-98/81 _^ 29
and a tensile modulus of 73 GPa (10.5 x 10³ ksi). Strain at tensile failure is approximately 5.0 percent. Individual carbon fibers have tensile strengths similar to that of E-glass, but are suffer, with tensile moduli of approximately 230 GPa (33 x 103 ksi). Strain at failure is approximately 1.5 percent to 2.0 percent. More important than individual fiber properties, however, are the properties of the composites that result from using these materials. GFRP bars with tensile strengths of 500 - 1200 MPa (75 - 175 ksi) have corresponding tensile moduli of 40 - 55 GPa (6 - 8 x 10³ ksi); similar CFRP bars have tensile strengths of 160 - 2400 MPa (240 - 350 ksi) and tensile moduli of 150 -165 GPa (22 - 24 x 103 ksi). Corresponding failure strains were 3.5 percent to 5.0 percent for GFRP bars and 1.0 percent to 1.5 percent for CFRP bars. The strength and stiffness characteristics are affected directly by the volume of fibers contained in the composite matrix. The resin in the composite matrix contributes only minimally to the overall stiffness and can practically be ignored. The above characteristics were obtained in bars with 45 percent to 70 percent fiber volumes in the total matrix.
One should also note that the tensile characteristics of both the GFRP and the CFRP composites contrast with those of steel—the traditional means of reinforcing concrete—in two key ways. First, steel is significantly stiffer than the composites. The tensile modulus of steel is 200 GPa (29 x 103 ksi). For a given load that is resisted by the reinforcing elements, both the deflections of the structural element and the cracking in the surrounding concrete matrix will be larger with the FRP composites than with steel (assuming that concrete cross- section is the same in both cases and the reinforcement is sized for strength). Additionally, the FRP composites exhibit no range of yielding beyond a failure, (i.e., ultimate strength). They behave elastically up to the point of tensile failure, and then failure, or rupture, is sudden. Steel behaves in a ductile manner, with a defined yield strength followed by a relatively large yielding envelope. Steel strains at tensile failure are typically on the order of 10 percent, following an initial yield strain of significantly less than 1 percent. Figure 11 illustrates typical steel and FRP stress-strain characteristics. In the figure, "C- FRP" represents CFRP, while "H-FRP" represents a hybrid carbon and glass FRP
FRP Reinforcement Bond Characteristics
Effective force transfer between the reinforcement and surrounding concrete matrix is essential. In conventional steel-reinforced concrete elements, the individual reinforcing bars are fabricated with deformations that are either raised above the nominal bar circumference or indented into the circumference. These deformations facilitate load transfer and prevent the bars from slipping
30 USACERL TR 98/81
within the concrete matrix. This load transfer mechanism is commonly known
as bond.
While individual FRP reinforcing bars that have been fabricated usually incorporate some type of surface deformations that facilitate load transfer, the surface finish on the FRP grid ribs used in this study are smooth. Essentially no load transfer in the traditional sense of bar bond is possible. Instead, the ribs that are orthogonal to the primary reinforcing ribs provide direct bearing surfaces for the concrete matrix to transfer force to the reinforcement. As opposed to the distributed force transfer that is provided by conventional deformed reinforcement, force transfer in a composite grid is concentrated at these intersecting grid lines. There are several implications from these differences. First, it will be necessary to ensure that the grid joints (where the orthogonal ribs intersect) are structurally capable of transferring the force without failure. Second, the concentration of force transfer in the concrete matrix may lead to larger individual crack widths that are concentrated at the grid points (Schmeckpeper and Goodspeed 1994). A third, less-explored issue is the possible formation of shear failure planes in the concrete matrix along these orthogonal grid lines that could accompany the concentrated load transfer
mechanisms.
Flexural Behavior
Schmeckpeper and Goodspeed (1994) have reported the results of beam bending tests at the University of New Hampshire. Researchers there cast reinforced concrete beams in three configurations: steel-reinforced, CFRP-reinforced, and hybrid CFRP/GFRP-reinforced (referred to here as HFRP). Both FRP types were grids. The steel-reinforced beams were reference specimens designed in accordance with ACI requirements for flexural design that ensure ductile behavior. The researchers sought to match the stiffness of the reference beam with both types of FRP-reinforced beams. This was accomplished by matching the reinforcement axial rigidity, which is defined as the area of longitudinal reinforcement in the beam cross-section multiplied by its tensile modulus. The researchers were able to match the reference stiffness in the case of the CFRP- reinforced beams; the required CFRP reinforcement area was 2.4 times that of the steel reference. The lower tensile modulus of the glass fiber in the HFRP specimens required that a large volume of the hybrid reinforcement be used to match the steel reinforcement axial rigidity. The required GFRP reinforcement area would have been 4.8 times that of the steel reference, but concrete placement prohibited using this high volume of reinforcement. Therefore, the stiffness of the hybrid-reinforced beams was lower than the reference stiffness. The FRP composite-reinforced specimens failed in a brittle manner instead of the
USACERLTR-98/81 31
ductile manner of steel reinforcement, largely due to concrete crushing. The lower-stiffness hybrid composite specimens had significantly higher deflections at service load than either the CFRP specimens or the steel specimens. Figure 12 presents the results of some of these bending tests, comparing the steel, CFRP, and hybrid fiber-reinforced (HFRP) specimens. There were several additional significant observations:
1. The ultimate capacities of both FRP specimens were significantly higher (more than 3 times) than the steel specimen (noting that reinforcement volumes were higher, too).
2. Energy dissipation, as measured by the area under the load/deflection curve, was quite good, comparable to steel for both types of composite specimens. The nature of the energy dissipation was quite different, however. With steel reinforcement, energy dissipation occurs through large inelastic strains at relatively low stress levels. With FRP reinforcement, energy dissipation occurs through elastic strains with corresponding higher stresses.
3. In examining service load/deflection of the beam, the CFRP-reinforced beam specimens had the same load capacity as the steel-reinforced reference. The ACI Building Code (ACI 318-95) limits live load/deflection of noncritical structural elements to 1/180 of the beam length. At this midspan deflection, the CFRP and steel specimens resisted the same load. The hybrid-reinforced specimen resisted 60 percent of this load at the same midspan deflection.
Fujisaki et al. (1993), Sugita (1993), and Sugita et al. (1992) reported the results of a test series in Japan. They performed research on various FRP grid- reinforced concrete elements. In addition to the same types of beam tests as those reported in Schmeckpeper and Goodspeed (1994)—which yielded essentially the same results—the Japanese authors tested slab specimens in bending and wall sections in shear. In the slab bending tests, they made many of the same observations about the behavior of FRP-reinforced elements as those made from the beam tests. The Japanese authors also examined prestressing the FRP reinforcement in some of the slab tests. The relatively high ultimate strength and low creep susceptibility of the FRP reinforcement can lead to efficiency in the prestressing application, but problems associated with brittle failure remain.
The Japanese tests of shear wall models included both steel-reinforced reference specimens and two configurations of HFRP specimens. The shear walls were loaded cyclically in-plane through a number of reversed cycles of increasing displacement magnitude to failure. Prior to reinforcement yield, the FRP specimens performed very similarly to the steel reference specimen; hysteretic

32 USACERL TR 98/81
behavior for the different specimens is comparable. After reinforcement yield, the FRP specimens behaved in a less ductile manner than the steel specimen.
The Japanese papers also indicate that the researchers have developed a mechanized means of producing the FRP grid, but few details are presented.
USACERLTR-98/81 33
4 Analysis Of Grid Reinforcement
Grids are like the skeleton of a human body or the frame of old airplanes made of wood and cloth cover. The grid carries the primary load, where as, skins or covers are there for another function. The FRP grids are formed by a network of ribs made of unidirectional composites, which are many times stronger and lighter than metallic materials. The key is to exploit the unidirectional properties. While concrete and metallic grids have been made, their performance is limited because the ribs are isotropic. Only when ribs are unidirectional can the true potential of grids be realized. By modeling, it will be shown how to capitalize on this principle and combine it with low-cost manufacturing.
A grid analysis model analogous to classical laminated plate theory has been developed at Stanford University (Chen and Tsai 1996). Like laminated plate theory, in this model also the applied in-plane stress {N} and bending moment {M} are user-defined. The model performs a point-stress analysis of a grid having ribs oriented in 0, 90, and +/- degrees. Thus, any of the grid systems shown in Figure 13—i.e., isogrid, orthogrid, or angle grid—could be used for analysis. Grid analysis is performed using a spreadsheet-based program (Chen and Tsai 1996) that yields stiffness and compliance components of the structure. It also identifies the strength at the initial failure and the particular mode of failure. Failure modes include rib strength, rib buckling, skin ply-by-ply strength, and skin buckling.
The structural optimization of the design is performed in two steps. First, the grid-analysis program is used to select an optimal grid at highly stressed points within a structure. The resulting effective stiffness of the grid is used in a finite element analysis of the structure. From a new set of internal loads at critical locations the grid-analysis program is used again to generate a new grid design. Then, another finite element analysis is performed. This iterative process is continued until an optimal design is achieved.
The grids can be formed into a flat, curved, or three-dimensional grid shape. They can also employ sandwich construction in which two sheets of orthogrids structurally interconnected through offset blocks may be the facing material. In concrete slab reinforcement the placement will be nonsymmetric, with only one layer of grid located on the tensile side. The models for such symmetric and
34 USACERL TR 98/81
nonsymmetric configurations have been developed at Stanford University following the well established models of laminated construction commonly used for composite structures. On the grid layer level, a contact model between the grid and the concrete filler can predict the effective stiffness of the filled grid layer.
Geometric Parameters
The principal geometric parameters of grids are the length L, width b, and height h of the ribs. Because ribs are treated as beams, it is assumed that length L is considerably larger than b and h. The definition of L for square grid is different from that for isogrids, as shown in Figure 13. A useful dimensionless measure is the rib area fraction f within a unit cell. This fraction is related to the length and width of the ribs and their orientations in the end. Three values of f are shown in Figure 14 for isogrids (on the top row) and square ends (the bottom row). These pictures are representations of grids that are sparse on the left and increase in density as they move to the right. A dense square or rectangular grid is also called a waffle plate, characterized by heavy ribs that will not buckle.
The value of area fraction f is the same as the rib volume fraction if the grid pattern remains constant throughout the grid height. The rib fraction is analogous to the fiber volume fraction of a composite material. But fiber fraction in composite plies is not a common design variable because material suppliers often predetermine the fraction. For grids, however, rib fraction is an important design variable and must be deliberately selected for a given design. As will be illustrated in later text, the fractions shown in Figure 14 depict practical ranges from the considerations of global stiffness, strength and mass, the assembly methods, and the design of the rib intersections.
Rib height h is also a critical design parameter that determines the flexural rigidity of the grid. A height-to-width ratio or hub less than unity is a shallow grid; a ratio greater than unity is a tall grid. Height affects the assembly method of the grid. Grids with stacked joints are suitable for shallow grids, while those with slotted and interlace joints are suitable for tall grids. Ribs may fail when their strengths are exceeded, or they may buckle under compressive or torsional load. If Euler buckling occurs the ribs move in the lateral direction. For shallow grids where h/b < 1, Euler buckling is governed by length-to-height ratio L/h; for tall grids where h/b > 1, Euler buckling is governed by the length- to-width or slenderness ratio L/b. Such failure mode must be compared with
USACERLTR-98/81 35
failure by compressive strength and buckling by shear. Whichever value is the lowest is considered the controlling failure mode.
The relation defining the rib length L or L/b and the area fraction f of a grid are functions of the grid configuration. Figure 15 illustrates definitions of L and f for iso- and square grids. A visual presentation of an isogrid compared with square grids is featured. All grids have the same rib width. The smaller square grid on the left has the same area fraction f but different L as the isogrid in the middle. The larger square grid on the right has the same L but different f as the isogrid. For the smaller square grid, the length L is reduced by V3; for the larger square grid, the area fraction f is reduced by V3.
While there is a one-to-one relation between fraction f and L/b, each serves its own purpose in the design of composite grids. Area fraction f can be treated as a material property that governs both in-plane and flexural stiffnesses in a consistent manner. Slenderness ratio L/b is useful in its direct relation to Euler buckling of the ribs. The area fraction f is preferred here because it reflects the weight and amount of material used in a grid.
With regard to the hub parameter, grids that have the same rib configuration along their height have the same homogeneous characteristics as solid panels. Their flexural rigidities increase with the cube of the height. Sandwich panels, on the other hand, have flexural rigidities that depend on both the heights of the core and the laminated face sheets. They have the most efficient flexural rigidities because the load-carrying face sheets are located in the outermost positions. Grids can also have one or two face sheets in order to improve their flexural rigidities. Even without face sheets, grids can be used effectively for flexural applications when the height exceeds the limit of conventionally available sandwich core.
Mechanical Properties of Grids
The following sections describe the stiffness and strength of grids and compare them with comparable properties of laminates. It is useful to compare the stiffness of laminates and equivalent grids. The simplest comparison is that between isotropic laminates and isogrids.
36 USACERL TR 98/81
Stiffness of Quasi-lsotropic Laminates
There is a close relation between composite laminate and composite grid. Grids can be viewed simply as a special case of laminates. This perspective will be used in deriving the stiffness and strengths of grids.
Laminates become quasi-isotropic with equally spaced ply orientations of n/3, id A, 7c/5 and so on. Similarly isotropy of the grid is assured when, say, the three ribs are spaced at 60 degrees or TI/3 apart.
There are closed-form solutions of the plane stress stiffness components (Tsai 1992). The quasi-isotropic invariants (the terms that are not affected by orientations, and thus are most useful in designing with composites) are linear combinations of the ply stiffness components shown below (see Table 3.1 in Tsai 1992):
Ux = 3/8 (Q„ + Q„) + 1/4 Q^ + 1/2 QM
U4 = l/8(QIJI + Qyy) + 3/4Qv-l/2QM
U5 = l/8(Q„ + Qyy)-l/4Qxy+l/2QM [Eq3]
where Q denotes the "reduced stiffness" and U represents constants that give the effective measure of the lamina stiffness (Jones 1975). The subscripts of U as 1,2,3... refer to contracted numerical notation, and subscripts of Q refer to the corresponding regular letter notations.
The quasi-isotropic Young's modulus, Poisson's ratio, and shear modulus of the laminates are functions of the invariants:
E^ = D/U,, ViM = U/U;, G^ = U5; [Eq 4]
where D = V1'-TJ*
This simplifies when the degree of anisotropy of a composite ply increases to the upper limit (unidirectional composite); the only dominant stiffness component is the longitudinal Young's modulus E,. The matrix-related components become vanishingly small. Then the invariants can be represented by the following expressions:
U, = 3/8 Ex, U4 = 1/8 E„ U5 = 1/8 Ex [Eq 5]
USACERLTR-98/81 37
The resulting engineering constants of this limiting quasi-isotropic laminate are:
Eiso =1/3 Ex, Viso =1/3, G^ =1/8 Ex [Eq 6]
Stiffness oflsogrids
A composite isogrid is portrayed in Figure 16 as a regrouped laminate where the matrix stiffness is approaching zero. The same 1/3 factor in Equation 6 can he applied for the contribution of rib stiffness to the isogrid stiffness. This global stiffness however must be weighted by area fraction f. This factor is proportional to the ratio of width b and spacing L of each rib. The Poisson's ratio can also be shown to have the same value of 1/3 as a laminate without matrix. A straightforward but rigorous derivation of the Poisson's ratio of an isogrid as a truss will produce this special value. The following global Young's modulus and Poisson's ratio of an isogrid are easy to use and to remember:
V = m E* = 2^3(L/b» E*; ^ = 1/3 [Eq 7]
where b = rib width and L = rib length as per the relationships shown in Figure 15. For square ends, the relation between the global stiffness and area fraction f or slenderness ratio L/b will be different.
The relations here apply to interlaced isogrids where all ribs are in the same plane. For stacked joint grids, ribs of different orientations run in different planes and yield an effective stiffness lower than that of interlaced grids having the same overall rib geometry. The global thickness of the grid is the sum of the rib thicknesses. The effective stiffness of such grids would be lower than that of interlaced grids having the same rib geometry.
The grid stiffness depends on the rib stiffness and geometry. It can be shown that the detail of the joint at rib intersections, which can be either pinned or fixed, does not affect the grid stiffness if the slenderness ratio is high. This is the case when the area fraction is small, but will not be the case for a grid that looks like a waffle plate.
When ply anisotropy in a composite is moderate, like that of E-glass/epoxy composite, the matrix-related components are no longer negligible. The quasi- isotropic laminate stiffness will obey the relations expressed in Equation 4. A comparison of laminate and grid stiffness for different materials is listed in Table 4.
38 USACERL TR 98/81
For comparison among different grid materials, the area fraction correction is the same. Its effect is included in Table 4; i.e., for a given fraction f, the global stiffness is this factor multiplied by the Young's modulus shown in the table. Relative efficiencies between the grid and laminate are shown. Highly anisotropic material like CFRP is most efficient; the isotropic material is the least efficient. Solid laminates are still more efficient than grids but using highly anisotropic ribs in grids provides performance within 13 percent of the laminates.
Composite Grid Reinforcement Design Approach
Analyses that have been performed in conjunction with FRP-reinforced concrete research indicate that flexural capacities in sections with the reinforcement in tension may be calculated using the same force equilibrium and strain compatibility relationships that are used in conventional reinforced concrete design. The significantly lower compressive strength and stiffness character- istics of FRP composites, relative to their tensile strength and stiffness, would dictate that the conventional procedures be modified to differentiate between tensile and compressive behavior. Analysis of shear and diagonal tension capacities of flexural sections is currently poorly defined. The higher degree of concrete cracking that accompanies the use of FRP composites will reduce section shear/diagonal tension capacity, but there has not been sufficient research performed to determine these relationships.
While the analytical approach to flexural analysis is similar in principle to current practice, actual design procedures are not well defined, due to significant differences in tensile stiffness and failure mechanism between steel and the FRP composites. The less stiff the composite (i.e., the lower its tensile modulus), the more severe the design discrepancy will be. ACI-440R (1996) provides an excellent overview of the current state of this dilemma. A summary is presented here, but the reader is referred to the original document for added detail.
To present this clearly, a brief summary of the conventional steel-reinforced concrete design approach is helpful. At any given instant in the loading history of a flexural member, the compressive forces (usually borne by the concrete) and the tensile forces (borne by the steel) are in equilibrium within the member cross-section. A "balanced" flexural section is one in which, at the instant the tensile steel yields, the outer fibers of the concrete that is in compression will crush. The ACI Building Code ensures that the steel will always yield before the concrete crushes by limiting the amount of tensile steel to 3/4 of the amount that results in the balanced condition. Since steel will yield to very large strains after
USACERLTR-98/81 39
it reaches its yield stress but before it reaches its ultimate stress, the structural member will behave in a ductile manner and absorb large amounts of energy before complete collapse. Figure 12 illustrates the differences in energy dissipation capacity and ductility. Analysis of section capacity is also straightforward at this condition; the conventional design equilibrium equations easily accommodate the use of the steel tensile yield strength and the concrete compression strength.
The FRP composites behave elastically up to their yield stress, but they have no postyield ductility in a conventional sense. Ductile behavior, in the traditional sense, is very difficult to attain in FRP composites. A condition where the FRP reinforcement is near the balanced condition may be analyzed in essentially the same manner as that now used in conventional design, with the understanding that failure will not be ductile. If the FRP reinforcement volume is significantly above that required for balanced conditions, concrete compression will occur before reinforcement yield. If the FRP reinforcement volume is significantly below that required for balanced conditions, failure will occur by rupture of the reinforcement. In both cases, failure will be brittle. ACI-440R (1996) mentions two possible approaches to addressing this problem from a design perspective.
The first is to apply more stringent capacity-reduction factors to the design equations than are used for conventional design. Conventional design with steel reinforcement applies a flexural capacity-reduction factor of 0.9. ACI-440R (1996) suggests the factor might be 0.85 for FRP reinforcement volumes below the balanced condition and 0.70 for FRP reinforcement volumes above the balanced condition. Because of the need to control deflections, there will likely be a tendency to use the higher FRP reinforcement volumes.
The second approach is to examine the use of a new definition in ACI 318-95, wherein a "tension-controlled section" is defined as one in which the net tensile strain at nominal strength is 0.005 or greater. Both of these approaches reduce the efficiency of the materials that are being used, especially the concrete. Research described in ACI-440R (1996) indicates that concrete of high compressive strength (fe of 69 MPa or 10 ksi) should be used to improve efficiency.
GEN LAM Modeling for Concrete-Filled Grids
The basic method developed to model reinforced concrete structures treats them as laminated panels. The computer code GENLAM (Tsai 1992), based on composite lamination theory, is used to stack layers of varying material
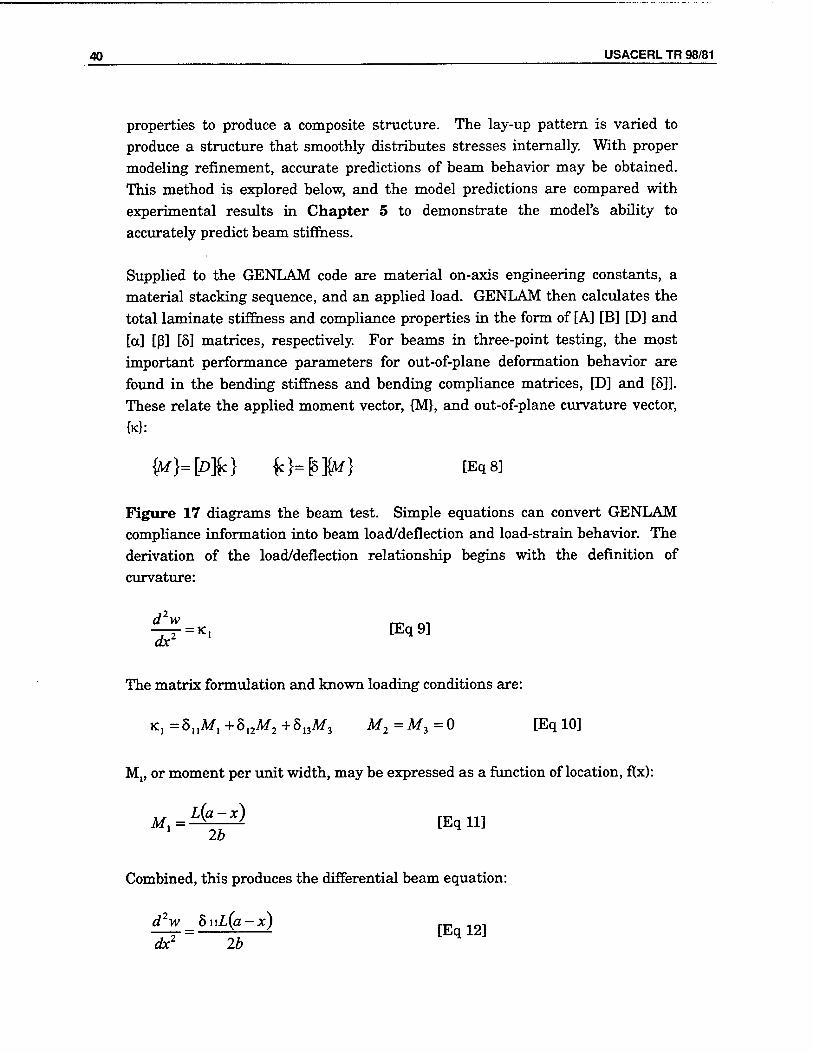
40 USACERL TR 98/81
properties to produce a composite structure. The lay-up pattern is varied to produce a structure that smoothly distributes stresses internally. With proper modeling refinement, accurate predictions of beam behavior may be obtained. This method is explored below, and the model predictions are compared with experimental results in Chapter 5 to demonstrate the model's ability to accurately predict beam stiffness.
Supplied to the GENLAM code are material on-axis engineering constants, a material stacking sequence, and an applied load. GENLAM then calculates the total laminate stiffness and compliance properties in the form of [A] [B] [D] and [a] [ß] [5] matrices, respectively. For beams in three-point testing, the most important performance parameters for out-of-plane deformation behavior are found in the bending stiffness and bending compliance matrices, [D] and [5]]. These relate the applied moment vector, {M}, and out-of-plane curvature vector, {K}:
Figure 17 diagrams the beam test. Simple equations can convert GENLAM compliance information into beam load/deflection and load-strain behavior. The derivation of the load/deflection relationship begins with the definition of curvature:
d2w re «, ax
The matrix formulation and known loading conditions are:
K, =8,1MI+812M2+813M3 M2=M3=0 [Eq 10]
M1( or moment per unit width, may be expressed as a function of location, fl(x):
M L{a-x) 1 2b
Combined, this produces the differential beam equation:
d2w _8uL(a-x)
dx2 2b [Eql2]

USACERLTR-98/81 41
Integrating and applying boundary conditions results in the following load/deflection relationship when evaluated at the beam end relative to the beam center:
^U=0 w(*)L=0 [Eql3] ax
w(a)=^L [Eql4] 60
Rearranging yields the following load/deflection relationship:
L 48o w(a) 8n/3 [Eql5]
A similar approach is taken to obtain the load-strain relationship. Given axial strain as a function of axial curvature:
s XX (Z)=ZK, [Eql6]
and substituting with Equations 9 and 12 yields:
e»L..... lb
With the strain gage mounted on the surface at
z=l- [Eql8]
the load-strain relationship is found to be
L %b
*xx thn(l-2x) [Eq 19]
In each of these equations, the following constants apply to all beams in this study:
b = 55.9mm I = 355.6mm x = 50.Smm [Eq20]
42 USACERL TR 98/81
5 Manufacturing the Composite Grids
The initial effort to manufacture composite grids at Stanford University was based on a traditional slotted joint manufacturing system that is most frequently used in carpentry (Figure 18a). An isogrid made with slotted wood ribs is shown in Figure 18b. The composite grids (Figure 18c) were manufactured using pultruded thin unidirectional sections as the rib material. The slots were machined with a generous tolerance over the rib thickness. This facilitated assembly of the grid. The process was intended for low-cost manufacturing of large and small flat panels. For an orthogrid the typical relations between the rib stiffness and that of the grid panel are shown in Figure 19. The disadvantages of this design include:
1. cost of machining slots 2. difficult assembly of many ribs having multiple slots 3. low rib strength introduced by machined slots and notches 4. low stiffness and strength from imperfect fit at slotted joints 5. limited to square or rectangular grid configuration.
Following the lessons learned from the slotted grid configurations it became clear that a more appropriate FRP grid manufacturing process must be dictated by three major considerations:
1. All ribs must be unidirectional. 2. Rib cross-section must be well defined and remain constant. 3. Nodes must be interlaced with continuous composite layers.
The volume fraction of fiber in the node will dictate the volume fraction of fibers in the rib. The upper limit of the fiber volume fractions in most available composite gratings is 60 percent at the nodes and 30 percent at the ribs. However, Koury and Dutta (1993) have explained a methodology of designing isogrid in which a higher fiber fraction in the rib could be incorporated. In their methodology they designed the isogrid with offset nodes as shown in Figure 20. It will be seen that one triple-layered node in this case has been spread over three double layered nodes. The proposed grid has two triangles of different sizes. The smaller triangle is the offset triple node. At Stanford University, Colwell (1996) has developed an innovative approach to accommodate larger volume fraction of fibers. In their design they have provided for wider nodes
USACERLTR-98/81 43
(Figure 21) that reduce the thickness of the interlacing layers. In the limit, the fiber volume fraction of the nodes will be the same as that of the ribs. For double-layered nodes, the width would be twice that of the rib; for triple-layered nodes, the width would be three times the rib. This method of filament placement, in conjunction with a vacuum-infiltration resin transfer process, offers an economical solution to the manufacturing problem and produces grids of superior structural performance.
The techniques of manufacturing interlaced joints were developed both at Stanford and at Brigham Young University (BYU), Provo, UT.
BYU Direct Crossover Interlaced Joints
In order to manufacture FRP grids for actual placement in concrete specimens for laboratory testing, two master orthogrids were cut from 5/8 in. thick steel plates using an abrasive water jet cutter. These grids were used as blanks to make a mold for fabricating composite grids (Smart 1996). One grid was plain, with straight sections, and the other had deformed surfaces with ribbed sections (see Figure 22).
The steel grids were then placed in a form made from wood and lined with plastic. The grids and form were released using a release agent. A silicone rubber compound was mixed and placed in the form. The silicone was allowed to cure overnight. The next day the mold was removed from the form and the steel was carefully removed from the silicone mold. The mold was then postcured in the oven at 250 °F overnight. Figure 23 shows a picture of the finished molds.
A winding platform was prepared using a % in. thick piece of plywood, some lumber 2 by 4s (nominal dimensions, inches), and some sharply pointed steel winding pins. The 2 by 4s were attached to the bottom side of the plywood to form a flat, stable surface. Nails were then driven through the plywood in line with the grid intersections. The nails served as winding pins in the fabrication process.
Lay-up Procedure
Before each grid fabrication, the silicone mold was cleaned and a releasing agent was applied. Once the mold was prepared, approximately 700-800 grams of vinyl ester resin was mixed with 1 percent by weight of methyl ethyl ketone peroxide (MEKP). This ratio was chosen to allow approximately 1 hour of working time before gelation of the resin. The resin mixture was then poured into a resin bath
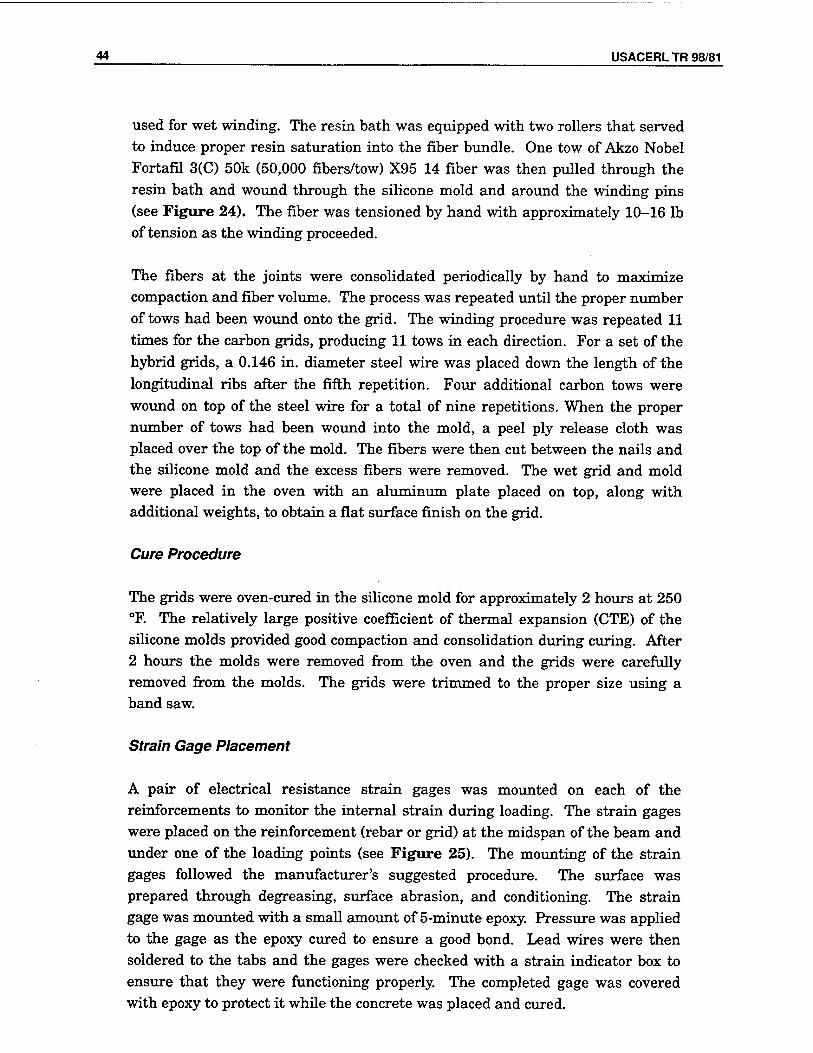
44 USACERL TR 98/81
used for wet winding. The resin bath was equipped with two rollers that served to induce proper resin saturation into the fiber bundle. One tow of Akzo Nobel Fortafil 3(C) 50k (50,000 fibers/tow) X95 14 fiber was then pulled through the resin bath and wound through the silicone mold and around the winding pins (see Figure 24). The fiber was tensioned by hand with approximately 10-16 lb of tension as the winding proceeded.
The fibers at the joints were consolidated periodically by hand to maximize compaction and fiber volume. The process was repeated until the proper number of tows had been wound onto the grid. The winding procedure was repeated 11 times for the carbon grids, producing 11 tows in each direction. For a set of the hybrid grids, a 0.146 in. diameter steel wire was placed down the length of the longitudinal ribs after the fifth repetition. Four additional carbon tows were wound on top of the steel wire for a total of nine repetitions. When the proper number of tows had been wound into the mold, a peel ply release cloth was placed over the top of the mold. The fibers were then cut between the nails and the silicone mold and the excess fibers were removed. The wet grid and mold were placed in the oven with an aluminum plate placed on top, along with additional weights, to obtain a flat surface finish on the grid.
Cure Procedure
The grids were oven-cured in the silicone mold for approximately 2 hours at 250 °F. The relatively large positive coefficient of thermal expansion (CTE) of the silicone molds provided good compaction and consolidation during curing. After 2 hours the molds were removed from the oven and the grids were carefully removed from the molds. The grids were trimmed to the proper size using a band saw.
Strain Gage Placement
A pair of electrical resistance strain gages was mounted on each of the reinforcements to monitor the internal strain during loading. The strain gages were placed on the reinforcement (rebar or grid) at the midspan of the beam and under one of the loading points (see Figure 25). The mounting of the strain gages followed the manufacturer's suggested procedure. The surface was prepared through degreasing, surface abrasion, and conditioning. The strain gage was mounted with a small amount of 5-minute epoxy. Pressure was applied to the gage as the epoxy cured to ensure a good bond. Lead wires were then soldered to the tabs and the gages were checked with a strain indicator box to ensure that they were functioning properly. The completed gage was covered with epoxy to protect it while the concrete was placed and cured.
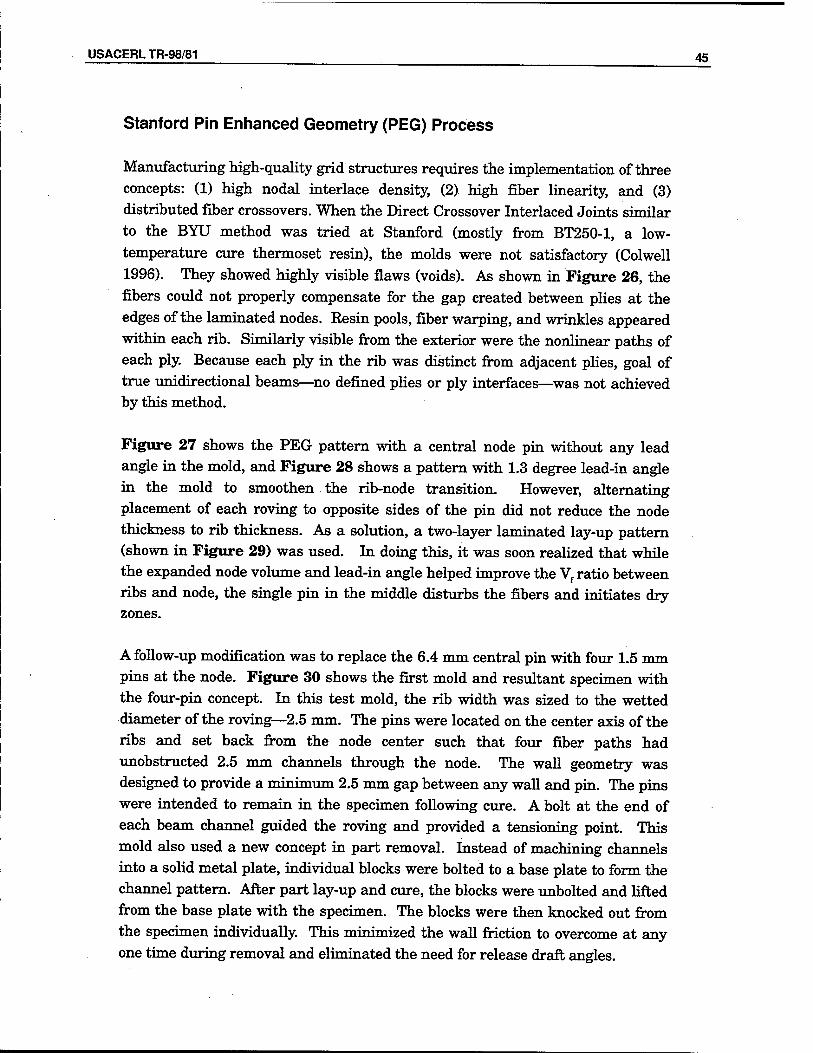
USACERLTR-98/81 . 45
Stanford Pin Enhanced Geometry (PEG) Process
Manufacturing high-quality grid structures requires the implementation of three concepts: (1) high nodal interlace density, (2) high fiber linearity, and (3) distributed fiber crossovers. When the Direct Crossover Interlaced Joints similar to the BYU method was tried at Stanford (mostly from BT250-1, a low- temperature cure thermoset resin), the molds were not satisfactory (Colwell 1996). They showed highly visible flaws (voids). As shown in Figure 26, the fibers could not properly compensate for the gap created between plies at the edges of the laminated nodes. Resin pools, fiber warping, and wrinkles appeared within each rib. Similarly visible from the exterior were the nonlinear paths of each ply. Because each ply in the rib was distinct from adjacent plies, goal of true unidirectional beams—no defined plies or ply interfaces—was not achieved by this method.
Figure 27 shows the PEG pattern with a central node pin without any lead angle in the mold, and Figure 28 shows a pattern with 1.3 degree lead-in angle in the mold to smoothen the rib-node transition. However, alternating placement of each roving to opposite sides of the pin did not reduce the node thickness to rib thickness. As a solution, a two-layer laminated lay-up pattern (shown in Figure 29) was used. In doing this, it was soon realized that while the expanded node volume and lead-in angle helped improve the Vf ratio between ribs and node, the single pin in the middle disturbs the fibers and initiates dry zones.
A follow-up modification was to replace the 6.4 mm central pin with four 1.5 mm pins at the node. Figure 30 shows the first mold and resultant specimen with the four-pin concept. In this test mold, the rib width was sized to the wetted diameter of the roving—2.5 mm. The pins were located on the center axis of the ribs and set back from the node center such that four fiber paths had unobstructed 2.5 mm channels through the node. The wall geometry was designed to provide a minimum 2.5 mm gap between any wall and pin. The pins were intended to remain in the specimen following cure. A bolt at the end of each beam channel guided the roving and provided a tensioning point. This mold also used a new concept in part removal. Instead of machining channels into a solid metal plate, individual blocks were bolted to a base plate to form the channel pattern. After part lay-up and cure, the blocks were unbolted and lifted from the base plate with the specimen. The blocks were then knocked out from the specimen individually. This minimized the wall friction to overcome at any one time during removal and eliminated the need for release draft angles.
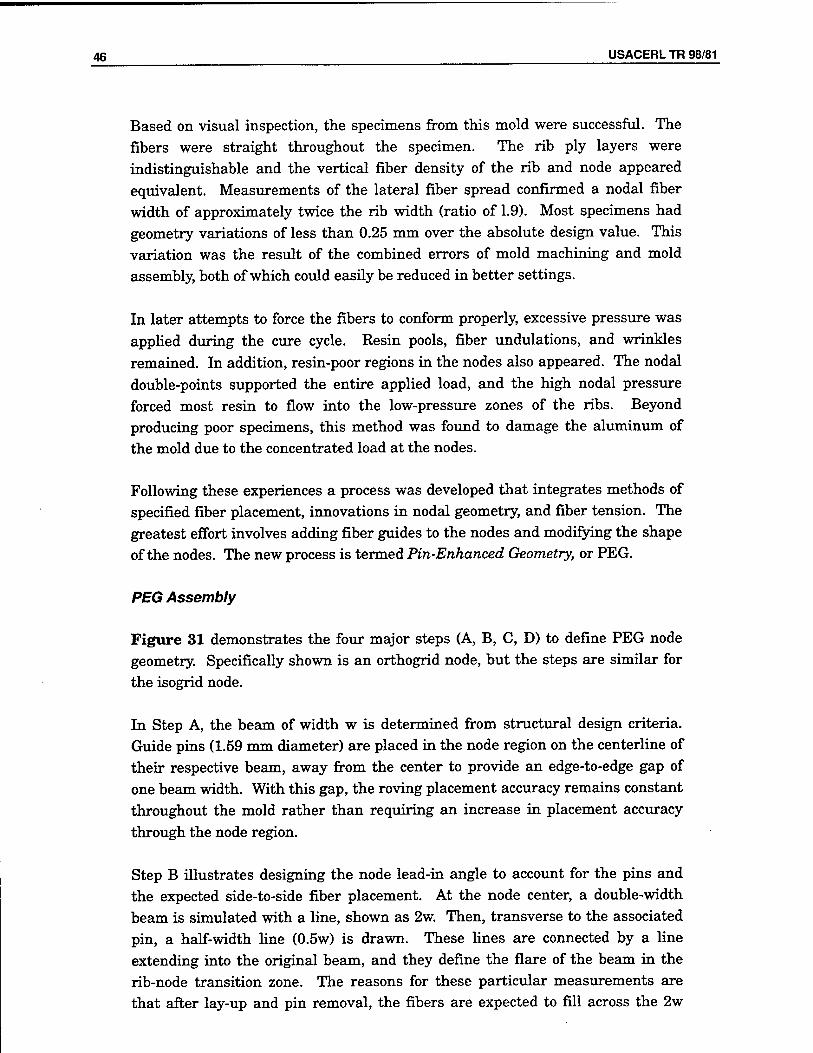
46 USACERL TR 98/81
Based on visual inspection, the specimens from this mold were successful. The fibers were straight throughout the specimen. The rib ply layers were indistinguishable and the vertical fiber density of the rib and node appeared equivalent. Measurements of the lateral fiber spread confirmed a nodal fiber width of approximately twice the rib width (ratio of 1.9). Most specimens had geometry variations of less than 0.25 mm over the absolute design value. This variation was the result of the combined errors of mold machining and mold assembly, both of which could easily be reduced in better settings.
In later attempts to force the fibers to conform properly, excessive pressure was applied during the cure cycle. Resin pools, fiber undulations, and wrinkles remained. In addition, resin-poor regions in the nodes also appeared. The nodal double-points supported the entire applied load, and the high nodal pressure forced most resin to flow into the low-pressure zones of the ribs. Beyond producing poor specimens, this method was found to damage the aluminum of the mold due to the concentrated load at the nodes.
Following these experiences a process was developed that integrates methods of specified fiber placement, innovations in nodal geometry, and fiber tension. The greatest effort involves adding fiber guides to the nodes and modifying the shape of the nodes. The new process is termed Pin-Enhanced Geometry, or PEG.
PEG Assembly
Figure 31 demonstrates the four major steps (A, B, C, D) to define PEG node geometry. Specifically shown is an orthogrid node, but the steps are similar for
the isogrid node.
In Step A, the beam of width w is determined from structural design criteria. Guide pins (1.59 mm diameter) are placed in the node region on the centerline of their respective beam, away from the center to provide an edge-to-edge gap of one beam width. With this gap, the roving placement accuracy remains constant throughout the mold rather than requiring an increase in placement accuracy through the node region.
Step B illustrates designing the node lead-in angle to account for the pins and the expected side-to-side fiber placement. At the node center, a double-width beam is simulated with a line, shown as 2w. Then, transverse to the associated pin, a half-width line (0.5w) is drawn. These lines are connected by a line extending into the original beam, and they define the flare of the beam in the rib-node transition zone. The reasons for these particular measurements are that after lay-up and pin removal, the fibers are expected to fill across the 2w
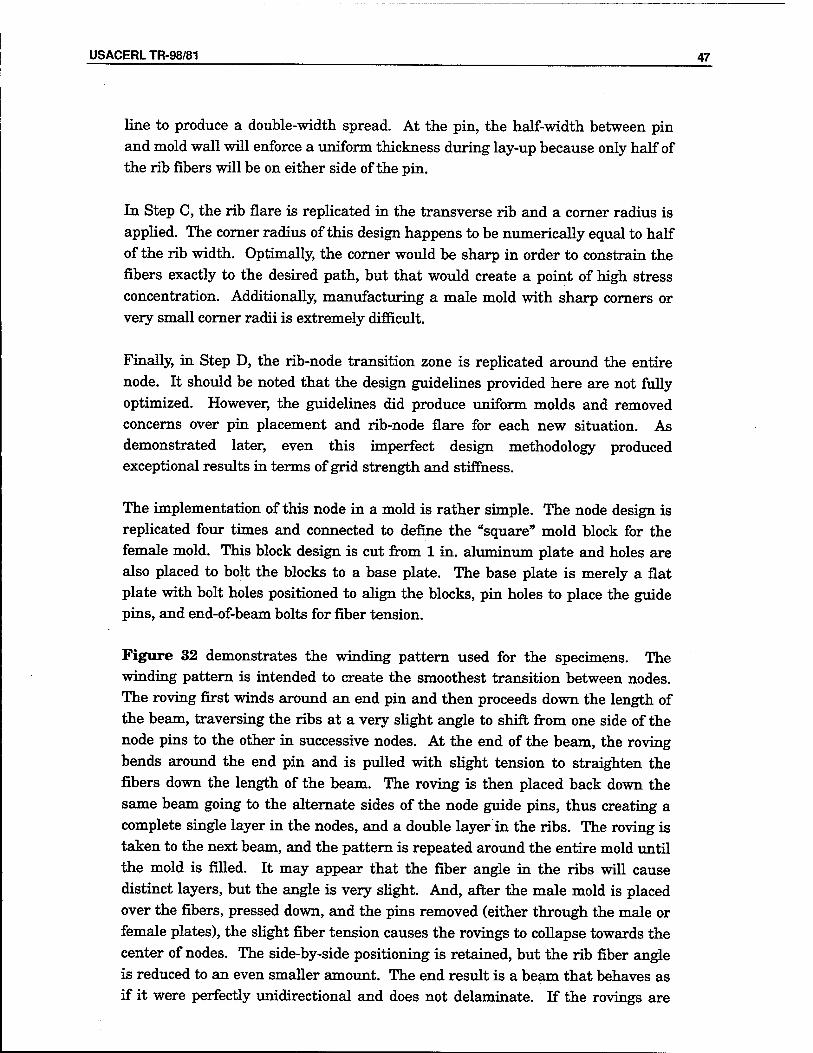
USACERLTR-98/81 47
line to produce a double-width spread. At the pin, the half-width between pin and mold wall will enforce a uniform thickness during lay-up because only half of the rib fibers will be on either side of the pin.
In Step C, the rib flare is replicated in the transverse rib and a corner radius is applied. The corner radius of this design happens to be numerically equal to half of the rib width. Optimally, the corner would be sharp in order to constrain the fibers exactly to the desired path, but that would create a point of high stress concentration. Additionally, manufacturing a male mold with sharp corners or very small corner radii is extremely difficult.
Finally, in Step D, the rib-node transition zone is replicated around the entire node. It should be noted that the design guidelines provided here are not fully optimized. However, the guidelines did produce uniform molds and removed concerns over pin placement and rib-node flare for each new situation. As demonstrated later, even this imperfect design methodology produced exceptional results in terms of grid strength and stiffness.
The implementation of this node in a mold is rather simple. The node design is replicated four times and connected to define the "square" mold block for the female mold. This block design is cut from 1 in. aluminum plate and holes are also placed to bolt the blocks to a base plate. The base plate is merely a flat plate with bolt holes positioned to align the blocks, pin holes to place the guide pins, and end-of-beam bolts for fiber tension.
Figure 32 demonstrates the winding pattern used for the specimens. The winding pattern is intended to create the smoothest transition between nodes. The roving first winds around an end pin and then proceeds down the length of the beam, traversing the ribs at a very slight angle to shift from one side of the node pins to the other in successive nodes. At the end of the beam, the roving bends around the end pin and is pulled with slight tension to straighten the fibers down the length of the beam. The roving is then placed back down the same beam going to the alternate sides of the node guide pins, thus creating a complete single layer in the nodes, and a double layer in the ribs. The roving is taken to the next beam, and the pattern is repeated around the entire mold until the mold is filled. It may appear that the fiber angle in the ribs will cause distinct layers, but the angle is very slight. And, after the male mold is placed over the fibers, pressed down, and the pins removed (either through the male or female plates), the slight fiber tension causes the rovings to collapse towards the center of nodes. The side-by-side positioning is retained, but the rib fiber angle is reduced to an even smaller amount. The end result is a beam that behaves as if it were perfectly unidirectional and does not delaminate. If the rovings are
48 USACERL TR 98/81
combined into large bundles, the resin layer will be too thick and there will be distinct layers that will delaminate.
Basically, the PEG concept of manufacturing achieved the following:
• rigid male and female tooling to promote dimensional control • hard and smooth surfaces to promote parts release • high-density interlace to promote high fiber density in the ribs • a method of parts removal which allows large scale structures • fiber pretension to promote linearity • node pins to guide the fibers • lay-up patterns to promote node thickness reduction • new node geometry to promote smooth rib-node transitions • wet lay-up with room condition cure to eliminate extraneous material waste.
Manufacture of Large Orthogrid (n/2) Structures
PEG processing demonstrated the ability to manufacture grids with high material properties utilizing a combination of proper node geometry, fiber manipulation, and fiber tension. However, the question remained as to whether this method could be generalized to larger structures.
A 50-cm x 50-cm square orthogrid panel structure was fabricated to discover large-scale problems. As in the test mold, 1.5 mm pins were used to spread the fibers. Also, because the rib width was 2.5 times the fiber roving width, each layer required bundle placement of three rovings. The difficulty with this mold involved the manual labor effort for setup, lay-up, and parts removal. The steps are repetitive and simple, but time-consuming when done by hand. Automation would greatly simplify the process. Assuming that basic automation could be applied to this process, this mold and grid demonstrated that this PEG process is feasible on a large scale.
Manufacture of Large Isogrid (n/3) Structures
The final application of the PEG method was an attempt to produce a high- quality isogrid specimen. With traditional direct crossovers, this triple crossing is impossible to manufacture with even a semblance of quality. As noted previously (Kouri and Dutta 1993), the USAF Phillips labs developed a method to convert this triple point into three double points by offsetting one rib in each node, but still failed to resolve the double-point problem. The Phillips method involves soft silicon tooling and is limited to very thin rib widths. The Phillips isogrid would be useful for stiffening structures against out-of-plane loads, but
USACERLTR-98/81 49
not for resisting in-plane loads. More desirable would be a structurally independent isogrid.
To that end, the PEG process was generalized to this triple crossing. A pin is placed in each rib-node transition, making for a 6 pin node. Also utilized, are lead-in angles, end bolts for tension, and postlay-up pin removal. The tool and specimen shown in Figure 33 are the results of this design. The produced isogrids had a node/rib fiber width ratio of 2:1, as expected from splitting each beam into two side-by-side bundles. The ideal solution for isogrids calls for splitting each beam into three bundles. So, some points of excessive fiber density are expected, and inspection of the specimen confirmed this. Because the ideal node fiber manipulation did not occur, small resin pools accumulated in the rib- node transition zone.
Stanford Tooling-Reinforced Interlaced Grid (TRIG) Process
The PEG process was derived from studying grid micro-mechanics with the intent to improve the nodes and ribs. The process produces high quality grids, but the liabilities include: high effort, high cost, high investment in automated tooling, and a limitation in design to flat panels. The Tooling-Reinforced Interlaced Grid (TRIG) process is derived from studying ways to improve grids at the structural level with the intent of addressing the needs for extensive configuration capabilities and low-tech processing. These are accomplished by inverting the conventional concepts surrounding production tooling. Traditionally, the tooling has belonged to the manufacturer. TRIG changes this to incorporate the tooling as an integral part of the finished structure, thus removing any design limitations incurred by a desire to separate the part from the tool. The term tooling in association with the TRIG process denotes the tube segment blocks used to construct the TRIG mold.
TRIG Manufacturing Methodology
The TRIG manufacturing process for the flat panel orthogrid shown in Figure 34 involved several laboratory steps.
Step 1 generates the mold blocks, similar to those used for the PEG molds. For the TRIG process, these are typically filament-wound composite tube segments with outer cross-sectional geometry becoming the grid channel geometry.
Step 2 constructs the mold by fixing the tooling blocks to a wooden base plate with lines to guide the tooling block placement. The base plate is covered with a
50 USACERL TR 98/81
clear vacuum bag film to allow easy separation of the part from the base. Finally, the blocks are aligned to the guidelines and glued to the release film. For fiber guidance and tension, nails are positioned at the ends of each channel. Figure 35 demonstrates the mold at this stage.
In Step 3, the wetted fiber rovings are wound into the channels between tooling blocks. Each layer is thin, using only the minimum number of rovings necessary to place a single wall-to-wall layer of fiber in the channels. This generates a highly interlaced grid, as discussed before.
The mold is set aside so the resin can cure. Once cured, the grid is lifted from the base plate and trimmed to size. In contrast to typical composites processing, the only disposables from this process are the release film, the trimmed material, and perhaps the wooden base plate.
Advantages of the TRIG Method
TRIG simplifies various steps in the manufacturing process. A simplified manufacturing cycle using conventional mold technology is shown in Figure 36. In mold preparation, the tool is assembled and prepared with a release agent. In lay-up and cure, the fiber rovings are draped into the mold as rapidly as possible with minimal interlace density, and the mold is set aside to let the resin cure. During parts removal, pins in the mold base are used to press the grid out of the mold, and the mold is submitted for cleaning. Depending on a number of factors, residual resin may bond to the mold corners and pin holes. It must be removed without damaging the mold, a cleaning effort that is often difficult.
The TRIG process improves this cycle by increasing interlace density and output quantity, and eliminating mold cleanup. Figure 37 demonstrates the TRIG cycle. The grid quality is improved by placing many thin layers to produce a high interlace density. The extra time required to accomplish this may be regained both by improved efficiency in the use of factory resources and by the elimination of mold cleanup. A better utilization of factory resources is achieved by eliminating the waiting time for the mold tools to become available. Availability is dictated by the number of molds in the factory and by the period for resin cure. For conventional manufacturing, each solid metal mold can be an very expensive investment, and during cure it is unavailable for new production. In TRIG processing, a new panel is made on demand rather than waiting for the processing cycle to return a mold to the lay-up step. Additionally, because the tooling blocks are made on demand by pultrusion, extrusion, or winding, each panel may have unique tube dimensions that are tailored to the customer's need.
USACERLTR-98/81 51
This combination of improvements makes TRIG an attractive means for commercial processing of grid structures.
Disadvantages of the TRIG Process
The TRIG process has many beneficial characteristics as discussed above, but some of the benefits involve hidden costs. Typically, TRIG mold setup time and setup tool requirements are increased over conventional methods; TRIG involves direct crossover in the nodes; the open inspectability of molded grids is lost; and the integrated tooling increases grid weight.
Integration of PEG Techniques into the TRIG System
The PEG study demonstrated that structural improvements might be achieved through the use of tension, nodal geometry, nodal pins, and a male mold. Without using these methods, the grids exhibit problems associated with nodal buildup, low rib Vp and warped fibers (typical of commercial grids). The TRIG process can easily incorporate two of the four PEG techniques: node geometry and fiber tension. Tubes with a specifically designed nodal lead-in angle can be produced as easily as tubes without this angle. Also easily implemented is the placement of nails for tension at the ends of each beam. However, implementation of pin-guided fiber spread and male molds would appear to add significant complexity to TRIG.
Load Testing of TRIG Grids
Load tests were conducted to evaluate the TRIG-processed grid characteristics and performance. The geometries and tooling types represented only the orthogrid type of TRIG grids. Other configurations may have different characteristics. However, these results demonstrate what can be achieved using nonoptimal tooling made from GFRP tubing with thick walls and pultruded fiber alignment.
The results were compared with two orthogrid panels that were commercially available. The TRIG panels were each fabricated by different people with very different skills and degrees of experience. It was found that the TRIG method is simple and robust enough that both panels exhibited similar behavior (within 15 percent). These result were obtained even though the panel was manufactured by someone with minimal experience and supervision, and with minimal process control of fiber quantity, resin mixture, and fiber tension.
52 USACERL TR 98/81
Figure 38 shows the panels that were compared. At left is a commercial grid; in the center is a commercial grid with tube segments bonded into the cells to approximate the TRIG reinforcement; and at right is a full TRIG panel. For all three, the unidirectional core cross-section of the rib is 0.51 cm wide and 1.4 cm deep. Total grid geometry is based on a 7x7-cell configuration with a spacing of 5.08 cm between node centers. This made the grid outer dimensions approximately 40.6 cm square.
All three grid panels used E-glass fibers in the core. The resins were different, with the commercial grids using a polyester resin while the TRIG panel used an epoxy resin. Therefore, fiber-dominated tensile and bending tests would provide the most meaningful comparison. All reinforcement tube segments were cut from the same pultruded GFRP tube (6.44 mm wall thickness). The reinforced commercial grid had the reinforcement bonded to the grid with a high-strength epoxy, while bonding in the TRIG panel occurred due to the core epoxy resin. During full panel testing, no epoxy bonds appeared damaged, eliminating concern that the structural load/deflection behavior might be controlled by the reinforcement bond strength rather than by the grid and reinforcement interaction.
Material Properties
It was expected that the TRIG beams would have greater stiffness characteristics than beams from the commercial grid, but significantly less than the PEG beams. As the chart in Figure 39 demonstrates, this is true. The TRIG modulus in this chart is from the unidirectional fiber core only; the reinforcement tooling was cut away before the test. Even though all of the TRIG panels tested have direct crossover nodes, the TRIG axial modulus is 65 percent greater than the direct crossover commercial grid. This may be attributed to the increase in fiber linearity and quantity provided by fiber tension. In manu- facturing the TRIG panels, the nails at the ends of each beam channel were set at steep angles, with the nail heads pointing away from the grid. By pulling the rovings tight around these nails, the rovings slide down the nail toward the mold and base plate in order to release the tensile stress. This downward motion at the nail carries the entire roving slightly deeper into the mold, compacting the fibers slightly and increasing the fiber density.
Panel Properties
Two main structural comparisons are made using the panels in Figure 38. First, the basic commercial grid panel (A) is compared to the reinforced commercial grid panel (B) to isolate the effect of reinforcement on out-of-plane
USACERLTR-98/81 53
load/deflection behavior, and to compare weight-normalized behavior. The second comparison is between the reinforced commercial grid panel (B) to the TRIG panel (C) to determine the effect of interlace density and fiber tensioning. Panel bending tests and panel twisting tests were performed on these grids as described below.
Panel Bending Test. Panel bending is the most basic out-of-plane panel test and resembles a 3-point beam bending test, see Figure 40. It is a side- to-side test with supports at the outer edges on opposing sides, and at a midpanel loading point. On a 7x7 panel (i.e., 7 cells by 7 cells), the supports are only under the one central rib, and adjacent nodes, on each side. Mostly, this test challenges the axial stiffness of the two central beams. However, it is a slightly more complex test than the pure beam-bending tests. Without loading and supporting across the entire panel width, the panel is free to deform in an anticlastic manner that slightly challenges the grid shear modulus. This behavior helped verify the accuracy of two grid modeling programs developed concurrently with this manufacturing program.
Panel Twisting Test. Panel twist (shear) testing is a complex out-of-plane panel test very similar to four-corner tests. This is a corner-to-corner test that mainly tests the grid shear stiffness. Two opposing corners are supported across the corner cell and the two associated nodes. Likewise, the load is applied across the midpanel cell and associated nodes, as seen in Figure 41. With no linear path between the load bar and supports, the load path must turn at each node. The deformed panel displays a saddle shape compound curvature, as would be expected in four-corner loading. Two opposing corners displace above the panel midpoint and the other two displace equidistant below it. The out-of-plane displacement magnitude of the corners is highly influenced by the panel shear stiffness.
The following four plots illustrate the behavior of the panels in three-point bending and three-point twisting. Figure 42 shows the results from the bending test, and Figure 43 shows results from the twisting test. The left-side plot in each figure is the actual average slope for each specimen type. Normalizing each slope by the weight of the grid produces the graph on the right. These normalized values allow a more equitable comparison between the TRIG and commercial panels.
The first comparison is between the commercial and reinforced commercial grid panels. Since both panels have exactly the same unidirectional core, all differences are due to the reinforcement. The reinforced commercial grid load/deflection slope is 228 percent greater in the bending test, and 487 percent
54 USACERL TR 98/81
greater in the twisting test. The difference between these numbers is due to the on-axis versus off-axis behavior of the grids. Load paths not aligned with a beam direction require load transfer between orthogonal beams and challenge the grid shear strength. Since the commercial grids are very weak in shear, the reinforcement is able to make a much larger impact in the panel twisting stiffness than on the panel bending stiffness that is mostly dependent on the unidirectional fiber stiffness.
The graphs also show that stiffness increases with improved interlace density and fiber pretension. The contribution from these process steps can be seen when comparing the load/deflection slopes from the reinforced commercial grid panel and the TRIG grid panel. These two grids have the same type and amount of reinforcement and the same core geometry. Their main difference is in the core fiber lay-up, as discussed previously. The TRIG panel slope is 49 percent greater in the bend test, and 35 percent greater in the twist test. It is expected that the bending test slope is the one most affected because this test is highly dependent on the unidirectional core properties whereas the twisting test depends more on the shear strength.
Of the three panel types, the TRIG panels have the greatest stiffness and also the greatest weight. It is reasonable to question the load/deflection benefits relative to weight. Displayed on the right side of Figures 42 and 43 are the weight-normalized stiffness behaviors. The normalization weights are as follows: basic commercial grid = 0.9 kg; reinforced commercial grid = 2.6 kg; and TRIG = 2.8 kg. Comparing the basic and reinforced commercial grid normalized responses, reinforcement does not benefit bending behavior, but adds 93 percent to the normalized twisting behavior. Similarly, between the reinforced commercial grid panel and TRIG panel, TRIG panels are significantly more stiff in both bending (37 percent) and twisting (24 percent). This means that the weight-based comparison is positive for TRIG, even when using the highly non- optimal tooling of this study. But, even with suboptimal tooling, these results indicate that as long as the total allowed structural weight is not exceeded, the TRIG panel has the greatest specific stiffness and is ideal for use in applications need low costs combined with good performance per weight.
Concept Development for Full-Scale TRIG Grid Production
The laboratory-scale TRIG method of grid production was successful but it was necessary to translate this development to a commercial scale production process in which the cost of production must be minimized by reducing the production steps. To address this problem Dutta and Bailey (1996) conceived the novel idea
USACERLTR-98/81 ^ 55
of producing the TRIG grid panels as in Stanford from TRIG blocks. A TRIG block is a TRIG grid several feet that is later sliced by industrial slicing machine to produce the grid panels.
The block tooling conceived for this process is shown in Figure 44. It consists of rows of FRP tubings of outside dimensions compatible with the rib widths and lengths as discussed in the TRIG process. The major difference from the TRIG process is that while the TRIG process allowed the tooling (tubing) height to be limited to the grid height, this process will allow a grid to be made several feet high. Thus, instead of a flat grid panel the product will be a grid block, as shown in Figure 45. Figure 46 shows a pictorial view of four slices made from one block. This approach would accelerate the grid manufacturing process and would be expected to bring the cost down. In order to practically demonstrate the process a trial block tooling was manufactured at USACRREL using polyvinyl chloride (PVC) square tubing mounted on a wooden block. However, further effort toward developing the tooling was suspended as the project direction was changed from developing a demonstration model for flat grid panels to a demonstration of beams and columns.
56 USACERL TR 98/81
6 Grid-Reinforced Concrete (GRC)
Panels
This chapter discusses the testing of the previously described composite grids as reinforcement in concrete structures.
The conventional method of reinforcing concrete is to place the tensioning element (rebar or grid) on the tension side of the beam or panel. But under many loading conditions panels may require reinforcement on both sides. Thus parallel investigations were conducted for both configurations. At BYU, the composite grid reinforcement in concrete was tested as concrete beams and panels with one set of grids as reinforcement. At Stanford University tests were performed with flat panels of concrete reinforced with single grid and bi-grid systems. The results of these efforts are discussed in sequence.
GRC Testing at BYU
Testing at BYU involved the use of FRP grids as primary reinforcement in concrete beams as structures. Results of 26 beams tested in flexure under a four-point loading system will be discussed to analyze the behavior of the FRP grid reinforcement. The grids were of varying strength and stiffness. Control beams were reinforced with steel to allow for comparison with grid reinforced
beams.
Due to the significant geometric and material differences between grid reinforcement and traditional steel rebar reinforcement, issues such as load transfer, stiffness, and toughness were investigated. The test matrix was developed to enable identification of the effects of multiple variables. Grids were made from carbon and glass fiber composites and steel. The transfer of load between the concrete and the reinforcement was investigated by varying the geometry of the grids. Commercially available grids were not adequate to investigate all of these parameters; therefore, the manufacturing of grids became an important consideration. The techniques developed to manufacture composite orthogrids were described in Chapter 5.
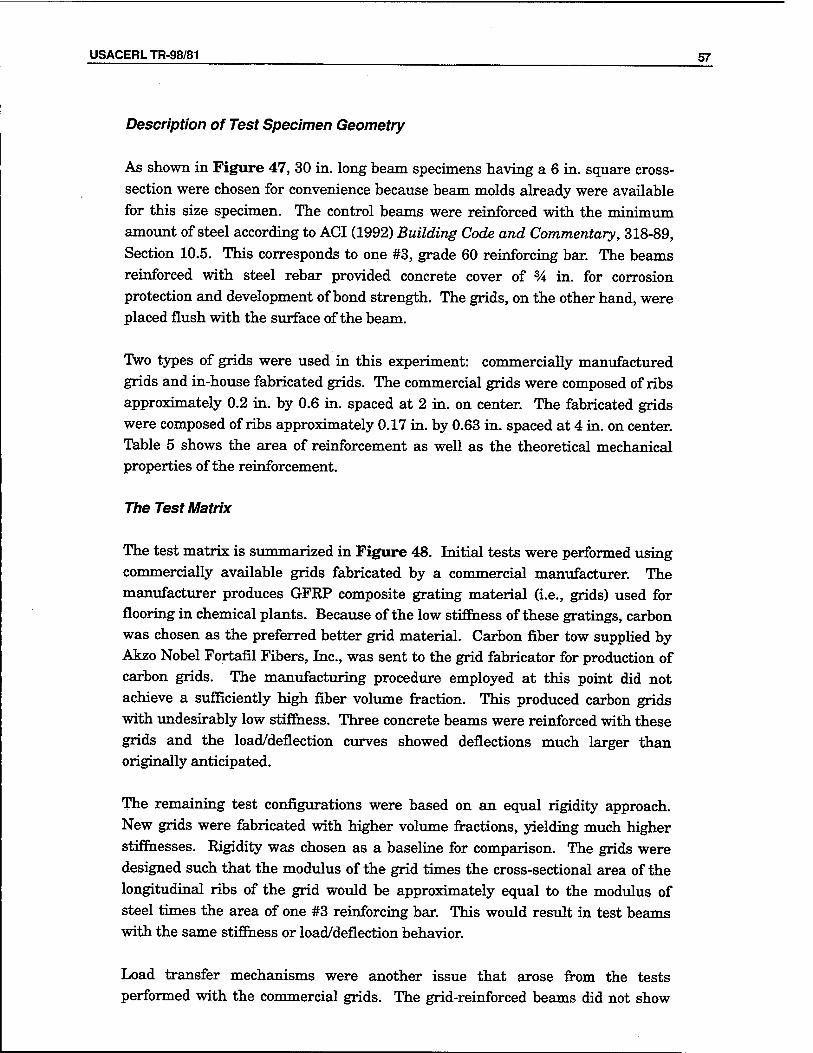
USACERLTR-98/81 57
Description of Test Specimen Geometry
As shown in Figure 47, 30 in. long beam specimens having a 6 in. square cross- section were chosen for convenience because beam molds already were available for this size specimen. The control beams were reinforced with the mini'miim amount of steel according to ACI (1992) Building Code and Commentary, 318-89, Section 10.5. This corresponds to one #3, grade 60 reinforcing bar. The beams reinforced with steel rebar provided concrete cover of % in. for corrosion protection and development of bond strength. The grids, on the other hand, were placed flush with the surface of the beam.
Two types of grids were used in this experiment: commercially manufactured grids and in-house fabricated grids. The commercial grids were composed of ribs approximately 0.2 in. by 0.6 in. spaced at 2 in. on center. The fabricated grids were composed of ribs approximately 0.17 in. by 0.63 in. spaced at 4 in. on center. Table 5 shows the area of reinforcement as well as the theoretical mechanical properties of the reinforcement.
The Test Matrix
The test matrix is summarized in Figure 48. Initial tests were performed using commercially available grids fabricated by a commercial manufacturer. The manufacturer produces GFRP composite grating material (i.e., grids) used for flooring in chemical plants. Because of the low stiffness of these gratings, carbon was chosen as the preferred better grid material. Carbon fiber tow supplied by Akzo Nobel Fortafil Fibers, Inc., was sent to the grid fabricator for production of carbon grids. The manufacturing procedure employed at this point did not achieve a sufficiently high fiber volume fraction. This produced carbon grids with undesirably low stiffness. Three concrete beams were reinforced with these grids and the load/deflection curves showed deflections much larger than originally anticipated.
The remaining test configurations were based on an equal rigidity approach. New grids were fabricated with higher volume fractions, yielding much higher stiffnesses. Rigidity was chosen as a baseline for comparison. The grids were designed such that the modulus of the grid times the cross-sectional area of the longitudinal ribs of the grid would be approximately equal to the modulus of steel times the area of one #3 reinforcing bar. This would result in test beams with the same stiffness or load/deflection behavior.
Load transfer mechanisms were another issue that arose from the tests performed with the commercial grids. The grid-reinforced beams did not show
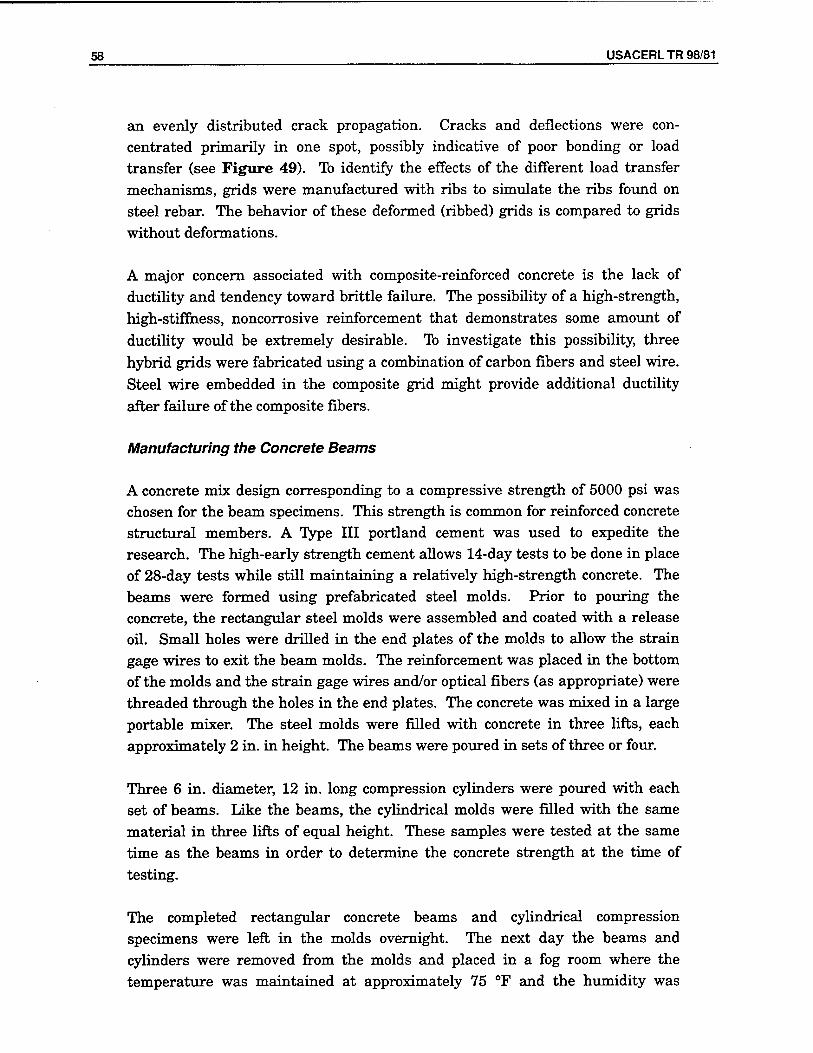
58 USACERL TR 98/81
an evenly distributed crack propagation. Cracks and deflections were con- centrated primarily in one spot, possibly indicative of poor bonding or load transfer (see Figure 49). To identify the effects of the different load transfer mechanisms, grids were manufactured with ribs to simulate the ribs found on steel rebar. The behavior of these deformed (ribbed) grids is compared to grids without deformations.
A major concern associated with composite-reinforced concrete is the lack of ductility and tendency toward brittle failure. The possibility of a high-strength, high-stiffness, noncorrosive reinforcement that demonstrates some amount of ductility would be extremely desirable. To investigate this possibility, three hybrid grids were fabricated using a combination of carbon fibers and steel wire. Steel wire embedded in the composite grid might provide additional ductility after failure of the composite fibers.
Manufacturing the Concrete Beams
A concrete mix design corresponding to a compressive strength of 5000 psi was chosen for the beam specimens. This strength is common for reinforced concrete structural members. A Type III portland cement was used to expedite the research. The high-early strength cement allows 14-day tests to be done in place of 28-day tests while still maintaining a relatively high-strength concrete. The beams were formed using prefabricated steel molds. Prior to pouring the concrete, the rectangular steel molds were assembled and coated with a release oil. Small holes were drilled in the end plates of the molds to allow the strain gage wires to exit the beam molds. The reinforcement was placed in the bottom of the molds and the strain gage wires and/or optical fibers (as appropriate) were threaded through the holes in the end plates. The concrete was mixed in a large portable mixer. The steel molds were filled with concrete in three lifts, each approximately 2 in. in height. The beams were poured in sets of three or four.
Three 6 in. diameter, 12 in. long compression cylinders were poured with each set of beams. Like the beams, the cylindrical molds were filled with the same material in three lifts of equal height. These samples were tested at the same time as the beams in order to determine the concrete strength at the time of testing.
The completed rectangular concrete beams and cylindrical compression specimens were left in the molds overnight. The next day the beams and cylinders were removed from the molds and placed in a fog room where the temperature was maintained at approximately 75 °F and the humidity was
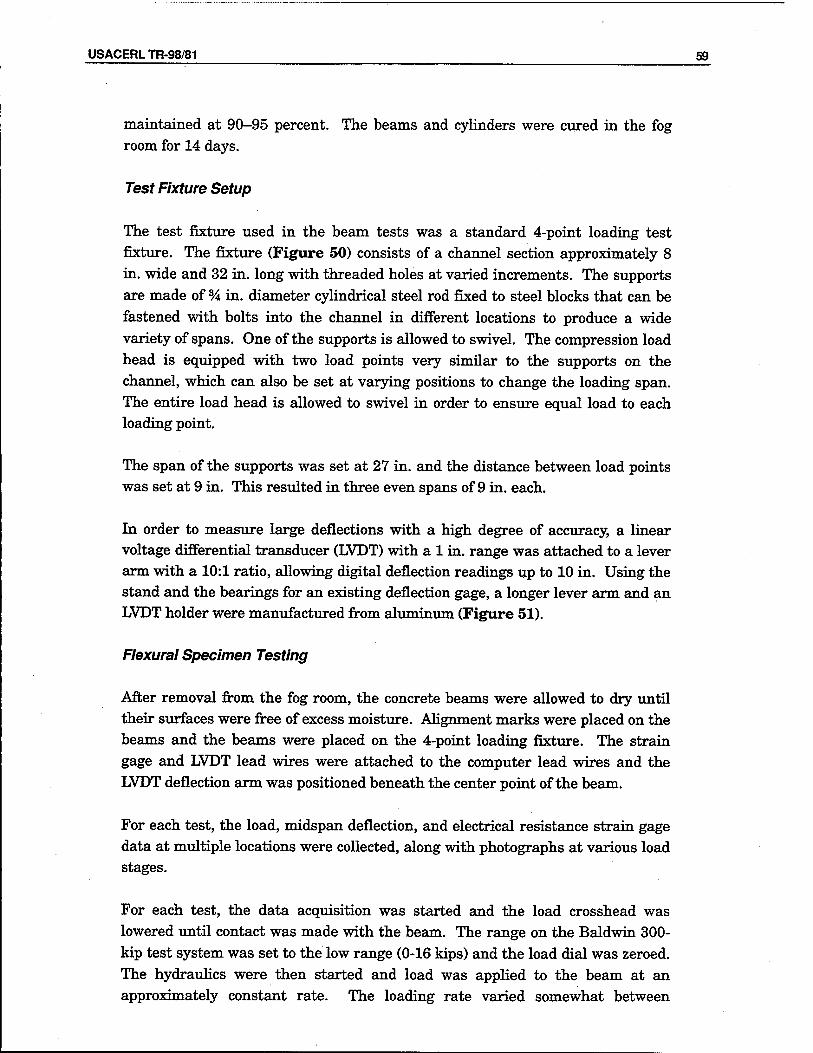
USACERLTR-98/81 59
maintained at 90-95 percent. The beams and cylinders were cured in the fog room for 14 days.
Test Fixture Setup
The test fixture used in the beam tests was a standard 4-point loading test fixture. The fixture (Figure 50) consists of a channel section approximately 8 in. wide and 32 in. long with threaded holes at varied increments. The supports are made of % in. diameter cylindrical steel rod fixed to steel blocks that can be fastened with bolts into the channel in different locations to produce a wide variety of spans. One of the supports is allowed to swivel. The compression load head is equipped with two load points very similar to the supports on the channel, which can also be set at varying positions to change the loading span. The entire load head is allowed to swivel in order to ensure equal load to each loading point.
The span of the supports was set at 27 in. and the distance between load points was set at 9 in. This resulted in three even spans of 9 in. each.
In order to measure large deflections with a high degree of accuracy, a linear voltage differential transducer (LVDT) with a 1 in. range was attached to a lever arm with a 10:1 ratio, allowing digital deflection readings up to 10 in. Using the stand and the bearings for an existing deflection gage, a longer lever arm and an LVDT holder were manufactured from aluminum (Figure 51).
Flexural Specimen Testing
After removal from the fog room, the concrete beams were allowed to dry until their surfaces were free of excess moisture. Alignment marks were placed on the beams and the beams were placed on the 4-point loading fixture. The strain gage and LVDT lead wires were attached to the computer lead wires and the LVDT deflection arm was positioned beneath the center point of the beam.
For each test, the load, midspan deflection, and electrical resistance strain gage data at multiple locations were collected, along with photographs at various load stages.
For each test, the data acquisition was started and the load crosshead was lowered until contact was made with the beam. The range on the Baldwin 300- kip test system was set to the low range (0-16 kips) and the load dial was zeroed. The hydraulics were then started and load was applied to the beam at an approximately constant rate. The loading rate varied somewhat between
60 USACERL TR 98/81
specimens (between 20 and 50 lb per second) and was only approximately constant due to limitations of the manual controls on the Baldwin 300-kip test system. In each case, the load was increased until a significant drop in load indicated failure.
As the testing began the load increased steadily until initial cracking of the beam occurred. This often happened when the load reached approximately 5.0 to 5.5 kips. A slight drop in load indicated that initial cracking had occurred. The load continued to climb steadily as the flexural cracks continued to elongate and widen. The next drops in load corresponded to the formation of shear cracks. These cracks propagated from the beam supports and extended toward the load points. These cracks eventually led to failure. As the ultimate load was reached, a large shear crack formed and a loud noise was emitted simultaneously with a dramatic drop in load, indicating failure.
Test Results
The data stored automatically by the AutoNet operating system was exported to the DOS-accessible drive as a Lotus 1-2-3 file and then read into Microsoft Excel spreadsheets. All of the data reduction was performed using Excel spreadsheets and the Microsoft Excel Visual Basic macro language.
Initial data reduction involved removing unnecessary data points that were logged during the space of time between the initiation of data acquisition and the actual commencement of loading. The excess data at the end of the file were also removed. The calibration of the LVDT deflection arm did not allow for re-zeroing with every test. Zeroing the deflection data with respect to the initial readings compensated for slight variations in the deflection starting point. Load/deflection graphs were generated in order to compare the behavior of the different beam types.
The load/deflection curves were analyzed to determine the effective stiffness (both pre and postcracking) and the toughness for each beam. Stiffness relates to the amount of deflection caused by a unit load, or the slope of the load/deflection curve. The effective stiffness was found by determining the best-fit linear approximation of the pre and postcracking portions of the load/deflection curve. The Excel graphing functions were used to accomplish this. Figure 52 shows the portions of a typical graph used to calculate the effective stiffness.
The toughness was calculated by finding the total area under the load/deflection curve using a program written in the Excel Visual Basic language. The program
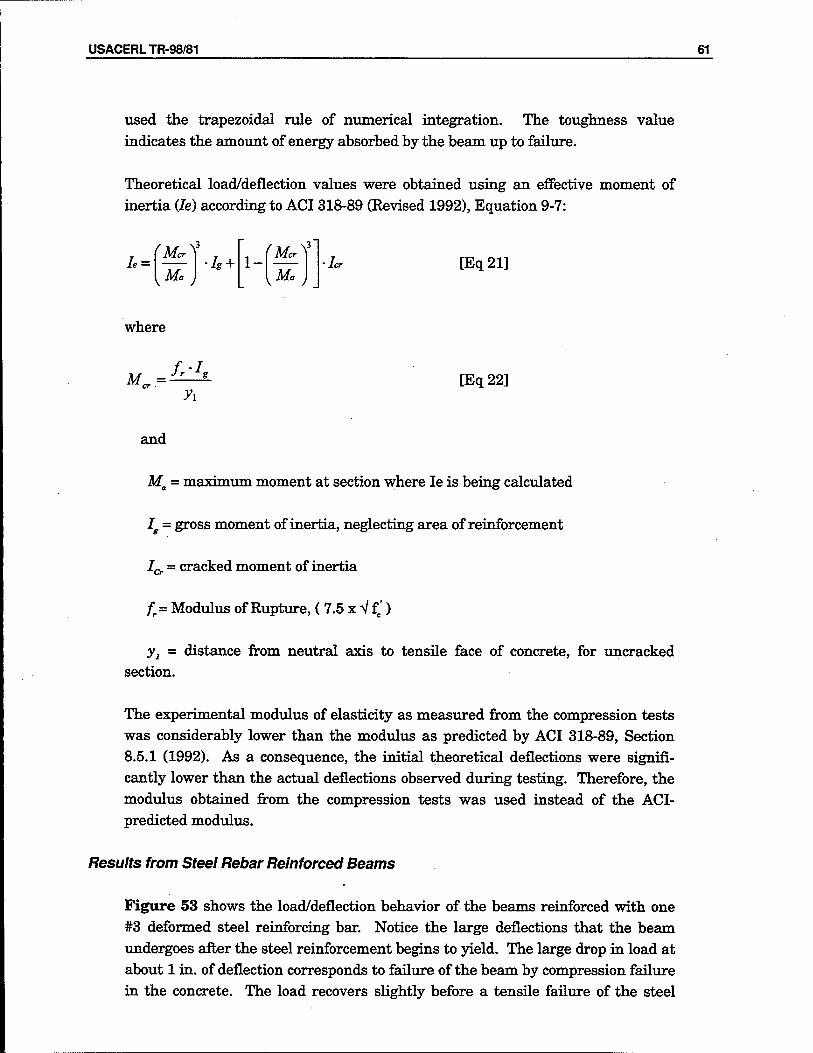
USACERLTR-98/81 61
used the trapezoidal rule of numerical integration. The toughness value indicates the amount of energy absorbed by the beam up to failure.
Theoretical load/deflection values were obtained using an effective moment of inertia (Je) according to ACI 318-89 (Revised 1992), Equation 9-7:
L = rMcr
Ma •/* + 1-
(Mcri Ma
[Eq21]
where
M = cr ■ [Eq 22]
and
Ma = maximum moment at section where Ie is being calculated
Ig = gross moment of inertia, neglecting area of reinforcement
ICr = cracked moment of inertia
fr- Modulus of Rupture, ( 7.5 x V fc')
yt = distance from neutral axis to tensile face of concrete, for uncracked section.
The experimental modulus of elasticity as measured from the compression tests was considerably lower than the modulus as predicted by ACI 318-89, Section 8.5.1 (1992). As a consequence, the initial theoretical deflections were signifi- cantly lower than the actual deflections observed during testing. Therefore, the modulus obtained from the compression tests was used instead of the ACI- predicted modulus.
Results from Steel Rebar Reinforced Beams
Figure 53 shows the load/deflection behavior of the beams reinforced with one #3 deformed steel reinforcing bar. Notice the large deflections that the beam undergoes after the steel reinforcement begins to yield. The large drop in load at about 1 in. of deflection corresponds to failure of the beam by compression failure in the concrete. The load recovers slightly before a tensile failure of the steel
K2 USACERL TR 98/81
reinforcement. Figure 54 shows the pre and postcracking stages prior to yielding of the steel. Notice the correlation with the ACI-predicted deflections. Table 6 presents the average values for ultimate load, pre and postcracking stiffness, maximum deflection, and toughness results, as compared with the results from the other reinforced beams. The large deflections and toughness are indicative of the ductility of the steel-reinforced beams.
Results from Commercial Carbon Grid Reinforced Beams
Figure 55 shows the overall load/deflection curve for the commercial carbon grid reinforced beams. The low modulus of the reinforcement is evident from the large deflections following the initial cracking of the beam. Figure 56 shows the initial portion of the load/deflection curve. The theoretical load/deflection curve does not predict the sawtooth behavior caused by crack propagation in the beam. The failure mode on these and the other composite grid reinforced beams was a diagonal tension failure in the concrete. Again, the low modulus of the commercial carbon grid (Table 6) results in a lower postcracking stiffness (37 kips/in.), compared to the baseline steel rebar reinforced beam (81 kips/in). The commercial carbon grid also has a lower toughness and maximum deflection.
Results from Commercial GFRP Grid Reinforced Beams
Figure 57 shows the load/deflection behavior of the beams reinforced with commercial GFRP grids. Figure 58 shows an expanded portion of the load/deflection curve. The nonlinearities in the range of 0 to 2 kips can be attributed to localized crushing of the concrete and settling of the supports. These curves demonstrate that the theoretical deflections for the postcracking segment are fairly nonconservative. Once again, the low modulus grid (Table 6) results in very little stiffness (18 kips/in.) after the beam has cracked. The postcracking stiffness is the lowest for the GFRP grid reinforced beam.
Results from BYU Plain Carbon Grid Reinforced Beams
Figure 59 shows the overall deflections for the BYU plain carbon grids. One of the beams showed significantly different behavior than the other two prior to initial cracking of the beam. This difference can be attributed to differences in concrete strengths. Figure 60 shows the initial region of the load/deflection curve. Once again, the differences in behavior can be attributed to differences in the concrete. The nonlinear effects of settling and localized crushing were greater in two of the beam specimens. The postcracking stiffness (Table 6) is slightly larger (88 kips/in.) than that of the steel rebar reinforced beams (81 kips/in.).
USACERLTR-98/81 63
Results from BYU Deformed Carbon Grid Reinforced Beams
Figure 61 and Figure 62 show the overall and expanded load/deflection curves for the BYU deformed carbon grid reinforced beams. The three beams showed very similar behavior to the plain BYU carbon grid reinforced beams. The postcracking effective stiffness, toughness, and maximum deflection, as shown in Table 6, are almost equivalent to the values for the plain BYU carbon grid reinforced beams.
Results from Hybrid Carbon/Steel Grid Reinforced Beams
The effects of the variations in beam strength are again seen in Figure 63 and Figure 64. The beams reinforced with grids composed of carbon fibers and steel wire showed behavior similar to that of the all-carbon grids. As seen in Table 6, the toughness is unexpectedly lower (2.8 kips/in.) in the hybrid grid reinforced beams than in the all-carbon grid reinforced beams (3.8 kips/in.).
Results from Steel Grid Reinforced Beams
The load/deflection behavior of the beams reinforced with steel grids is shown in Figure 65 and Figure 66. The cutting of the steel grids resulted in some nonuniformities in cross-section that can account for the differences between the deformed steel grid and the plain steel grid.
Overall Comparison
Figure 67 shows typical load/deflection curves for some of the beam types. The BYU composite grids showed similar load/deflection behaviors with significantly higher ultimate loads over the steel rebar reinforced beams and the commercial composite grid reinforced beams. The steel rebar reinforced beams demonstrated increased toughness due to the large deflections undergone during the yielding of the reinforcement. Figure 68 shows the initial portion of the load/deflection curves. If the nonlinearities associated with the BYU composite grid reinforced beams were neglected, the postcracking behavior would be similar to that of the steel rebar reinforced beams. Notice the large toughness value (Table 6) for the steel rebar reinforced beam and the higher ultimate loads for the composite grid reinforced beams.
To illustrate the failure mechanisms, a series of photographs was taken during the testing of one of the BYU plain carbon grid reinforced concrete beams. The load/deflection curve of this test is shown in Figure 69, identifying the loading points at which the photographs were taken. The photographs shown in
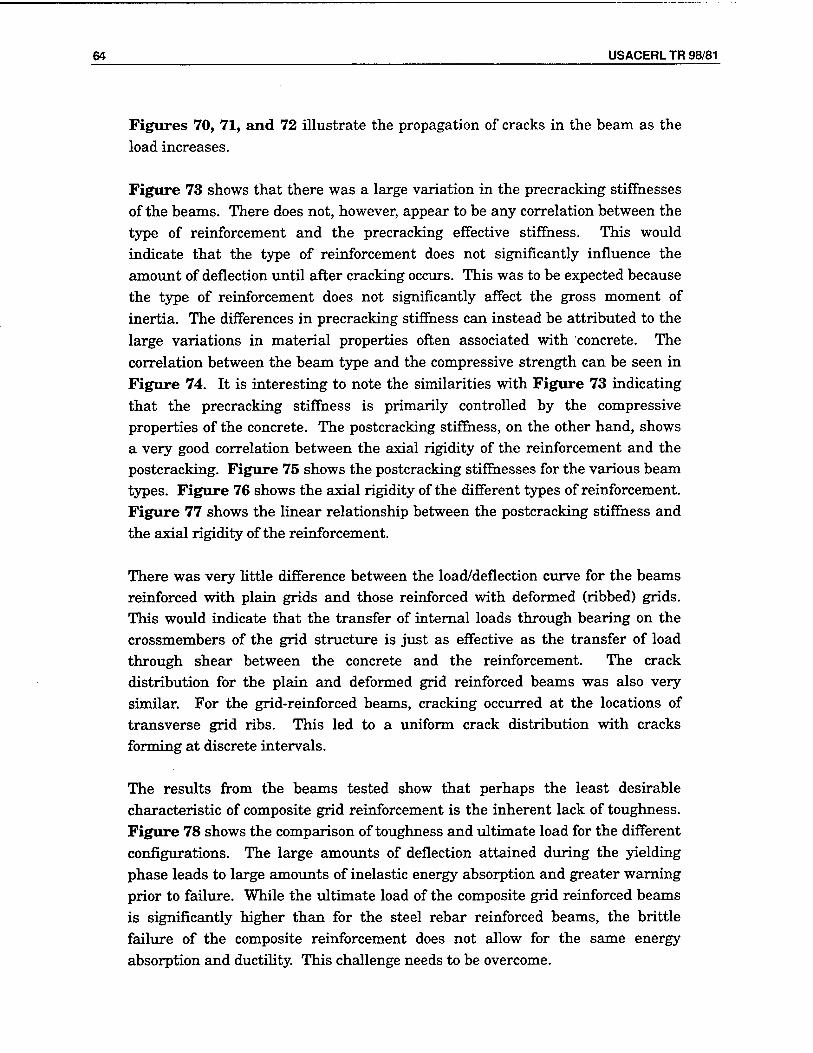
64 USACERL TR 98/81
Figures 70, 71, and 72 illustrate the propagation of cracks in the beam as the load increases.
Figure 73 shows that there was a large variation in the precracking stiffnesses of the beams. There does not, however, appear to be any correlation between the type of reinforcement and the precracking effective stiffness. This would indicate that the type of reinforcement does not significantly influence the amount of deflection until after cracking occurs. This was to be expected because the type of reinforcement does not significantly affect the gross moment of inertia. The differences in precracking stiffness can instead be attributed to the large variations in material properties often associated with concrete. The correlation between the beam type and the compressive strength can be seen in Figure 74. It is interesting to note the similarities with Figure 73 indicating that the precracking stiffness is primarily controlled by the compressive properties of the concrete. The postcracking stiffness, on the other hand, shows a very good correlation between the axial rigidity of the reinforcement and the postcracking. Figure 75 shows the postcracking stiffnesses for the various beam types. Figure 76 shows the axial rigidity of the different types of reinforcement. Figure 77 shows the linear relationship between the postcracking stiffness and the axial rigidity of the reinforcement.
There was very little difference between the load/deflection curve for the beams reinforced with plain grids and those reinforced with deformed (ribbed) grids. This would indicate that the transfer of internal loads through bearing on the crossmembers of the grid structure is just as effective as the transfer of load through shear between the concrete and the reinforcement. The crack distribution for the plain and deformed grid reinforced beams was also very similar. For the grid-reinforced beams, cracking occurred at the locations of transverse grid ribs. This led to a uniform crack distribution with cracks forming at discrete intervals.
The results from the beams tested show that perhaps the least desirable characteristic of composite grid reinforcement is the inherent lack of toughness. Figure 78 shows the comparison of toughness and ultimate load for the different configurations. The large amounts of deflection attained during the yielding phase leads to large amounts of inelastic energy absorption and greater warning prior to failure. While the ultimate load of the composite grid reinforced beams is significantly higher than for the steel rebar reinforced beams, the brittle failure of the composite reinforcement does not allow for the same energy absorption and ductility. This challenge needs to be overcome.
USACERLTR-98/81 65
GRC Investigations at Stanford
GRC investigation at Stanford focused primarily on using concrete as a filler material and the composite grid as the major load-sharing structure in compression, tension, and shear. These results were finally used to validate the GENLAM model as discussed in Chapter 4 for prediction of grid-reinforced concrete behavior. Thus, the Stanford design approach for test specimens was different than the one used at BYU.
Figure 79 demonstrates the schematic of a bi-grid reinforced concrete slab with the grids on the outer surfaces. Figure 80 shows the steps for its construction. Using tube segments as spacers (external dimensions equal the orthogrid cell dimensions and fit snugly into the grid cells), five spacers were placed in each 7x7 orthogrid panel. The spacers were placed in panel center cell and four perimeter cells at the testing load points, as seen previously in Figures 40 and 41. The spacers were bonded with epoxy into the first grid. The second grid was aligned to the first via the spacers and was bonded to the spacers to create the frame. Figure 81 shows one of the completed GRC panels.
To make the reinforced concrete slabs, a fine aggregate concrete was used. Using Type I/II Portland cement, #30 grit sand, and water in a mass ratio of 100:250:60, respectively, a mortar-like concrete mixture was formed. This ratio allowed the cement to easily flow through the cells and completely fill the grid. The grid frames were placed in containment boxes and the concrete was poured to the level of the upper grid surface. Because they have a very low specific gravity, the grids tend to float upwards in the concrete unless restrained during the air removal vibration process. The concrete was allowed to cure for a complete 28 days, after which the GRC structure was ready for testing.
Testing
Two material tests and three structural tests were performed on the GRC, as illustrated in Figure 82. Material tests determine beam-aligned tensile and compressive moduli, and were used in models to predict beam bending behavior. The compressive test was also used to demonstrate the benefits of the grid—high compressive strength and concrete containment after fracture.
The structural tests were out-of-plane tests: 3-point bending of beam, 3-point bending of panels, and 3-point twisting of panels. Panel bending and twisting tests are fundamentally different due to the demands each test places on the grids. The bending test was basically aligned to one of the grid beam directions and tested the grid axial stiffness. The twisting test was cross-aligned to both
66 USACERL TR 98/81
beam directions and tested the grid shear stiffness much like a four-point test that loads all four corners. By observing the actual deformation of the panels in the twist test, a saddle shape may be seen, exactly as would occur with the four- point test. These panel tests check the overall behavior of larger structures, especially in terms of failure toughness and concrete containment.
The three-point bending tests were conducted on three beams of each cross- sectional type shown in Figure 83. All cells were filled with concrete. Displacement data were measured at midbeam where the load is applied, and the strain was measured on one of the two axial beams at a point 2 in. from the beam midspan. The experimental load/deflection and load-strain data are
presented in Figure 84.
Model Via GENLAM
The application of GENLAM to beam bending was discussed in Chapter 4. The goal of this model is to prepare ply material properties that appear within the GRC beams, determine a rule of lamination for combining these plies for accurate beam modeling, and then use the GENLAM-generated 8U value to calculate beam load/deflection behavior. Finally, the model predictions are checked against the experimental values in order to evaluate the model validity.
GRC Plies
Six distinct ply materials, listed in Table 7, were designed for GENLAM analysis. These are divided into groups of pure concrete and grid/concrete materials, with each group having a material that reflects the compressive, tensile, and average behavior. The axial properties are determined as described before, using compressive and tensile tests as represented in Figure 85. Assuming isotropic behavior in the concrete, the shear modulus is obtained from the standard relationship between the axial modulus, shear modulus, and Poisson ratio:
G«=U^) [Eq23]
The Poisson ratio varies slightly for each state of stress within the concrete. For uni- and biaxial tension, the ratio is 0.18. For uniaxial compression it is 0.20. In biaxial states with mixed tension and compression, the ratio is 0.19. The GRC shear moduli are copied directly from the concrete materials on the assumption
USACERLTR-98/81 67
that the concrete contribution towards GRC shear stiffness is much greater than the grid contribution.
Lamination Methods
Among other results, GENLAM calculates the compliance matrix and stresses in laminates. For these GRC beams, each grid layer is divided into four plies of 3.175 mm depth. This provides the grid with multiple stiffness zones to allow placement of appropriate materials at appropriate locations. For example, the upper half is expected to be in compression and should require the application of GRC compressive properties while the lower half is expected to be in tension and should require use of GRC tensile properties. Multiple plies within the grid allow modeling of these changing properties.
There are two ways to evaluate the effectiveness of the model. The first and most obvious way is to compare with the experimental data. However, the goal is to develop a predictive method independent of experimental verification. Therefore, a second method uses tools within GENLAM. By applying a moment to the laminate, Mt = 1MN, GENLAM will calculate the stresses within each ply. For the purpose of this study, it is assumed that the most accurate lay-up model is a laminate in which the stress distribution varies as smoothly as possible across the beam thickness, as drawn in Figure 86. A smooth stress distribution is not generally the rule in laminated composites, but in this situation it is found to be an effective method for evaluating the accuracy of any given lay-up.
The basic lay-up for modeling the beams starts by assuming that the beam neutral axis (N/A) exists at the beam midplane. In the tensile half, plies with tensile properties are applied; in the compressive half, plies with compressive properties are used.
After evaluating the basic lay-up and examining the resultant stress distribution, refinement may be necessary. The two basic refining steps are presented in Figure 87. First, the exact N/A location and hence the exact stress state near the N/A, is assumed to be unknown. To avoid using the incorrect material, an average material is applied to the plies surrounding the N/A. The second refinement is to examine the stress-resultant calculations and allow a shift in the assumed location of the N/A away from midplane. The compressive materials in this model are significantly suffer than the tensile materials. Thus, equally strained compressive and tensile plies will support much different loads. To balance the beam's internal forces, the N/A shifts upward to make a smaller compressive region and larger tensile region. To model this shift, tensile mate- rials are applied up to the assumed N/A location. This location may be confirmed
68 USACERL TR 98/81
in an iterative manner by using GENLAM to display the ply stresses. The tensile, compressive, and average stiffness plies are manipulated until the calculated and assumed locations agree.
Demonstration and Result
The 13 mm beam is the first one to be modeled and verified. The beam is divided into four plies, each taking one of the three GRC material properties (Gt, Gc, Ga). A unit moment of M1 = 1MN is applied in GENLAM and the calculated ply stresses are examined. As described in the previous section, the most basic initial lay-up assumes the N/A at the midplane, with tensile materials in the lower half and compressive materials in the upper half. Lay-up A in Table 8 and Figure 88 represents this case. Upon examination of the stress plot, it appears that the assumed N/A location is incorrect, and it is actually in the upper half, causing tensile loading of compressive materials. A sharp jump in stress levels also occurs at the tensile/compressive materials interface.
Following the refinement guidelines, the N/A is allowed to move and the average material property is applied to the layer that contains it. This leads to Lay-up B, which does smooth the stress distribution—but not completely. In the low-stress states, intuition would expect the beam to behave in a uniform manner with a midplane N/A. To satisfy curiosity, Lay-up C applies the average material to the ply below the N/A. The resulting stress distribution looks coarse, but it starts to satisfy intuition by shifting the N/A back toward midplane. Extending this trend leads to Lay-up D. Lay-up D is the result from using only the average material properties. The N/A returns to midplane, surrounded by average material properties, and the resultant stress distribution is entirely smooth. Figure 89 demonstrates the accuracy of each of these lay-ups by overlaying them on the experimental data. As may be seen, Lay-up D is a good first success for this modeling process because it provides the most accurate predictions, within the experimental scatter, on both the load/deflection and load/strain graphs.
Like the 13 mm beam, the 38 mm beam uses 3.175 mm plies (12 total). Unlike the 13 mm beam, all six materials are used in order to model the three distinct layers (i.e., lower grid panel, concrete core, and upper grid panel). Table 9 and Figure 90 summarize the progression of lay-ups used in this model. Instead of starting with the basic lay-up of tensile and compressive materials, Lay-up A utilizes all average materials in an attempt to learn from the final lay-up for the 13 mm beam. Unfortunately, the stress distribution is extremely jagged. In an attempt to remove the stress discontinuity around the N/A, tensile and compressive concrete properties are applied to the core in Lay-up B. This
USACERLTR-98/81 69
reduces the tensile side discontinuity but aggravates the problem on the compressive side.
Lay-up C returns to the basic lay-up with one refinement; placing an average ply above the N/A. The resulting stresses smooth out slightly and the N/A shifts up into the second layer of the compressive half. Lay-ups D and E are intended to account for the N/A shift. Lay-up D uses tensile and compressive properties around the new N/A and Lay-up E adds an average material layer at the N/A location. Both generate the same numerical results but Lay-up E has the better stress distribution; however, even Lay-up E has a small stress discontinuity in the concrete core. A final lay-up, F, uses only tensile properties in the core and one average with three compressive GRC plies in the upper grid panel. As can be seen, this method produces the smoothest stress graph.
Again, it is reasonable to question the accuracy of the Lay-up F results. The stress distribution is smooth, but the actual predictions may be completely in error. Figure 91 overlays the predictions from these lay-ups onto the experimental data. Notably, each refinement relative to the stress distribution also improved the accuracy of the prediction. Furthermore, the final lay-up falls on the edges and within the actual experimental data.
Considering the success of this modeling method as applied to GRC beams with both the mono-grid panel and the more complex dual-grid frame, it appears that this method may be successful at modeling GRC beams of arbitrary thickness. Figure 92 summarizes the final lay-up models for both the 13 mm and 38 mm beams. As stated above, these lay-ups are found by starting with a basic distribution of plies and then refining the material stacking sequence until the stress distributions vary smoothly between lower to upper surfaces. Further research can extend this method to include strength predictions and application to larger, more generalized structures.
GRC Panel Testing at Stanford
For these tests, 7x7 grid panel structures (each measuring 36 x 36 cm) of various thicknesses were used, from 13 mm mono-grid panels to 38 mm and 64 mm dual- grid frames. These were tested both as grid-only and GRC structures. They were all constructed as described in Chapter 5. The perimeter struts used to make the grid frame were positioned at the center of the sides for the panels used in the bending tests, and at the corners for the panels used in the twisting tests. These locations are designed to place the struts at the loading and support locations so frames without concrete can transfer the loads between the upper and lower grid panels. As a part of a GRC structure these struts lose their
70 USACERL TR 98/81
importance because the concrete takes over the role of bearing the loads between surfaces. Figure 93 shows the mono-grid panel specimen types and test setups. Tests were conducted as described previously, with the load/deflection slope results summarized below.
Grid Behavior
The first question to address was the baseline response to be expected from the grids before placement in concrete structures. A graphical summary of the test results is presented in Figure 94, and numerically tabulated in Table 10.
GRC Behavior
With concrete fill, the panel and frame structures become considerably more stiff. To provide a comparison that highlights this increase in grid stiffness, the charts in Figure 95 compare the mono-grid panel and dual-grid frame behavior to the equivalent GRC behavior. For the 13 mm panel case, bending and twisting stiffness each increase by approximately 150 percent. For the 64 mm frame case, the stiffness increase jumps to 1500 percent in the bending test and a staggering 5000 percent in the twisting test. Figure 96 summarizes the GRC test results that are averaged and tabulated in Table 11.
GRC Toughness
Toughness is one of the design requirements of steel-reinforced concrete structures. If too much reinforcement is used, the SRC panel will fail in a brittle manner due to the inability of the tensile reinforcement to yield at a level consistent with the compressive strength of the concrete (MacGregor 1991). With too little reinforcement, the panel will yield excessively and support far less than the necessary maximum load. The ideal design will support loads up to a desired maximum before yielding, at which point the structure will continue to support that yield load through a significant range of deformation prior to final failure collapse. Such postyield behavior is what constitutes toughness, and it has been observed in all GRC panels, both in the bending and twisting tests. Recalling that the bending test is essentially a test of the grid on-axis stiffness properties and that the twisting test significantly challenges the grid shear stiffness, it is impressive that the GRC panels display failure toughness in both stress states.
Figure 97 explains the various regions of the load/deflection behavior through a failure curve displaying the desired toughness. This is actual data from a 38 mm dual-grid GRC panel. In the first region, the panel deforms elastically up to the
USACERLTR-98/81 71
point of initial yielding at 17.5 kN. At this point, the panel has absorbed approximately 85 joules of energy, calculated as the integrated product of load and deflection (or the area under the load/deflection curve). After initial yielding, the panel begins to deflect significantly, supporting roughly the yield load. It progresses to slightly more than twice the yield deflection before arriving at final failure, with a total absorbed energy of approximately 200 joules. The yield region loading accounts for 58 percent of the total absorbed energy of deformation. This large percentage of total energy absorbed in the yield phase is what defines these structures as tough in failure. Figures 98a and 98b illustrate this behavior in other representative panels.
GRC Concrete Containment
The containment of the fractured concrete likely plays a significant role in the degree of panel toughness demonstrated in the previous section. The structure enters the post-yield phase as the grid and concrete begin to fracture, but by containing all fractured concrete in position, the structure can continue to support the yield load. With the concrete in position, internal forces are still distributed through normal contact between fractured segments such that each continues to support portions of the load. If cement portions were to break away, the internal forces would rebalance by shifting to already overburdened reinforcement elements, which would in turn rapidly induce total structural failure. Photographs in Figures 99 through 101 demonstrate the containment capabilities of GRC panels. These photographs illustrate panels in the post-yield and postfailure stages. Significantly, even the 13 mm mono-grid panels contain the concrete without having any concrete plugs "pop out" from the cells.
Summary
Through various tests of the grid-reinforced concrete structures, it is demon- strated that this reinforcement concept has excellent potential. The grid reinforcement has shown complete concrete containment that results in a high structural toughness, and the ability to avoid the corrosion and construction difficulties found with steel reinforcement. The modeling capabilities can be expanded beyond simple beam stiffness to benefit GRC structures and provide a significant tool for future construction.
72 USACERL TR 98/81
7 Column-Reinforcing Grids
During this research, continuing attention was paid to developing a grid design simple enough to be industrially produced and commercially applied. Through continuing dialogue with the composites industrial partners during this study it became apparent that the manufacturing processes so far developed in the laboratory would not scale up to be economical in an industrial production environment to be cost-competitive with conventional steel reinforcement. Not only must the ultimate value in performance and durability be attractive, but its first cost also must be attractive. Industry feedback gave a strong incentive to develop a grid system that would be economical to manufacture but still retain all the benefits of the grid structure developed in the study. It was also considered that rather than flat grid panel type prototypes, longitudinal structures such as columns would be easier to demonstrate as a new concept to the traditionally conservative civil engineering community.
The proposed reinforcement system, called stacked joint grids, would use grid structures composed of composite members that are placed circumferentially as well as longitudinally. This method of reinforcement would allow concrete columns to be subjected to greater compressive loads before induced shear failure occurs. Concrete columns were tested in compression to explore alter- native geometric configurations of the composite grid structures and optimize their strength.
Stacked Joint Grids
Stacked joint grids were developed in a number of configurations to meet the need for economical production. The circular reinforcement is composed of two carbon fiber rings separated by extruded tubes. These tubes are bonded to the carbon fiber rings by an epoxy fill to make circumferential reinforcement elements called circs. The circs are connected via pultruded GFRP rods. These longitudinal rods, called longis, resist flexure while the carbon fiber reinforced circs contain the concrete under axial compression (Figure 102). This containment of the concrete prevents the column from expanding radially, delaying the primary mode of failure. Preliminary research on sample prototypes successfully demonstrated the feasibility of this concept. This research was continued to explore the role of longitudinal and circumferential
USACERLTR-98/81 73
members to develop suitable design criteria for the stacked joint reinforcement system.
Stacked Joint Grid Specimen Manufacturing
The grid specimens to be manufactured were sized to reinforce concrete column specimens 18 in. long with an 8 in. circular cross-section. This provided concrete columns having a ratio of column diameter to column length that was appropriate for axial compression tests. The concrete columns would be reinforced with manufactured stacked joint grids of various configurations.
The circs used in the stacked grids are V2 in. thick, composed of two hoop-wound carbon fiber reinforced rings separated by interior guide rings made from extruded polymers. The guide rings were bound to the inner and outer carbon fiber rings by vacuum-infiltrated epoxy. The finished first-generation circs contained 15 guide rings and the finished second-generation circs contained 21 guide rings, providing holes for the longis. The longis, GFRP rods pultruded with a high fiber volume fraction, serve as longitudinal reinforcement while providing spacing between the circs.
The first-generation composite grid structures contained circs having a 7 in. outer diameter with a fully packed column of 15 longis; the second-generation structures contained circs having an 8.125 in. outer diameter with a fully packed configuration of 21 longis. Different geometric configurations of the composite reinforcement were built by varying the number of longis and circs to optimize the strength of the columns (Figure 103).
The grid structure was constructed by threading the longis through the holes provided by the guide rings and spacing the circs accordingly. After two or three longis connected the desired number of circs, more longis could be added to the configuration. For the first-generation columns, a small amount of 5-minute epoxy was used to bond each of the circs to the longis at 90-degree angles. However, for the second-generation longis, only the end circs were bonded with epoxy. The middle circs were spaced with sections of cylindrical cardboard molds for concrete, and these also served as the mold for the concrete cylinder. The edge of the cardboard tubing was bonded to the circs using caulk; the tubing and caulk were later removed after the concrete had set.
74 USACERL TR 98/81
Test Matrix
The test matrix used for the laboratory investigations comprised of twenty 18 x 8 in. concrete columns. Thirteen of these columns were constructed using first- generation circs, while four columns were constructed using second-generation circs. The number of columns was limited by the amount of materials available; therefore, the test matrix was organized so that the compression tests would cover a spectrum of circ/longi combinations. This approach allowed for a comparison between different composite grid structures to optimize the reinforcement.
Two sets of six different geometric configurations of the grid structures were constructed using 2.0 and 4.0 in. spacing between first-generation circs, while varying the number of longis (5, 10, and 15). Also, three different configurations were constructed using 2.5, 3.0, and 3.5 in. spacing between second-generation circs while using 21 longis in each column (Table 12). To examine the influence of containment, two fully packed columns of each column generation (15 and 21 longis) were tested with a circ on each end, but no circumferential reinforcement in the middle of the column.
Manufacturing the Concrete Columns
An 8 in. length of cylindrical cardboard tubing was used as the mold for these columns in an effort to make these tests conform with industry standards as much as possible. The concrete columns made with the first-generation grid structures had approximately 1/2 in. concrete covering the outer part of the composite grid structure. However, due to the larger diameter of the second- generation circs, the outer surfaces were exposed. As discussed previously, the cardboard tube was cut into sections (varying in width) and used to space the circumferential reinforcement while remaining flush with the circs.
For the purpose of determining the critical locations of stress and strain, a preliminary compression test was performed on a single composite grid structure without any concrete using 12 electrical resistance strain gages mounted on the circs and longis. For the columns included in this experiment at least one pair of electrical resistance strain gages was mounted in each column (one on the longi and one on a circ) before the concrete was poured. The strain gages were placed on the longitudinal reinforcement at the mid span of the longi and on the outside of the middle circ. As many as six gages were used on the second-generation columns. The mounting of the strain gages followed the manufacturer's suggested procedure. The surface was prepared through degreasing, surface abrasion, and conditioning. The strain gage was mounted with a small amount
USACERLTR-98/81 75
of 5-minute epoxy. Pressure was applied to the gage as the epoxy cured to ensure a good bond. Lead wires were then soldered to the tabs and the gages were checked with a strain indicator box to ensure that they were functioning properly. The completed gage was covered with epoxy to protect it while the concrete was placed and cured.
A mix design corresponding to a compressive strength of 3000 psi was chosen for the column specimens. Although an even higher strength is common for reinforced concrete structural members, this mix design was used because of the high strength of the composite reinforcement and also to ensure that the maximum load of the compression machine (300 kips) would not be exceeded. A Type I portland cement was used and the columns were allowed to cure for 28 days.
The columns were formed using concrete sono-tubes. Before pouring the concrete, the cylindrical cardboard molds were cut and sanded to a length of 20 in. and a steel base plate was coated with a release oil. Small holes were drilled in the molds to allow the strain gage wires to exit the column molds. The composite grid structure was centered in the middle of the sono-tube while standing upright. The concrete was mixed in a large portable mixer and the molds were filled with concrete in five lifts, each approximately 4 in. in height. Each lift was rodded 50 times with a blunt rounded rod and the sides of the mold were struck sharply five times with a mallet. An aggregate of 1/4 in. diameter was used with the first generation columns and an aggregate of 3/8 in. diameter was used with the second-generation columns to place the concrete between the longitudinal reinforcement.
Curing
The completed fiber-reinforced concrete columns and plain concrete column specimens were left in the molds overnight. The next day the molds were removed from the columns and the concrete specimens were placed in a fog room where the temperature was maintained at approximately 75 °F and the humidity was maintained at 90 to 95 percent. The concrete columns were cured in the fog room for 28 days.
Compression Samples
For baseline concrete data an 8 in. diameter, 18 in. long compression cylinder was poured with each set of columns (total of 3). Similar to the other columns, these compression cylinders were filled in five lifts of equal height and each lift was rodded 50 times. These samples were tested at the same time as the
76 USACERL TR 98/81
composite grid reinforced concrete columns to determine the concrete strength at the time of testing.
Experimental Procedure
The preliminary compression test of the single composite grid structure (with and without concrete) was performed on a 300-kip Baldwin compression machine. The entire load head was allowed to swivel to ensure an evenly distributed load. Because the load required to fail this column (with reinforcement of 6 circs and 5 longis) almost exceeded the load capacity of the 300-kip machine, the first- and second-generation columns were tested with a 4- million pound Baldwin test machine.
After the columns had been allowed to cure they were capped using a sulfur compound. A sulfur cap ensures that the load will be distributed over the entire end of the column. This was important considering the configuration of compos- ite reinforcement.
After removal from the fog room, the concrete columns were allowed to dry until the surface was free of excess moisture. Strain gages were again checked with the strain indicator box and marked with colored tape to identify longitudinal strain and circumferential strain.
A data acquisition setup similar to that used for the reinforced concrete beam testing performed by BYU was used. To begin a test the data acquisition system was started and the swivel load head was lowered until contact was made with the top of the column. The range on the Baldwin 4-million lb test system was set to the low range (0-1000 kips) and the load dial was zeroed. The hydraulics were then started and load was applied to the column at an approximately constant rate of 200 to 300 lb per second. The loading rate varied somewhat between specimens because of the limitations of the manual controls on the Baldwin 4- million lb system. In each case, the load was increased until a significant drop in load indicated failure.
As the testing began the load increased steadily until initial cracking of the column occurred. For the first-generation columns, initial cracking occurred when the load reached approximately 250 to 300 kips. A slight drop in load indicated that the initial cracking had occurred, and concrete outside of the reinforcement began to separate from the composite grid structure inside the column. This external concrete layer displayed very dynamic behavior, shooting the concrete outward at high velocity. After this initial failure the load continued
USACERLTR-98/81 77
to climb steadily until a sudden failure initiated at one end of the column. The concrete crumbled locally, the end circ slid down the longis and the ends of the pultruded longis exhibited brooming (Figure 104). Once this happened, the end circ failed dramatically and again sent the crumbled concrete flying away from the column. The load on the column would drop by one-third to one-half and then slowly build back up to approximately the same load level until another circ would fail in a similar manner. After two or three circs had failed the load would no longer increase and the test was stopped. The second-generation columns failed in a similar manner, but at much higher loads.
The plain concrete columns were tested on the same day as the fiber-reinforced concrete columns. Load/deflection readings were taken with the load cell to determine the concrete's modulus of elasticity. The ultimate load was recorded for all of the concrete specimens (Table 12).
First-Generation Columns, 2.0 in. Spacing
Columns A, B, and C consisted of 10 circs spaced 2.0 in. apart (from center to center of each circ), with the number of longis being varied (5, 10, and 15, respectively). The plain concrete failed at 120 kips or 2.1 ksi; the 2.0 in. spaced fiber reinforced columns failed around 300 kips or 5.9 ksi. This represents an improvement in strength by a factor of approximately 2.8 (Table 13).
Because the load is controlled by the stroke of the compression machine, the load vs time graph cannot be used to directly compare the columns. However, a comparison of load vs time shows how the column was affected as each circ failed (Figure 105).
Although the strength of the individual columns was not affected a great deal by the number of longis, the stiffness was affected, as shown by the load/deflection curves. In particular, the initial slope of the stress-strain curve is affected by properties of the GFRP which is much suffer than concrete (Figure 106). This affect on the stress-strain curves in longitudinal reinforcement is also seen in the stress-strain curves of the circumferential reinforcement (Figure 107).
First-Generation Columns, 4.0 in. Spacing
Columns D, E, and F consisted of 10 circs spaced 4.0 in. apart (from center to center of each doubled circ) with the number of longis being varied (5,10, and 15, respectively). These composite structures were built in this configuration to see the effect of doubling the density of the circs by placing two circs at each location, 4.0 in. apart (see Table 14).
78 USACERL TR 98/81
Again, the plain concrete, which corresponds to the concrete used in these columns, failed at 120 kip (2.1 ksi) while the 4.0 in. spaced fiber reinforced columns failed around 250 kip (5.0 ksi). This represents an improvement in strength by a factor of approximately 2.0. The number of longis made more of a difference in the ultimate strength of the 4.0 in. spaced fiber-reinforced columns than it did in the 2.0 in. spaced fiber-reinforced columns (Figure 108). An additional 5 longis increased the axial compressive strength of the columns by approximately 43,800 lb, or 17.5 percent.
These tests proved that doubling the density of the circs by spacing them closer together (2.0 in. vs 4.0 in. apart) was more effective than doubling the density of the circs by spacing two circs at each location, 4.0 in. apart. These results suggest that total containment of the column is the optimal way to reach an ultimate compressive strength.
The number of longitudinal reinforcements in the 4.0 in. spaced columns had a significant impact on the stress-strain curves. Most of the gages inside the first- generation columns were ripped off the composite reinforcement due to shear after the first circ failure. However, Column F in Figure 109 shows the load transfer on a middle circ as several end circs failed in succession.
Second-Generation Stacked Joint Grids
The second-generation circs were by far superior to the first-generation ones. This was due to the higher quality of the carbon fiber hoop windings and not the additional number of longis allowed for in the configuration (Table 15).
These columns were averaging over 700 kips, or 14.1 ksi, while the concrete samples from which they were made had an ultimate axial compression strength of 128 kips, or 2.5 ksi. This shows an increase of strength by a factor of approximately 5.5. Although the second-generation columns failed at three times the load of the first-generation columns, their behavior was very similar. Column H is a good example of these columns and their ability to repeatedly release stress through failure of an end circ and then build up to even a higher load (Figure 110).
Figure 111 shows the load transfer to the other circs in the column as each end circ failed. These axial compression tests on the second-generation columns confirm that the number of longis is correlated to the initial slope of the stress- strain curve. Columns G, H, and I all had 21 longis, and the initial slope for each column is almost identical (Figure 112).
USACERLTR-98/81 79
Discussion of Results
Figure 113 shows that the ultimate load is directly proportional to the number of longis, which is expected because of the predominant influence of the longis over concrete strength. Figure 114 shows groups of data depicting a dramatic increase in the compressive strength of the second-generation grid structure.
Failure Modes
Plain concrete columns typically fail due to shear, which is evident in a 45- to 60- degree angle crack after failure. In these advanced composite grid structures, longitudinal rods resist flexure while the carbon fiber rings contain the concrete under axial compression. This containment of the concrete prevents the column from expanding radially, delaying the primary mode of failure. Failure generally initiated at one end of the columns. The concrete crumbled locally, the end circ slid down the longis, and the ends of the pultruded longis exhibited brooming. Soon after this, the end circ would fail, which would further broom out the longis and increase the area over which the load was being applied. One possible way to overcome this local failure and realize an increase in strength would be to use steel endcaps.
The data collected from these tests for the first- and second-generation columns suggest that the only major factor determining failure of the column for a given number of longis is strength of the circumferential reinforcement. A full- containment jacket made of the same high-quality carbon fiber hoop windings would produce incredibly high strength.
Stress-Strain Behavior
Although the strength of the individual columns was not affected a great deal by the number of longis, the load/deflection curves were. This is evident in the initial slope of the stress-strain curves for circs in columns with the same number of circs but varying number of longis. This is due to the properties of GFRP, which is much suffer than concrete. The number of longis resisting flexure also affected the initial slope of the stress-strain curve for the circumferential reinforcement of the column. The stress-strain diagram for first- generation columns was interesting in this respect: as the first circ failed, the stress dropped dramatically and the strain increased for the remaining circs in the columns. Typically, one would expect the strain to decrease as the stress dropped. This occurrence may be due to the stroke control of the compression machine and the column's effort to expand radially. Between failures of end circs, the stress-strain relationship is linear and repeats at the same slope.
80 USACERL TR 98/81
Load Transfer Effects
As shown in the overall comparison of ultimate loads for the various configurations of columns, there is a huge difference between the plain concrete columns and those with even minimal composite reinforcement. Preliminary tests performed on plain grids with no concrete showed them to have a low ultimate load strength. The high ultimate compressive strength of the reinforced columns suggests that the load is being carried synergistically between the concrete and advanced composite reinforcement. From the stress- strain diagrams, it appears that the concrete initially takes the load and at its yield point the composite grid begins to carry the load. There is a linear relationship here that is based on the stiffness of the GFRP longitudinal reinforcement. With an increase in load the longis have the tendency to buckle. However, buckling is prevented by the circs, which brace the longis while confining the concrete that is attempting to expand radially.
Apparently the concrete outside of the composite grid structure is not an integral part of the load transfer between the concrete and the composite. At the load where plain concrete columns fail, the reinforced columns showed separation of the external concrete with the grid structure (Figure 115).
USACERLTR-98/81 81
8 Conclusions, Recommendations, and Commercialization
Conclusions
This research introduced a new concept of concrete reinforcement and grid manufacture. Instead of simply replacing steel reinforcement bars with composite versions of the same form, the proposed reinforcement method was designed especially to make use of the grid's unique properties. In this concept, grid panels were placed in the outermost layers of the structure, creating a grid/concrete sandwich. The concept was proven to be economically feasible and mechanically sound.
It must be noted that the work was brought to a conclusion before a demonstration model was produced, as had originally been proposed in the scope of work. Before building any demonstration model it is essential that full-scale testing is done in the laboratory. This testing and model demonstration would have required additional resources and time that were not available before conclusion of the project. However, the work serves as a proof-of-concept for using composite grid systems for reinforcing concrete structures.
The concept of composite grid reinforced concrete has been shown to be both predictable and reliable. Based on experimental data, load/deflection behavior of grid-reinforced concrete (GRC) is strictly a function of the mechanical properties of the reinforcement and the concrete. The load transfer mechanism involved with GRC is adequate to transfer internal stresses from the concrete to the reinforcement, and is possibly more reliable than relying on a shear transfer. There are encouraging results from the experimental tests that tend to validate the initial model developed at Stanford University. Based on an examination of manufacturing process alternatives, innovations will be required in material selection, processing, fabrication, and placement techniques. It is clear that a completed system as proposed by this investigation could produce a concrete- reinforcing methodology that would offer simple design procedures and cost savings in field assembly (place and pour) while providing durability and damage tolerance.
82 USACERL TR 98/81
Design Issues
Traditional methods for designing steel-reinforced concrete elements are intended to force ductile failure. Such failure provides warning, dissipates energy through inelastic action, and often avoids complete structural collapse. This characteristic is assured by forcing designs to provide "under-reinforced" elements, meaning that reinforcing quantities are limited to amounts that force steel to yield before concrete crushes. Referring to the grid-reinforced concrete beam test results given in Figures 67 and 68, it seems clear that a similar ductile characteristic could be induced with the FRP grids. However, the mechanism of failure for FRP grids is totally different from the ductile nature of steel. The grids fabricated at BYU had almost the double the ultimate strength and toughness of the commercially fabricated grids but, as shown in Figure 78, the toughness was only about 30 percent for that of steel bar. It is interesting to note that the ultimate load capacity of the FRP grids was about 30 percent higher than for the steel reinforcement. The FRP provides a greater margin of safety, but provides less warning.
Theoretically, significantly larger volumes of FRP reinforcement could achieve the same deflection limitations provided in a steel-reinforced concrete element subjected to the same loads. However, the factor by which FRP reinforcement volume could be increased to lower deflections without failure of the concrete by crushing or shear was a concern, and was explored at Stanford University with analysis and grid-reinforced slab testing. The possibility of using concrete as a filler material with composite grid frame as the major load-sharing structure in compression, tension, and shear was investigated. Results from the tests of dual-grid GRC panels shown in Figures 97 and 98 illustrate that after yielding, the panels deflect significantly and support roughly the yield load. The yield region accounts for roughly 60 percent of the total absorbed energy of deformation. More significantly, as the structure enters the post-yield phase and the grid and concrete begin to fracture, all internal fractured concrete is contained in position, and the structure continues to support the yield load. With the concrete crushed, the internal forces rebalance by shifting the forces on the grids until inducing the total failure as shown in Figure 101. GENLAM provided an analytical tool for this design.
The application of composite grid frame as the major load-sharing structure in compression, tension, and shear was adapted in a stacked joint grid configuration as discussed in Chapter 7. Concrete was used as a partial compression load bearing structure. Here the stacked grid reinforcement was used in columns that were subjected to compressive loading. The FRP longitudinal rods (longis) shared the major load in this configuration, as can be
USACERLTR-98/81 83
seen in Figure 113. This figure shows that the ultimate load is directly proportional to the number of longis. Figure 114 shows that under this config- uration the ultimate load capacity would be 750 percent of the plain concrete compressive load capacity. The toughness of these columns is controlled by the number of longis and the number of circular reinforcements (circs). The inno- vative stacked joint grids with circs and longis over-performed when compared with the baseline steel-reinforced concrete.
The failure mechanisms of the orthogrid reinforcements of concrete were also different from the failure mechanisms of steel-reinforced concrete. As opposed to the distributed force transfer provided by conventional deformed steel rebars, force transfer is concentrated at the intersecting FRP grid lines. Several implications of these differences were of concern. First, it was necessary to ensure that the grid "joints" (where the orthogonal ribs intersect) are structurally capable of transferring the force without failure. Second, the concentration of force transfer in the concrete matrix may lead to larger individual crack widths that are concentrated at the grid points. Third is the possibility of formation of shear failure planes in the concrete matrix along these orthogonal grid lines that could accompany the concentrated load transfer mechanisms. The experiments performed with grids and discussed in Chapter 6 addressed these issues and clearly showed that the transfer of internal loads through bearing on the cross rib members of the grid structures is just as effective as the transfer of load through shear between the concrete and reinforcement. Figures 70 through 72 clearly demonstrate that the crack distribution for the grid-reinforced beams was uniform, and cracks formed at discrete intervals.
To summarize, in both the FRP grid-reinforced concrete slab design and the stacked joint grid-reinforced concrete column design, the composites were intended to share major loads, and consequently the load transfer mechanisms are significantly different from those for conventional steel-reinforced concrete. In the grid-reinforced slabs, the concrete was crushed in individual cells under compression and shear loads, but the slabs did not fail until the composite ribs failed. Similarly, in the stacked joint grids, the concrete crushed before the circs failed or the longis buckled.
Manufacturing Issues
The manufacture and use of composite grid structures have been explored and refined through this research project. A demonstration of current technology revealed that composite grids generally suffer from manufacturing problems of low density interlacing, no fiber tension, and excessively thick nodes with direct
84 USACERL TR 98/81
roving crossovers. Simple steps were taken to resolve the first two of these problems, and the PEG process was then developed by Stanford University to properly distribute the fibers through the nodes in such a way as to generate grids with uniform fiber volume fractions and thicknesses throughout the structure. It was shown that through the use of even a single nodal guide pin, this process significantly increased the grid material properties. The method was even able to be generalized from a basic orthogrid panel to the unprecedented isogrid panel.
The TRIG architecture returns to the basic and simple direct crossover through the nodes, but uses composites tubing in the grid cells to reinforce the structure and provide a uniform thickness dimension. This also allowed implementation of a unique tooling concept that integrates into the reinforcement during the manufacturing process—the reinforcement tubes are used to make the mold for each panel. This disposable tooling concept eliminates the significant investment in conventional reusable molds. The concept was further developed to produce large numbers of grids by slicing tall grid blocks manufactured with a modified TRIG technique. This process has the potential for tremendous cost reduction in grid manufacture.
Recommendations
As indicated above, the composite grid system in its current phase of develop- ment is not yet ready for field demonstration or commercialization. The recom- mendations specified below address technical requirements and issues that should be carefully considered during any future commercialization phase.
1. Optimize resin and fiber combinations to improve strength, stiffness, ductility, and durability. The key areas of investigation in this project included fiber types and volume in the resin matrix. Both stiffness and ductility need improvement. With higher stiffness and strength FRP grids may possibly overcome the problems associated with low postyield ductility, but such procedures will require industry acceptance.
2. Optimize tfie stacked joint grid geometric configuration. The strength of the partially contained columns is highly dependent on the strength of circumferential reinforcement. This research suggests that the more area confined the greater the strength of the columns. Optimization is needed toward either full containment or partial containment using high-strength circumferential reinforcement spaced at regular intervals. The greater the circumferential reinforcement, the higher the ultimate strength, but the cost-to-
USACERL TR-98/81 85
benefit ratio may prove that partial containment using high-strength circumferential reinforcement is more cost-effective.
3. Conduct further studies of creep and fatigue properties. Studies of these properties in the civil engineering area have been relatively limited to date. More data are needed to ensure that these properties are well understood, not for the FRP grids alone, but for the reinforced system itself.
4. Conduct long-term studies of environmental effects on structural properties. This recommendation is made especially for GFRP reinforcement. Areas for further study include acid and alkaline exposure, salt exposure, ultraviolet radiation exposure, and fire exposure. Each of these factors will affect the required depth of concrete cover over the FRP grid.
5. Collect data on the use of FRP grids as confining elements in reinforced concrete frame construction, particularly in seismically active regions. The research community has become particularly aware of the benefits of confining column elements as a means of enhancing their ductility in bridges and buildings. Whether FRP grids may be used effectively will depend first on the proper combinations of strength and stiffness, which currently favors CFRP over GFRP. Beyond these requirements, the results of environmental effects studies and improved manufacturing flexibility will be influential.
6. Develop large-scale manufacturing techniques using the improved fiber and resin combinations. This is critical in making the technology cost-competitive. The techniques must also be flexible in permitting significant variations in grid sizes and configurations to accommodate designers' need for flexibility.
7. Commercialize the technology with recognition of long-established ACI standard practice. It is important for potential commercializers of this technology to recognize that widespread acceptance of the ACI Building Code has come after more than 75 years of research and application experience with steel reinforcement. The commercialisation of grid-reinforced concrete technology will proceed most effectively when a larger experimental database is available for consideration by the targeted mainstream end user. Another essential aspect for successful commercialization will be the development of an acceptable design philosophy that recognizes the differences between plastics behavior and steel behavior.
Technology Transfer and Commercialization
At the time this CPAR project concluded, the industry Partner Participants were ready to fabricate full-scale components for testing. The CPAR Partner, Stanford University and their partners, had planned to continue testing, development, and commercialization with the resources available to them.
86 USACERL TR 98/81
References
ACI Building Code and Commentary, 318-89, American Concrete Institute, Revised 1992.
American Concrete Institute. ACI 318-95, Building Code Requirements for Structural Concrete,
ACI Committee 440, State of the Art Report on Fiber Reinforced Plastic (FRP) Reinforcement for Concrete Structures, ACI 440R-96, American Concrete Institute, Detroit, MI, 1995,152 pp.
American Society of Testing and Materials Standards (ASTM) 1916 Race St, Philadelphia, PA 19103.
Bakis, Charles E. (1993). "FRP Reinforcement: Materials and Manufacturing," Fiber-Reinforced Plastic (FRP) Reinforcement for Concrete Structures: Properties and Applications, Elsevier Science Publishers B.V., pp 13-49.
Bank, L. C, Xi, Z., and Mosallam, A S., "Experimental Study of FRP Grating Reinforced Concrete Slabs," Proceedings of the Advanced Composite Materials in Civil Engineering Structures Specialty Conference, Las Vegas, NV, ASCE, February 1991, pp 111-122.
Banthia, N., Al-Asaly, M., and Ma, S., "Behavior of Concrete Slabs Reinforced with Fiber- Reinforced Plastic Grid," Journal of Materials in Civil Engineering. Vol 7, No. 4, Nov. 1995, pp 252-257.
Beckwith, S.W., (1984). "Creep Behavior of Kevlar/Epoxy Composites," Proceedings of 29th SAMPE Symposium, pp 578-591.
Berg, C.A., and Salama, M., (1973). "Fatigue of Graphite Fiber Reinforced Epoxy in Compression," Fiber Science and Tech, vol 6, pp 79-118.
Bocker-Pedersen, O., (1974). "Creep Strength of Discontinuous Fiber Composites", Journal of Materials Science, Vol. 9, p 948.
Brinson, H.E.Griffith, W.I., and Morris, D.H., (1980). "Creep Rupture of Polymer-Matrix Composites," Fourth SESA International Congress on Experimental Mechanics, Boston MA, pp 329-335.
Budelman, H., and Rostasy, F.S., (1993). "Creep Rupture Behavior of FRP Elements for Prestressed Concrete—Phenomenon Results and Forecast Models," Fiber-Reinforced Plastic Reinforcement for Concrete Structures, International Symposium, American Concrete Institute SP-138, pp 87-100.
Chaalal, O. and Benmokrane, B., (1996). "Fiber-reinforced Plastic Rebars for Concrete Applications," Composites: Part B, Elsevier Science Limited, Great Britain, 1996, pp 245-252.
USACERLTR-98/81 87
Chamis, C.C., (1974). "Mechanics of load transfer at the interface," Composite Materials, Vol 6, Edwin P. Plueddemann, ed., Academic Press, pp 31-73.
Chen H.J., and Tsai, S.W., (1996). "Analysis and Optimum Design of Composite Structures," Journal of Composite Materials, 1996, Vol 30 (4/6) pp 503-534.
Chen, Hong-Ji., (1995), Analysis and Optimum Design of Composite Grid Structures. Stanford University, Stanford, CA.
Chen, S., and Lottman, R.P., (1991). "Buckling Loads of Columns Made of Viscoelastic Materials," Proceedings ofASCE Mechanics, Computing in 1960's and Beyond, ed. H.Adeli, and R.L.Sierakowski, pp 691-695.
Colwell, T.B., (1996). "The Manufacture and Application of Composites Grid Structures, Ph.D Thesis, Stanford University, Stanford, CA
Davis, J.G., (1975). "Compression Strength of Fiher Reinforced Composite Materials," Composite Reliability, ASTM STP 580, pp 364-377.
Dewimille, B. and A.R. Burnsell, (1983). "Accelerated aging of a glass fiber reinforced epoxy resin in water," Composites, Vol 14, p 35.
Dillard, D.A., and Brinson, H.F., (1983). ANumerical Procedure for Predicting Creep and Delayed Failures in Laminated Composites. ASTM STP 813, T.K. O'Brien, ed., ASTM, Philadelphia, pp 23-37.
Dolan, C.W., (1990). "Developments in Non-metallic Prestressing Tendons," PCI Journal, Vol 35, No. 5, Sept-Oct, pp 80-88.
Dutta, P.K. and Bailey, D.M. (1996). Unpublished CRREL technical notes on the Rapid Method of FRP Grid Manufacture by Slicing.
Dutta, P.K and Bailey, D.M., (1995). "FRP Composite Grid Frame Structures for Reinforced Concrete," in Fiber Reinforced Structural Plastics in Civil Engineering, eds S.L.Iyer, and V. Kalyanraman, Tata McGraw Hill Publishing Co. Ltd. New Delhi, pp 499-507.
Dutta, P.K, and Hui, D. (1997a). "Creep Study of FRP Composite Rebars for Concrete," 11th
International Conference on Composite Materials, Gold Coast, Australia, July 14-18.
Dutta, P.K, and Hui. D. (1997b). "Effects of Cold Regions Environment on Structural Composites," International Conference on Advanced Technology (ATEM 1997), Japan Society of Mechanical Engineers, Wakayama University, Japan, July 1997, pp 61-64.
Dutta, RKand Hui D, (1996). "Low Temperature and Freeze-Thaw Durability of Thick Composites," Composites: Part B: Engineering, Elsvier Science Limited, Vol 27B, No. 3/4, pp 371-379.
Dutta, P.K (1995). "Durability of FRP Composites," in Fiber Reinforced Structural Plastics in Civil Engineering, eds S.L.Iyer, and V. Kalyanraman, Tata McGraw Hill Publishing Co. Ltd. New Delhi, pp 360-370.
88 USACERL TR 98/81
Eggleston, M.R., (1994). "The Transverse Creep and Tensile Behavior of SCS-6/Ti-6AL-4V Metal- Matrix Composites at 482°C," Journal of Mechanics of Composite Materials and Structures, Vol 1(1), pp 53-73.
Faza, S.S. (1995), "Properties of FRP Reinforcing Bars, Fiber Reinforced Plastics Workshop, Office of Technology Applications," FHWA, January 1995.
Fibergrate. 4115 Keller Springs Road / Suite 224, Dallas, TX 75244. Plastics in Building Construction, Technomic Publication, Vol XVIII No. 1, pp 5-7.
Findley, W.N. (1960). "Mechanism and Mechanics of Creep in Plastics," Society of Plastics Engineering Journal, Vol 16, No. 1, 2 January 1960, pp 57-65.
Findley, W.N. (1987). "26-Year Creep and Recovery of Polyvinyl Chloride and Polyethylene," Polymeric Engineering and Science, Vol 27 No. 8, pp 582-585.
Fujisaki, T, Nakatsuji, T, and Sugita, M., "Research and Development of Grid Shaped FRP Reinforcement." Fiber Reinforced Plastic Reinforcement for Concrete Structures International Symposium, American Concrete Institute, Detroit, MI, 1993, pp 177-192.
GangaRao H.V.S., and PKDutta, (1996). "Review on Aging of Fiber Reinforced Polymer Composites", in Advanced Composite Materials State-of-the-Art Report, The First Middle East Workshop on Structural Composites, eds. AH.Hosny, S.H.Rajkilla, I.Mahfouz, AMosallam, Sharm El-Sheikh, Egypt, June 14-15,1996, pp 45-58.
GangaRao H.V.S., Vijay V.V, and Dutta P.K., (1995). "Durability of Composites in Infrastucture," Paper No. 550, CORROSION 95, NACE International Annual Conference and Corrosion Show, NACE International Publications Division, pp 550/1-550/8.
Goodspeed, C.H. Smeckpeper, E. Gross T. Henry R. Yost J, Zhang M., (1991). "Cyclical Testing of Concrete Beams Reinforced With Fiber Reinforced Plastic (FRP) Grids," Proceedings of the Advanced Composite Materials in Civil Engineering Structures Specialty Conference, Las Vegas, NV, ASCE, February 1991, pp 278-287.
Gresczuk, L.B., (1975). "Microbuckling Failure of Circular Fiber-Reinforced Composites," AIAA Journal, Vol 13, pp 1311-1318.
Hahn, H.T. and R.Y Kim, (1978). "Swelling of composite laminates, "Advanced Composite Materials-Environmental Effects, ed. J.R. Vinson, ASTM-STP 658, American Society for Testing of Materials, Philadelphia, PA PP 98-130.
Hahn, H.T, and Williams, J.G., (1984). Compressional Failure Mechanisms in Unidirectional Composites, NASATM85834.
Hahn, H.T, Sohi, M., and Moon, S., (1986). Compression Failure Mechanisms of Composite Structures, NASA CR 3988.
Hancox, N.L., (1975). "The Compression Strength of Unidirectional Carbon Fiber Reinforced Epoxy Resin," Journal of Material Science, Vol 16, pp 234-242.
USACERLTR-98/81 89
Harmon, T.G. and Slattery K.T., (1992). "Advanced Composite Confinement of Concrete," Proceedings of the 1st International Conference on Advanced Composite Materials in Bridges and Structures, Canadian Society for Civil Engineering, pp 299-306.
Hasegawa, A., Matsuda, T., Higashida, N., (1992). "Carbon Fiber Reinforced Earthquake-Resistant Retrofitting for RC Piers," Doboku Gijutsu, 97 [3]. pp 43-50.
Heger, F.J., ed. (1981). "Structural Plastics Design Manual Section 10.6," American Society of Civil Engineers.
HeiljC.C, and Brinson, H.E, (1983). "The Nonlinear Viscoelastic Response of Resin Matrix Composites: Composites Structure 2," Proceedings of Second International Conference on Composites Structures, Paisley, Scotland, pp 271-281.
Holmes, M.and Rahman, TA., (1980). "Creep Behavior of Plastic Box Beams," Composites, pp 79- 85.
Huang, J.S. and Gibson, L.J., (1990). "Creep of Sandwich Beams with Polymer Foam Composites," ASCE Journal of Materials in Civil Engineering, Vol 2(3), pp 171-182.
Jones, R.M., (1975). Mechanics of Composite Materials, McGraw-Hill Book Company, New York, NY, pp 57-59.
Kaliakin, V. N., "Analysis of Concrete Beams Reinforced with Externally Bonded Woven Composite Fabrics," Composites: Part B, Elsevier Science Limited, Great Britain, 1996, pp 235-244.
Kant, T., Ramana, V.P.V. Dutta, P.K, Mukherjee, A., and Desai, Y, (1997). "Construction Applications of Fiber Reinforced Polymer Composites: A Survey," Proceedings of Seventh International Offshore and Polar Engineering Conference, May 25-30, Honolulu, HI.
Karbhari, V. M., Eckeel, DA., and Tunis, G.C., (1993). "Strengthening of Concrete Column Stubs Through Resin Infused Composite Wraps," University of Delaware Center for Composite Materials, Technical Report CCM Report 93-23.
Katsumata H., Kobatake, Y, and Takeda, T, (1988). "A Study on Strengthening with Carbon Fiber for Earthquake-resistant Capacity of Existing Reinforced Concrete Columns," Proceedings of the 9th World Conference on Earthquake Engineering, Tokyo, Vol VH, pp 517-522.
Koury, J., and Dutta, P.K, (1993). "Design and Analysis of Composite Isogrid for Bridge Construction," NASA Fourth National Technology Transfer Conference and Exposition, December 7-9,1993, Anaheim, CA, NASA Conference Publication 3249 Vol 1, pp 377-384.
Koury, J., and Kim, T, (1991). "Continuous Filament Wound Composite Concept for Space Structures," Eighth International Conference on Composites, July 9-11, Honolulu, HI.
Koury, J., Kim T, and Tracy, J., (1993). "Continuous Fiber Composite Isogrid for Launch Vehicle Application," Ninth International Conference on Composites, July 12-16, Madrid, Spain.
Krisnaswamy, P., Tuttle, M.E., Emery, A.F., Ahmad, J., (1991). "Finite Element Modeling of Time Dependent Behavior of Nonlinear Ductile Polymers," Plastics and Plastic Composites, MD-Vol 29, ASME, NY, pp 77-99.
90 USACERL TR 98/81
Kumar, S.V., Faza, S.S., GangaRao, H.V.S., Meodad, M.A., (1995). "Fatigue Performance of Concrete Slabs with Glass Fiber Reinforced Plastic (RP) Rebars," Proceedings of Composite Institute's 50th Annual Conference and Expo, Cincinnati, OH, Jan 30- Feb 1,1995. Session 21C.
Larralde, AM. and Zerva, A., (1991). "Load/deflection Performance of FRP Grating-Concrete Composites," Proceedings of the Advanced Composite Materials in Civil Engineering Structures Specialty Conference, Las Vegas, NV, ASCE, February 1991, pp 271- 277.
Larralde, J., Renbaum, L., and Morsi, A., "Fiberglass Reinforced Plastic Rebars in Lieu of Steel Rebars," Proceedings of. Sess. Relat. Structural Materials Struct. Cong 1989, ASCE, New York, NY, pp 261-269.
Lord, H.W. and P.K Dutta, (1988). "On the design of polymeric composite structures for cold regions applications," Journal of Reinforced Plastics and Composites, September, Vol 7, pp 435- 450.
Lorenzo, L. and Hahn, H.T. (1986). "Fatigue failure mechanisms in unidirectional composites," Composite Materials - Fatigue and Fracture, ASTM STP 907, p 210.
Ma, G. (1993). "Bridge Column Retrofit with CF-Reinforced Materials," Proceedings of High Performance Composites for Civil Engineering Applications, SAMPE Regional Seminar, September 27-28,1993.
MacGregor, J.G. (1991) Reinforced Concrete: Mechanics and Design, 2nd Edition, Prentice Hall, Englewood Cliffs, NJ.
Mallick, P.K. Fiber Reinforced Composites, Marcel Dekker, Inc. New York, pp 215-248.
Marshall, O. (February 1998), Fiber-Reinforced Polymer Composite Materials Systems to Enhance Concrete Structures, USACERL Technical Report 98/47.
McDonnell Douglas Astronautics Company (1975) : Isogrid Design Handbook, September 1975.
McDonnel Douglas Astronautics Company, (1981). Special Space Programs Group. "Everything You Always Wanted lb Know About Isogrid But Were Afraid To Ask," West Huntington Beach, CA, June 1981.
Meier.U., and Kaiser.H., (1991). "Strengthening of Structures with CFRP Laminates," Advanced Composites Materials in Civil Engineering Structures, ed. S. L.Iyer, and R.Sen, ASCE, pp 224-232.
Meyer, R.R. (1973), McDonnell Douglas Astronautics Company, Isogrid Design Handbook, NASA contractor Report, CR -124075, Revision A.
Monaghan, M.R. and L.C. Brinson, (1994). "Analysis of variable stress history on polymeric composite materials with physical aging," Composites Engineering .
Mosallam, AS., and Bank, L.C, (1991). "Creep and Recovery of Pultruded FRP Frame," Proceedings of ASCE Advanced Composite Materials in Civil Engineering Structures,. S.L.Iyer, and R.Sen, eds., Las Vegas, NV, pp 24-35.
USACERLTR-98/81 91
Mosallam, AS., and Chambers, R.E., (1995). "Design Procedure for Predicting Creep and Recovery of Pultruded Composites," Proceedings of 50th Annual Conference, Composites Institute, The Society of Plastic Industry, pp 6C/1-13.
Piggott, M.R., (1981). "A theoretical Framework for the Compressive Properties of Aligned Fiber Composites," Journal of Material Science, Vol 16, pp 2837-2845.
Priestley, M.J.N. and Seible, F., (1991). "Design of Retrofit Measures for Concrete Bridges in Seismic Assessment and Retrofit of Bridges," University of California, San Diego, Structural Systems Research Project Report. No. 55RP91/03, pp 197-250.
Priestly, M.J.N., Seible, F., and Fyfe, E., (1992). "Column Seismic Retrofit using Glass FRP epoxy Jackets", Proceedings of the 1st International Conference on Advanced Composite Materials in Bridges and Structures, Canadian Society for Civil Engineering, pp 287-298.
Rosen, B.W., (1965). "Mechanics of Composite Strengthening," Fiber Composite Materials, American Society of Metals, pp 37-75.
Schmeckpeper, E.R. and Goodspeed C.H., (1994). "Fiber-Reinforced Plastic Grid for Reinforced Concrete Construction," Journal of Composite Materials, Vol 28, No. 14,1994, pp 1288-1304.
Shahawy, MA, Arockiasamy, M., Beitelman, T., Sowrirajan, R., (1996). "Reinforced Concrete Rectangular Beams Strengthened with CFRP Laminates," Composites: Part B, Elsevier Science Limited, Great Britain, 1996, pp. 225-233.
Shahawy, M., (1995). "Current Areas of FRP Research in Florida," Fiber Reinforced Plastics Workshop, Office of Technology Applications, FHWA, January 1995.
Slattery, K.T., (1994). "Mechanistic Model of Creep-Rupture Process in Filamentary Composites," Proceedings of the 3* Materials Engineering Conference, ASCE, Infrastructure, New Materials and Methods of Repair, ed. KD.Basham, San Diego, CA, pp 215-222.
Smart C.W. (1996). Flexural Characteristics of Concrete Reinforced with Bi-directional Advanced Composite Orthogrids, MS Thesis, Brigham Young University, Provo, UT.
Sugita, M., Nakatsuji, T., Sekijima, K, and Fujisaki, T, "Applications of FRP Grid Reinforcement to Precast Concrete Panels," Advanced Composite Materials in Bridges and Structures,. Canadian Society for Civil Engineering, 1992.
Sugita, M., "NEFMAC grid type reinforcement," Alternative Materials for Concrete Reinforcement, Blackie Academic, NY, 1993, pp 55-69.
Sugita, M., (1993). NEFMAC - Grid Type Reinforcement, Concrete Structures: Properties and Application, ed. A Nanni, Elsevier Publishers, B.V., pp 355-381.
Taerue, L.R., (1993). "FRP Developments and Applications in Europe," Fiber-Reinforced Plastic (FRP) Reinforcement for Concrete Structures: Properties and Applications, Elsevier Science Publishers B.V., pp 99-113.
92 USACERL TR 98/81
Triantafillou, T.C. and Plevris, N. (1991). Post strengthening of R/C Beams with Epoxy-bonded Fiber Composite Materials, Advanced Composites Materials in Civil Engineering Structures, ed. S. L.Iyer, and R.Sen, ASCE, pp 245-256.
Tsai, S. W., Theory of Composites Design, Think Composites, Palo Alto, CA, 1992.
Tsai, S.W. (1992). Theory of Composites Design, Think Composites, Dayton, OH, 1992.
Tsai, S.W. and Chen, H.J., (1995). "Composite Grid/Frame Structures," Proceedings of the Tenth International Conference on Composite Materials, Whistler, British Columbia, Canada, August 13-18.
Tunik, AL. and Tomashevskii, V.T. (1974). Mekhanika Polimerov, Vol 7, p 893.
Ueng, C.S. (1991). "The Elastic Stability of the Laminated Composite Columns," Proceedings of ASCE Mechanics, Computing in 1960's and Beyond, ed. H.Adeli, and R.L.Sierakowski, pp 971- 974.
Vinogradov, AM. (1989). "Long-term Buckling of Composite Columns," Proceedings of ASCE Structures Congress, San Francisco, pp 536-545.
Weidmann, G.W. and Ogorkiewicz, R.M. (1974). Composites, Vol 5, p 117.
Wu, W.P., GangaRao, H., and Prucz, J.C. (1990). "Mechanical Properties of Fiber Reinforced Plastic Bars," Constructed Facilities Center, College of Engineering, West Virginia University.

USACERLTR-98/81 93
Tables and Figures Cited in Report
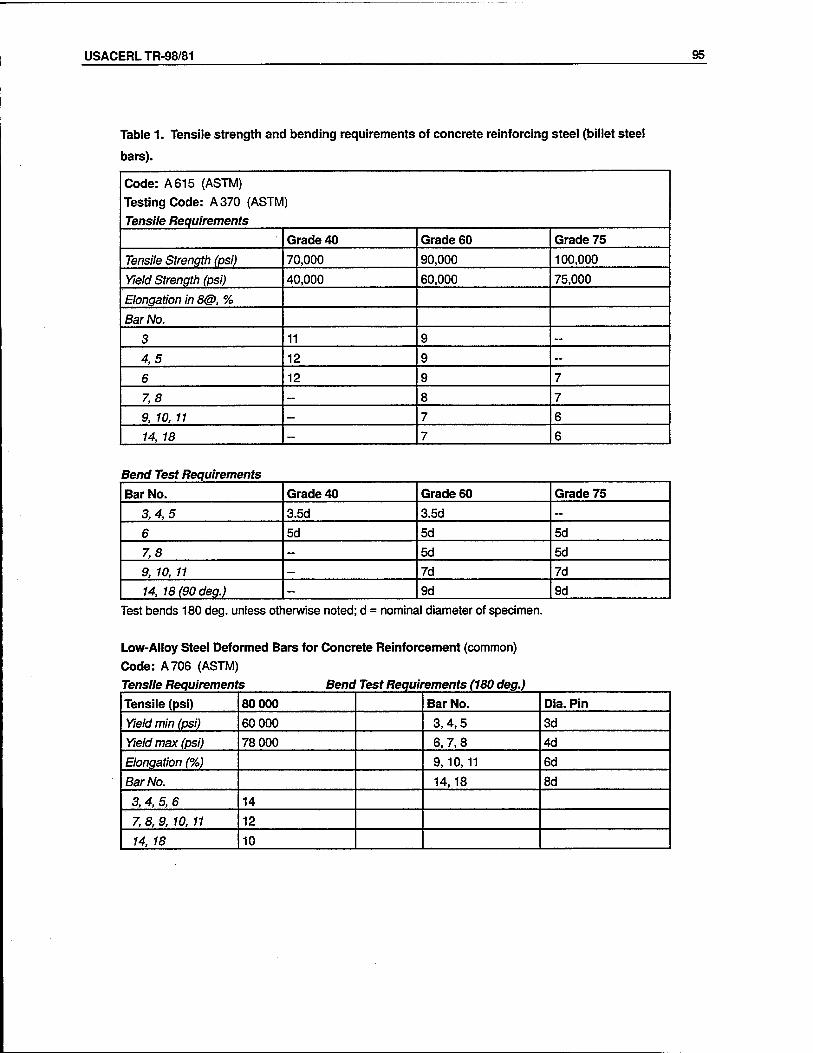
USACERLTR-98/81 95
Table 1. Tensile strength and bending requirements of concrete reinforcing steel (billet steel
bars).
Code: A 615 (ASTM)
Testing Code: A 370 (ASTM)
Tensile Requirements
Grade 40 Grade 60 Grade 75
Tensile Strength (psi) 70,000 90,000 100,000
Yield Strength (psi) 40,000 60,000 75,000
Elongation in 8@, %
Bar No.
3 11 9 —
4,5 12 9 —
6 12 9 7
7,8 — 8 7
9, 10, 11 — 7 6
14, 18 — 7 6
Bend Test Requirements
Bar No. Grade 40 Grade 60 Grade 75
3,4,5 3.5d 3.5d —
6 5d 5d 5d
7,8 ~ 5d 5d
9, 10, 11 — 7d 7d
14, 18(90deg.) - 9d 9d
Test bends 180 deg. unless otherwise noted; d = nominal diameter of specimen.
Low-Alloy Steel Deformed Bars for Concrete Reinforcement (common)
Code: A 706 (ASTM)
Tensile Requirements Bend Test Requirements (180 deg.)
Tensile (psi) 80 000 Bar No. Dia. Pin
Yield min (psi) 60 000 3,4,5 3d
Yield max (psi) 78 000 6,7,8 4d
Elongation (%) 9,10,11 6d
Bar No. 14,18 8d
3,4, 5, 6 14
7, 8, 9, 10, 11 12
14, 18 10
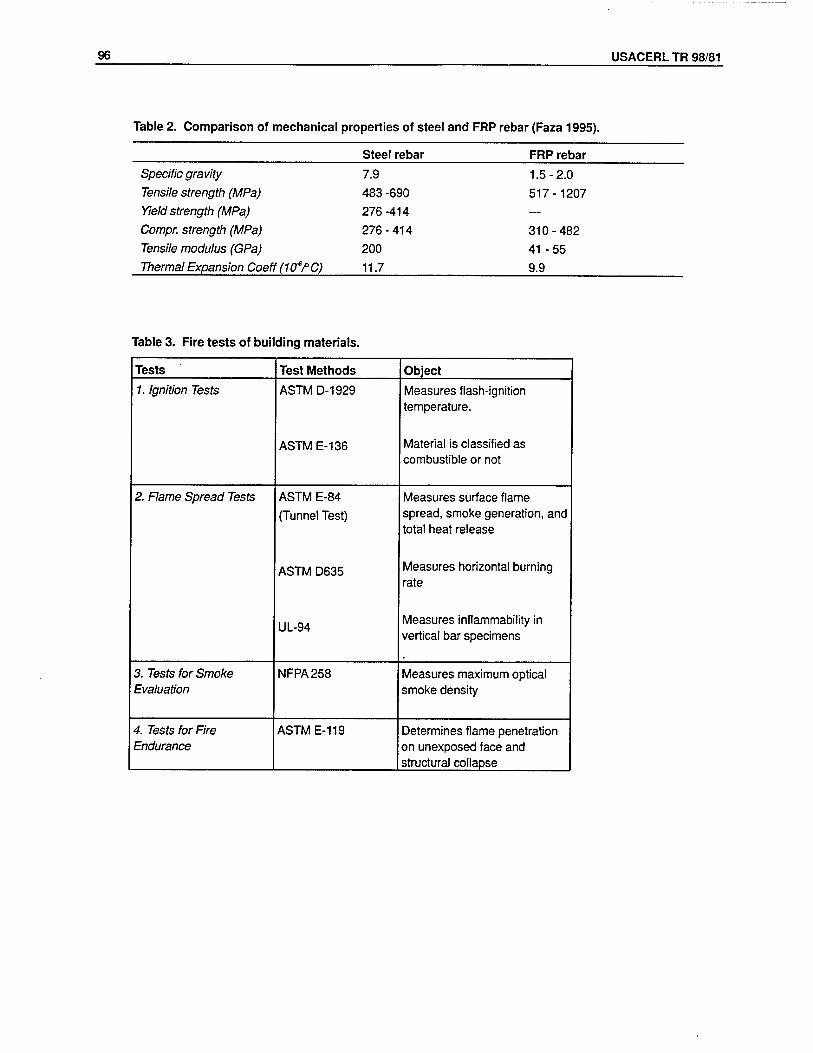
96 USACERL TR 98/81
Table 2. Comparison of mechanical properties of steel and FRP rebar (Faza 1995).
Steel rebar FRP rebar Specific gravity 7.9 Tensile strength (MPa) 483 -690 Yield strength (MPa) 276 -414 Compr. strength (MPa) 276 - 414 Tensile modulus (GPa) 200 Thermal Expansion Coeff (1(fPC) 11.7
1.5- 2.0
517 -1207
310 -482
41 - 55
9.9
Table 3. Fire tests of building materials.
Tests Test Methods Object
1. Ignition Tests ASTMD-1929
ASTM E-136
Measures flash-ignition temperature.
Material is classified as combustible or not
2. Flame Spread Tests ASTM E-84
(Tunnel Test)
ASTM D635
UL-94
Measures surface flame spread, smoke generation, and total heat release
Measures horizontal burning rate
Measures inflammability in vertical bar specimens
3. Tests for Smoke Evaluation
NFPA258 Measures maximum optical smoke density
4. Tests for Fire Endurance
ASTM E-119 Determines flame penetration on unexposed face and structural collapse
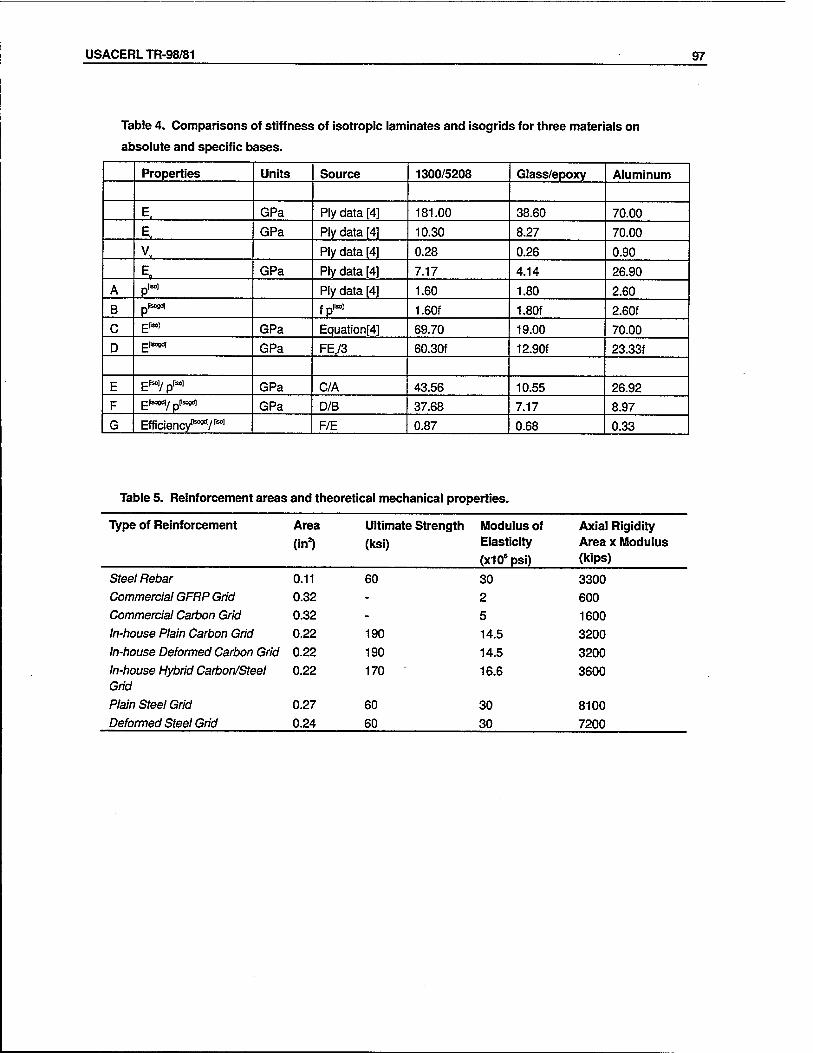
USACERLTR-98/81 97
Table 4. Comparisons of stiffness of isotropic laminates and isogrids for three materials on
absolute and specific bases.
Properties Units Source 1300/5208 Glass/epoxy Aluminum
E. GPa Ply data [4] 181.00 38.60 70.00
E. GPa Ply data [4] 10.30 8.27 70.00
v. Ply data [4] 0.28 0.26 0.90
E- GPa Ply data [4] 7.17 4.14 26.90
A pM Ply data [4] 1.60 1.80 2.60
B Drsogd] fpM 1.60f 1.80f 2.60f
C ppso] GPa Equation[4] 69.70 19.00 70.00
D pPsoodl GPa FE73 60.30f 12.90f 23.33f
E pM; -M GPa C/A 43.56 10.55 26.92
F pösostf]/ -psoadl GPa D/B 37.68 7.17 8.97
G Efficiency1*300"1/1*01 F/E 0.87 0.68 0.33
Table 5. Reinforcement areas and theoretical mechanical properties.
Type of Reinforcement Area Ultimate Strength
(in2) (ksi)
Modulus of Elasticity
(x10spsi)
Axial Rigidity Area x Modulus (kips)
Steel Rebar 0.11 60 30 3300 Commercial GFRP Grid 0.32 - 2 600
Commercial Carbon Grid 0.32 - 5 1600
ln-house Plain Carbon Grid 0.22 190 14.5 3200
ln-house Deformed Carbon Grid 0.22 190 14.5 3200
ln-house Hybrid Carbon/Steel 0.22 170 16.6 3600 Grid
Plain Steel Grid 0.27 60 30 8100
Deformed Steel Grid 0.24 60 30 7200
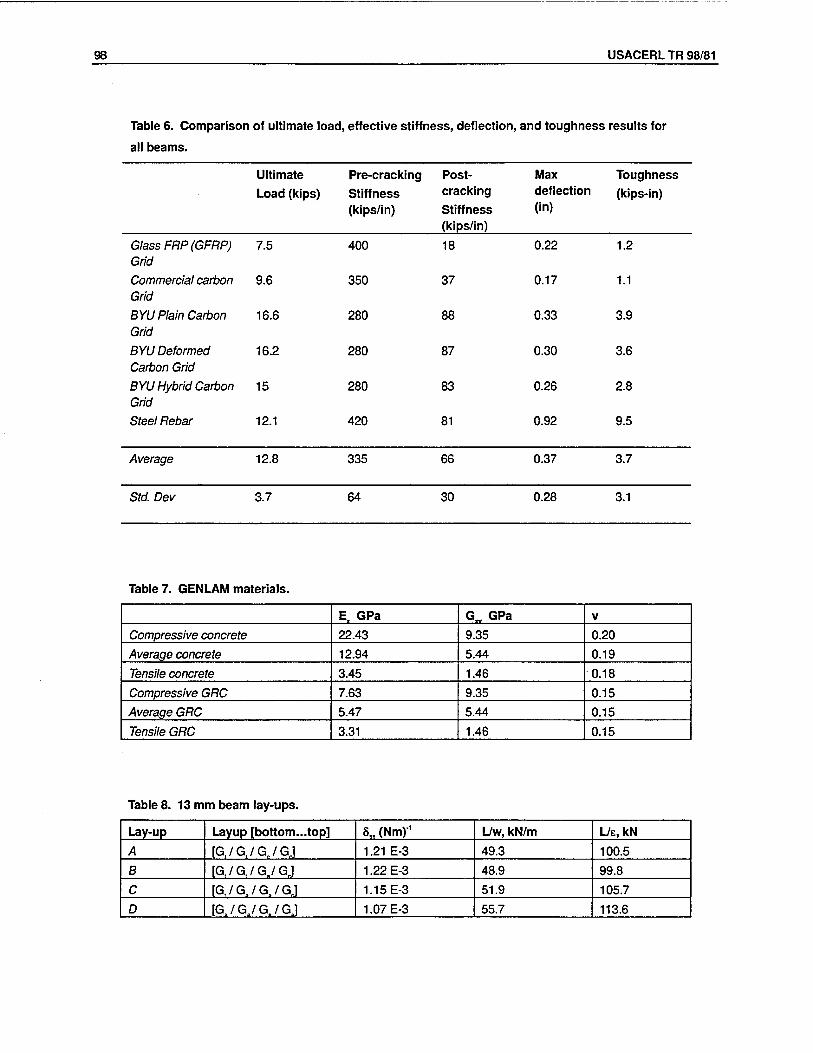
98 USACERL TR 98/81
Table 6. Comparison of ultimate load, effective stiffness, deflection, and toughness results for
all beams.
Ultimate
Load (kips)
Pre-cracking
Stiffness (kips/in)
Post- cracking
Stiffness (kips/in)
Max deflection (in)
Toughness
(kips-in)
Glass FRP (GFRP) Grid
7.5 400 18 0.22 1.2
Commercial carbon Grid
9.6 350 37 0.17 1.1
BYU Plain Carbon Grid
16.6 280 88 0.33 3.9
BYU Deformed Carbon Grid
16.2 280 87 0.30 3.6
BYU Hybrid Carbon Grid
15 280 83 0.26 2.8
Steel Rebar 12.1 420 81 0.92 9.5
Average 12.8 335 66 0.37 3.7
Std. Dev 3.7 64 30 0.28 3.1
Table 7. GENLAM materials.
E. GPa G„GPa V
Compressive concrete 22.43 9.35 0.20
Average concrete 12.94 5.44 0.19
Tensile concrete 3.45 1.46 0.18
Compressive GRC 7.63 9.35 0.15
Average GRC 5.47 5.44 0.15
Tensile GRC 3.31 1.46 0.15
Table 8. 13 mm beam lay-ups.
Lay-up Layup [bottom...top] 5„ (Nm)-1 L/w, kN/m L/e,kN
A [G,/G,/G„/GJ 1.21 E-3 49.3 100.5
B [G./G./G./GJ 1.22 E-3 48.9 99.8
C [G./G./G./GJ 1.15 E-3 51.9 105.7
D [G./G./G./GJ 1.07 E-3 55.7 113.6
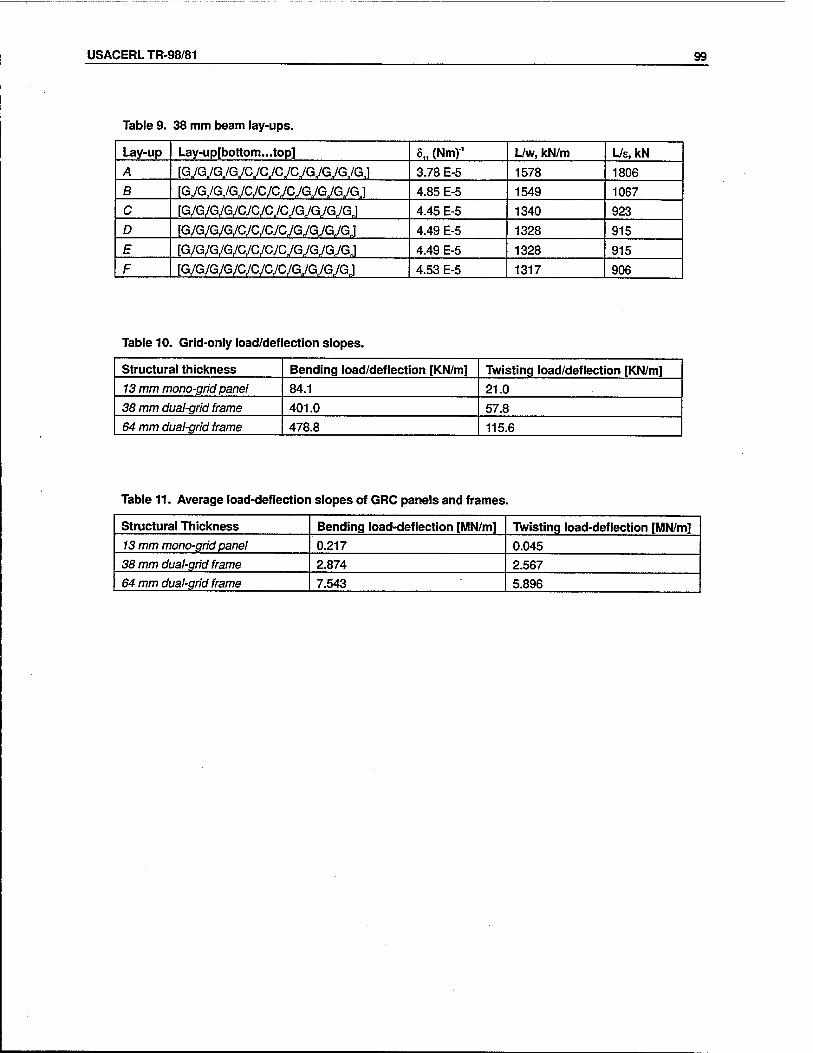
USACERLTR-98/81 99
Table 9. 38 mm beam lay-ups.
Lay-up Lay-up[bottom...top] 5„ (Nm)"1 L/w, kN/m L/s, kN A [GJGJGJGJCJCJCJCJGJGJGJGJ 3.78 E-5 1578 1806 B [GyGyGyGyc/c/cycyG,/G./G,/Gj 4.85 E-5 1549 1067 C [G/G/G/G/c/cycycyGyGyGVGj 4.45 E-5 1340 923 D [G/G/G/G/C/C/C/CyGyGyGyGJ 4.49 E-5 1328 915 E [G/G/G/G/C/C/C/CyGyGyGyGJ 4.49 E-5 1328 915 F [G/G/G/G/C/C/C/C/GyGyGyGJ 4.53 E-5 1317 906
Table 10. Grid-only load/deflection slopes.
Structural thickness Bending load/deflection [KN/m] Twisting load/deflection [KN/m] 13 mm mono-grid panel 84.1 21.0 38 mm dual-grid frame 401.0 57.8 64 mm dual-grid frame 478.8 115.6
Table 11. Average load-deflection slopes of GRC panels and frames.
Structural Thickness Bending load-deflection [MN/m] Twisting load-deflection [MN/m] 13 mm mono-grid panel 0.217 0.045 38 mm dual-grid frame 2.874 2.567 64 mm dual-grid frame 7.543 5.896
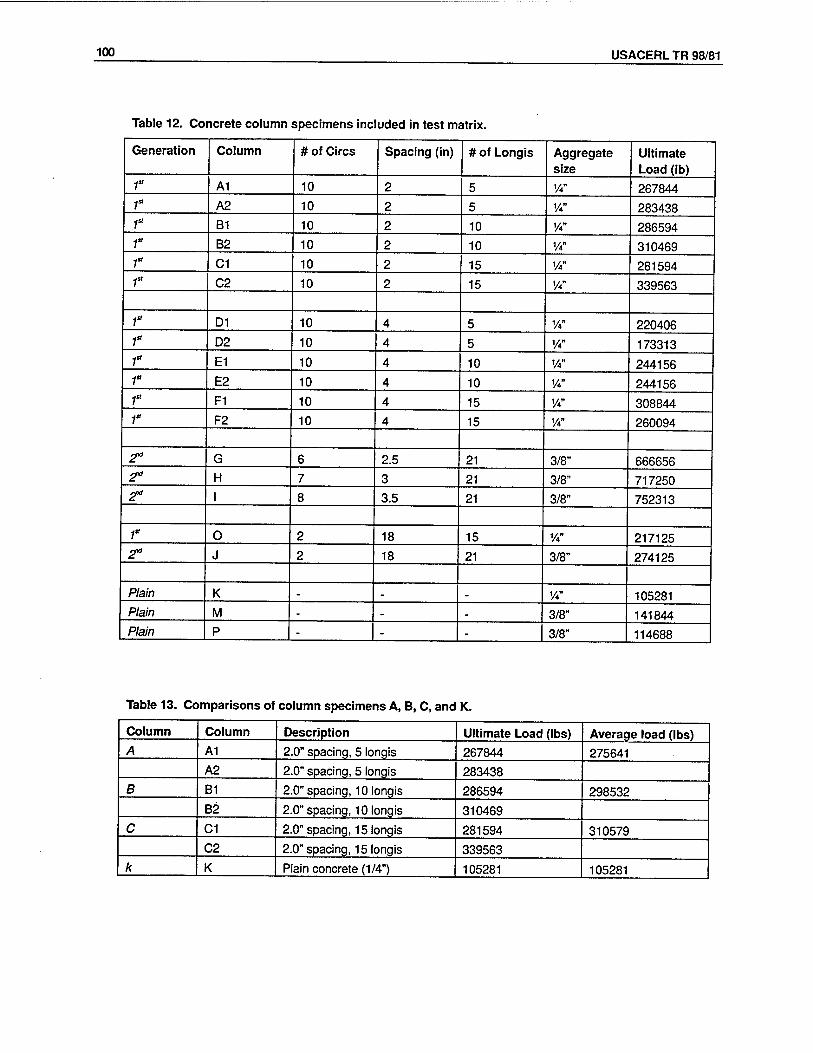
100 USACERL TR 98/81
Table 12. Concrete column specimens included in test matrix.
Generation Column # of Circs Spacing (in) # of Longis Aggregate size
Ultimate Load (lb)
1* A1 10 2 5 VA" 267844 r A2 10 2 5 VA" 283438
f B1 10 2 10 w 286594 r B2 10 2 10 vs 310469 f C1 10 2 15 VA" 281594 f C2 10 2 15 VA" 339563
f D1 10 4 5 VA" 220406 r D2 10 4 5 VA" 173313 t E1 10 4 10 VA" 244156 f E2 10 4 10 VA" 244156 1" F.1 10 4 15 VA" 308844 r F2 10 4 15 VA" 260094
2" G 6 2.5 21 3/8" 666656 2" H 7 3 21 3/8" 717250 2* I 8 3.5 21 3/8" 752313
1" 0 2 18 15 VA" 217125 2" J 2 18 21 3/8" 274125
Plain K - - - VA" 105281 Plain M - - - 3/8" 141844 Plain P - - - 3/8" 114688
Table 13. Comparisons of column specimens A, B, C, and K.
Column Column Description Ultimate Load (lbs) Average load (lbs) A A1 2.0" spacing, 5 longis 267844 275641
A2 2.0" spacing, 5 longis 283438 B B1 2.0" spacing, 10 longis 286594 298532
B2 2.0" spacing, 10 longis 310469
C C1 2.0" spacing, 15 longis 281594 310579 C2 2.0" spacing, 15 longis 339563
k K Plain concrete (1/4") 105281 105281
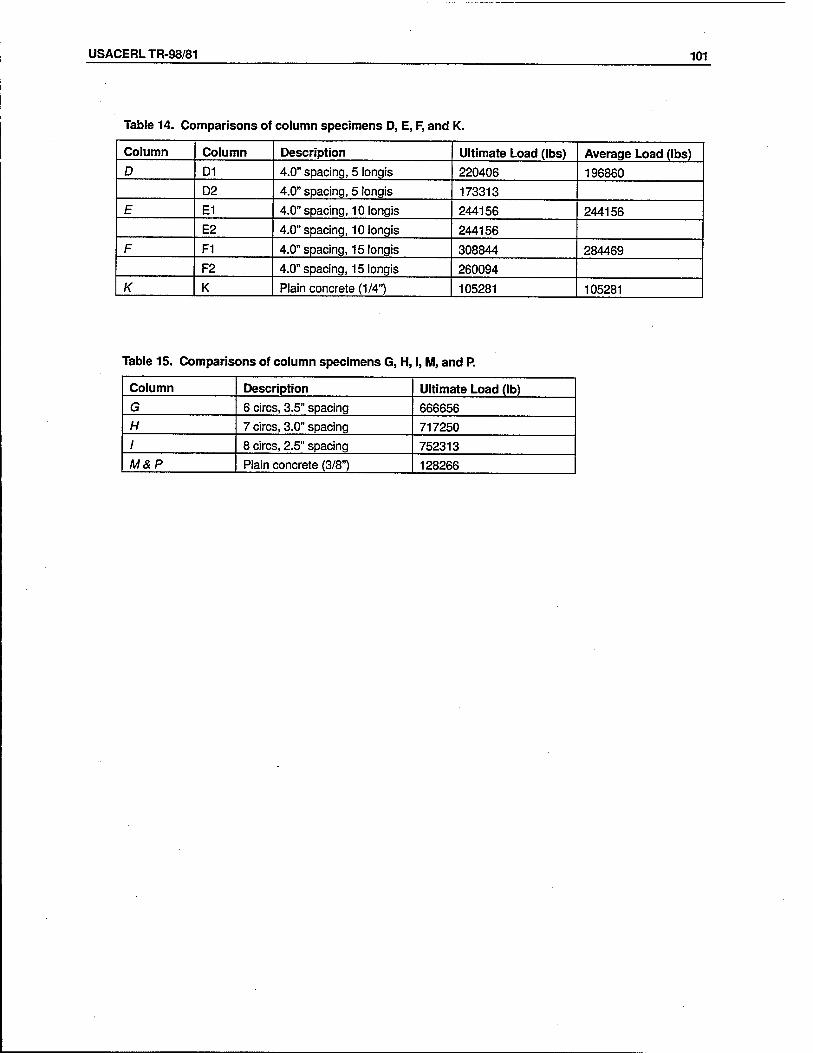
USACERLTR-98/81 101
Table 14. Comparisons of column specimens D, E, F, and K.
Column Column Description Ultimate Load (lbs) Average Load (lbs) D D1 4.0" spacing, 5 longis 220406 196860
D2 4.0" spacing, 5 longis 173313
E E1 4.0" spacing, 10 longis 244156 244156
E2 4.0" spacing, 10 longis 244156
F F1 4.0" spacing, 15 longis 308844 284469
F2 4.0" spacing, 15 longis 260094
K K Plain concrete (1/4") 105281 105281
Table 15. Comparisons of column specimens G, H, I, M, and P.
Column Description Ultimate Load (lb) G 6 circs, 3.5" spacing 666656
H 7 circs, 3.0" spacing 717250
1 8 circs, 2.5" spacing 752313
M&P Plain concrete (3/8") 128266
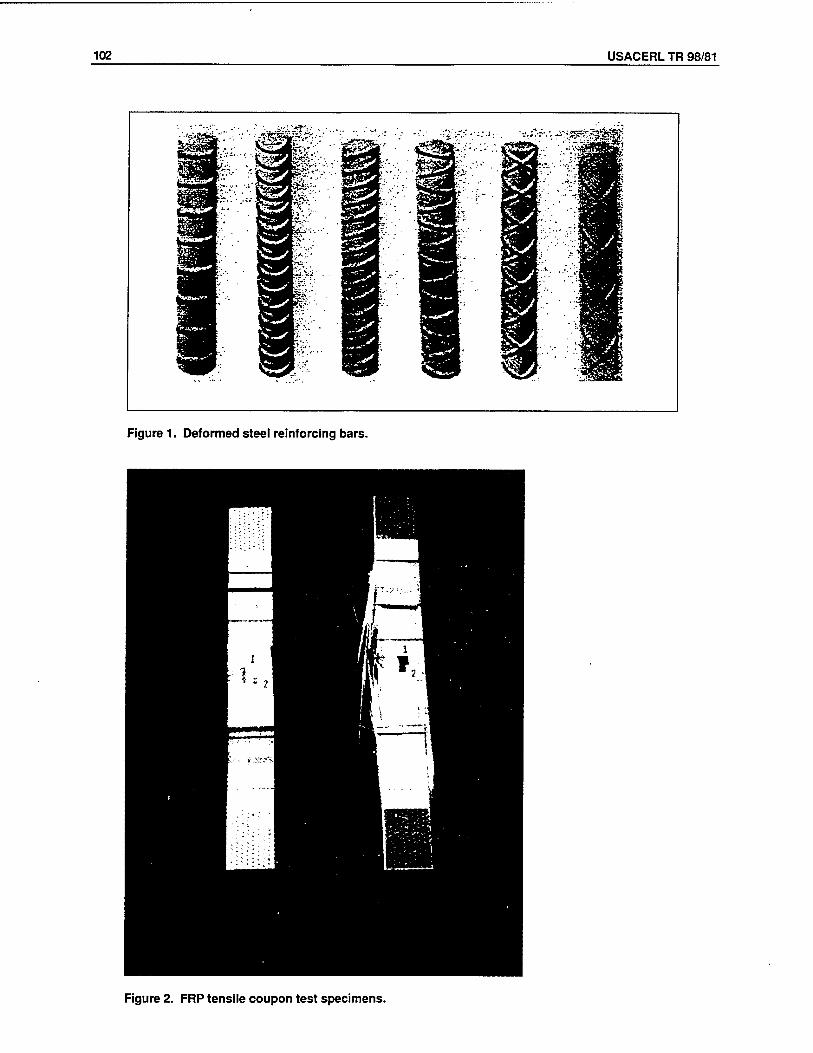
102 USACERL TR 98/81
äs*
/•^^MPii
Figure 1. Deformed steel reinforcing bars.
Figure 2. FRP tensile coupon test specimens.
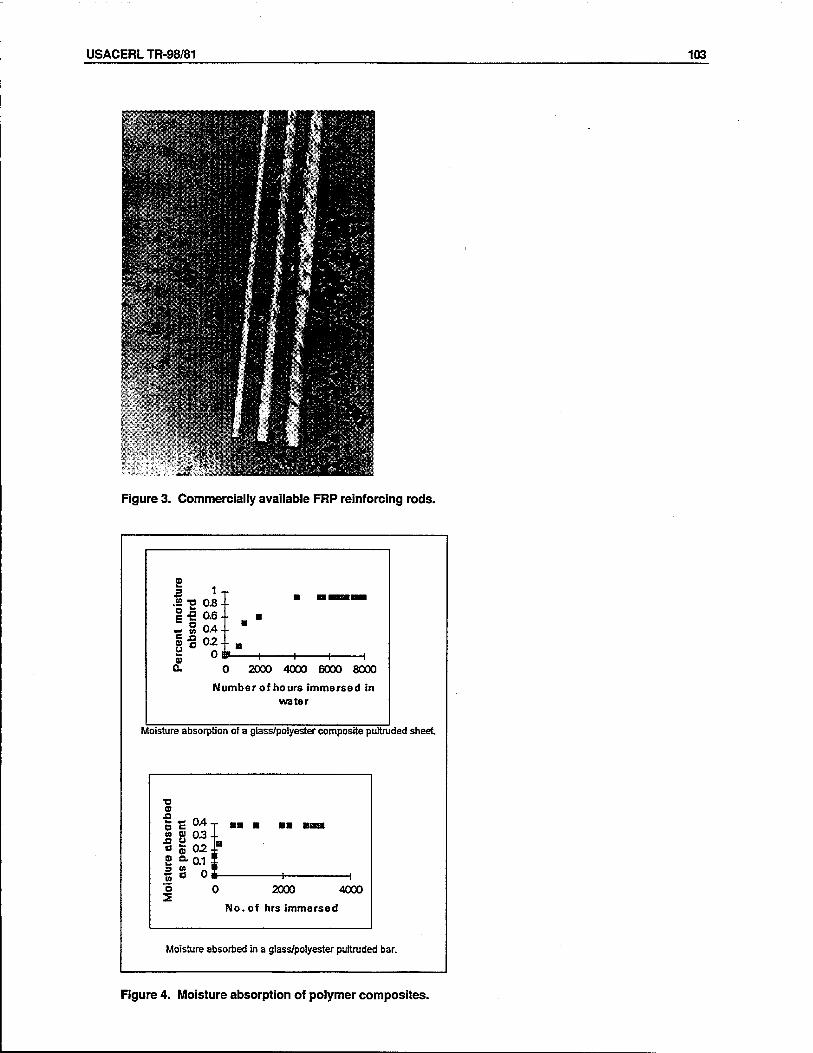
USACERLTR-98/81 103
Figure 3. Commercially available FRP reinforcing rods.
o 5 1, £ -a o&- * ^"™™ 1 -S 0.6 • • . ■ - 8 0.4 - ■
§•§ 02- a n i " ■
■ 0) - " > i i i
0. 0 2000 4000 6000 8000
Number of hours immersed in water
Moisture absorption of a glass/polyester composite pultruded sheet
"O 0)
■§ « 04 T .a ■ Bi aaa » 9 0.3 - .n o ■ ö S 0.2 J 2 a- 0.1 { i = o> _ " % ° °« o 0 2000 4000
No. of hrs immersed
Moisture absorbed in a glass/polyester pultruded bar.
Figure 4. Moisture absorption of polymer composites.
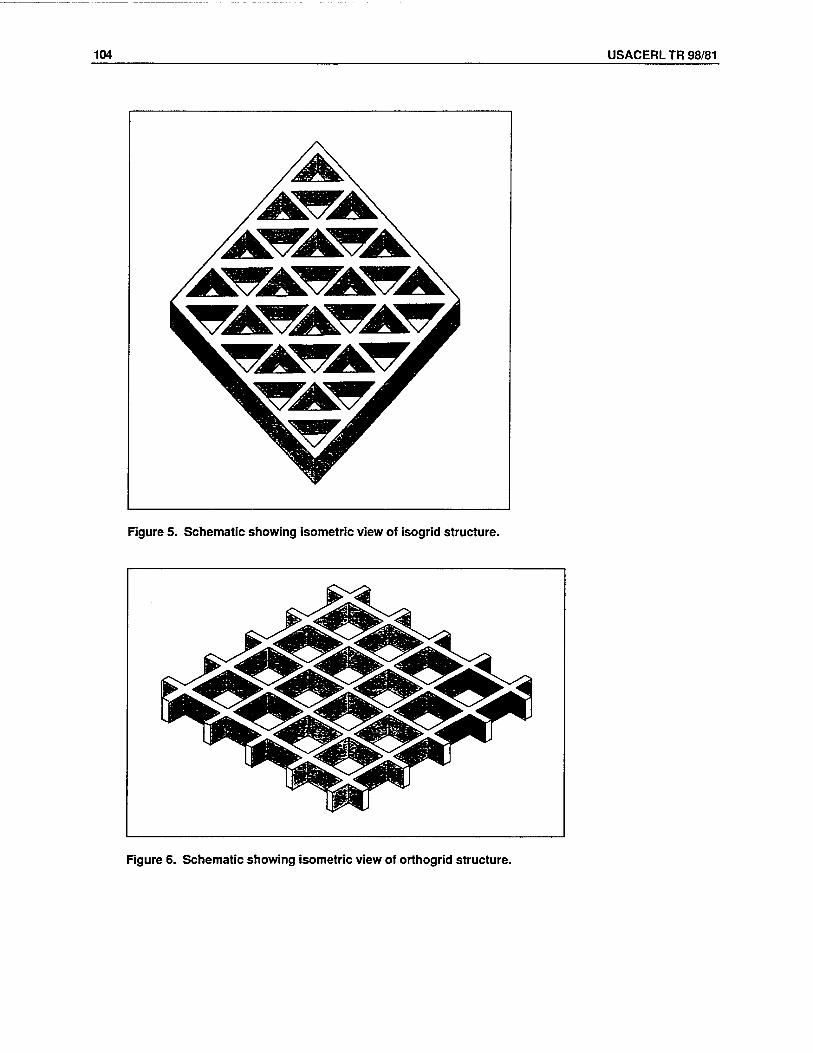
104 USACERL TR 98/81
Figure 5. Schematic showing isometric view of isogrid structure.
Figure 6. Schematic showing isometric view of orthogrid structure.
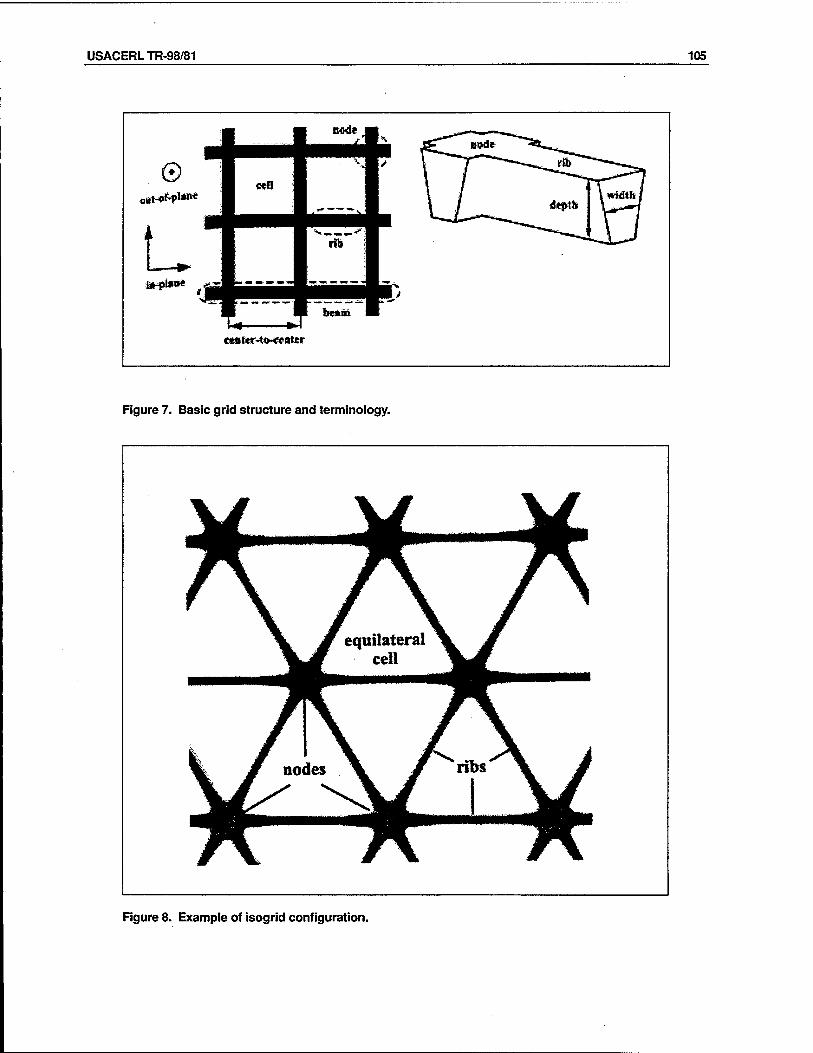
USACERLTR-98/81 105
Bad*
eeaf«r*toHWB*er
Figure 7. Basic grid structure and terminology.
Figure 8. Example of isogrid configuration.
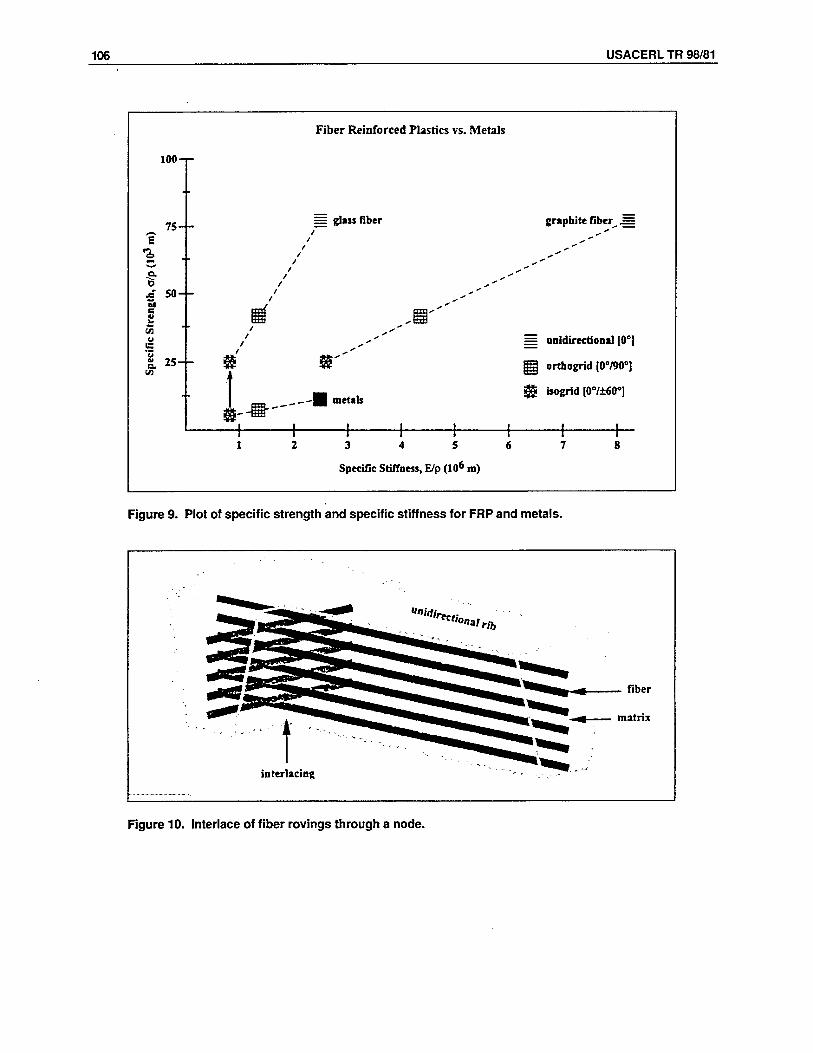
106 USACERL TR 98/81
Fiber Reinforced Plastics vs. Metals
100-
75-- E
Q. D £ 50- M e
O. 25-
glass fiber graphite fiber_ _=E
w metals
unidirectional [0°
orthogrid |0°/90°1
faogrid |0°/±60°]
H h 3 4 5
Specific Stiffness, E/p (106 m)
Figure 9. Plot of specific strength and specific stiffness for FRP and metals.
Figure 10. Interlace of fiber rovings through a node.
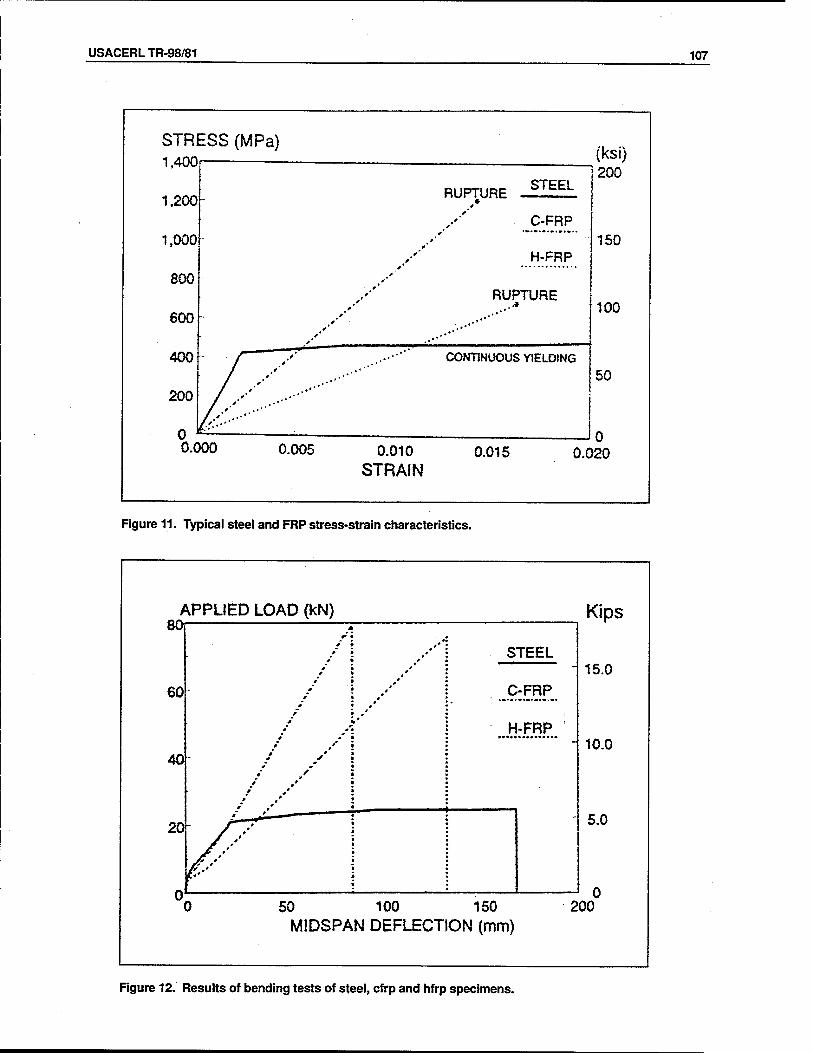
USACERLTR-98/81 107
STRESS (MPa) t Ann—, (ksi)
1 |TWW
1,200 RUPTURE ö_ L
C-FRP
200
1,000 y y
y H-FRP 150
800 ty
600
400
y y
k ty y _
f~ y
y
y 0*
RUPTURE 100
CONTINUOUS YIELDING § t* t.« ** 50
200
n
/ y .**' I ty tt- • *
/ #* * * *'
n
0.000 0.005 0.010
STRAIN 0.015 0.020
Figure 11. Typical steel and FRP stress-strain characteristics.
80s
60
40
APPLIED LOAD (kN)
STEEL
C-FRP
H-FRP
Kips
15.0
10.0
5.0
50 100 150 MIDSPAN DEFLECTION (mm)
200
Figure 12. Results of bending tests of steel, cfrp and hfrp specimens.
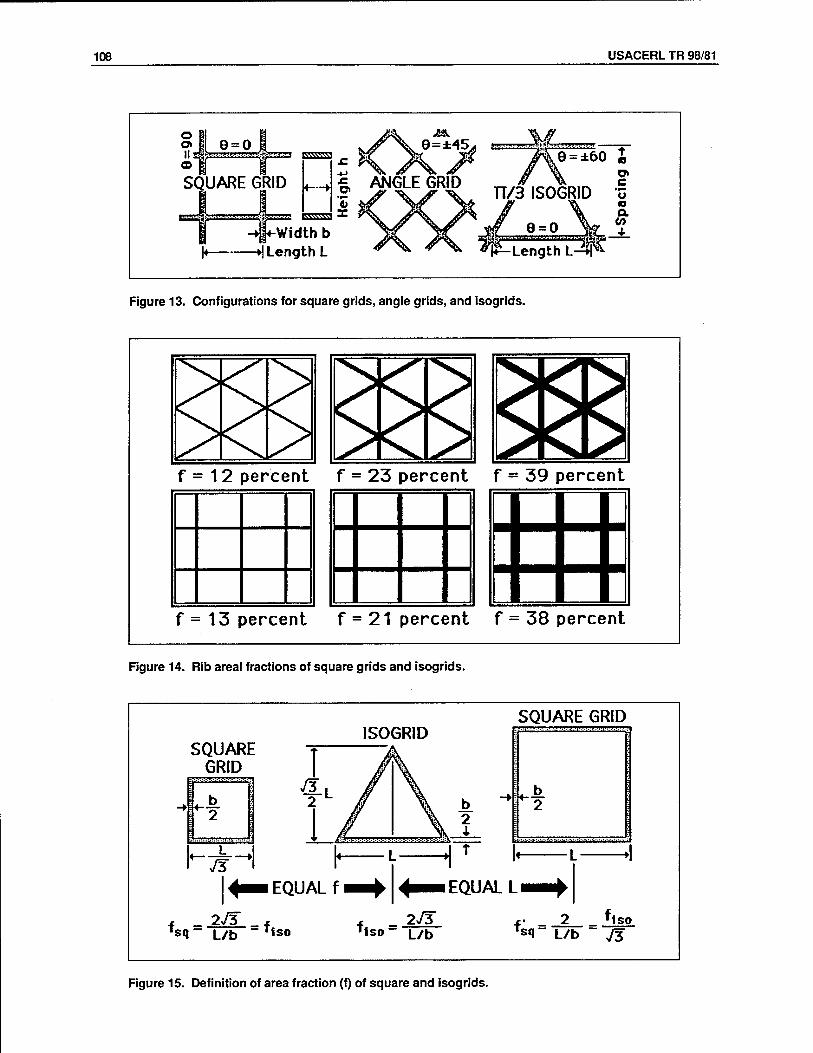
108 USACERL TR 98/81
B.W.WJ e=±6o £
*/y\ TT/3#lS0°R,D I width b Y V j£^JLzlJj®L JL
»WWvVl
*| Length L ^-Length L-4f
Figure 13. Configurations for square grids, angle grids, and isogrids.
f = = 12 percent f = = 23 percent f = : 39 percent
f= 13 percent f = 21 percent f = 38 percent
Figure 14. Rib areal fractions of square grids and isogrids.
SQUARE GRID
ISOGRID SQUARE GRID
»yr-?-"—■■■■"?' ' '■"'**
b. 2
.:■>:■;.!-.■:■;.=■•-.;■% ;-?.:.;.r,:
i EQUALL
'ISO 'sq L/b Iso- L/b fsq~ L/b ~ 73
Figure 15. Definition of area fraction (f) of square and isogrids.
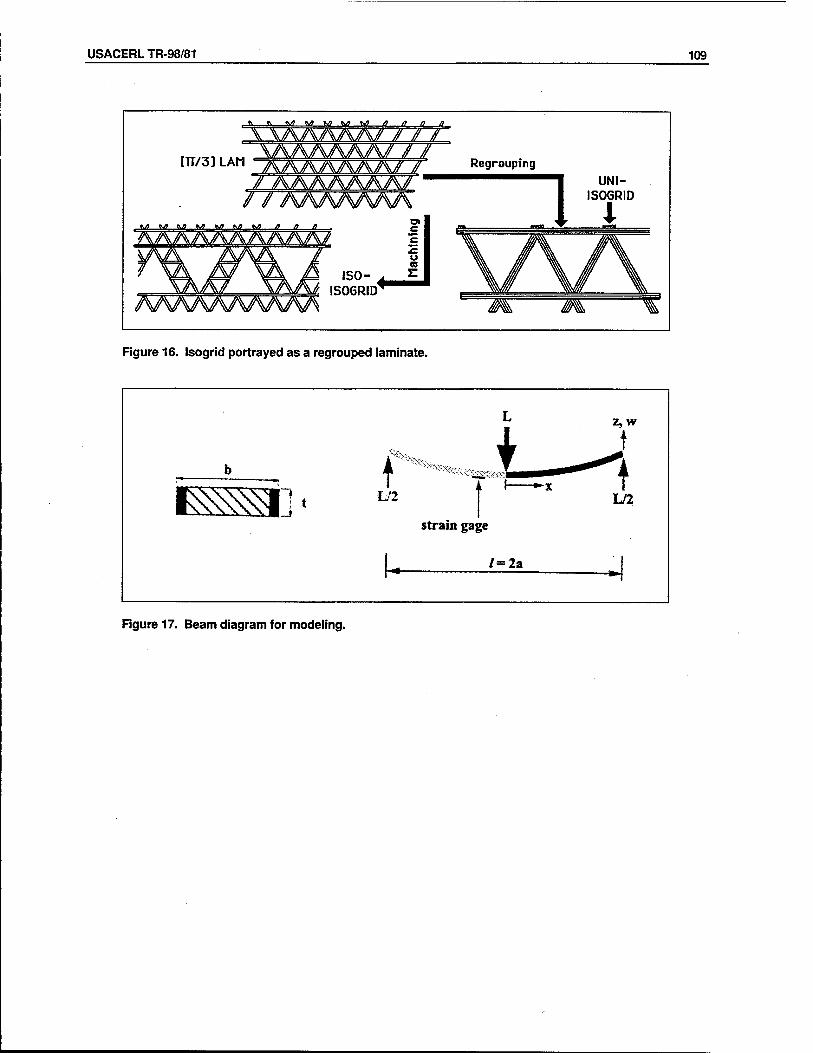
USACERLTR-98/81 109
\\AAAAA//// ITT/3]LAM ~if Regrouping
/ / AAAAAAA tji *ji *./> M M, f^., M /> /i n
ISO- i ISO6RID"
c c u CB
Figure 16. Isogrid portrayed as a regrouped laminate.
Figure 17. Beam diagram for modeling.
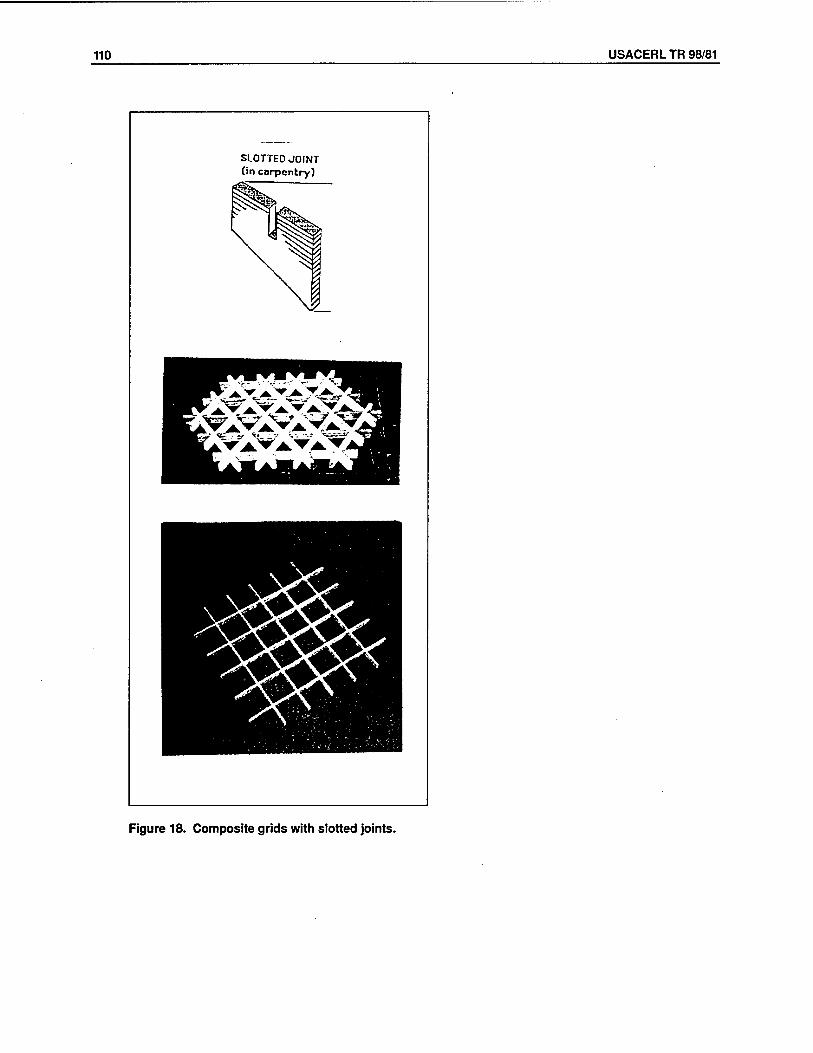
110 USACERL TR 98/81
SLOTTED JOINT fin carpentry)
Figure 18. Composite grids with slotted joints.
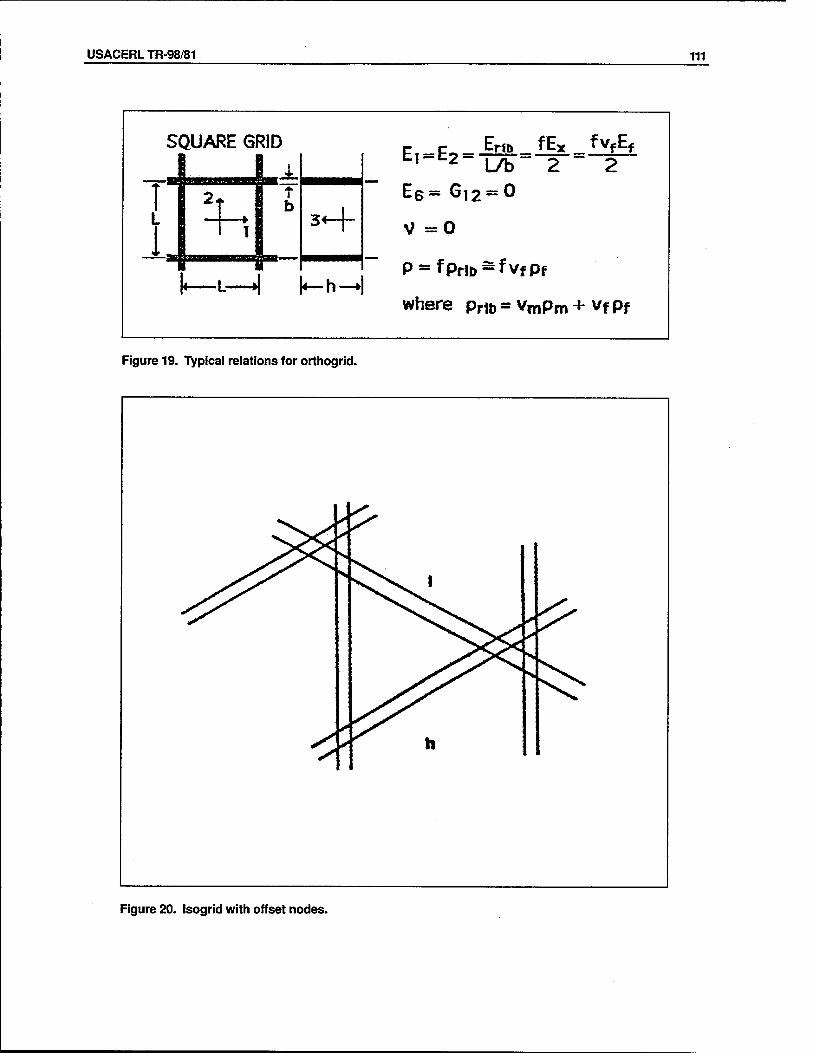
USACERLTR-98/81 111
SQUARE GRID
If""1^"1" 1™"^^^""'^! I^r^^^* I f '
-rift fEx ^VfEf Ei-E2- {Jb- 2 2
E6= 612 = 0
V =0
P^fPrlD-fvfPf
where pr1b = vmpm + vf pf
Figure 19. Typical relations for orthogrid.
»sT^s^^ *
' h
Figure 20. isogrid with offset nodes.
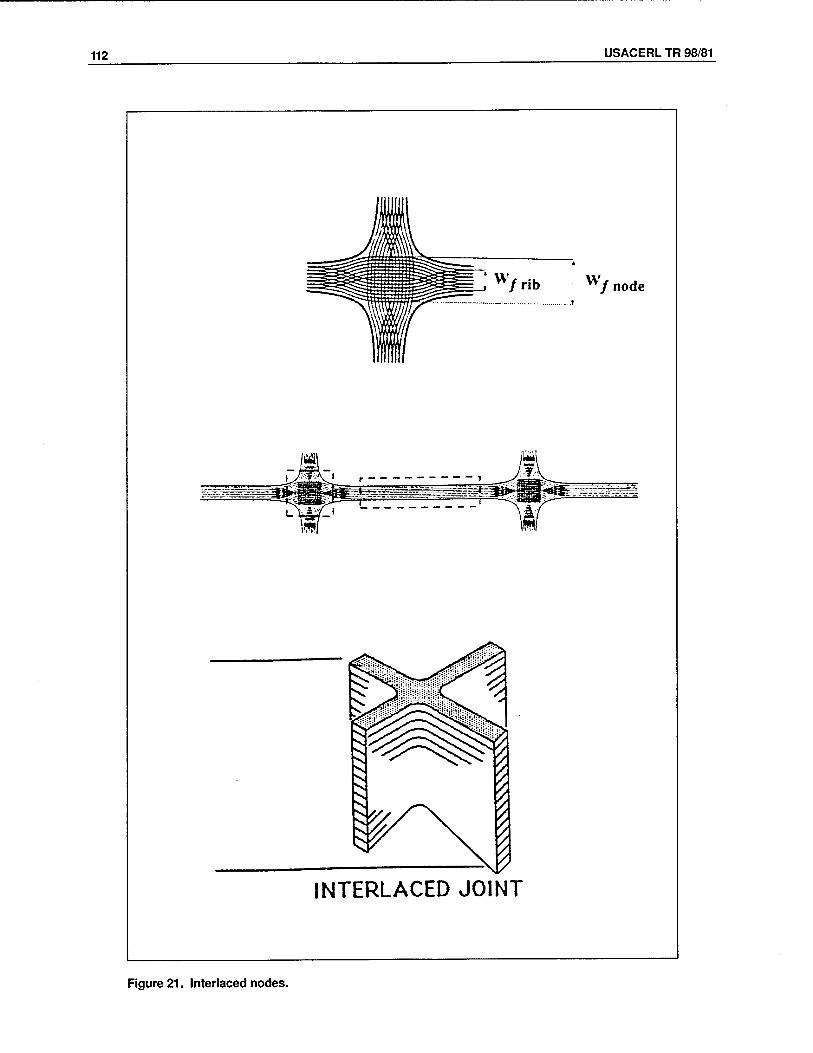
112 USACERL TR 98/81
Figure 21. Interlaced nodes.
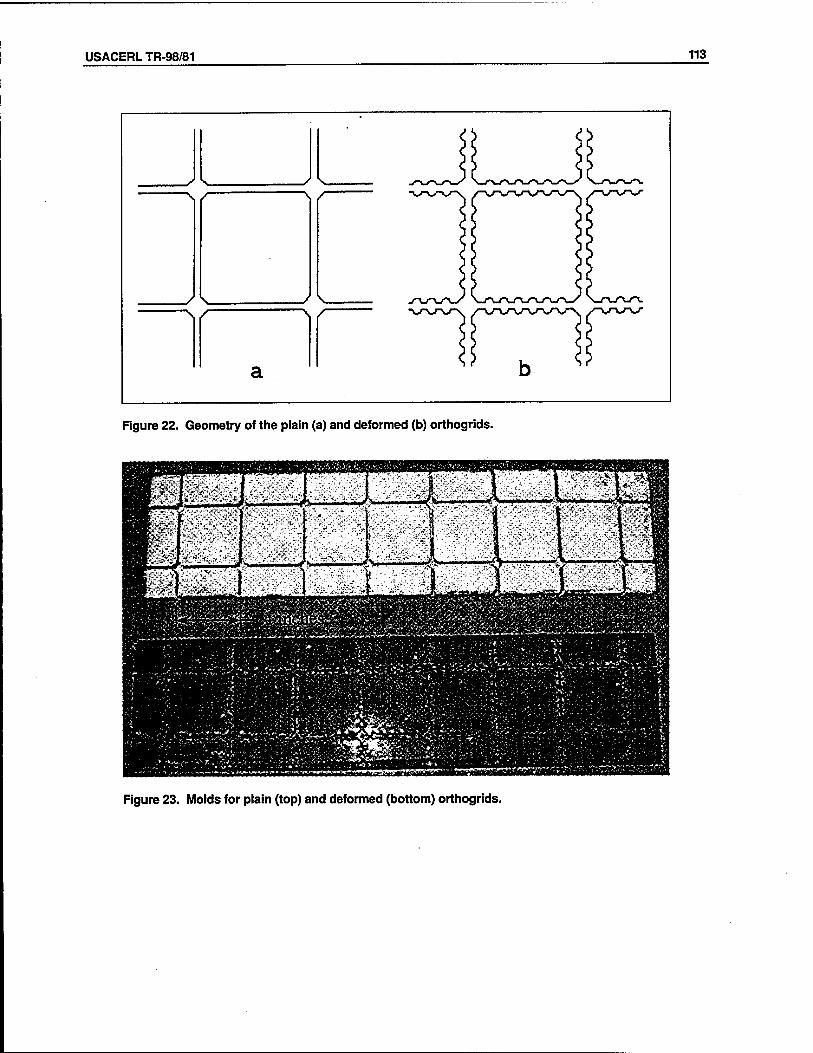
USACERLTR-98/81 113
O <>
s k. s k ~. irnr 1 / \ r
/ N. / k « V / \ y 'v
a \\ b 8
Figure 22. Geometry of the plain (a) and deformed (b) orthogrids.
Figure 23. Molds for plain (top) and deformed (bottom) orthogrids.
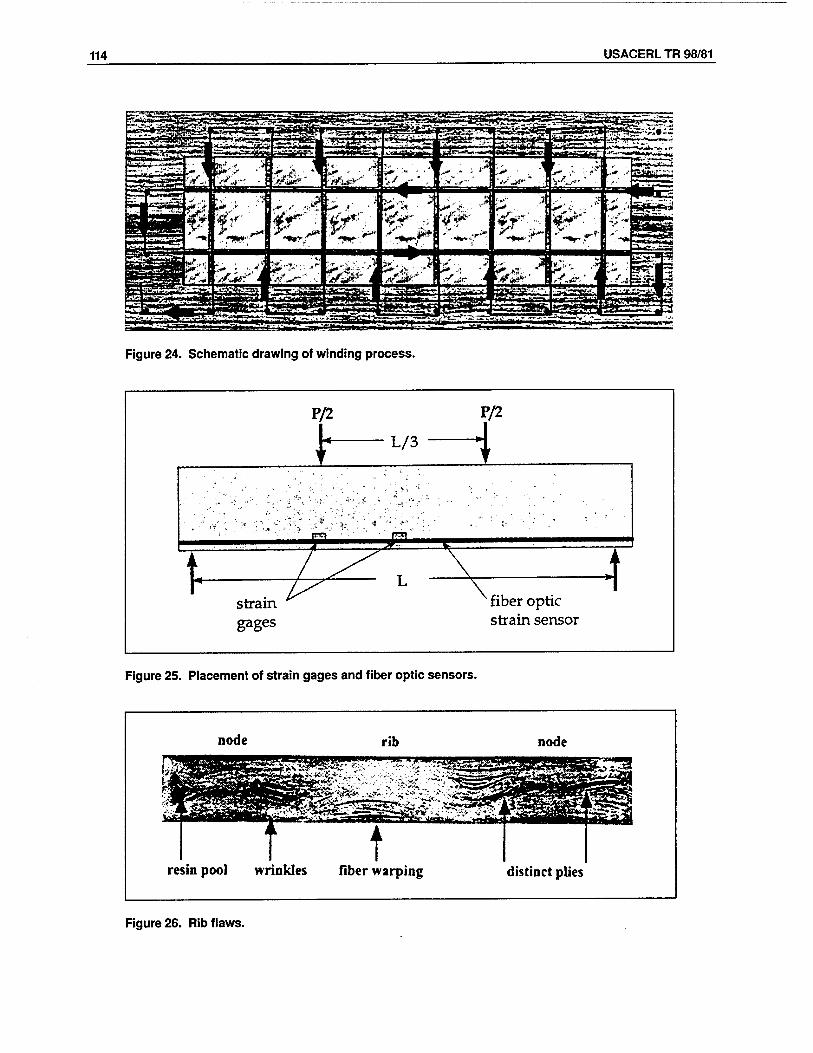
114 USACERL TR 98/81
!•"■ iiQun. i'J- •■M1 — -a»^«i
Figure 24. Schematic drawing of winding process.
P/2
L/3
P/2
i
I 73 ■^SL
strain gages
- L 1 fiber optic strain sensor
4
Figure 25. Placement of strain gages and fiber optic sensors.
node rib node
resin pool wrinkles fiber warping distinct plies
Figure 26. Rib flaws.
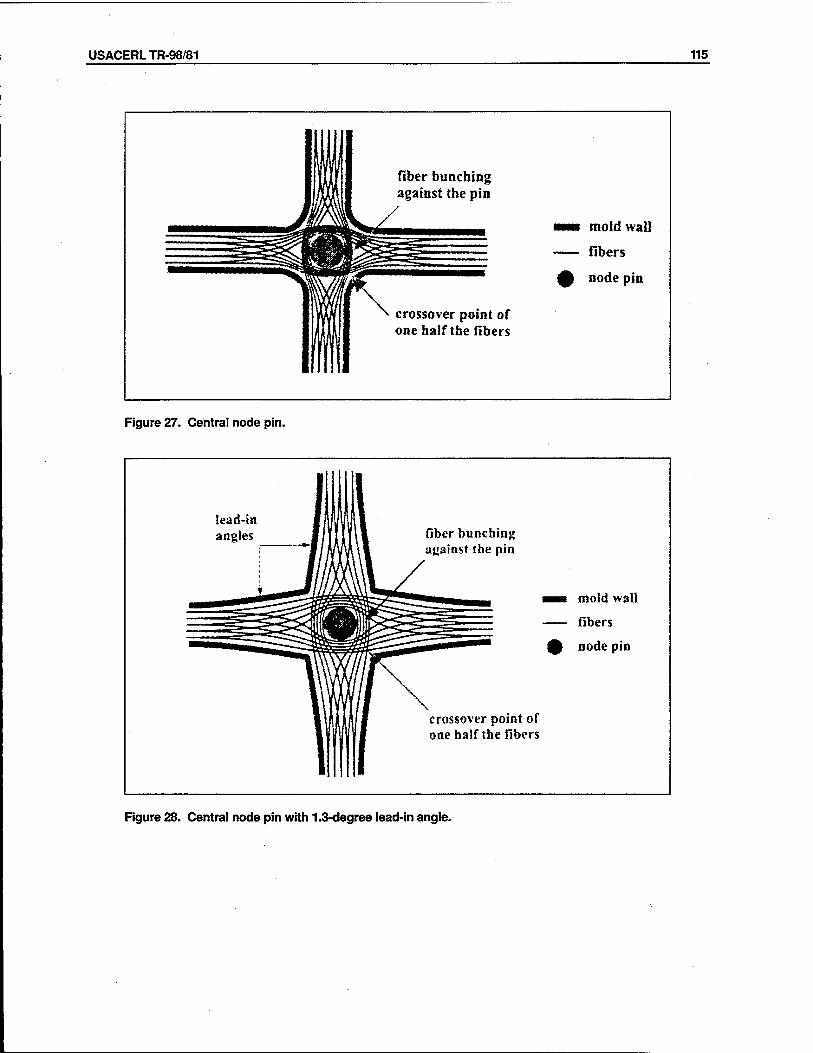
USACERLTR-98/81 115
fiber bunching against the pin
crossover point of one half the fibers
moid wall
fibers
node pin
Figure 27. Central node pin.
lead-in angles fiber bunching
against the pin
moid wall
fibers
node pin
crossover point of one half the fibers
Figure 28. Central node pin with 1.3-degree lead-in angle.
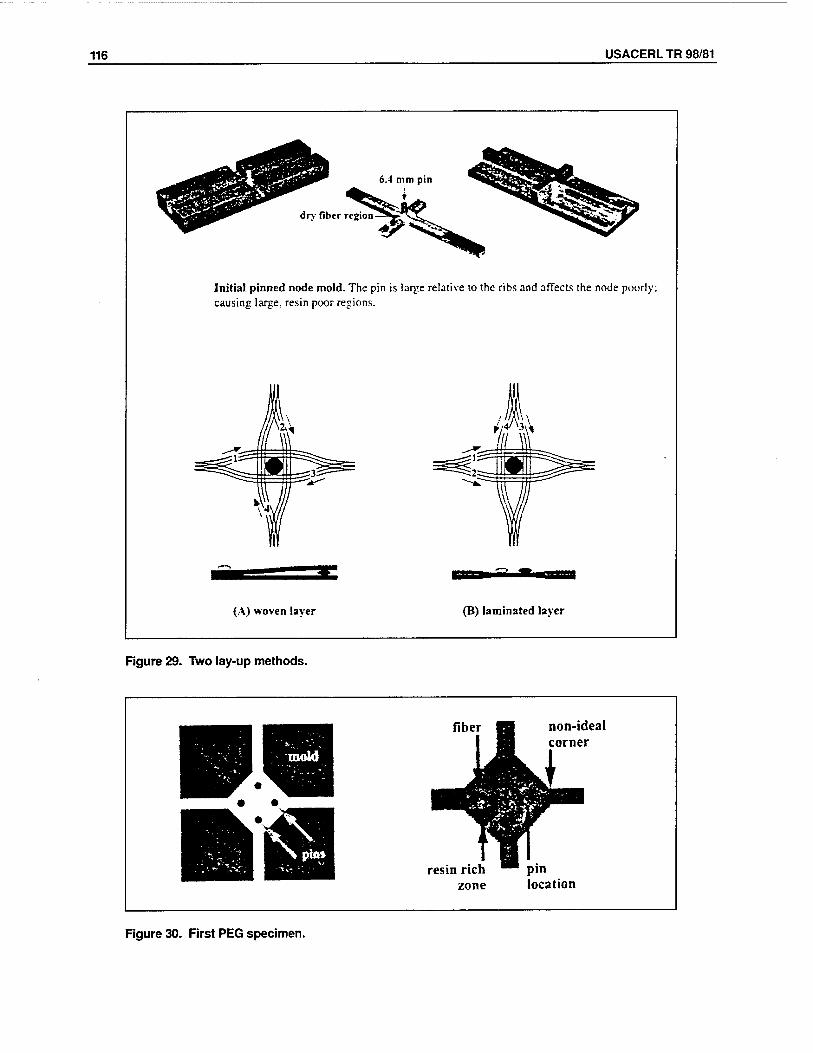
116 USACERL TR 98/81
Initial pinned node mold. The pin is large relative to the ribs and affects the node poorly: causing large, resin poor regions.
(A) woven layer (B) laminated layer
Figure 29. Two lay-up methods.
resin rich zone
non-ideal corner
pin location
Figure 30. First PEG specimen.
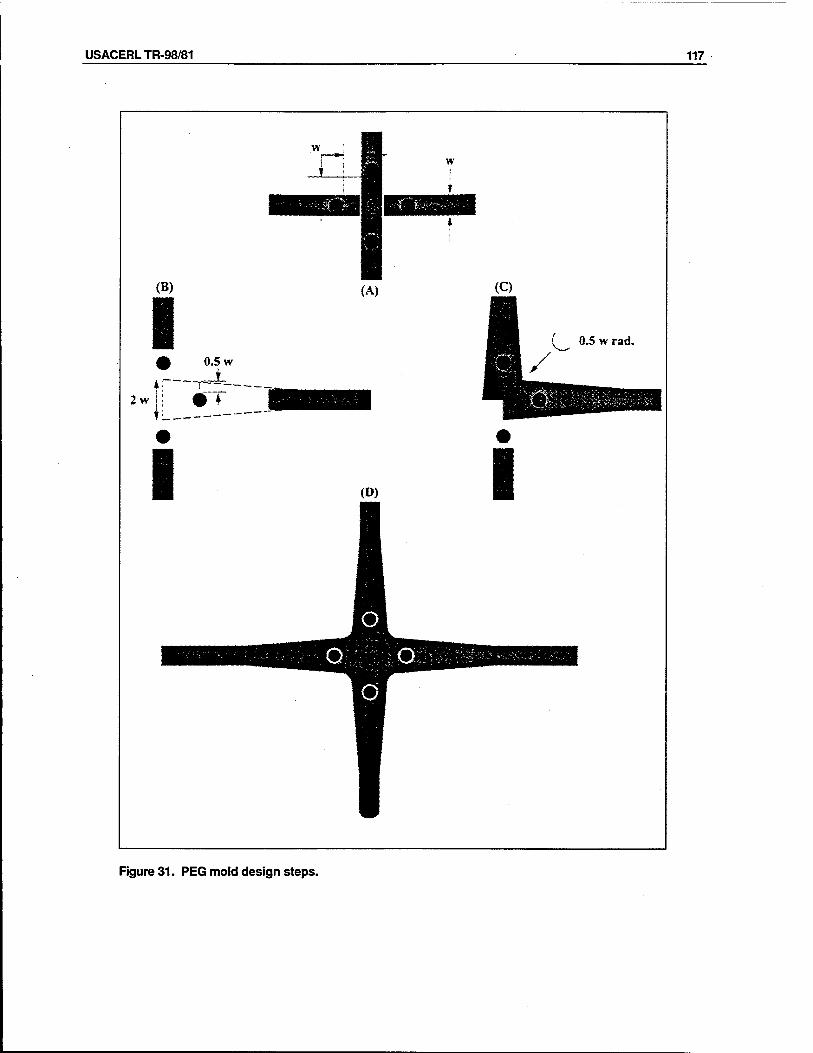
USACERLTR-98/81 117
Figure 31. PEG mold design steps.
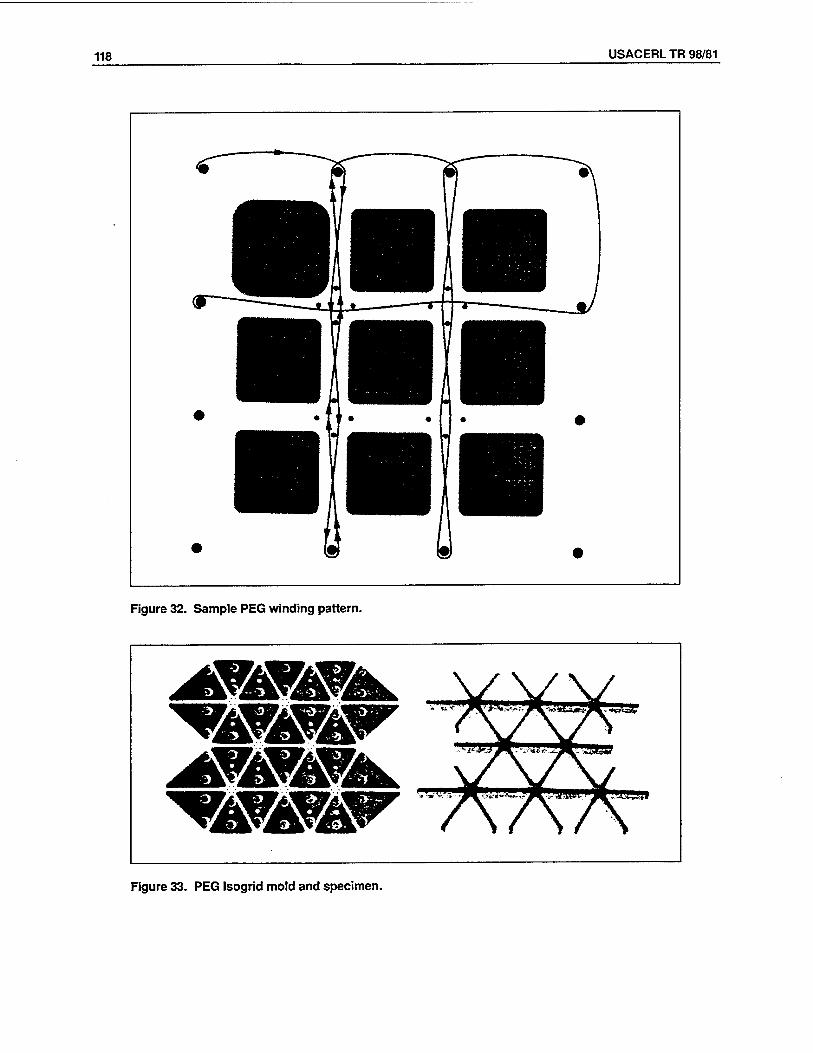
118 USACERL TR 98/81
Figure 32. Sample PEG winding pattern.
^SWflfyrafpSjgg^
Figure 33. PEG Isogrid mold and specimen.
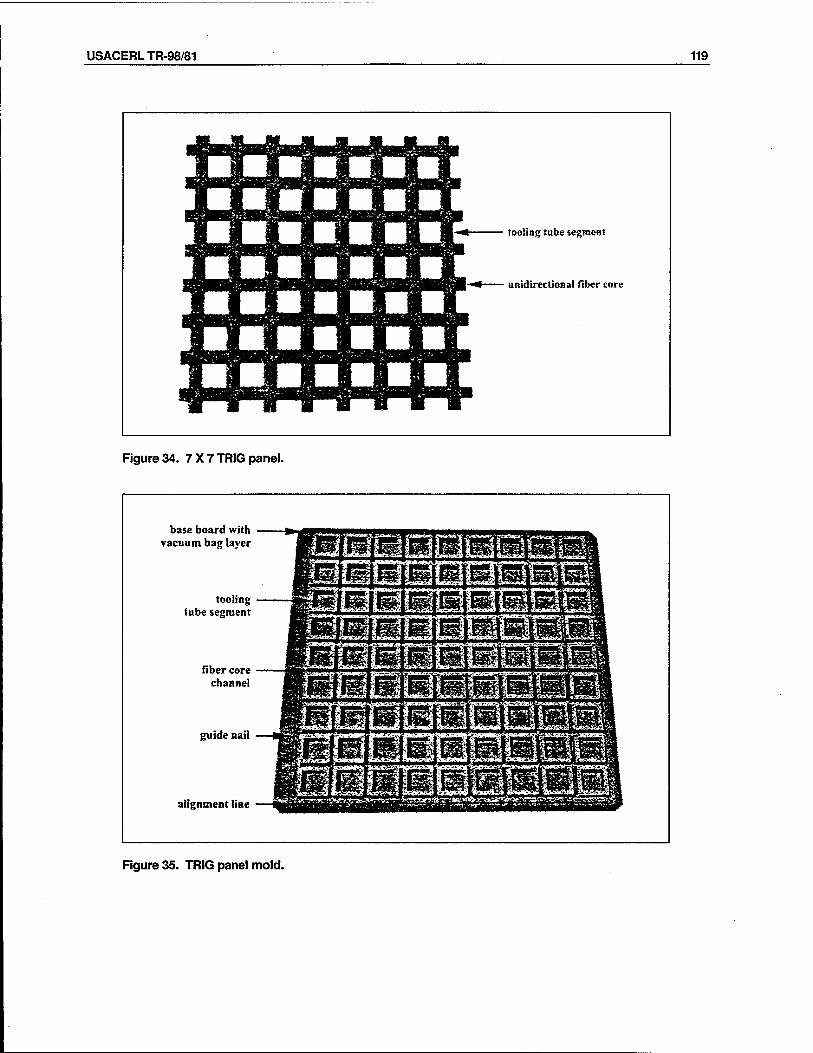
USACERLTR-98/81 119
tooling tube segment
unidirectional fiber core
Figure 34. 7 X 7 TRIG panel.
base board with vacuum bag layer
tooling tube segment
fiber core channel
guide nail
alignment line
Figure 35. TRIG panel mold.
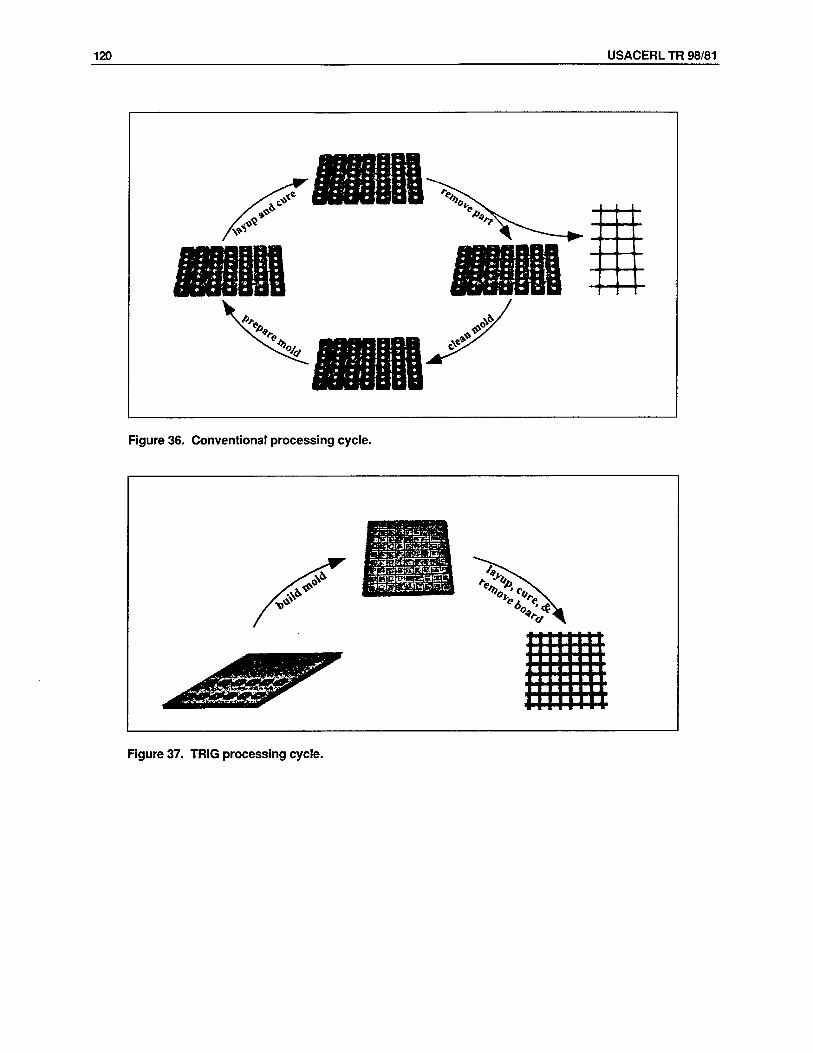
120 USACERL TR 98/81
Figure 36. Conventional processing cycle.
Figure 37. TRIG processing cycle.
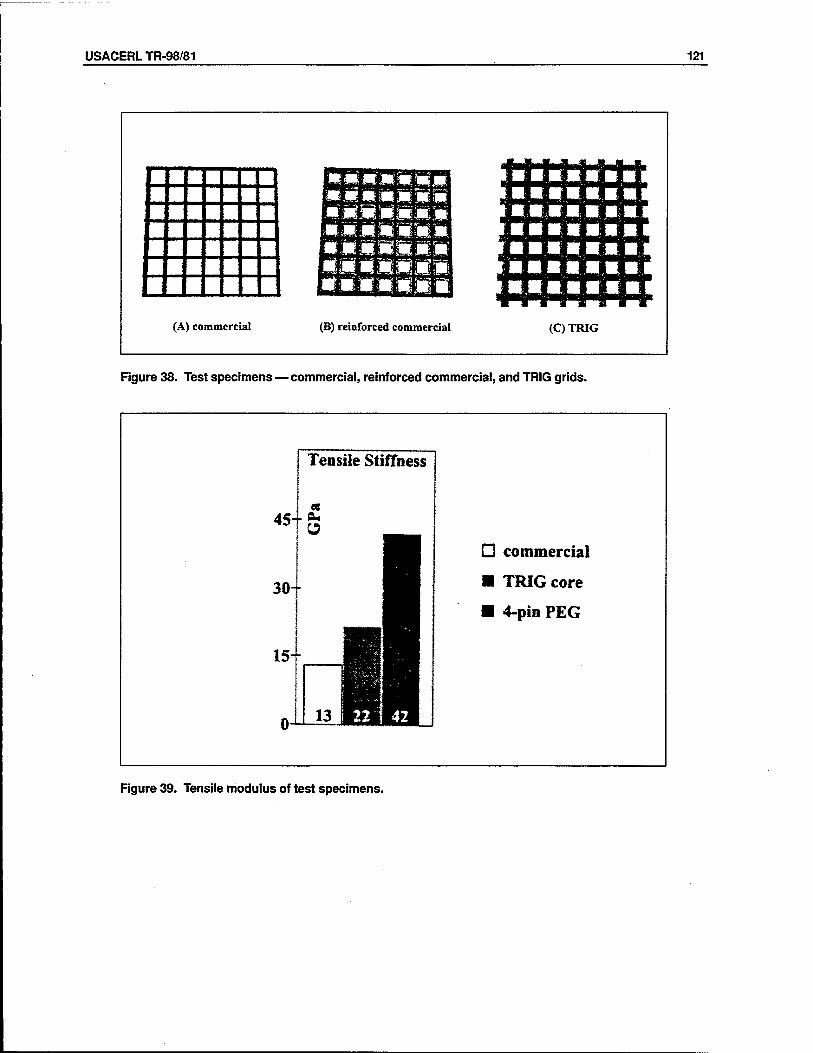
USACERLTR-98/81 121
T j
_
(A) commercial
iKmMmmMm i.^^t -JÄÄJ; -PK :;^^ eflHg JPP|: $P%
-*Ä JW* *äM ;W| 4PM wRa JHI'
>^*K ;<^^^ ^^WE j^^Pe '^ÄjK* rflfla \JÄPW*
-^» -<^^ -.MR ä* iB> Äs WS. .on ■■■■■■■ (B) reinforced commercial (C) TRIG
Figure 38. Test specimens — commercial, reinforced commercial, and TRIG grids.
Tensile Stiffness
D commercial
■ TRIG core
■ 4-pin PEG
Figure 39. Tensile modulus of test specimens.
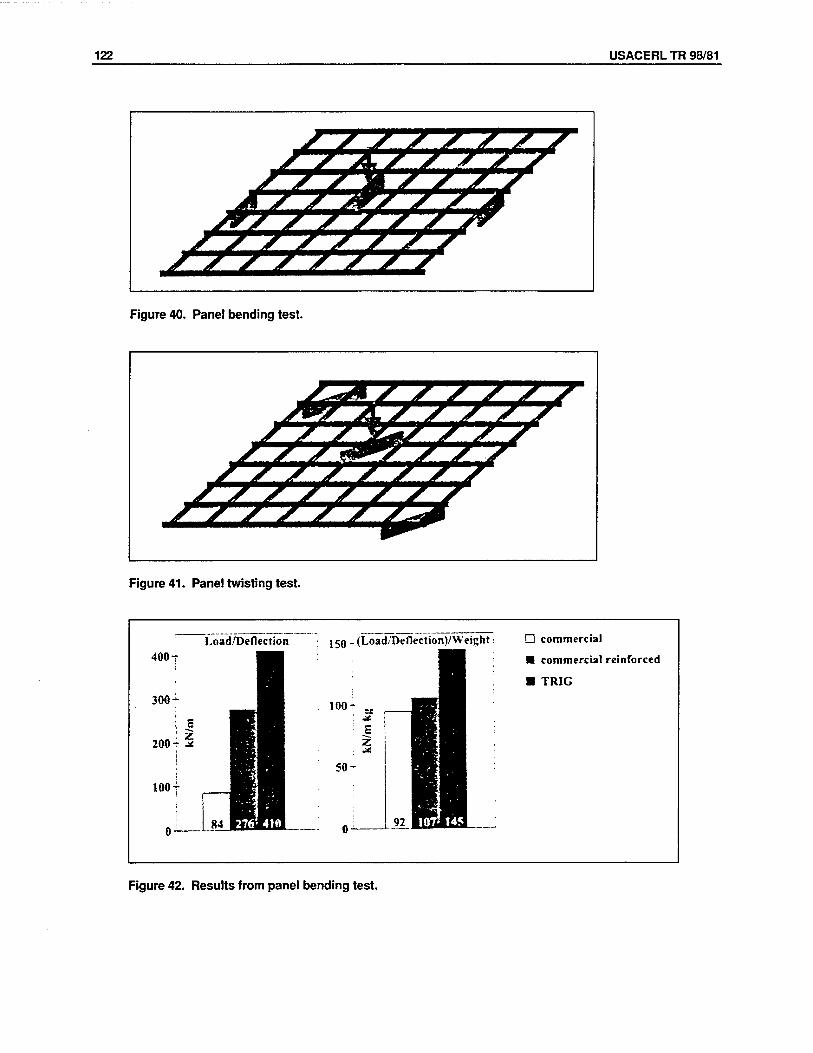
122 USACERL TR 98/81
J&
SMS AW mmmmmmm
J-Z. Figure 40. Panel bending test.
///VSSSJ >>vvvvvvf ,<r w Figure 41. Panel twisting test.
Load/Deflection 150 - (Load/Deflection)/Weight: 400 T
300-
200-r 5
100 T
100 -r it
s
50-
D commercial
■ commercial reinforced
■ TRIG
Figure 42. Results from panel bending test.
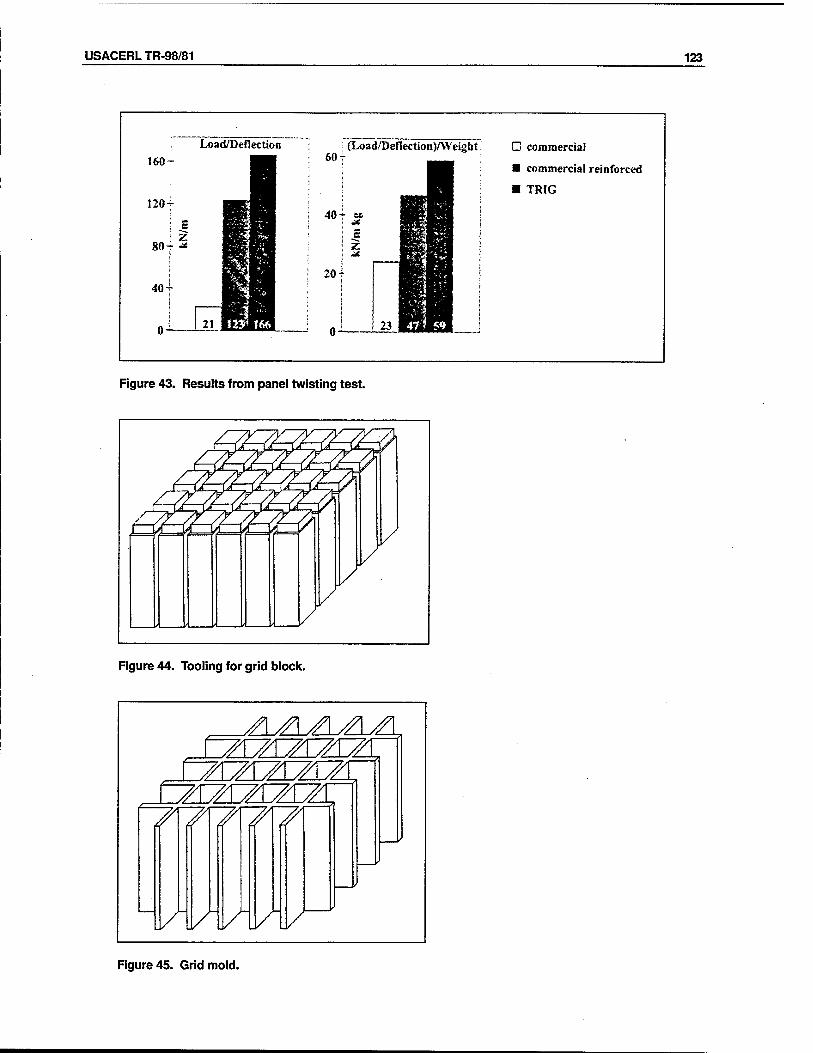
USACERLTR-98/81 123
Load/Deflection
160-
120-
80-
E 2
40- KMI 0- 21
604 (Load/DefIection)AVeigbt I
40* j»
s 20-^
D commercial
■ commercial reinforced
■ TRIG
Figure 43. Results from panel twisting test.
Figure 44. Tooling for grid block.
7U£LZL£Lä, raZEZCZEil
oizizrzizr S^AILKZL
71 71 71 71 71
Figure 45. Grid mold.
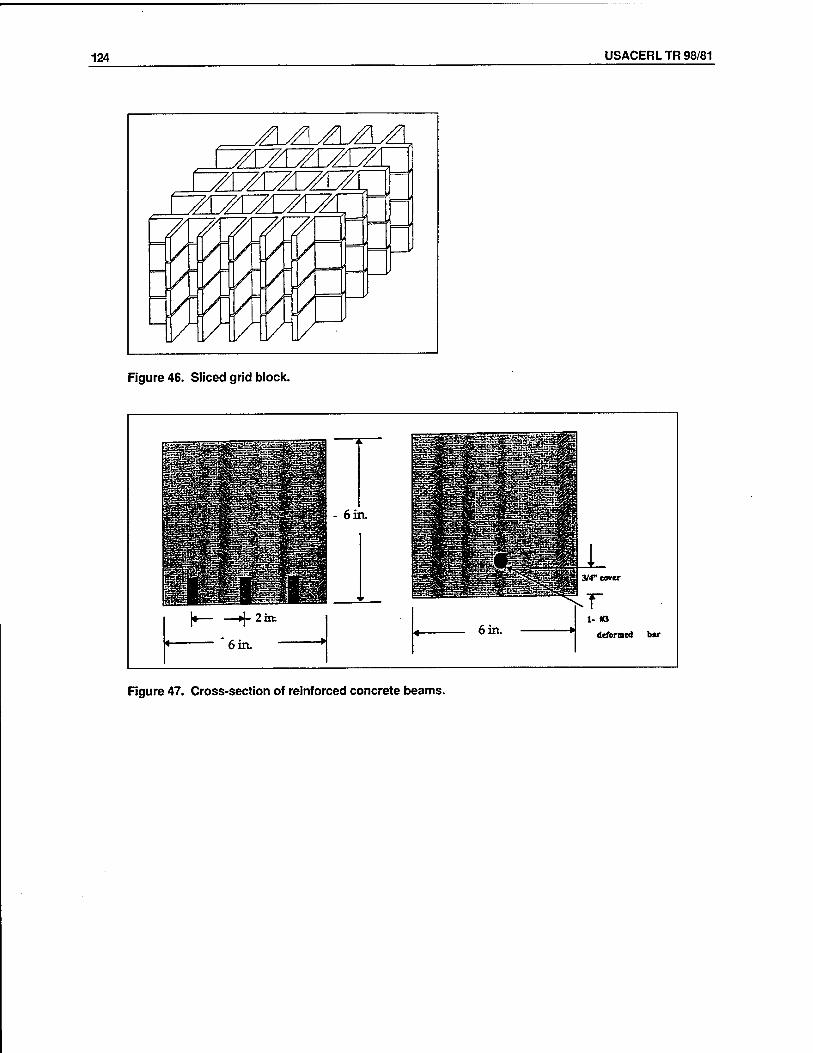
124 USACERL TR 98/81
ZLZLAZL£L CäzczrzEZi
ra^rzczra: OrZCZEZEZI
Figure 46. Sliced grid block.
■I - 6 in.
SUSI
Figure 47. Cross-section of reinforced concrete beams.
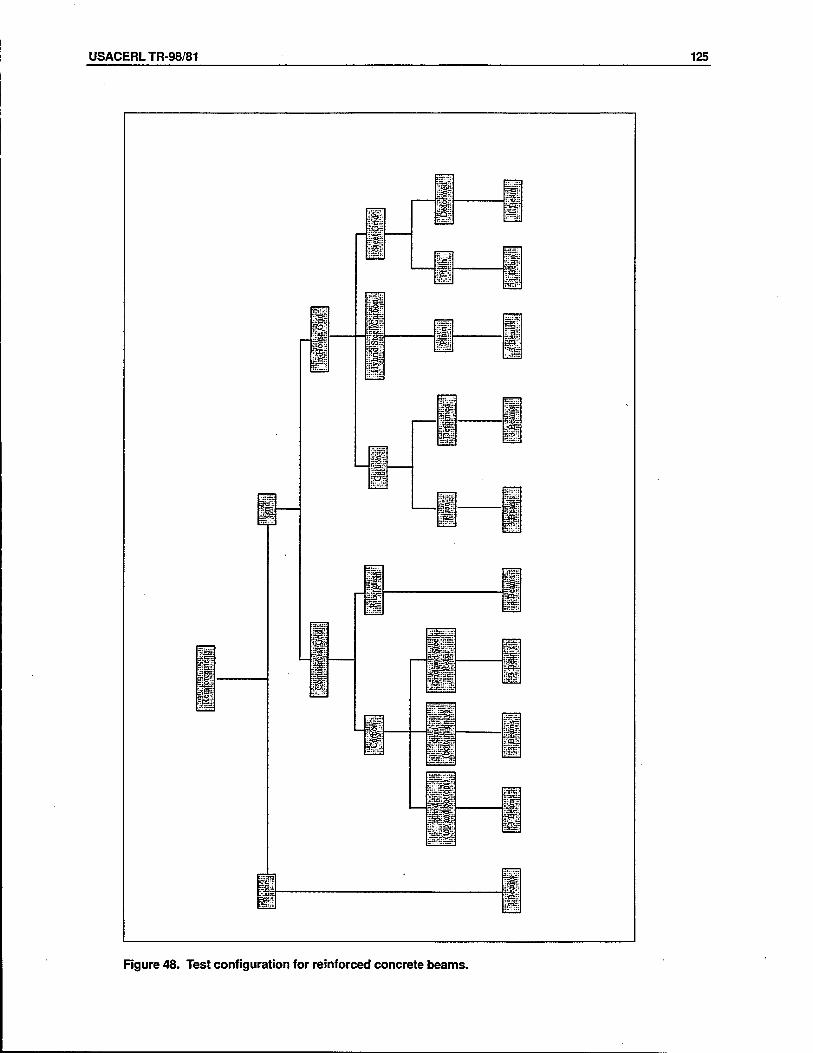
USACERLTR-98/81 125
SSäS:
aas
15*
JE
SKfe
SÄT
HP
335 m
;SöS
05.:
■ M
ffld in;: fei
w
ssBR! ••Id:
IÄTTI
JsS?
tSSs
-«• ÄS 1Ü
*3e äp Sä? s 38S
US
lit ill
sis
Figure 48. Test configuration for reinforced concrete beams.
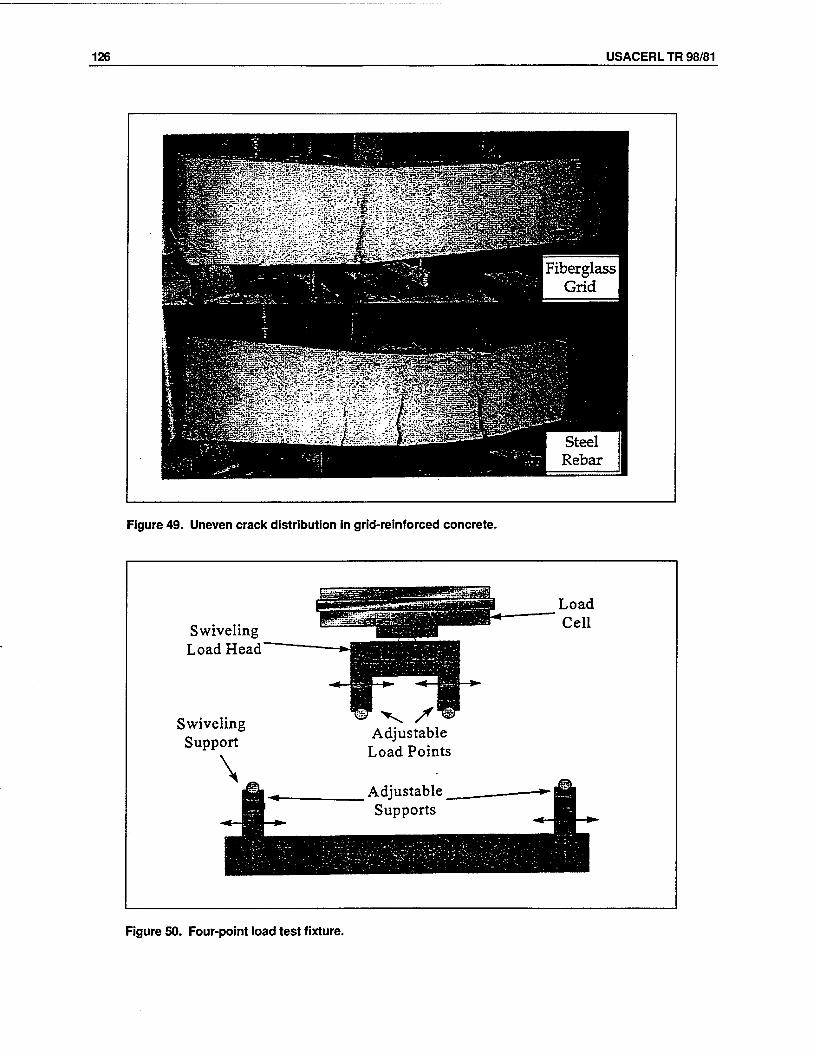
126 USACERL TR 98/81
Figure 49. Uneven crack distribution in grid-reinforced concrete.
Swiveling Load Head
Swiveling Support
Adjustable Load Points
Figure 50. Four-point load test fixture.
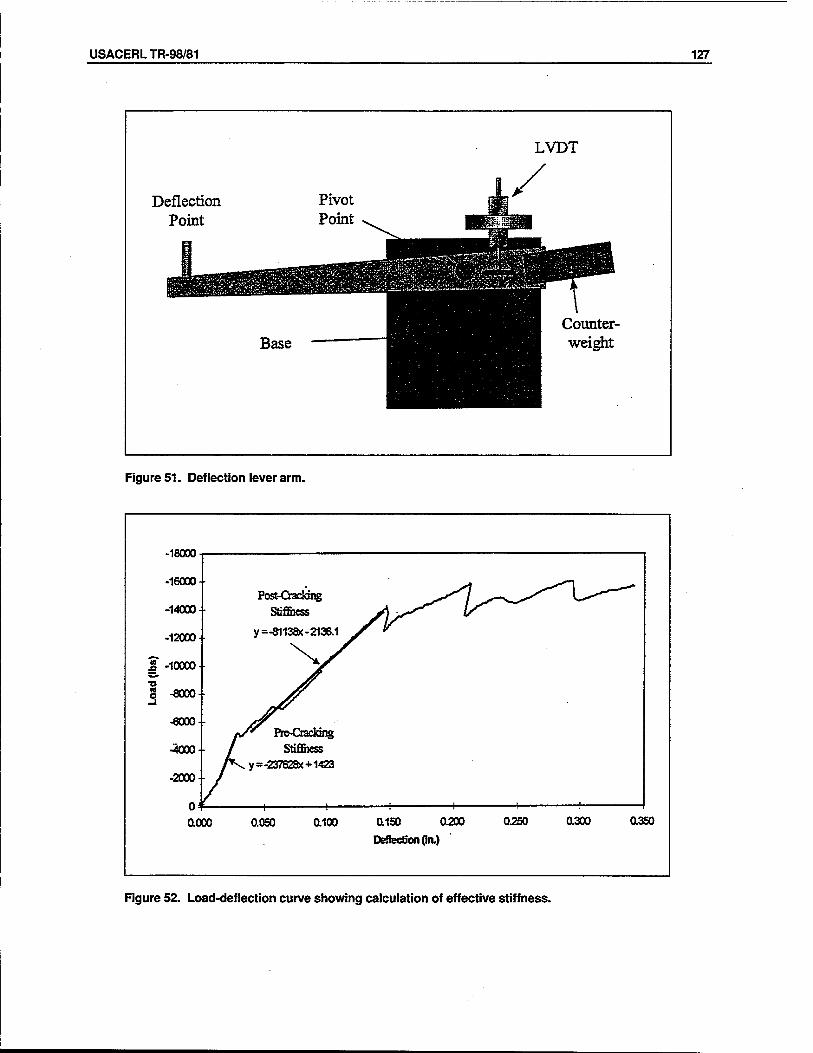
USACERLTR-98/81 127
Deflection Point
Pivot Point ^
LVDT
-'■'■■-. ■■■■■■■'■'
Counter- weight Base
Figure 51. Deflection lever arm.
- JOUUU '
-16000-
-14000 Post-Gacking ^r\ ^r~y^*S*^ X-*^"*^
Stiffiiess S)s^^^ **
Loa
d (lb
s)
y=-81138x-2136.1 yT *
-6000-
•4000-
rS' Pre-Cracking / Stiffiiess
-2000
0^
Av y=-237628X+1423
i 1 1 1 1 1 i
0.000 0.050 0.100 ai» 0.200
Deflection (in.)
0250 0.300 a350
Figure 52. Load-deflection curve showing calculation of effective stiffness.
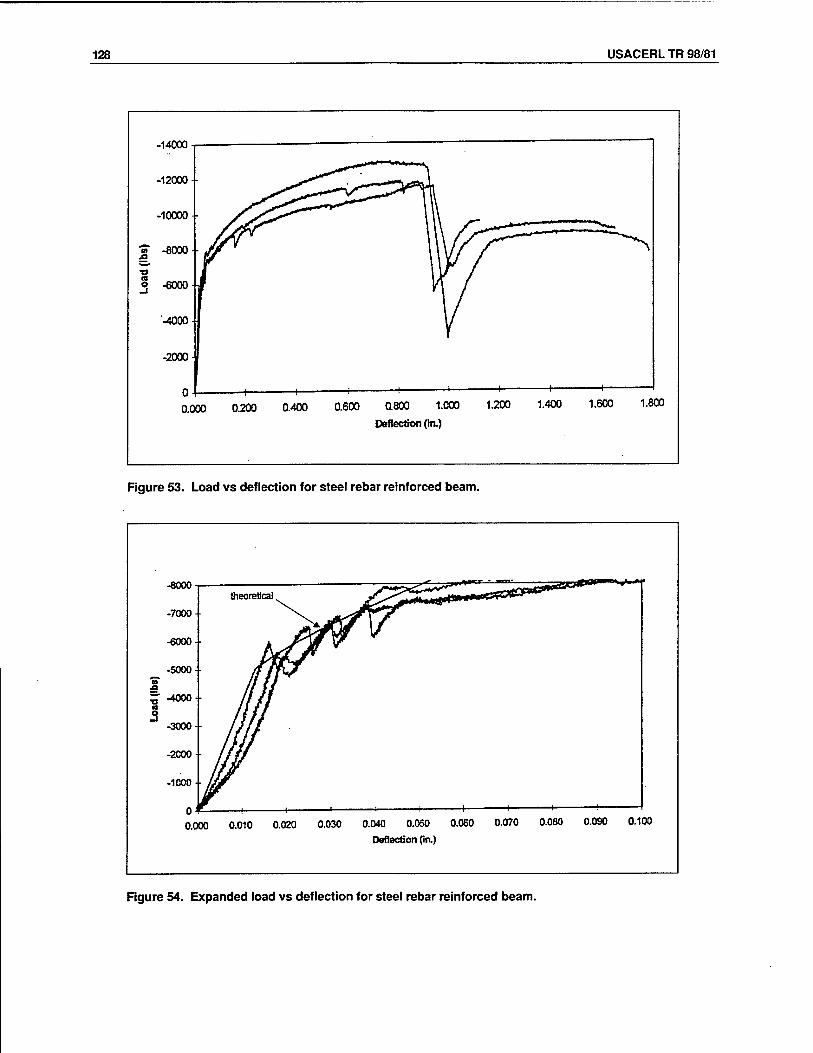
128 USACERL TR 98/81
-+-
0.000 0.200 0.400 0.600 0.800 1.000
Deflection (la)
1.200 1.400 1.600 1.800
Figure 53. Load vs deflection for steel rebar reinforced beam.
•o n o
0.000 0.010 0.020 0.030 0.040 0.050 0.060 0.070 0.080 0.090 0.100 Deflection (in.)
Figure 54. Expanded load vs deflection for steel rebar reinforced beam.
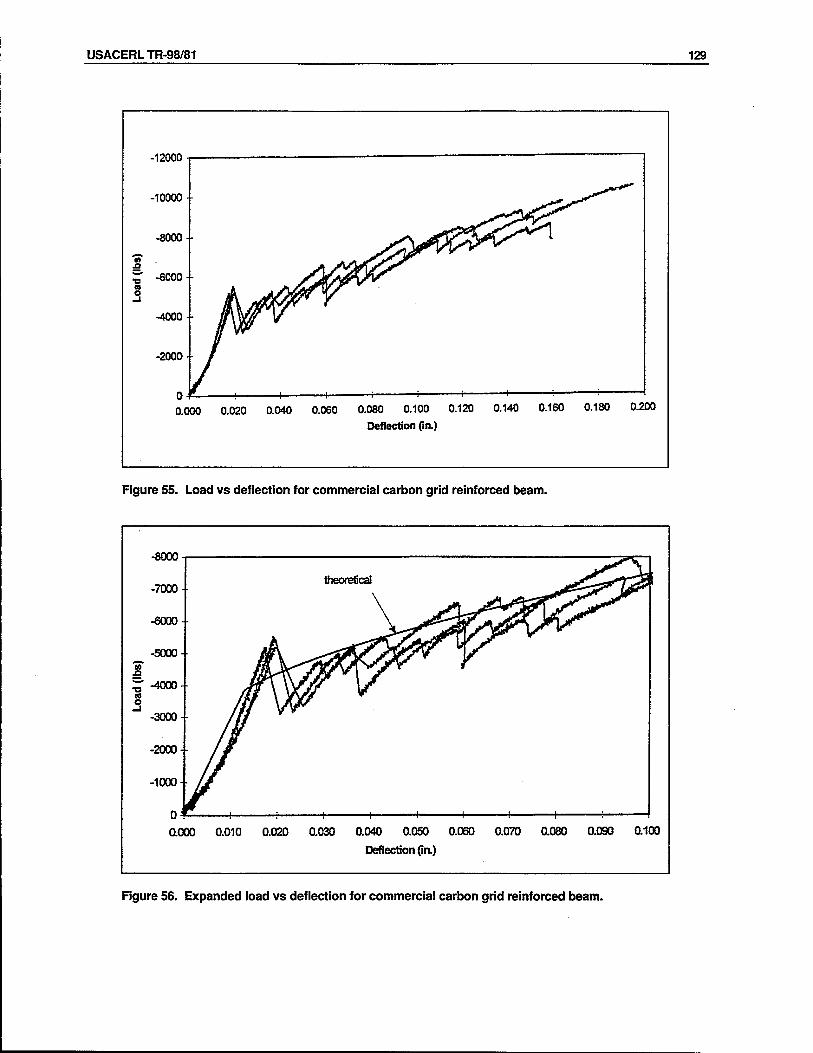
USACERLTR-98/81 129
-10000 •
-8000-
JO
v -6000-
3 -4000-
-2O0O-
U -T
0.000 0.020 0.040 0.060 0.080 0.100 0.120
Deflection (in.)
0.140 0.160 0.180 0.200
Figure 55. Load vs deflection for commercial carbon grid reinforced beam.
CO .Q
n o
-ouuu -
-7000- theoretical -»^-^»""T^S
-6000-
-5000-
•4000-
IfkjSf^jYjnJ'Y^jr* f
-3000-
-2000-
-1000-
0^ Z. 1 i 1 1 1 1 i 1 i
0.000 0.010 0.020 0.030 0.040 0.050 0.050 0.070 0.080 0.090 0.100
Deflection (in.)
Figure 56. Expanded load vs deflection for commercial carbon grid reinforced beam.
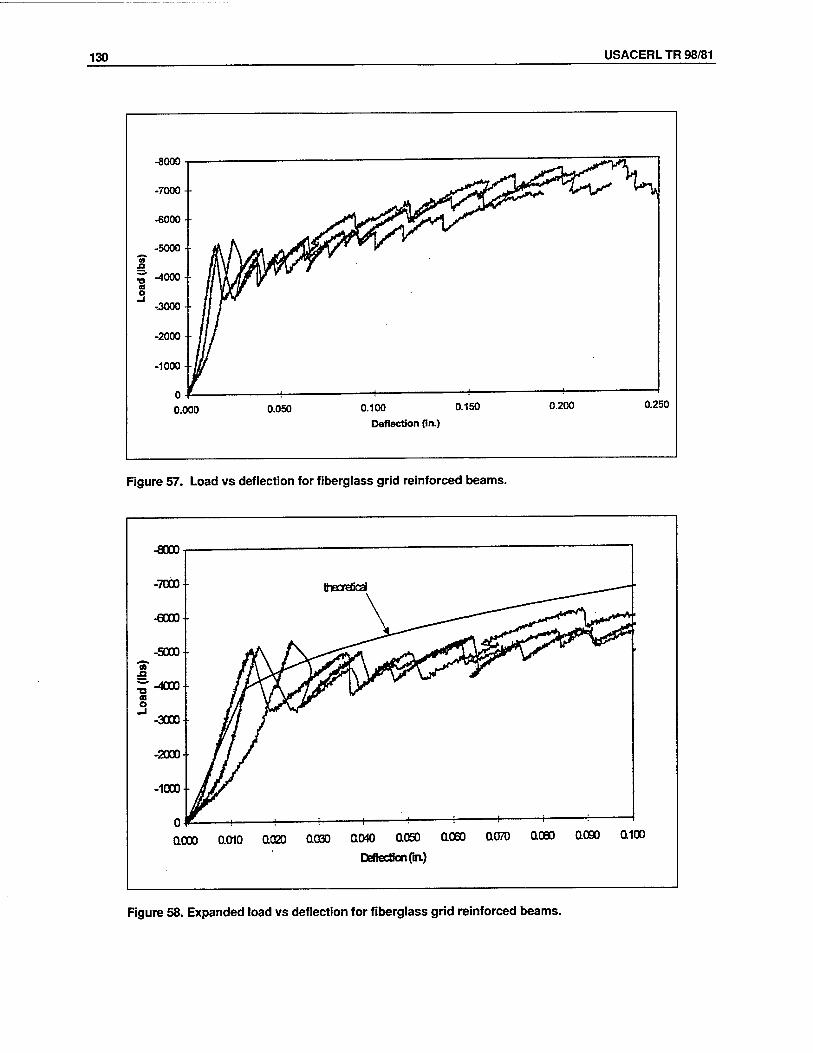
130 USACERL TR 98/81
-8000
■o es o
0.000 0.050 0.100 Deflection (in.)
0.150 0.200 0.250
Figure 57. Load vs deflection for fiberglass grid reinforced beams.
0.000 0.010 Q020 ao30 ao« ooso aoso aero ooeo ao9o QIOO
Deftedtonfm.)
Figure 58. Expanded load vs deflection for fiberglass grid reinforced beams.
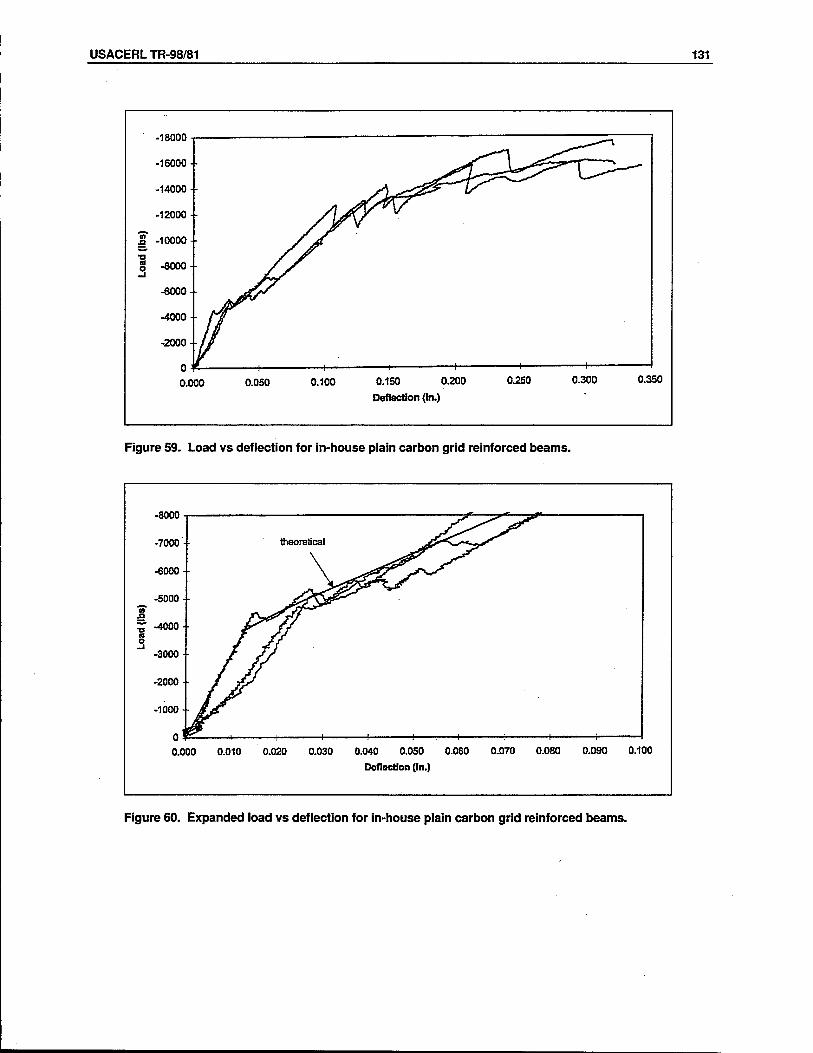
USACERLTR-98/81 131
Jg -10000-
■a id o
0.000 0.050 0.100 0.150 0.200
Deflection (In.)
0.250 0.300 0.350
Figure 59. Load vs deflection for in-house plain carbon grid reinforced beams.
H r-
0.000 0.010 0.020 0.030 0.040 0.050 0.060 0.070 0.080 0.090 0.100
Deflection (in.)
Figure 60. Expanded load vs deflection for in-house plain carbon grid reinforced beams.
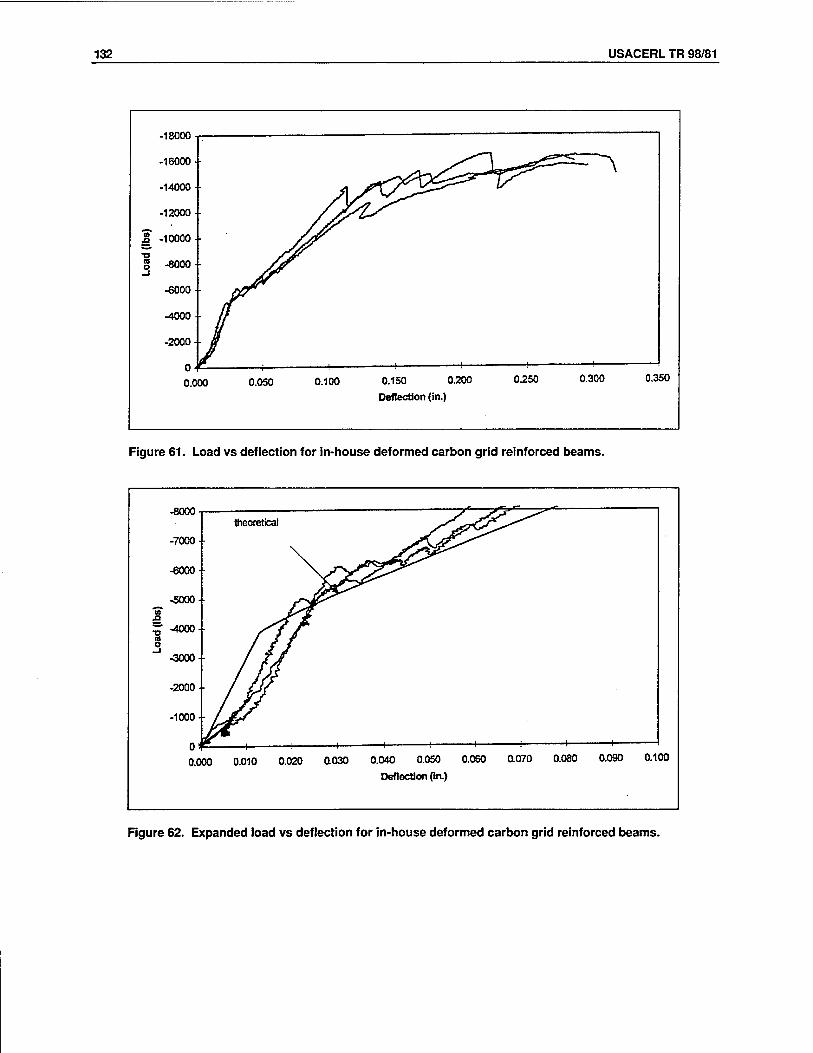
132 USACERL TR 98/81
-1ÖUUU •
-16000- ^^ -14000 ■
-12000-
1" -10000-
g -8000
-6000-
-4000
-2000-
1 u ^ O.OOO 0.050 0.100 0.150 0.200
Deflection (in.)
0.250 0.300 0.350
Figure 61. Load vs deflection for in-house deformed carbon grid reinforced beams.
•a n o
H h-
0.000 0.010 0.020 0.030 0.040 0.050 0.060 0.070 0.080 0.090 0.100
Deflection (In.)
Figure 62. Expanded load vs deflection for in-house deformed carbon grid reinforced beams.
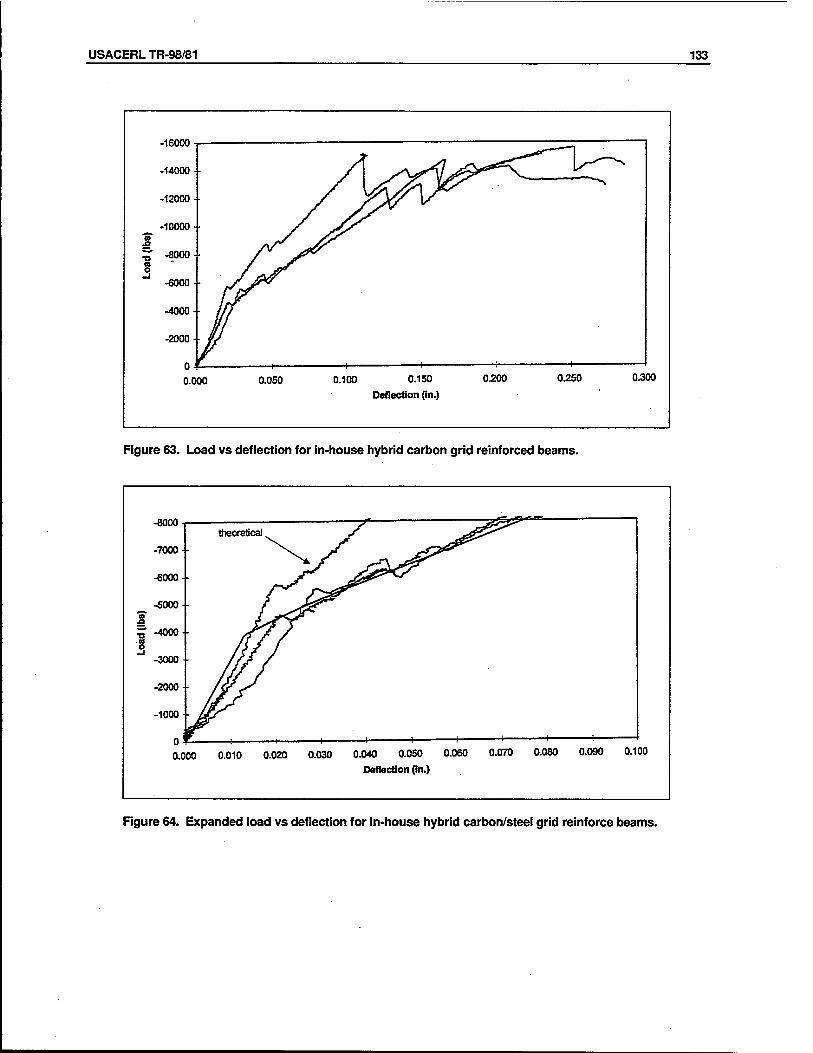
USACERLTR-98/81 133
-lOUUU ■
-14000-
-12000-
-10000- "n
ir -8000-
Loa
^»000-
-2000-
0.000 0.050 0.100 0.150
Deflection (in.)
0500 0550 0.300
Figure 63. Load vs deflection for in-house hybrid carbon grid reinforced beams.
1 H ■+-
0.000 0.010 0.020 0.030 0.040 0.050 0.060 0.070 0.080 0.090 0.100
Deflection (in.)
Figure 64. Expanded load vs deflection for in-house hybrid carbon/steel grid reinforce beams.
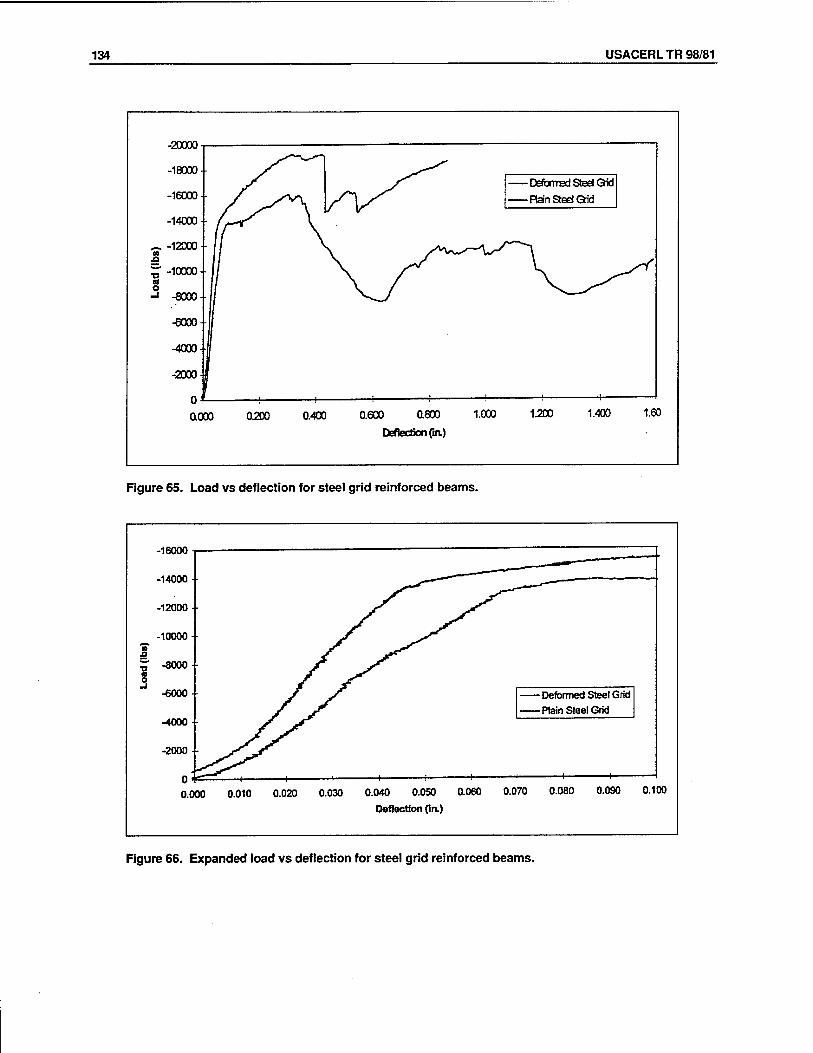
134 USACERL TR 98/81
-ZUUUU 1
-18000- DeforrrEd Steel Grid
-16000
-14000
Plan Steel Grid
^ -12000-
~-10000-
■3 -8000-
-6000
-4000-
-2000
1 ;— V 1
0.000 0300 0.4a 0.600 0.800
Deflection fia)
1.000 1.200 1.400 1.60
Figure 65. Load vs deflection for steel grid reinforced beams.
-16000 -, — — '—~ I
-14000
-12000 -
-10000 ■ n
J3
r- -8000
Loa
Deformed Steel Grid
-4000 Plain Steel Grid
-2000
_.-. 1 1 __ U f-—
0.000 0.010 0.020 0.030 0.040 0.050
Deflection (la)
0.060 0.070 0.080 0.090 0.100
Figure 66. Expanded load vs deflection for steel grid reinforced beams.
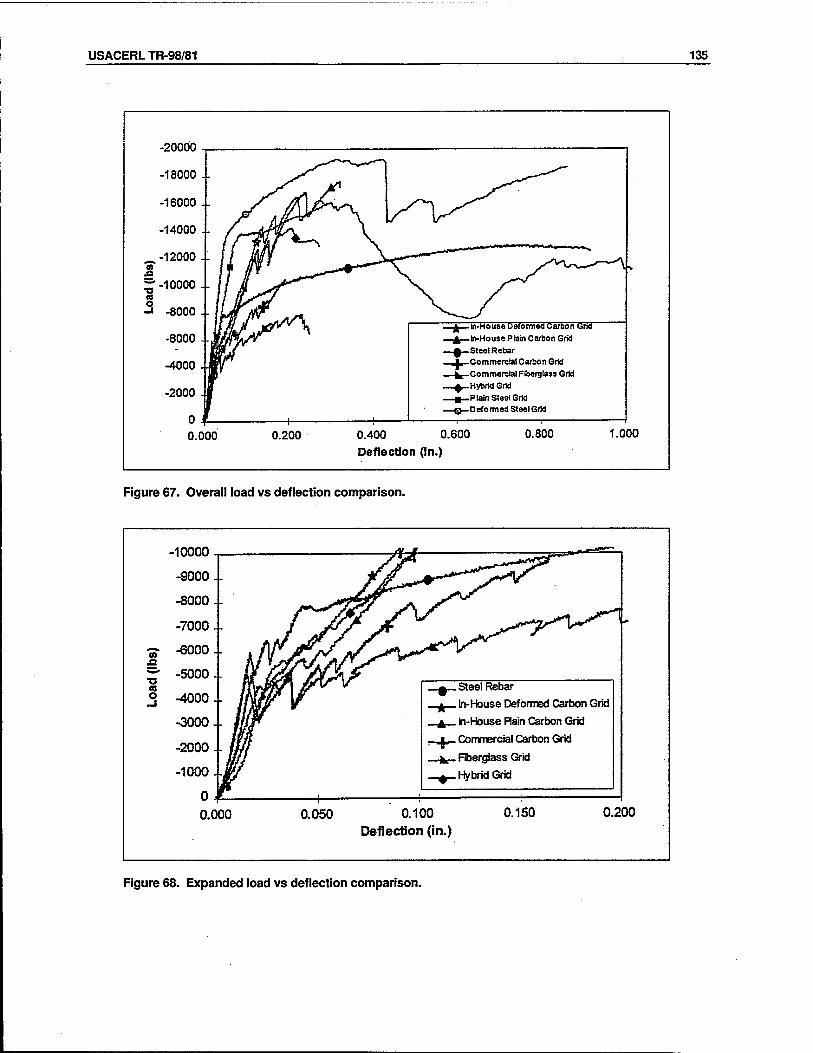
USACERLTR-98/81 135
Ä -12000 w
~-10000 <o
■3 -8000 ..
0.000 0.200 0.400 0.600 Deflection (in.)
0.800 1.000
Figure 67. Overall load vs deflection comparison.
-10000
M
IB o
. Steel Rebar
. In-House Deformed Carbon Grid
. In-House Rain Carbon Grid
. Commercial Carbon Grid
. Fiberglass Grid
. Hybrid Grid
0.050 0.100 Deflection (in.)
0.200
Figure 68. Expanded load vs deflection comparison.
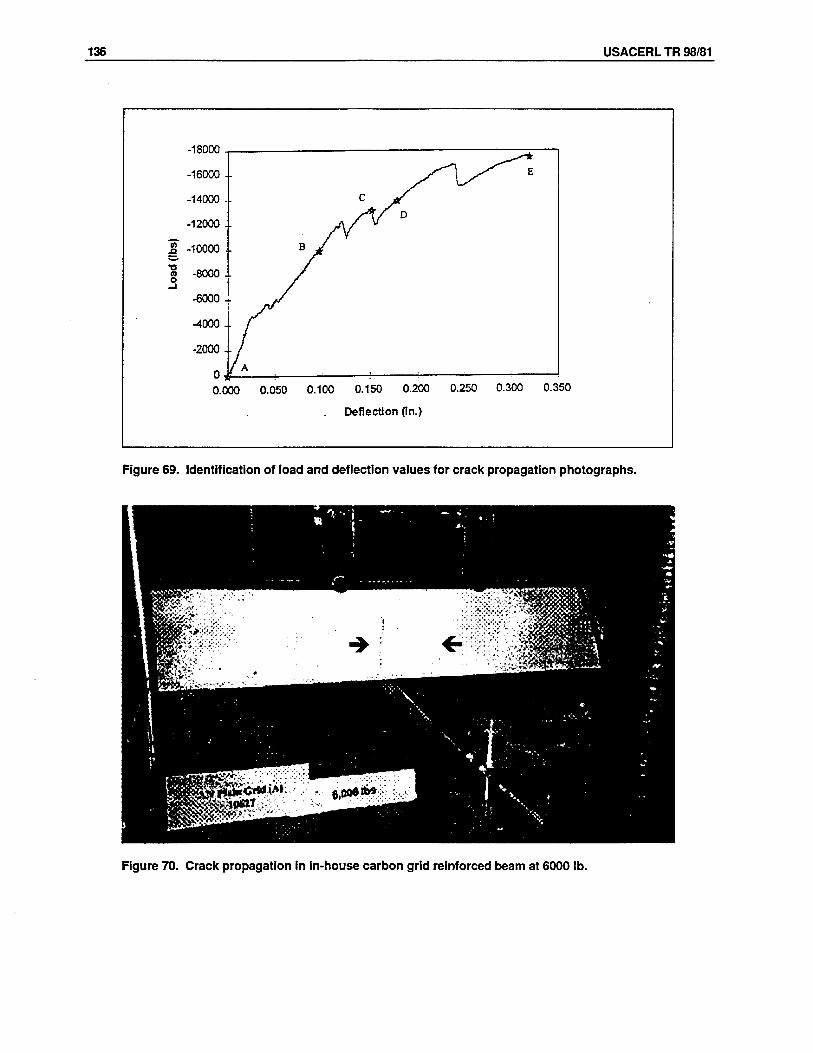
136 USACERL TR 98/81
ioorv>
-16000 - ^^ E
-14000 ■ . c M -12000 . /*V D
.Q -10000 . B J ^* ■o O
-8000 .
-6000 .
-4000.
-2000.
r> / A
0.000 0.050 0.100 0.150 0.200
Deflection (In.)
0.250 0.300 0.350
Figure 69. Identification of load and deflection values for crack propagation photographs.
v. ,v *- - '^SSHHHS
•; U" "X»,'. VMS}
1 ÜrKux'''^i«^^tfHHfl
Figure 70. Crack propagation in in-house carbon grid reinforced beam at 6000 lb.
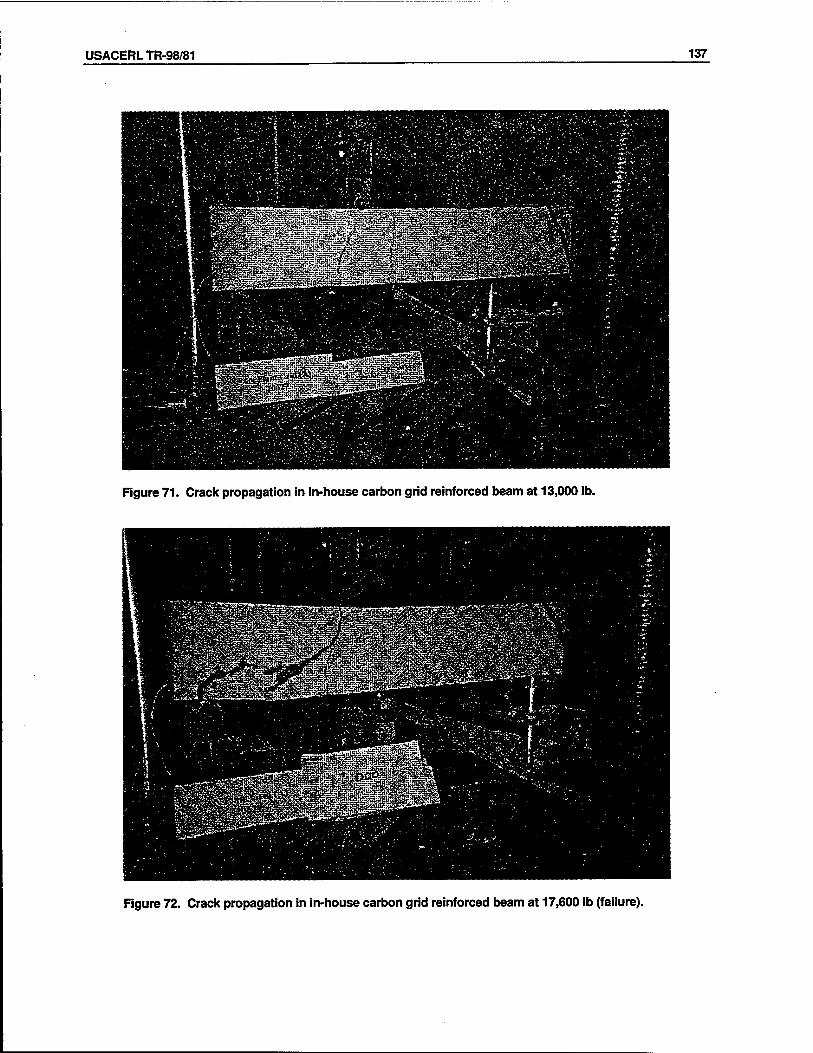
USACERLTR-98/81 137
Figure 71. Crack propagation in in-house carbon grid reinforced beam at 13,000 lb.
Figure 72. Crack propagation in in-house carbon grid reinforced beam at 17,600 lb (failure).
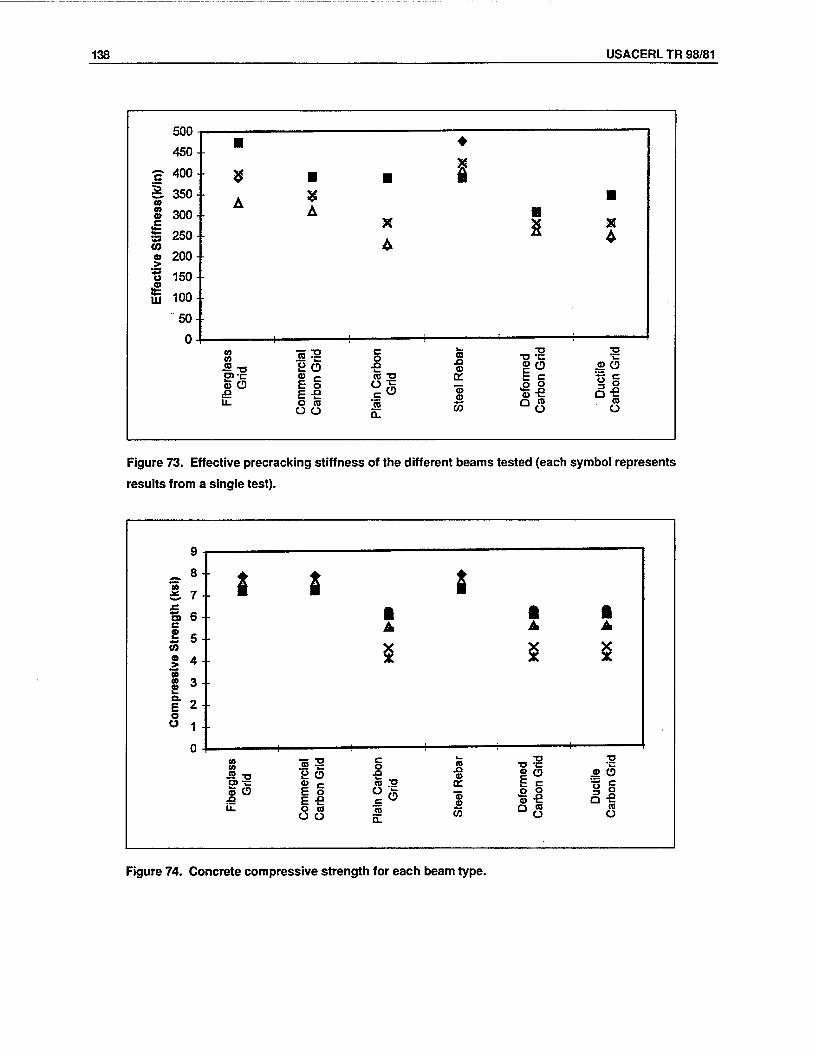
138 USACERL TR 98/81
500-, ■ ♦ 450-
I in) o
o
* ■ ■ & 350-
A S ■ S 300- A ■ g 250
X
A g X
4 « 200-
t> 150- £ S 100-
50-
0- to
rcia
l G
rid c
o CD Xt ©
■a •= a> o § c
2 a> ö
2>-c £ c (0 "O CC o c
<5 O E o <-> s ■2 8 = 8 Xt E-e c» m «Ü °"g u. O CD •*■* Q » CD
O O Q. CO Ü Ü
Figure 73. Effective precracking stiffness of the different beams tested (each symbol represents
results from a single test).
» -
w & 7 • : s 2 1 o» 6 - ■ t 1 c 2 5-
A A A
§ 4- 8 £ £ CO » 3 - ex _ E 2 o w 1-
U H to to J2 -o
"5 ? c o XI
CO Xt CD
•0 ■a -c g O E c
lie
Grid
o>-= 2 c «J ,*o (T 0 5 «3 O xt
E o E € ^<5 "5 0 0
•8 -e 3 0
u. o co O ü
CO 0-
CO a « CO O
Figure 74. Concrete compressive strength for each beam type.
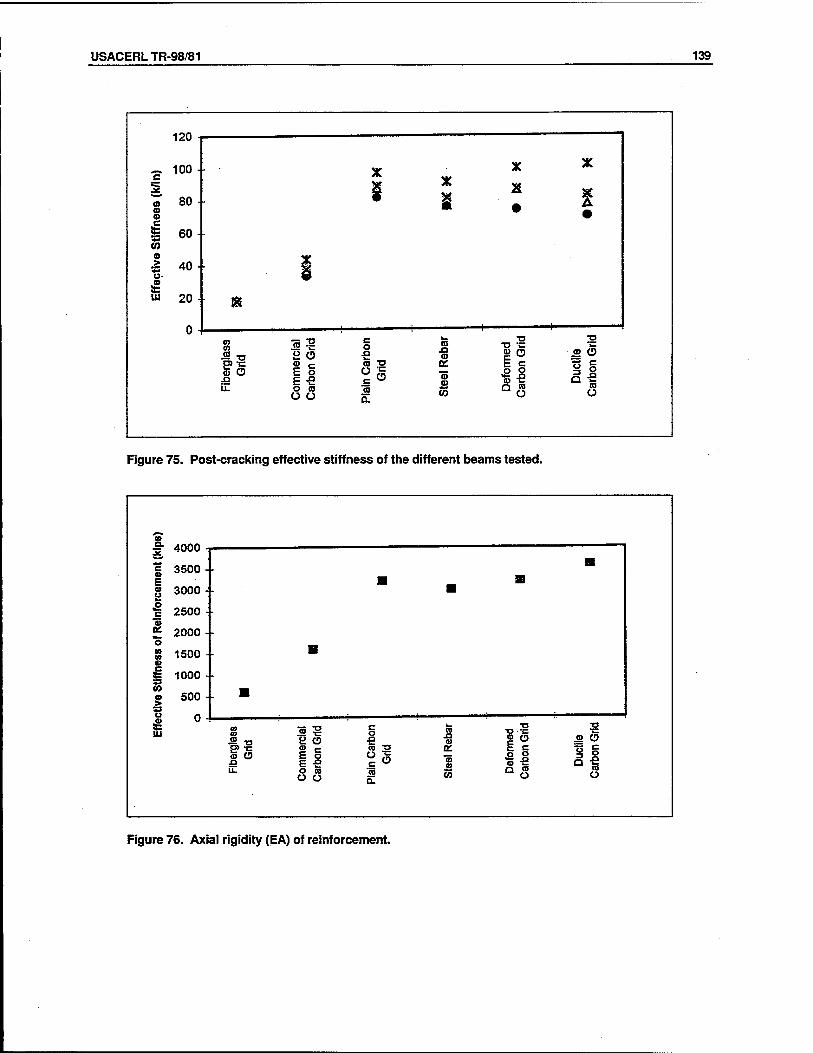
USACERLTR-98/81 139
1ZU -
~ 100 - c
'S" 80- (0 o
| 60- CO
X X X
i X
1 • o
ectlv
e
O i
m 20 ■
0-
&
Fibe
rgla
ss
Grid
Ü o E s E -E O (0 ü Ü
c o .a cä s ^§ (0
to .Q <D
m
55
T3 •a ~ g CD
Q 10 O
Duc
tile
Car
bon
Grid
Figure 75. Post-cracking effective stiffness of the different beams tested.
(O
2j 4UUU •
1 3500 ■ ■
E ■ ■ g 3000 ■ ■ 1 2500 - 4>
K 2000- o S 1500 - ■ a «§ 1000 -
© 500 • ■ > s .
UJ 09 CO .2 -D
2 § e o CO
CD
T3
p> -c <» c <o S o: "S 5 <D CD
LL.
£ o E -e o eg O Ü
<0 Q.
"3 «>
55
o o 'S -S Q CO
O ca Ü
Figure 76. Axial rigidity (EA) of reinforcement.
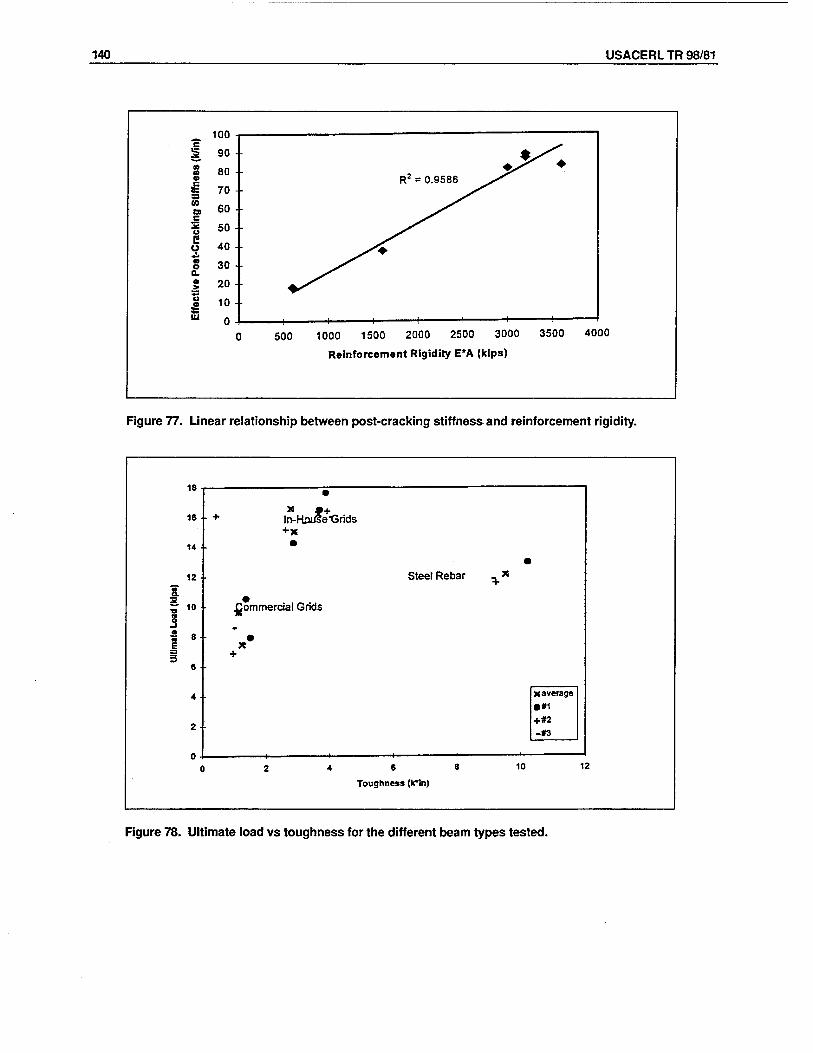
140 USACERL TR 98/81
^^ e ^^
(0 a
90 •
80 - ^* R2 = 0.9586 ^S^ 70 ■ ^x*1^
SJ ^^^ CO a 60 • ^■r c ^^^
50 - ^^ E ^^^ 9 40 - ^S% o 30 • y^ Q. ^^^ > 20 - ^s00^ 9 ^^ a 10 - !C Ui _
( ) 500 1000 1500 2000 2500 3000 3500
Reinforcement Rigidity E*A (kips)
4000
Figure 77. Linear relationship between post-cracking stiffness and reinforcement rigidity.
18 - •
16 ■ + In-Hoiife-Grids +x
14 • •
12 Steel Rebar -|X
a.
5 8- E 3 5
s
4
.Commercial Grids
• X
+
X average
•#1
2
0 c
+*2 -#3
2 4 6 8 10 1 2
Toughness (k*ln)
Figure 78. Ultimate load vs toughness for the different beam types tested.
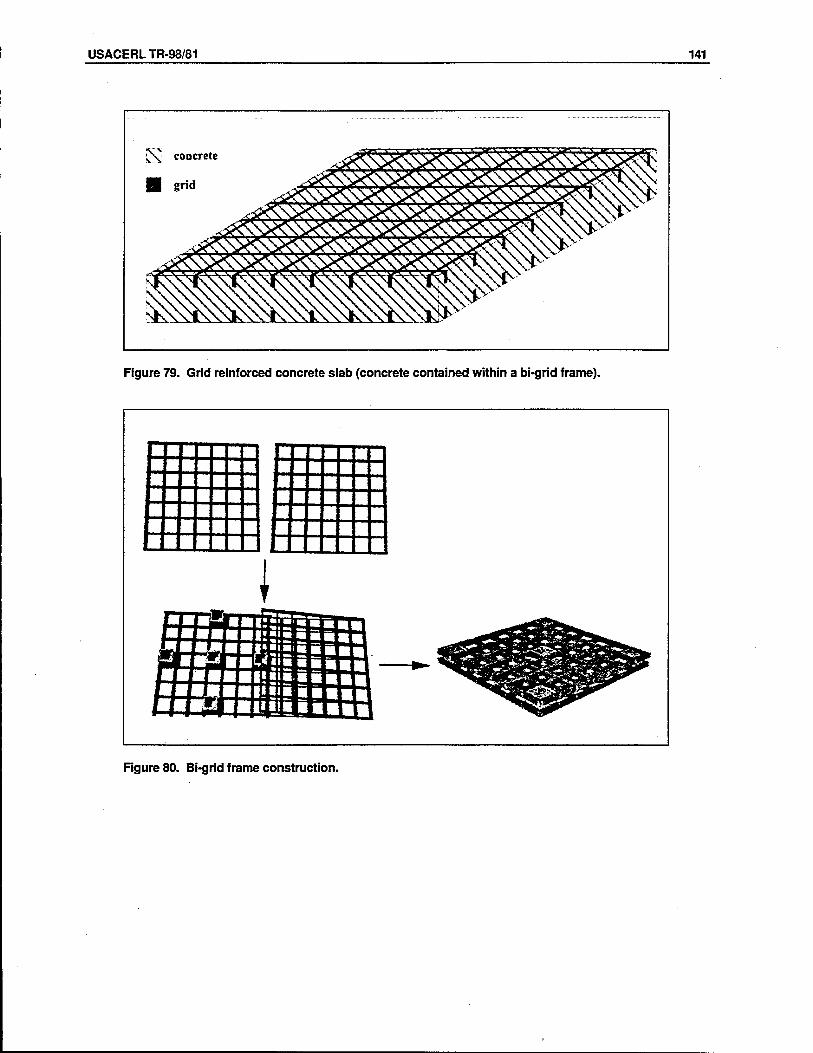
USACERLTR-98/81 141
£\ concrete
■ gnd ."OOOOii )%S
y^-
V
,.^f\\\
xii^HN^vsl >Oo^>^\N
^^^ \VvV\S'
Figure 79. Grid reinforced concrete slab (concrete contained within a bi-grid frame).
EiEEEE FEEEEE
::::::: EzEEEEE
Figure 80. Bi-grid frame construction.
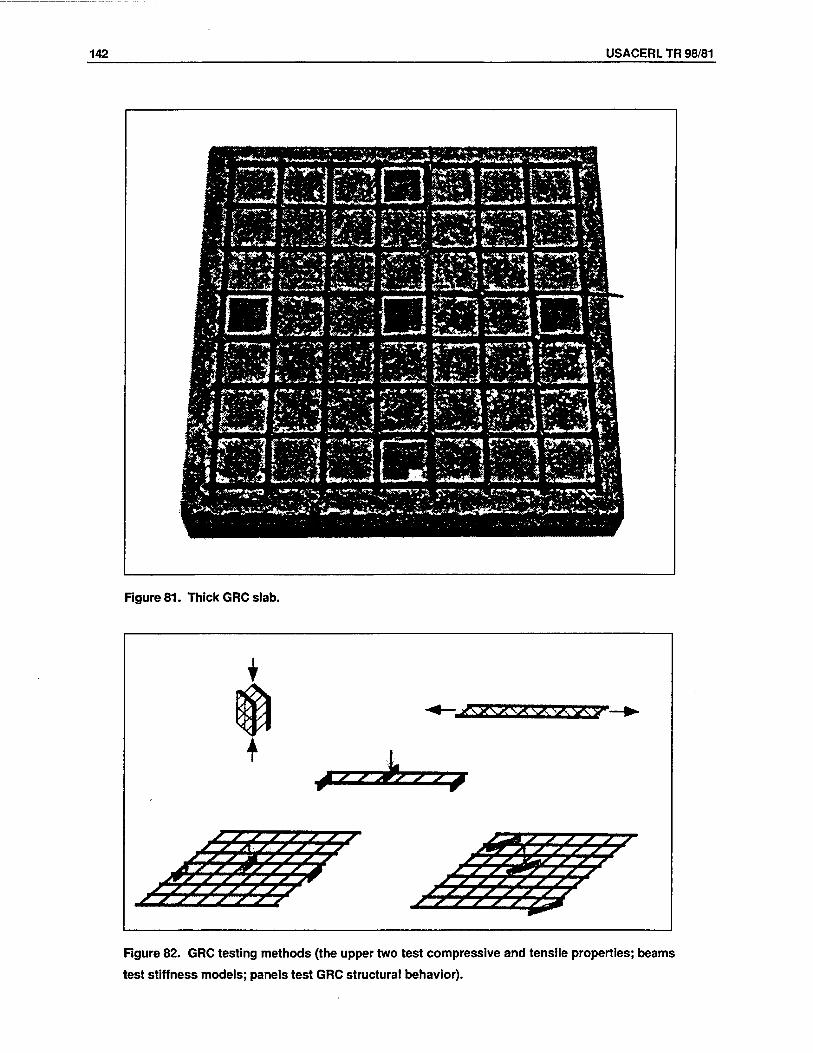
142 USACERL TR 98/81
Figure 81. Thick GRC slab.
Figure 82. GRC testing methods (the upper two test compressive and tensile properties; beams
test stiffness models; panels test GRC structural behavior).
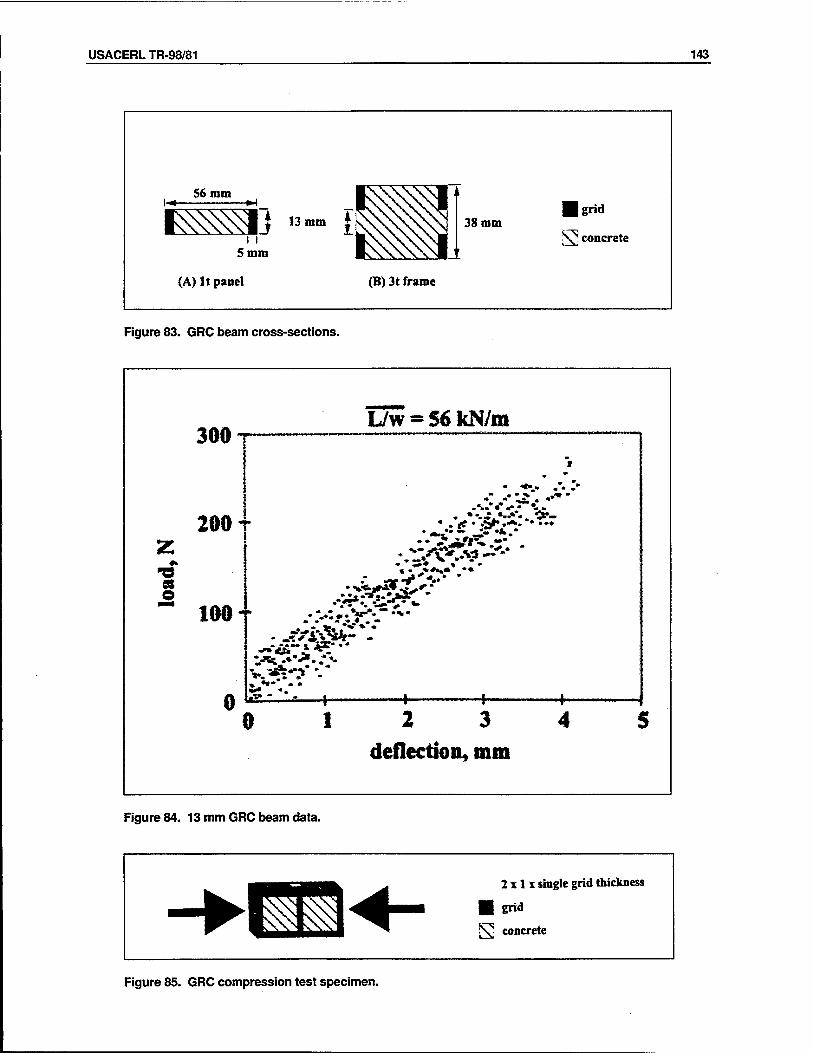
USACERLTR-98/81 143
56 mm
J 13mm il 38 mm ■ grid
N^ concrete
(A) It panel (B) 3t frame
Figure 83. GRC beam cross-sections.
L/w « 56 kN/m
5
200- Z A 5 100-
0 1
*#
- «#. „ „-. ;* ." -• is. .«* *
-•-.♦•**..-•-. * • •• «I *w>« iS*—i
" * • it ' J^f* «■*'» *• • •»
•VT*-. C*"V*.
% •««* :» *
0 12 3 4' deflection, mm
Figure 84. 13 mm GRC beam data.
2 x 1 x single grid thickness
■ grid
fj\] concrete
Figure 85. GRC compression test specimen.
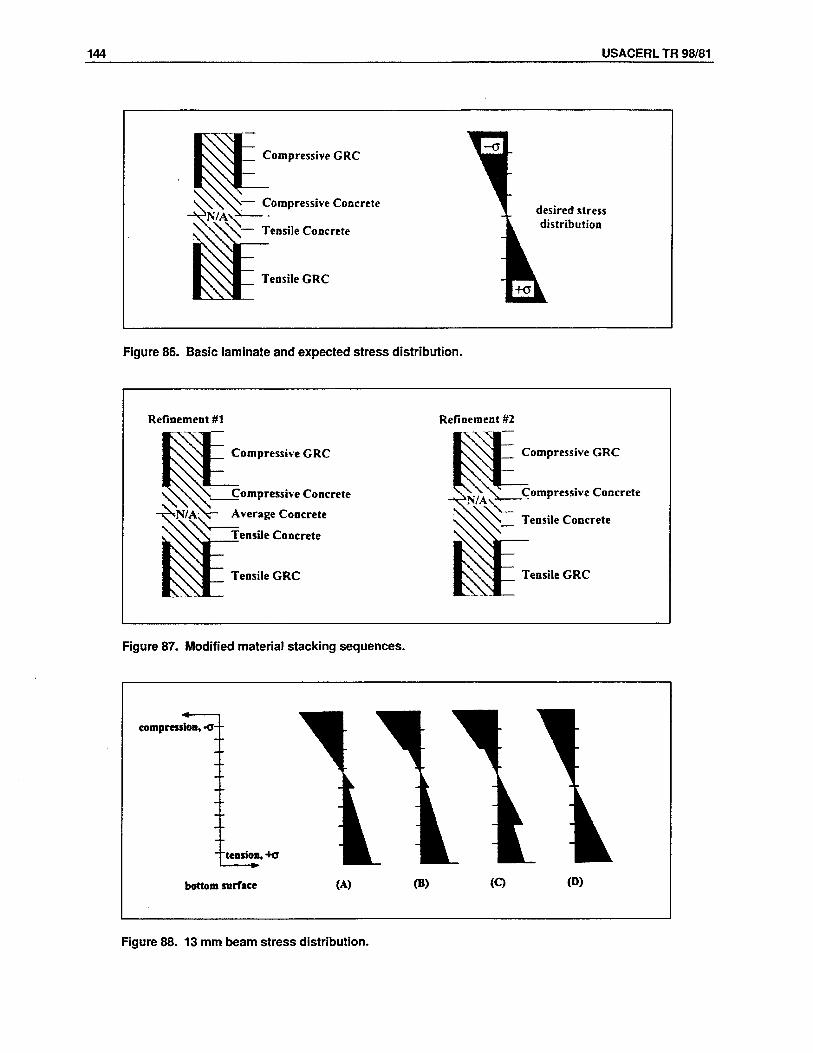
144 USACERL TR 98/81
CompressiveGRC
- Compressive Concrete *N/A\^
^0\— Tensile Concrete
Tensile GRC
desired stress distribution
Figure 86. Basic laminate and expected stress distribution.
Refinement #1 Refinement #2
Compressive GRC
_Compressive Concrete
Average Concrete
Tensile Concrete
Tensile GRC
Compressive GRC
Compressive Concrete
Tensile Concrete
Tensile GRC
Figure 87. Modified material stacking sequences.
compression, -a- -
~ "tension, +o
bottom surface (A) (B) (Q (D)
Figure 88. 13 mm beam stress distribution.
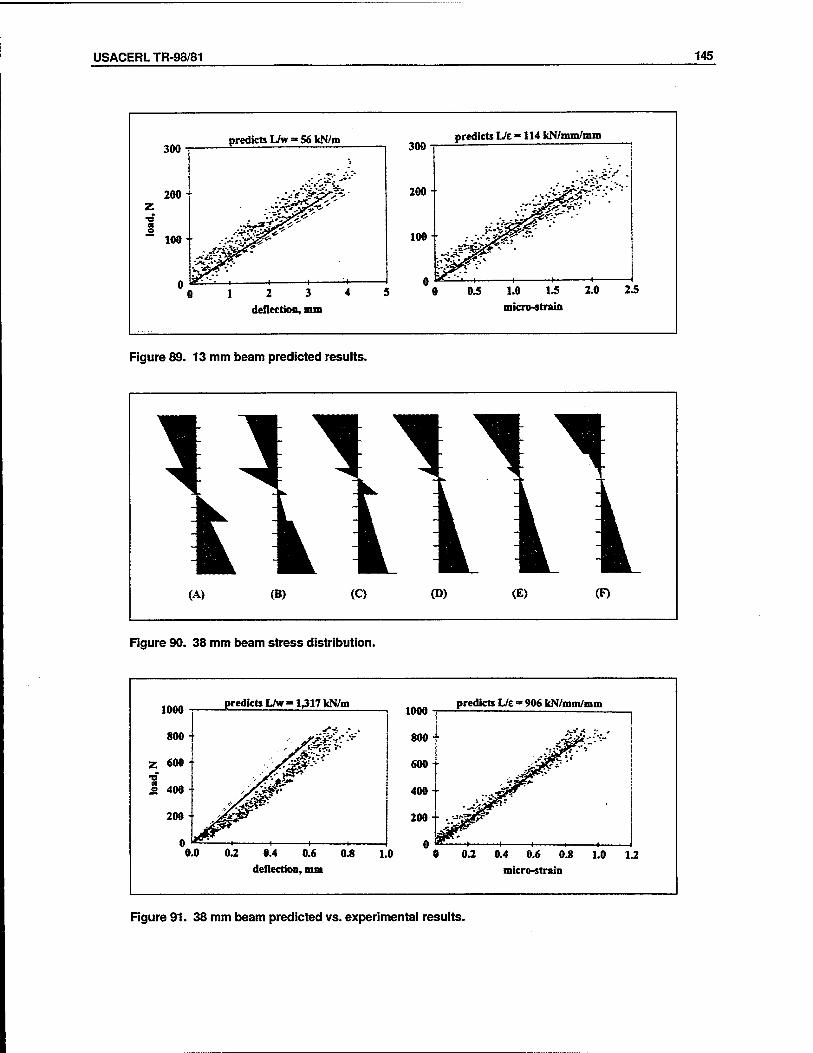
USACERLTR-98/81 145
300
200
predict» L/w » 56 kN/m
■o
100-
300 predicts L/e -114 kN/mm/mm
200-
2 3 deflection, mm
Figure 89. 13 mm beam predicted results.
Figure 90. 38 mm beam stress distribution.
predicts L/w-1,317 kN/m
< 1-
predicts L/e = 906 kN/mm/mm
0.2 0.4 0.6 0.8 deflection, mm
1.0 0.2 0.4 0.6 0.8 micro-strain
1.0 1.2
Figure 91. 38 mm beam predicted vs. experimental results.
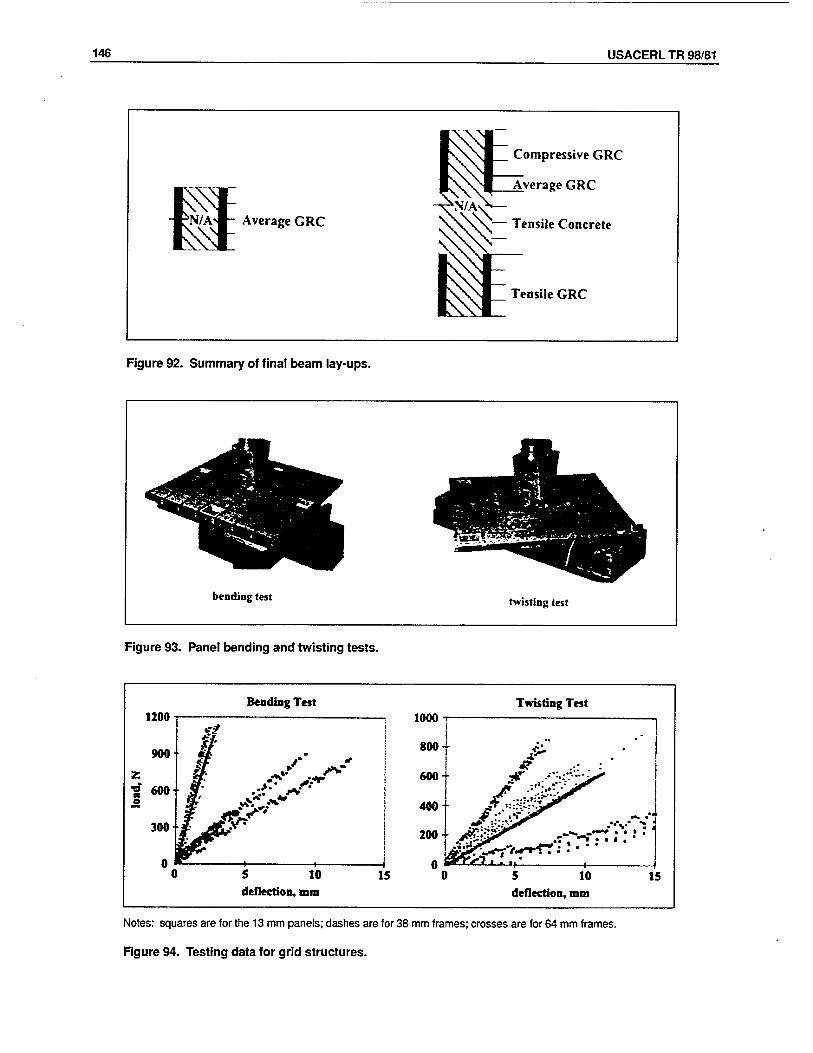
146 USACERL TR 98/81
Figure 92. Summary of final beam lay-ups.
■ V\\M_ Compressive GRC
^mw. , IXS^I Average GRC
l\N/Al - Average GRC ^N/AN— V\\V— Tensile Concrete
IVNSJZ Tensile GRC
bending test twisting test
Figure 93. Panel bending and twisting tests.
Bending Test
5 10 deflection, mm
15
Twisting Test 1000
5 10 deflection, mm
15
Notes: squares are for the 13 mm panels; dashes are for 38 mm frames; crosses are for 64 mm frames.
Figure 94. Testing data for grid structures.
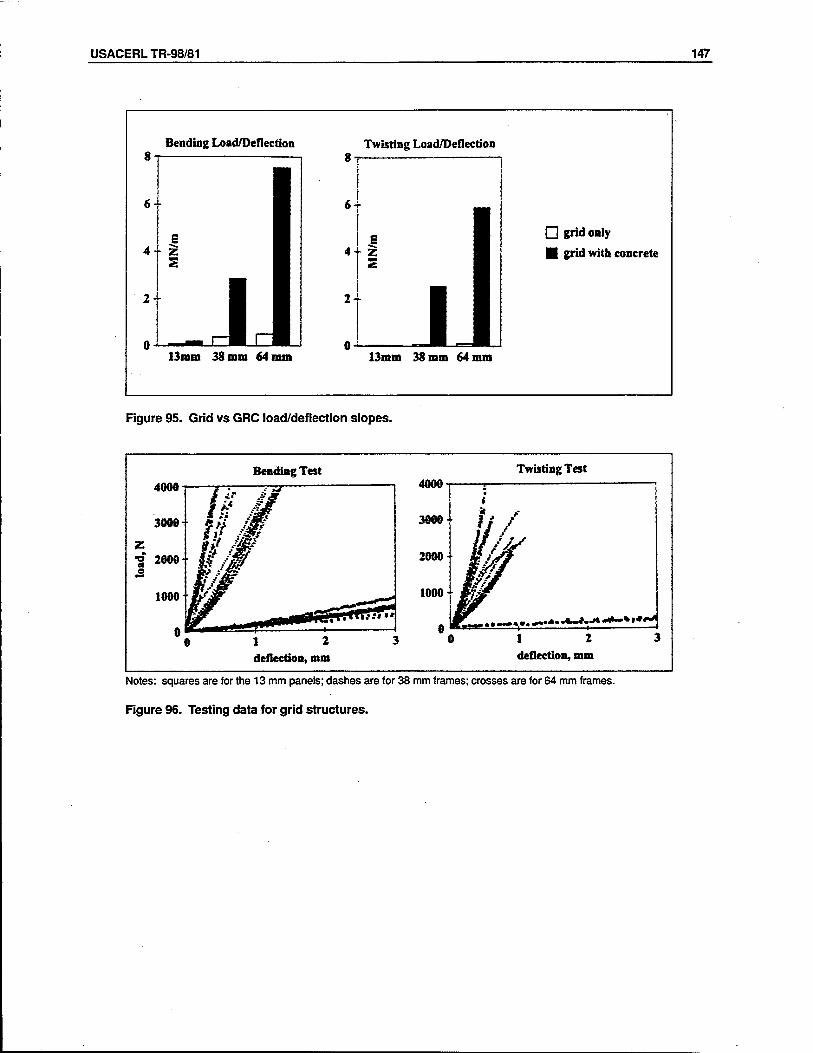
USACERLTR-98/81 147
Bending Load/Deflection
6t
2 -
13mm 38 mm 64 mm
Twisting Load/Deflection
6-
2T
□ grid only
■ grid with concrete
13mm 38 mm 64 mm
Figure 95. Grid vs GRC load/deflection slopes.
Bending Test
1 2 deflection, mm
Twisting Test
i
lit iK*-*» «»—«>*• •«•• <•• ,j*~i. .*«*~%t*#»<
0 1 2 deflection, mm
Notes: squares are for the 13 mm panels; dashes are for 38 mm frames; crosses are for 64 mm frames.
Figure 96. Testing data for grid structures.
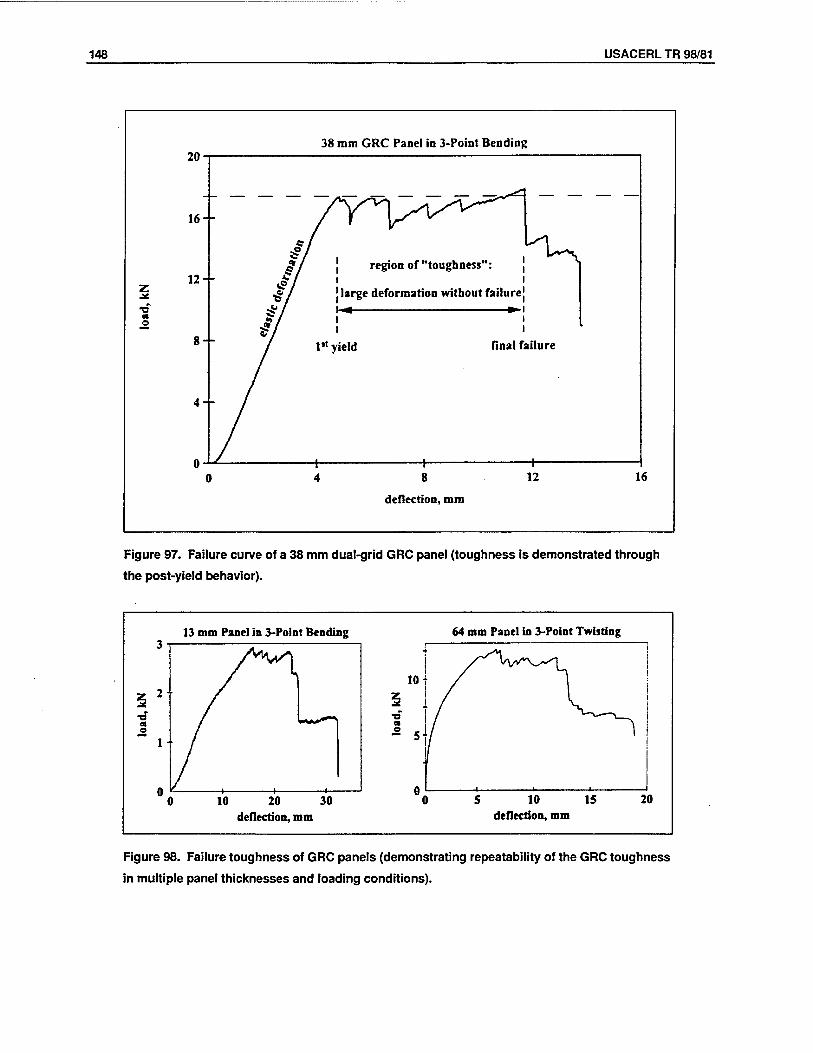
148 USACERL TR 98/81
38 mm GRC Panel in 3-Point Bending ZU ~
16-
£/ region of "toughness": n 121 // ' z ^ / ! large deformation without failure „ti / ! — „_ bl
et #7 o / > 8- / 1" yield final failure
4-
U -1 rIi i 0 4 8 12 16
deflection, mm
Figure 97. Failure curve of a 38 mm dual-grid GRC panel (toughness is demonstrated through
the post-yield behavior).
13 mm Panel in 3-Point Bending
•a « o
10 20 30 deflection, mm
64 mm Panel in 3-Point Twisting
5 10 15 deflection, mm
20
Figure 98. Failure toughness of GRC panels (demonstrating repeatability of the GRC toughness
in multiple panel thicknesses and loading conditions).
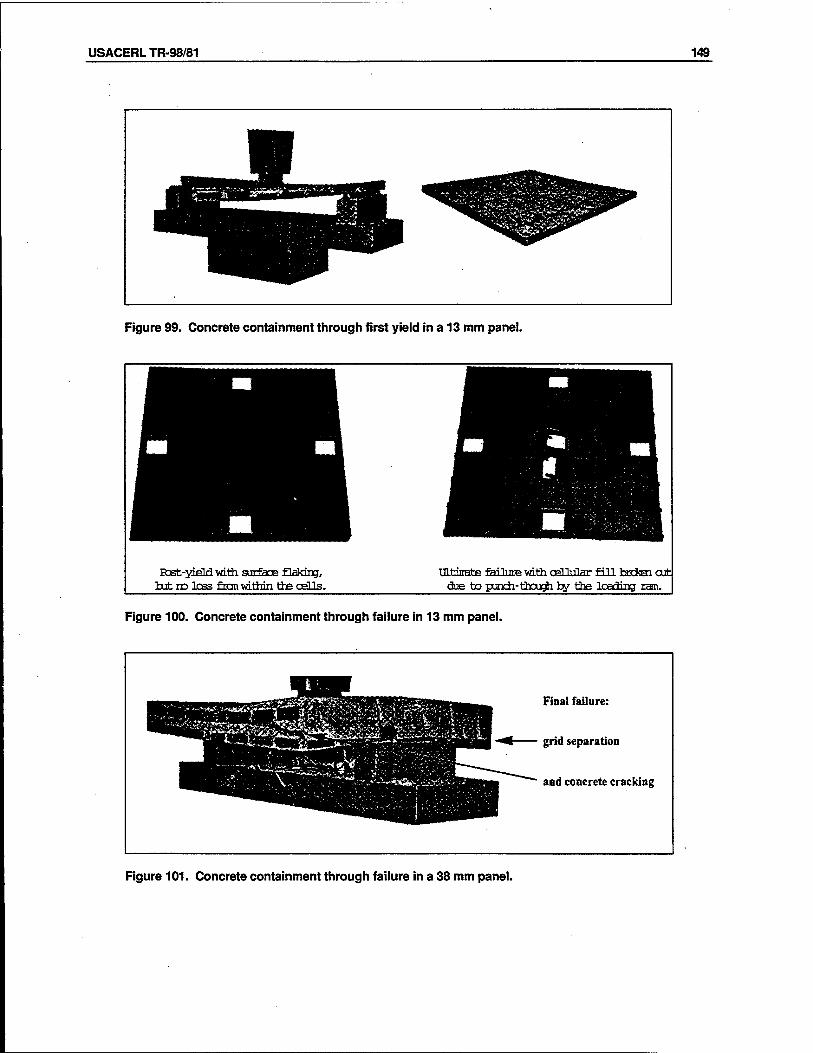
USACERLTR-98/81 149
Figure 99. Concrete containment through first yield in a 13 mm panel.
test-yield with, surface flaking, but no Ices from within the CPPS.
UltditHte failure with cplTnlar fill brckai cut due to pundi-tixjugh by the loading ram.
Figure 100. Concrete containment through failure in 13 mm panel.
Final failure:
grid separation
and concrete cracking
Figure 101. Concrete containment through failure in a 38 mm panel.
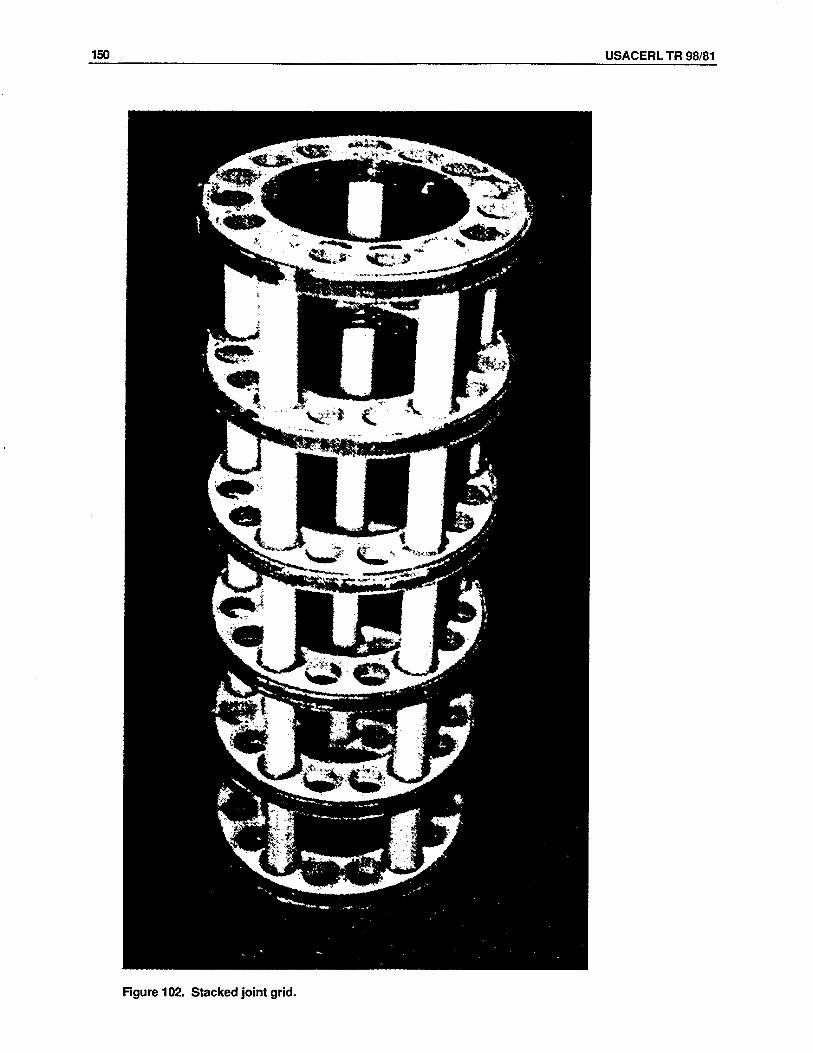
150 USACERL TR 98/81
Figure 102. Stacked joint grid.
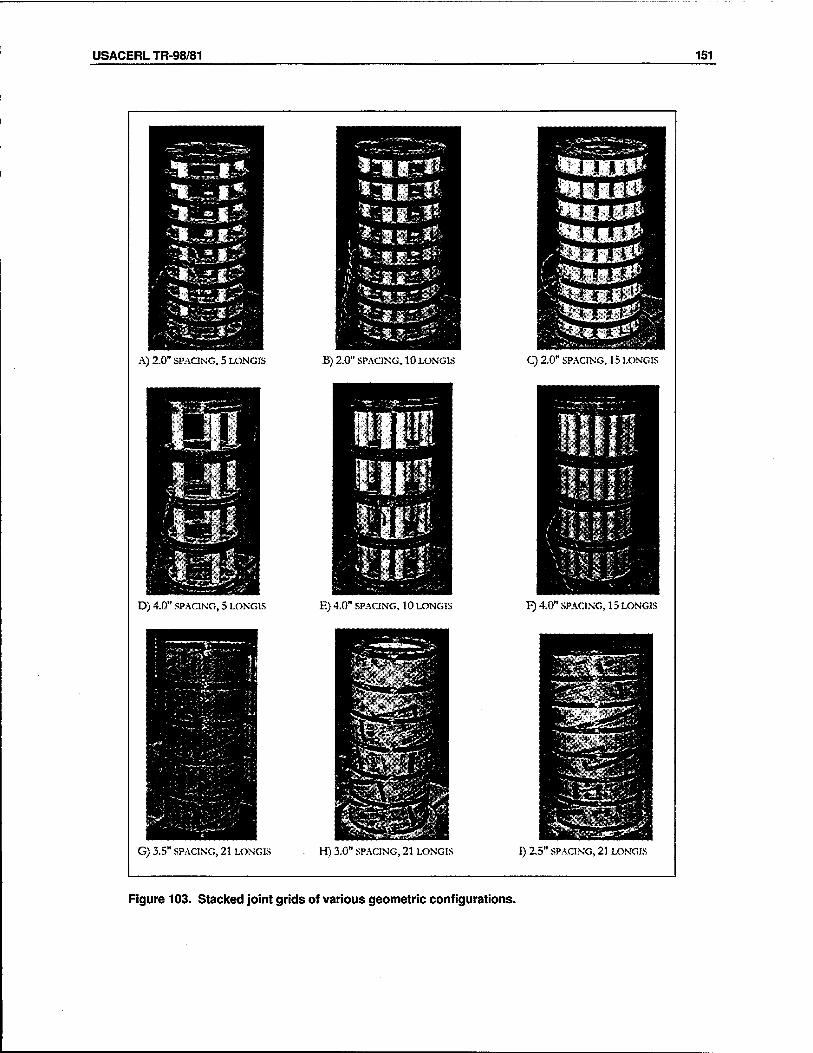
USACERLTR-98/81 151
J-B :Ä*""tir" B3P**
ISJS9 &»fl
A) 2.0" SPACING, 5 LÖNGIS
D) 4.0" SPACING, 3 LONG15
B) 2.0" SPACING, IOLONGIS
E) 4.0" SPACING, IOLONGIS
Q 2.0" SPACING, 15 LONGIS
F) 4.0" SPACING, 15 LONGIS
G) 3.5" SPACING, 21 LONGIS H) 3.0" SPACING, 21 LONGIS I) 2.5" SPACING, 21 LONGIS
Figure 103. Stacked joint grids of various geometric configurations.
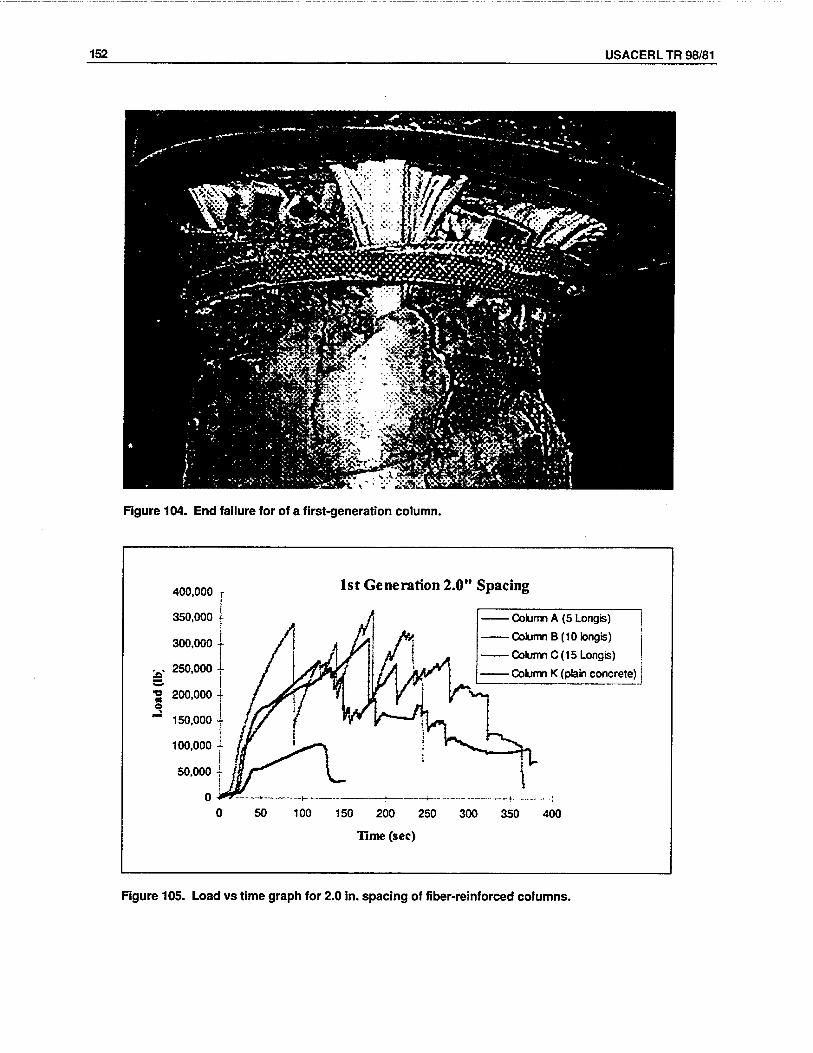
152 USACERL TR 98/81
Figure 104. End failure for of a first-generation column.
1st Generation 2.0" Spacing
Column A (5 Longis)
Column B (10 longis)
Column C (15 Longis)
Column K (plain concrete)
50 100 150 200 250
Time (sec)
300 350 400
Figure 105. Load vs time graph for 2.0 in. spacing of fiber-reinforced columns.
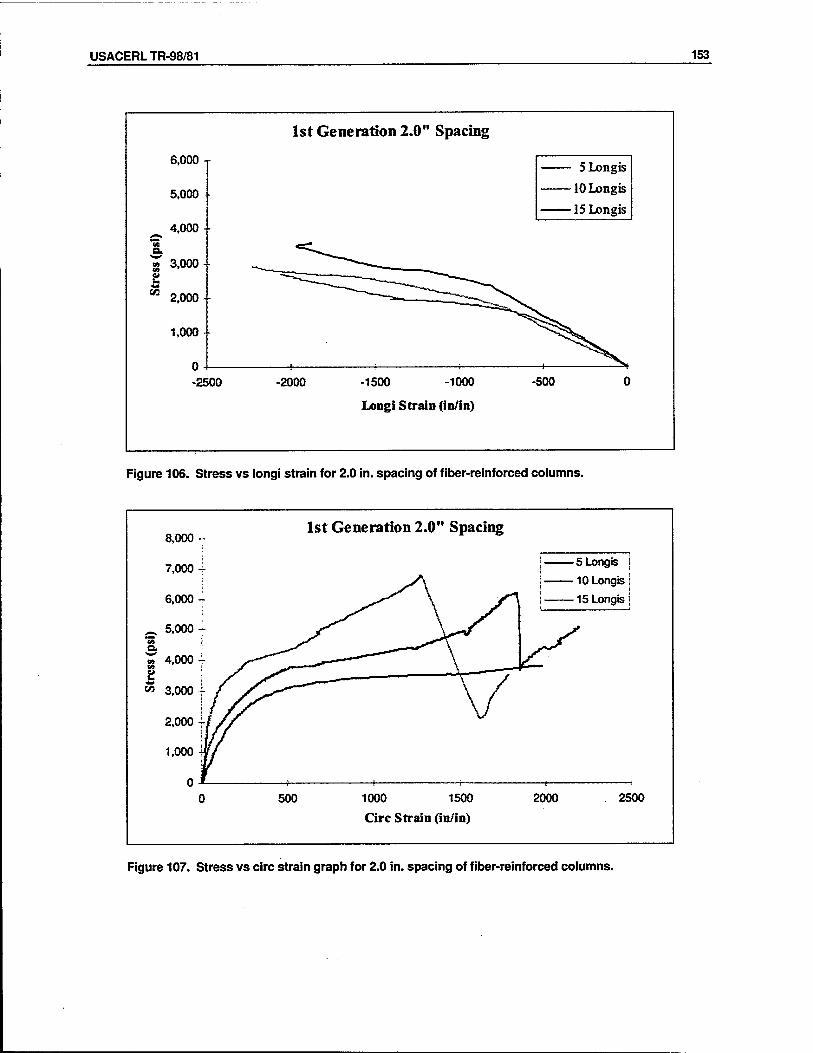
USACERLTR-98/81 153
6,000
5,000
ä 4,000 *35 B.
"ST 3,000
«3 2,000
1,000
1st Generation 2.0" Spacing
-2500 -2000 -1500 -1000
Longi Strain (in/in)
■ 5 Longis
10 Longis
•15 Longis
-500
Figure 106. Stress vs longi strain for 2.0 in. spacing of fiber-reinforced columns.
8,000
7,000 -j-
1st Generation 2.0" Spacing
500 1000 1500
Circ Strain (in/in)
• 5Longis
■ 10 Longis
-15 Longis
2000 2500
Figure 107. Stress vs circ strain graph for 2.0 in. spacing of fiber-reinforced columns.
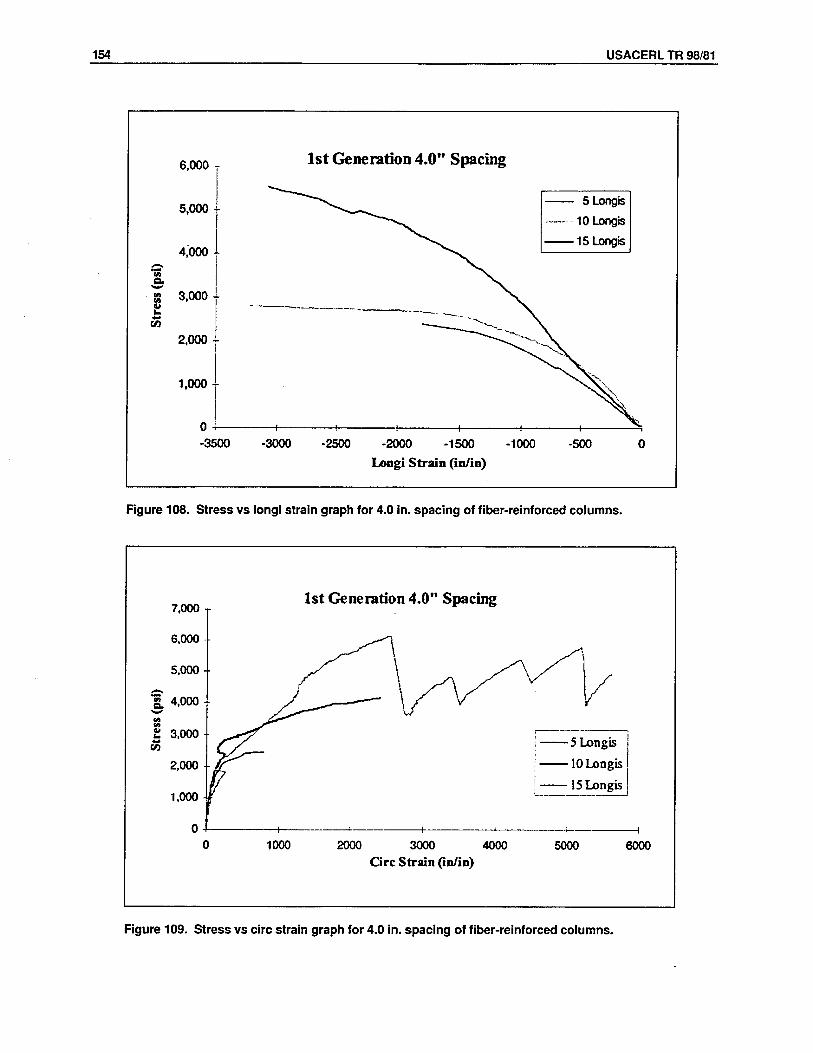
154 USACERL TR 98/81
6,000
5,000 f
4,000
S 3,000 -
tfl
2,000
1,000 -
1st Generation 4.0" Spacing
-3500 -3000 -2500 -2000 -1500
Longi Strain (in/in) -1000
- 5Longis
10 Longis
•15Longis
-500
Figure 108. Stress vs longi strain graph for 4.0 in. spacing of fiber-reinforced columns.
1st Generation 4.0" Spacing
1000 2000 3000 4000 Grc Strain (in/in)
5 Longis
10 Longis
15 Longis
5000 6000
Figure 109. Stress vs circ strain graph for 4.0 in. spacing of fiber-reinforced columns.
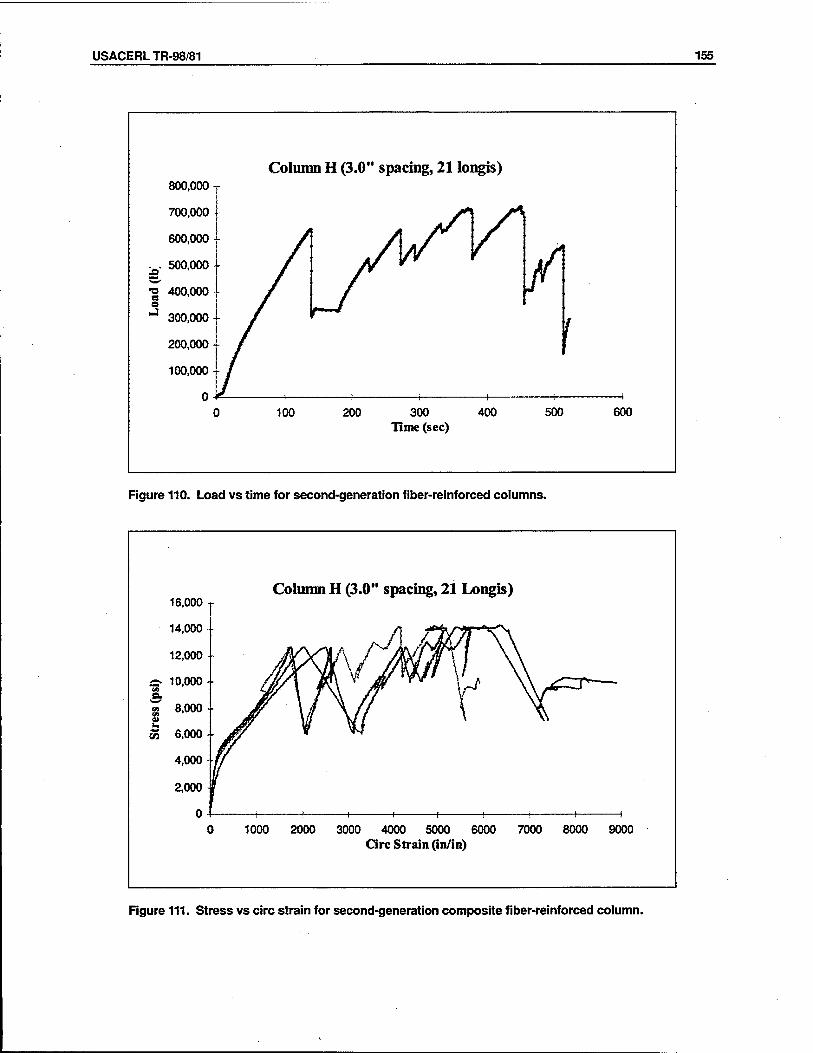
USACERLTR-98/81 155
800,000- Column H (3.0" spacing, 21 longis)
700,000- s\ 600,000 A >r /
Load
(lb
; w
*
»
at
[/ f 200,000- f 100,000
c ) 100 200 300 400 Time (sec)
500 600
Figure 110. Load vs time for second-generation fiber-reinforced columns.
Column H (3.0" spacing, 21 Longis)
1000 2000 3000 4000 5000 6000 Ore Strain (in/in)
7000 8000 9000
Figure 111. Stress vs circ strain for second-generation composite fiber-reinforced column.
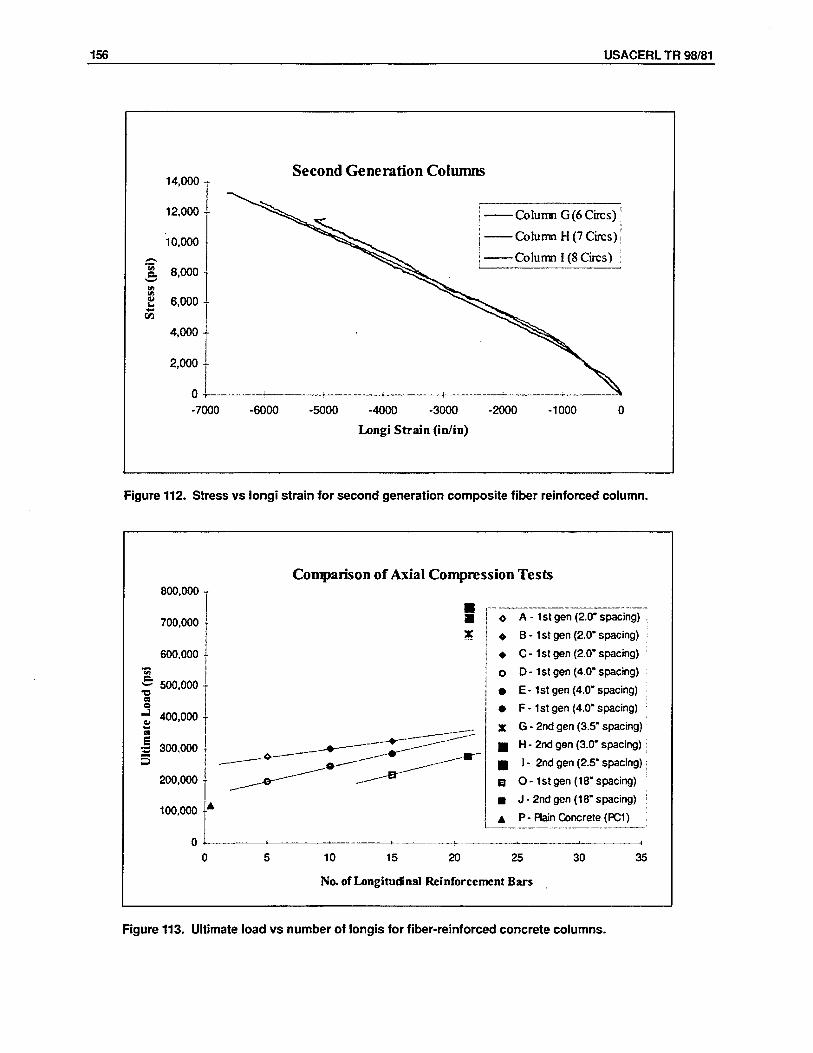
156 USACERL TR 98/81
Second Generation Columns
Column G (6 Circs)
Column H (7 Circs) I
Column 1 (8 Circs) j
-7000 -6000 -5000 -4000 -3000 -2000
Longi Strain (in/in)
-1000
Figure 112. Stress vs longi strain for second generation composite fiber reinforced column.
800,000 T
700,000
600,000 *35 •S 500,000 •a « e •i 400,000 a
J 300,000 - 5
200,000
100,000
0
Comparison of Axial Compression Tests
O A - 1st gen (2.0" spacing) ;
* B-1st gen (2.0" spacing) I
♦ C -1 st gen (2.0" spacing)
o D - 1st gen (4.0* spacing)
• E- 1st gen (4.0" spacing)
• F-1st gen (4.0" spacing)
X G - 2nd gen (3.5" spacing)
B H - 2nd gen (3.0* spacing) i
B I - 2nd gen (2.5" spacing) \
B O-1st gen (18" spacing)
■ J - 2nd gen (18" spacing) j
A P- Rain Concrete (PC1)
10 15 20 25
No. of Longitudinal Reinforcement Bars
30 35
Figure 113. Ultimate load vs number of longis for fiber-reinforced concrete columns.
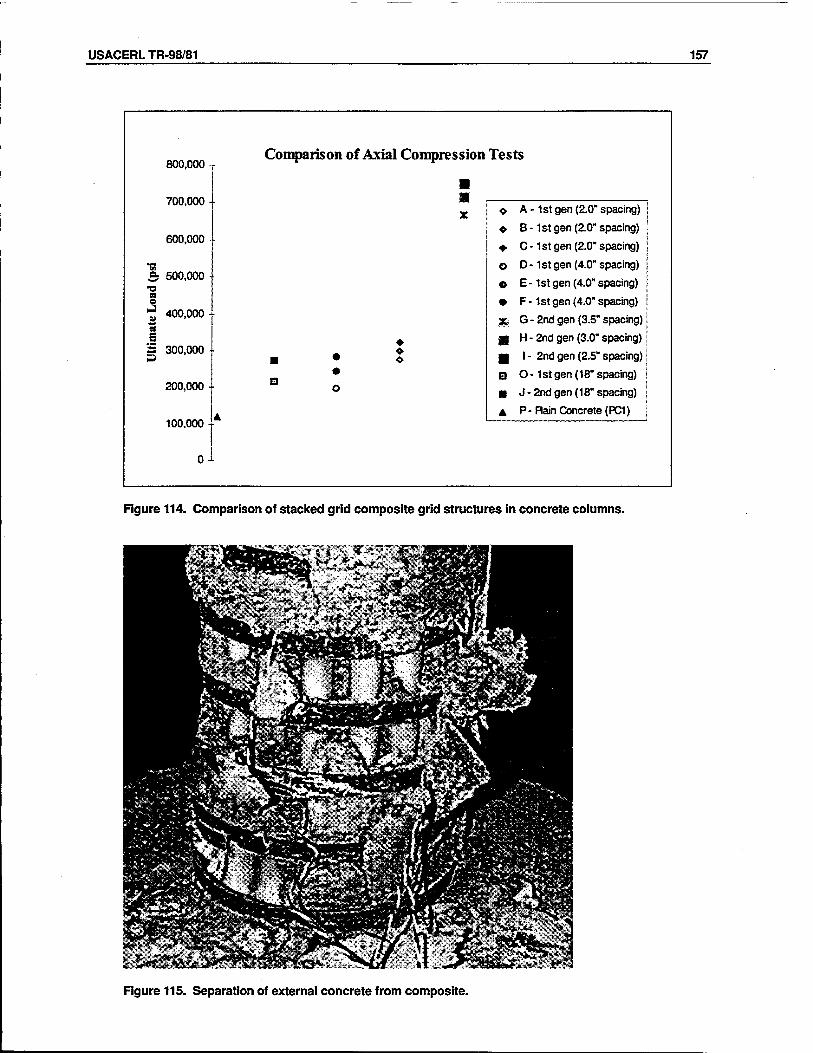
USACERLTR-98/81 157
800,000 Comparison of Axial Compression Teste
700,000 - ■ a X ^ A -1 st gen (2.0" spacing)
600,000 - ^ B - 1st gen (2.0" spacing)
+ C -1 st gen (2.0" spacing)
Sf 500,000 • o D -1 st gen (4.0" spacing)
e E -1 st gen (4.0" spacing) 03 O
^ 400,000- 4*
• F - 1st gen (4.0* spacing)
H G - 2nd gen (3.5" spacing)
Ulti
mi
CO
o
o
o
o
o
%
g H - 2nd gen (3.0" spacing)
B I- 2nd gen (2.5" spacing)
200,000 - •
B 6 m O -1 st gen (18" spacing)
■ J - 2nd gen (18" spacing)
100,000 - ▲ A P - Plain Concrete (PCI)
0
Figure 114. Comparison of stacked grid composite grid structures in concrete columns.
Figure 115. Separation of external concrete from composite.
158 USACERL TR 98/81
USACERL DISTRIBUTION
Chief of Engineers
ATTN: CEHEC-IM-LH (2)
ATTN: CEHEC-IM-LP (2)
ATTN: CEMP-CE
ATTN: CEMP-ET
ATTN: CECC-R
ATTN: CECW-E
ATTN: CECW-ED
ATTN: CECW-EG
ATTN: CERD-C (2)
US Army Engineer District
ATTN: Library (40)
US Army Engineer Divisions
ATTN: Library (11)
Defense Tech Info Center 22304
ATTN: DTIC-0(2)
65
5/98
■ÜV&. GOVERNMENT PRINTING OFFICE: 1998 - 646-081/80010