
Steve Weygandt Stan Benjamin Forecast Systems Laboratory NOAA
37
Hourly RUC Convective Probability Forecasts using Ensembles and Radar Assimilation Steve Weygandt Stan Benjamin Forecast Systems Laboratory NOAA
-
Upload
wang-jensen -
Category
Documents
-
view
26 -
download
0
description
Hourly RUC Convective Probability Forecasts using Ensembles and Radar Assimilation. Steve Weygandt Stan Benjamin Forecast Systems Laboratory NOAA. AUTOMATED CONVECTIVE WEATHER GUIDANCE. PRESENT 0-2 h forecasts from radar extrapolation with growth and decay (nowcasting techniques) - PowerPoint PPT Presentation
Transcript of Steve Weygandt Stan Benjamin Forecast Systems Laboratory NOAA
Hourly RUC Convective Probability Forecasts using
Ensembles and Radar Assimilation
Steve WeygandtStan Benjamin
Forecast Systems LaboratoryNOAA
AUTOMATED CONVECTIVE WEATHER GUIDANCE
PRESENT
• 0-2 h forecasts from radar extrapolation with growth and decay (nowcasting techniques)
• Beyond 2 h guidance from model output helpful
FUTURE
A seamless convective guidance product utilizing a variety of inputs including nowcasts and model ensemble information to provide guidance to humans and automated decision support systems
Model-based Probability Forecasts for Convective Weather
Principle:Convective forecasts at specific model grid points from a single deterministic model run less likely to be correct than averages of model outputs.
Procedure:Aggregate model convective information to larger time/space scales (~1-2 h, 80-100 km)
• Scales should increase with increasing lead time• Scales will decrease as models get better
Ensembles provide technique for aggregating forecast information
Types of ensembles
• Multi-model ensembles
• Initial/boundary condition ensembles
• Model physics ensembles
• Time-lagged model ensembles (2004)
• Model gridpoint ensembles (2003)
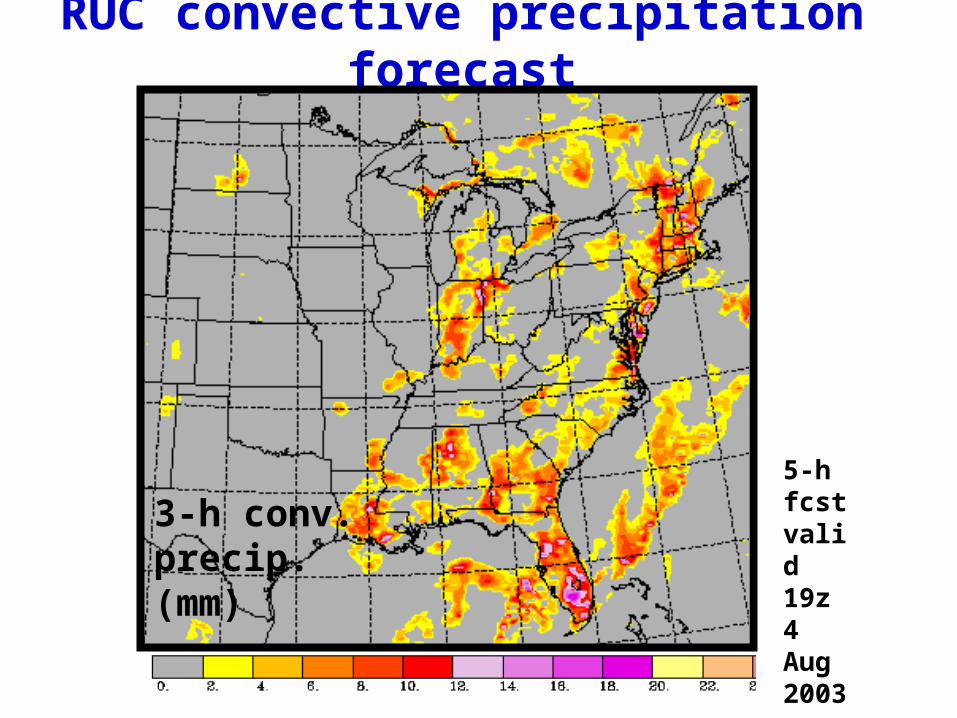
RUC convective precipitation forecast
5-h fcst valid 19z 4 Aug 2003
3-h conv.precip. (mm)
% 10 20 30 40 50 60 70 80 90
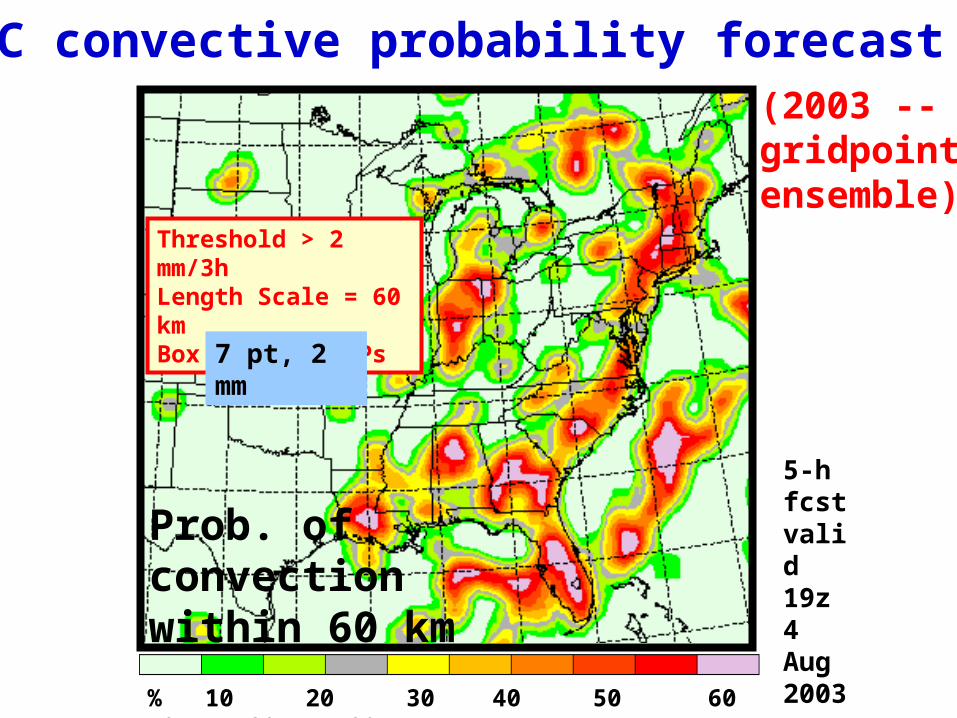
Prob. ofconvectionwithin 60 km
RUC convective probability forecast
5-h fcst valid 19z 4 Aug 2003
Threshold > 2 mm/3hLength Scale = 60 kmBox size = 7 GPs
7 pt, 2 mm
(2003 --gridpointensemble)
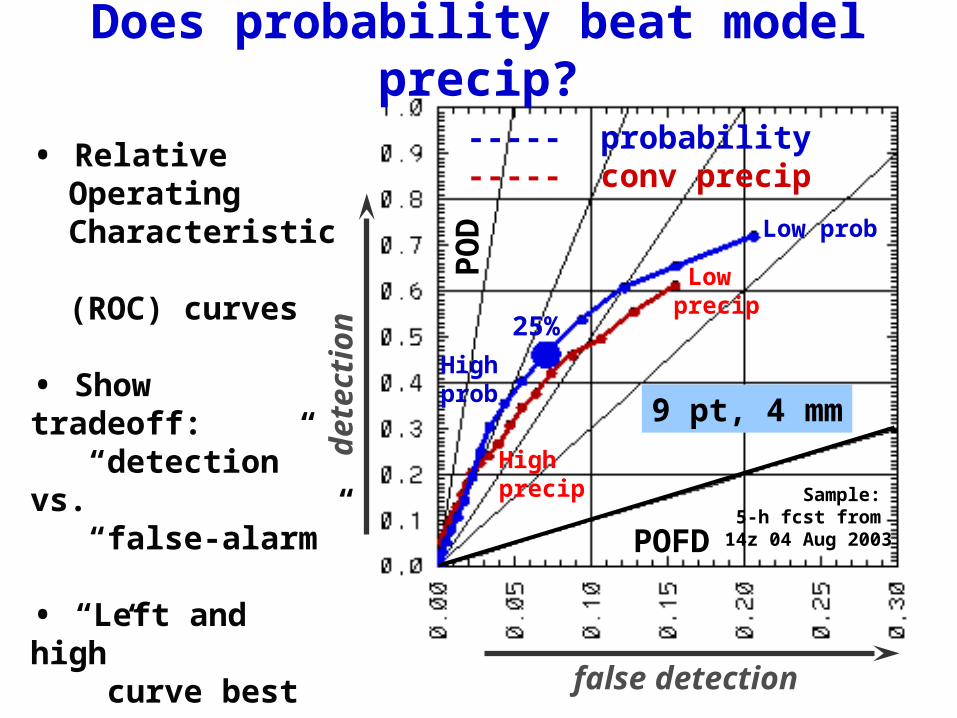
• Relative Operating Characteristic (ROC) curves
• Show tradeoff: “detection” vs. “false-alarm”
• “Left and high” curve best
Does probability beat model precip?
PO
D
POFD
----- probability----- conv precip
Sample: 5-h fcst from
14z 04 Aug 2003
Low prob
Low precip
High precip
High prob
det
ecti
on
false detection
9 pt, 4 mm
25%
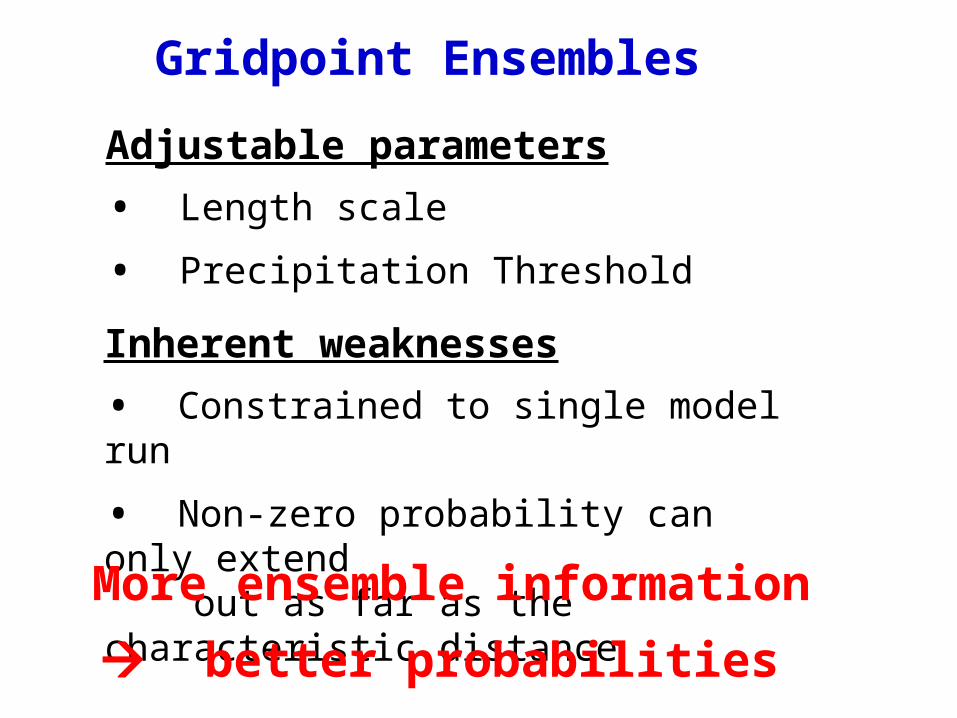
Gridpoint Ensembles
Adjustable parameters
• Length scale
• Precipitation Threshold
Inherent weaknesses
• Constrained to single model run
• Non-zero probability can only extend out as far as the characteristic distance
More ensemble information
better probabilities
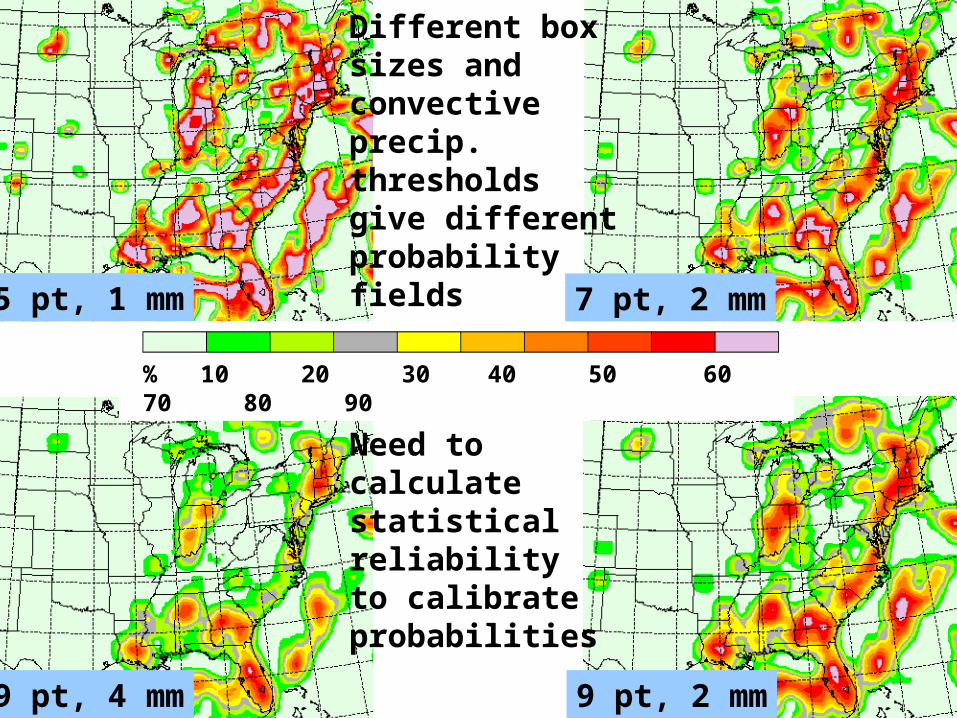
5 pt, 1 mm 7 pt, 2 mm
9 pt, 2 mm9 pt, 4 mm
% 10 20 30 40 50 60 70 80 90
Different box sizes and convectiveprecip.thresholdsgive differentprobabilityfields
Need to calculate statisticalreliabilityto calibrateprobabilities
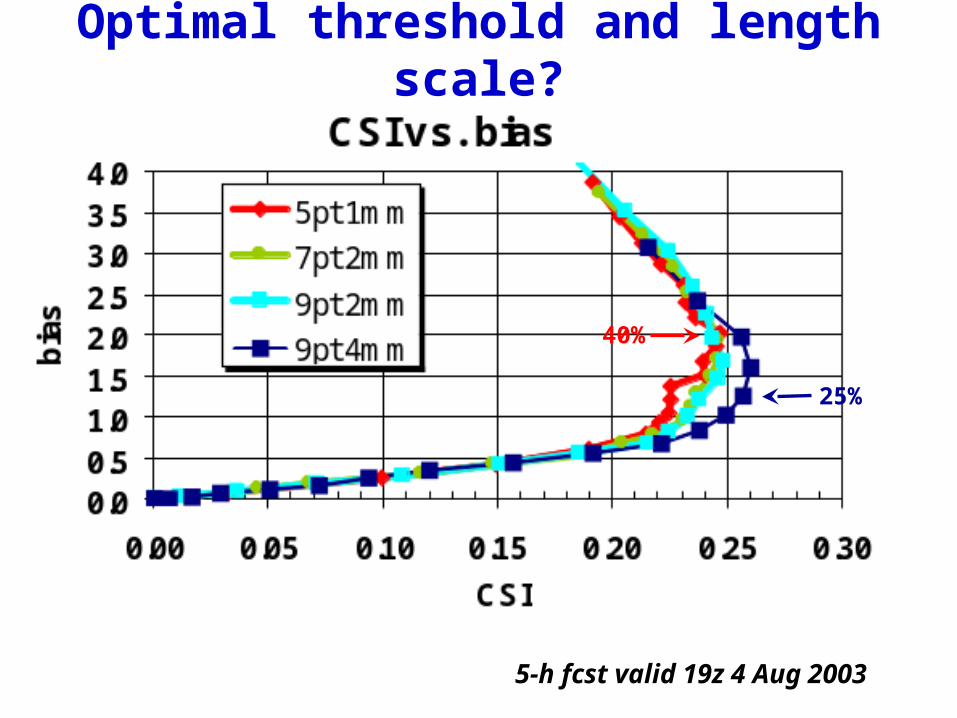
25%
40%
Optimal threshold and length scale?
5-h fcst valid 19z 4 Aug 2003
• Automated convective probability forecast
• Gridded fields derived from model ensembles
• Real-time forecasts started 2003 (RCPFv2003)
• Testing/improvements during 2004 (RCPFv2004)
• 2-, 4-, 6-h forecasts every 2 hours (CCFP guidance)
• Verification of forecasts by RTVS
• AWC evaluation of product during 2005
• Merge with short-range techniques (NCAR/MIT)
RUC Convective Probabilistic Forecast (RCPF) evolution
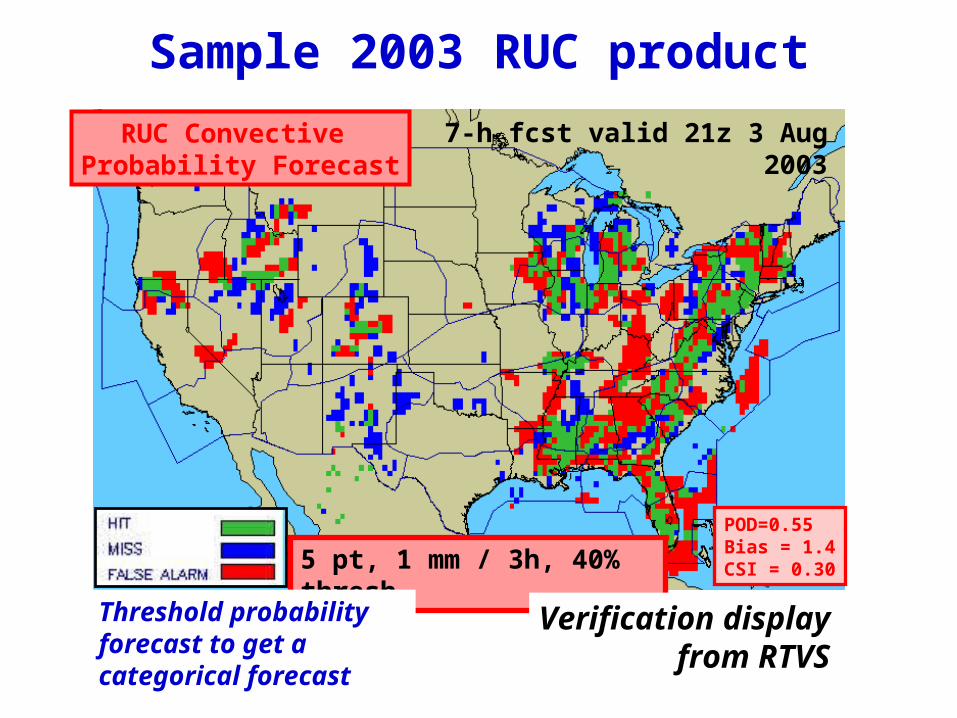
7-h fcst valid 21z 3 Aug 2003
RUC Convective Probability Forecast
POD=0.55Bias = 1.4CSI = 0.305 pt, 1 mm / 3h, 40% thresh
Sample 2003 RUC product
Verification displayfrom RTVS
Threshold probability forecast to get a categorical forecast
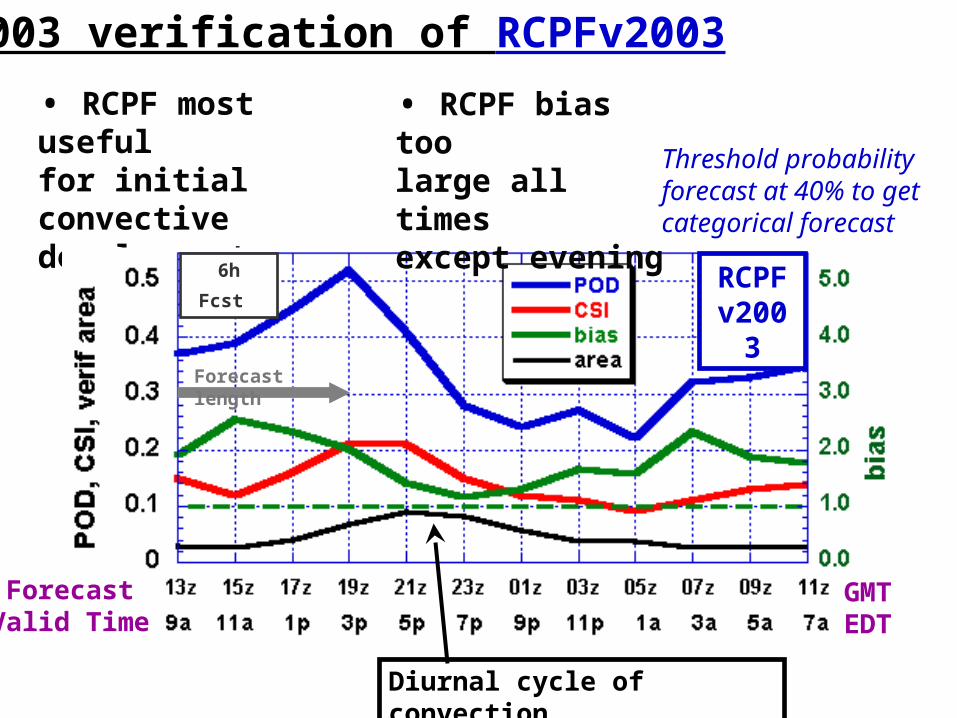
• RCPF most useful for initial convectivedevelopment
2003 verification of RCPFv2003
Forecast length
RCPFv2003
6h Fcst
• RCPF bias too large all timesexcept evening
GMTEDT
Forecast Valid Time
Diurnal cycle of convection
Threshold probability forecast at 40% to get categorical forecast
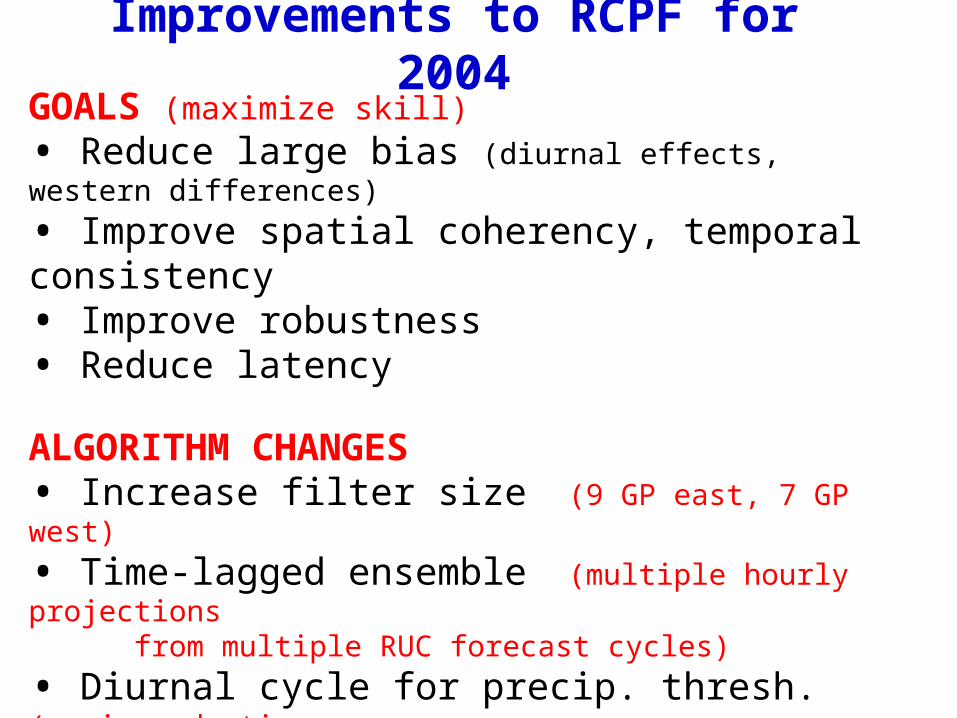
Improvements to RCPF for 2004GOALS (maximize skill)
• Reduce large bias (diurnal effects, western differences)
• Improve spatial coherency, temporal consistency• Improve robustness• Reduce latency
ALGORITHM CHANGES• Increase filter size (9 GP east, 7 GP west)
• Time-lagged ensemble (multiple hourly projections from multiple RUC forecast cycles)
• Diurnal cycle for precip. thresh. (maximum daytime, minimum nightime; smaller value in the west)
• Increase forecast lead time one hour (eg: 6-h fcst from 13z valid 19z available at 1245z instead of 1345z)
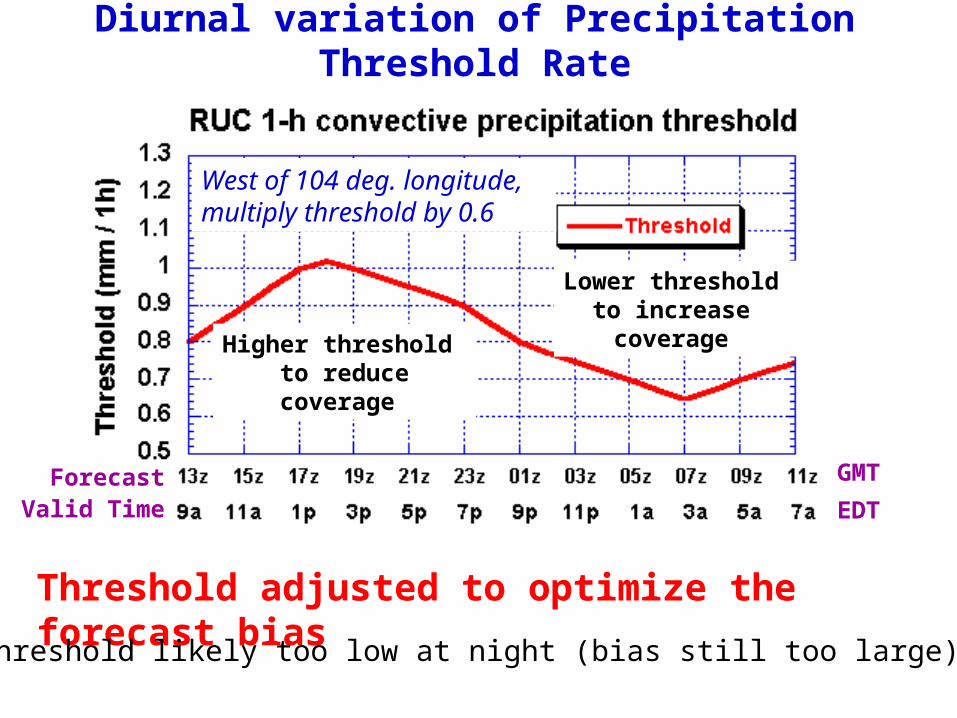
Threshold adjusted to optimize the forecast bias
Diurnal variation of Precipitation Threshold Rate
ForecastValid Time
GMT
EDT
Higher threshold to reducecoverage
Lower threshold to increase coverage
West of 104 deg. longitude, multiply threshold by 0.6
- Threshold likely too low at night (bias still too large)
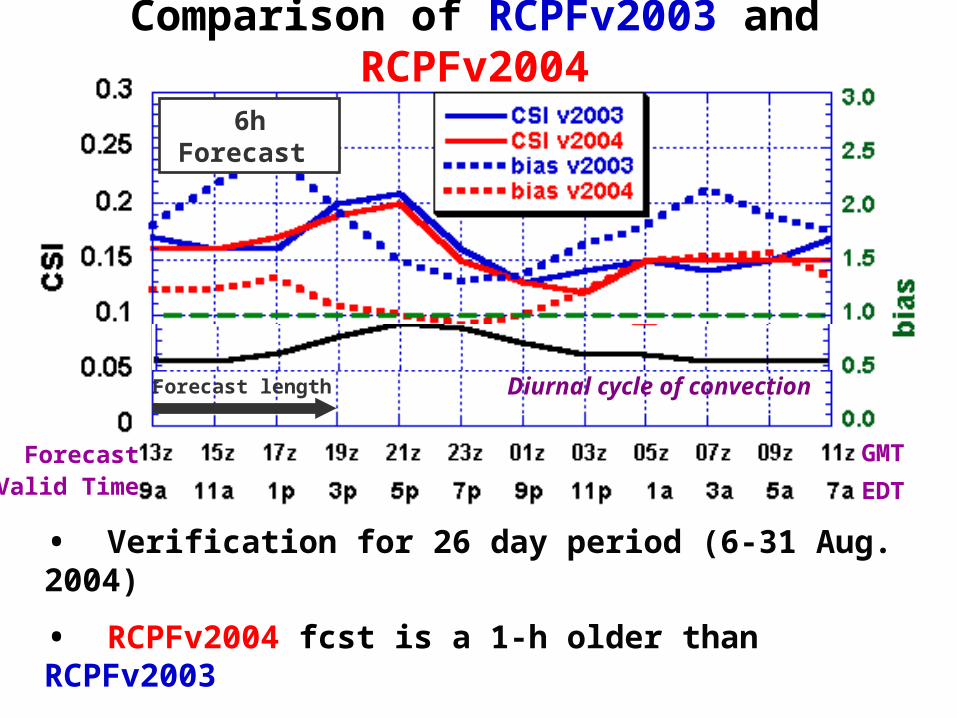
• Verification for 26 day period (6-31 Aug. 2004)
• RCPFv2004 fcst is a 1-h older than RCPFv2003
RCPFv2004 has similar CSI, much improved bias
Comparison of RCPFv2003 and RCPFv2004
Forecast length
ForecastValid Time
GMT
EDT
6h Forecast
Diurnal cycle of convection
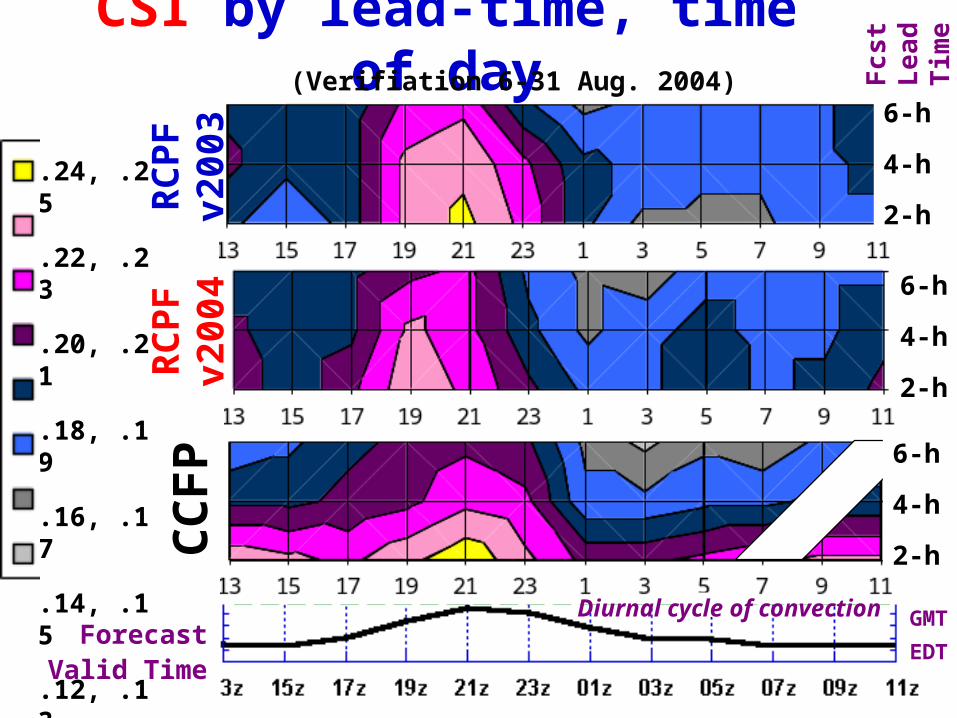
.24, .25
.22, .23
.20, .21
.18, .19
.16, .17
.14, .15
.12, .13
.10, .11
CSI by lead-time, time of day
ForecastValid Time
GMT
EDT
Diurnal cycle of convection
6-h
4-h
2-h
6-h
4-h
2-h
6-h
4-h
2-h
RC
PF
v200
4R
CP
Fv2
003
CC
FP
(Verifiation 6-31 Aug. 2004) Fcst
Lead
Tim
e
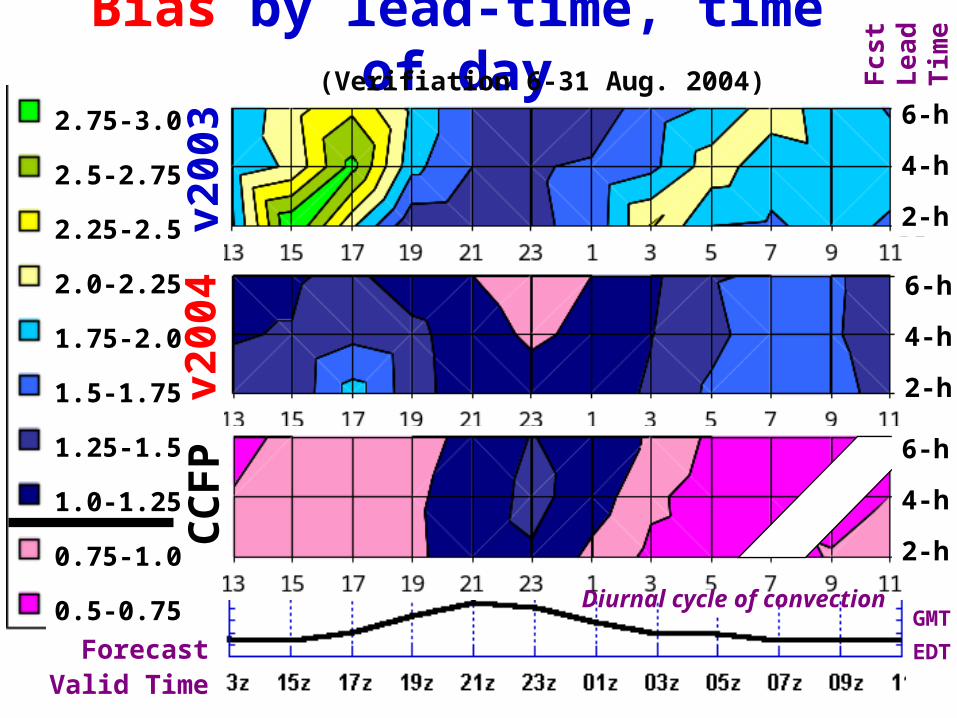
Bias by lead-time, time of day
GMT
EDT
Diurnal cycle of convection
6-h
4-h
2-h
6-h
4-h
2-h
6-h
4-h
2-h
2.75-3.0
2.5-2.75
2.25-2.5
2.0-2.25
1.75-2.0
1.5-1.75
1.25-1.5
1.0-1.25
0.75-1.0
0.5-0.75
v200
4v2
003
CC
FP
(Verifiation 6-31 Aug. 2004)
ForecastValid Time
Fcst
Lead
Tim
e
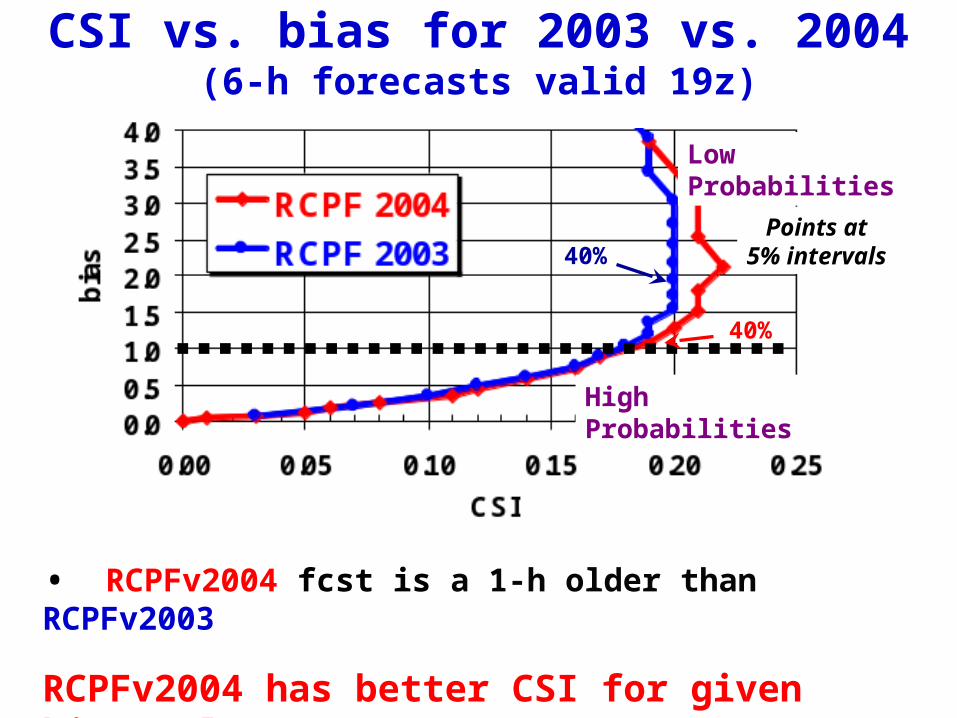
40%
40%
CSI vs. bias for 2003 vs. 2004(6-h forecasts valid 19z)
• RCPFv2004 fcst is a 1-h older than RCPFv2003
RCPFv2004 has better CSI for given bias value
Points at 5% intervals
Low Probabilities
High Probabilities
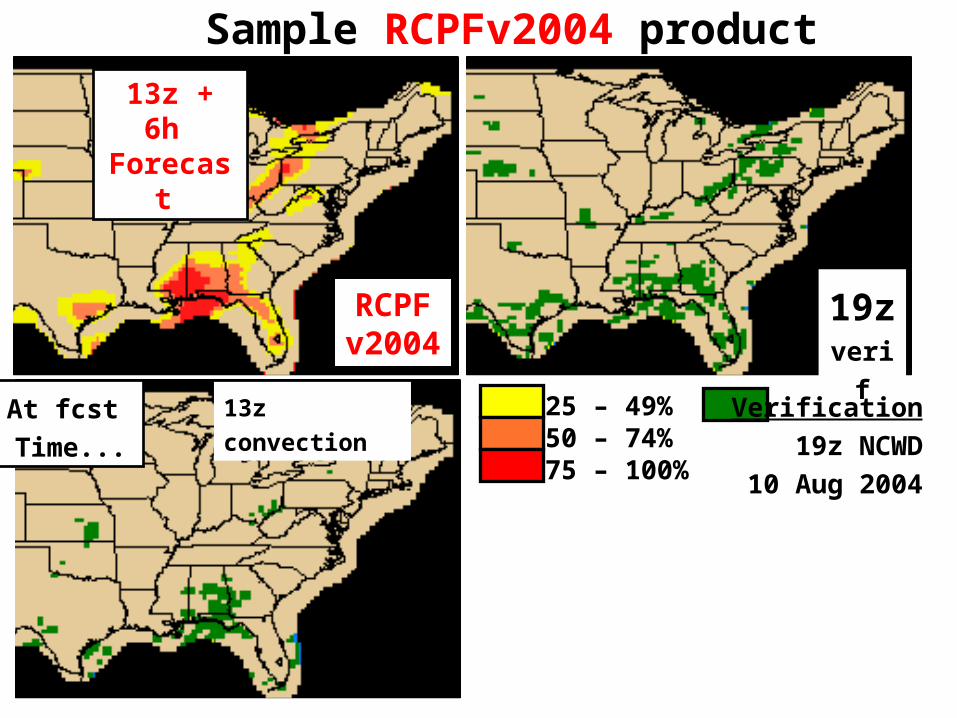
13z convectionAt fcst
Time...
19z verif
RCPFv2004
Sample RCPFv2004 product
25 – 49%50 – 74%75 – 100%
Verification
19z NCWD
10 Aug 2004
13z + 6h Forecast
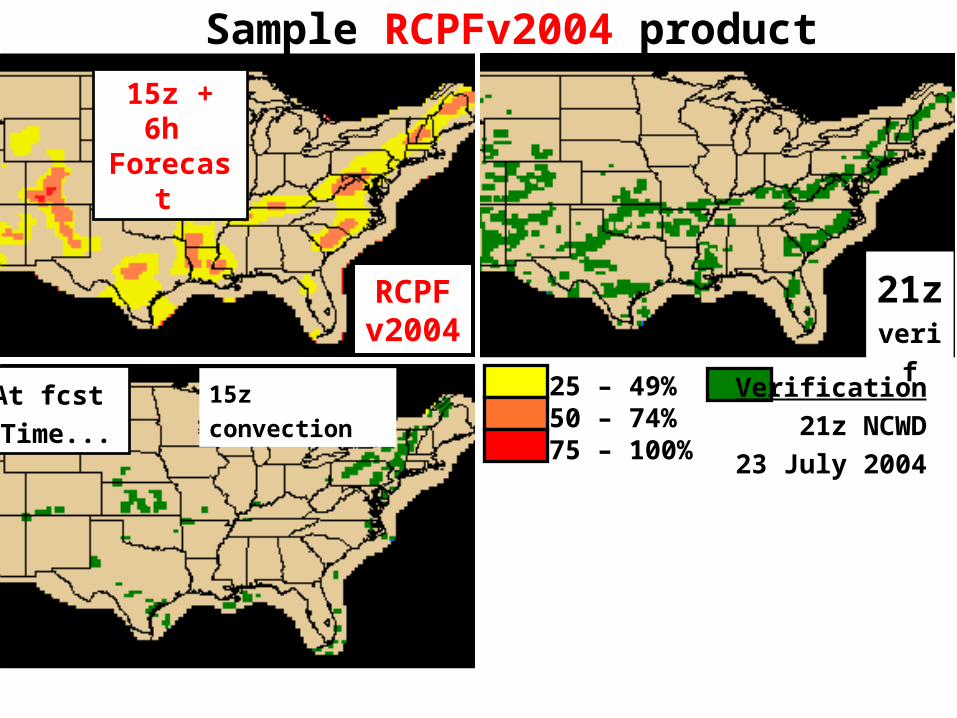
15z convectionAt fcst
Time...
RCPFv2004
15z + 6h Forecast
21z verif
Sample RCPFv2004 product
25 – 49%50 – 74%75 – 100%
Verification
21z NCWD
23 July 2004
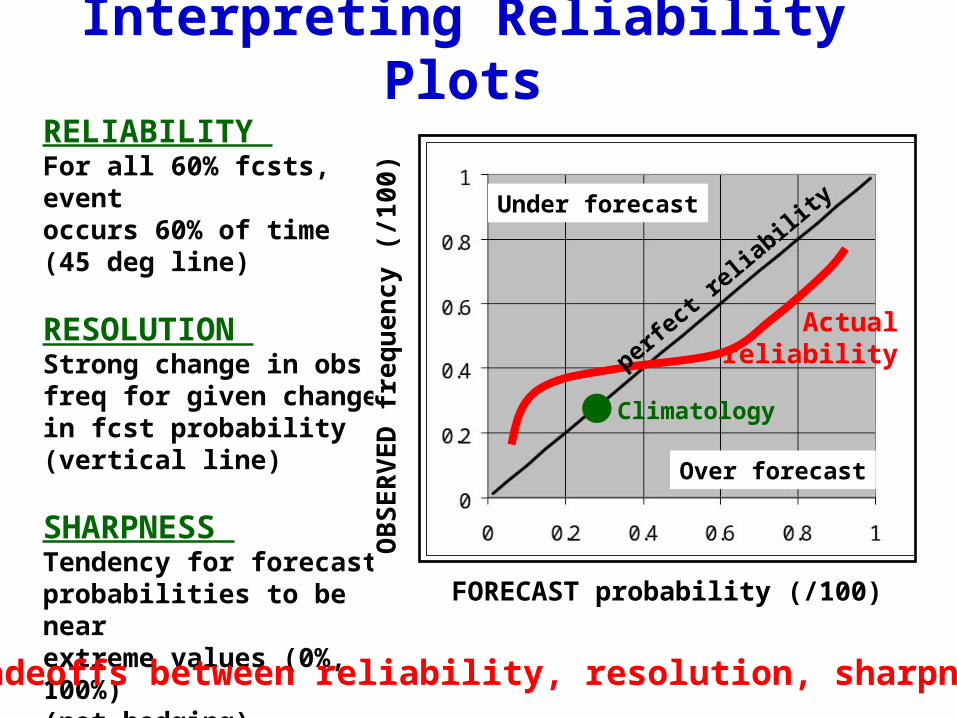
RELIABILITY For all 60% fcsts, eventoccurs 60% of time (45 deg line)
RESOLUTION Strong change in obsfreq for given changein fcst probability(vertical line)
SHARPNESS Tendency for forecast probabilities to be nearextreme values (0%, 100%)(not hedging)
Tradeoffs between reliability, resolution, sharpness
FORECAST probability (/100)
OB
SE
RV
ED
fre
qu
en
cy
(/1
00)
Under forecast
Over forecast
Climatology
perfect r
eliabilit
y
Actualreliability
Interpreting Reliability Plots
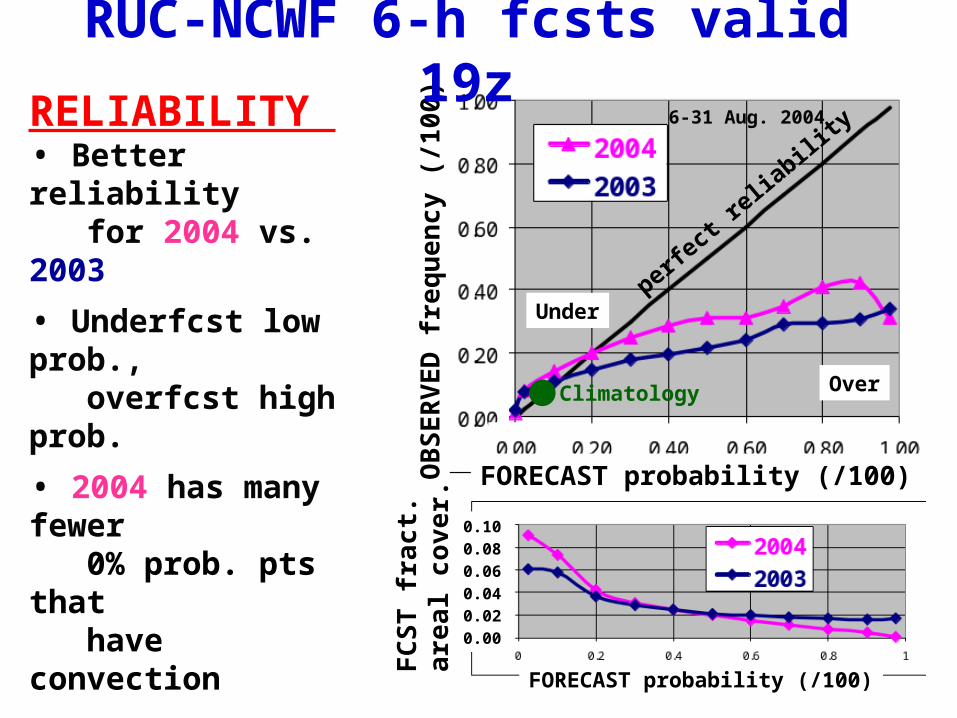
RELIABILITY • Better reliability for 2004 vs. 2003
• Underfcst low prob., overfcst high prob.
• 2004 has many fewer 0% prob. pts that have convection
Fractional Coverage • 2004 has more low prob. pts, fewer high prob. pts
• 2004 has fewer 0% prob. pts (not shown)
FORECAST probability (/100)
OB
SE
RV
ED
fre
qu
en
cy
(/1
00)
Climatology
perfect r
eliabilit
y
RUC-NCWF 6-h fcsts valid 19z
Under
Over
0.100.080.060.040.020.00F
CS
T f
rac
t.a
real
co
ve
r.
FORECAST probability (/100)
6-31 Aug. 2004
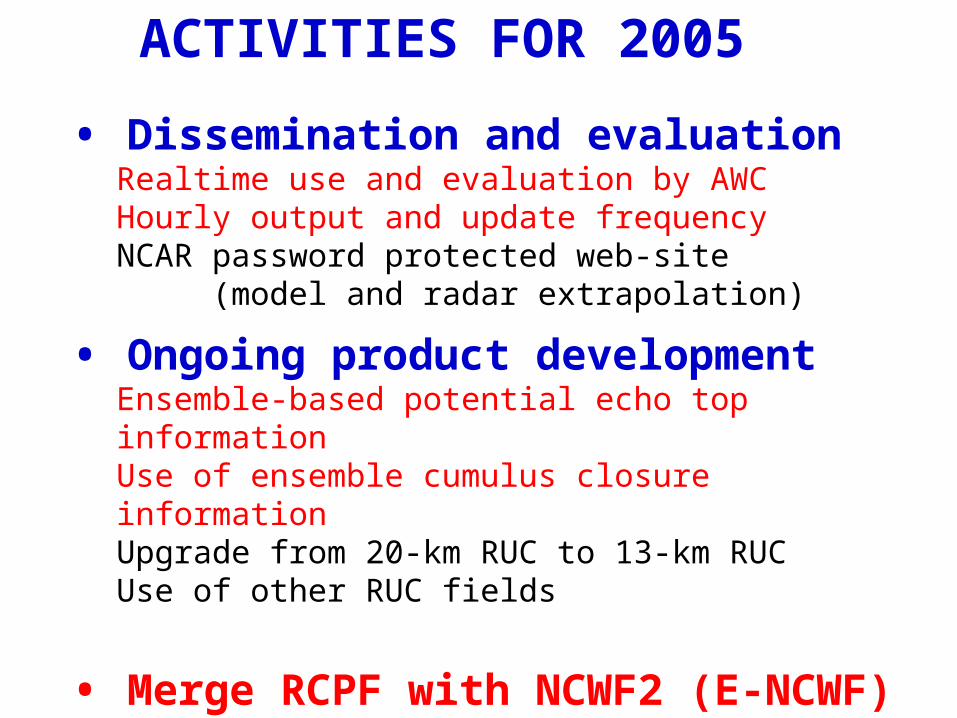
ACTIVITIES FOR 2005
• Dissemination and evaluationRealtime use and evaluation by AWCHourly output and update frequencyNCAR password protected web-site
(model and radar extrapolation)
• Ongoing product developmentEnsemble-based potential echo top informationUse of ensemble cumulus closure informationUpgrade from 20-km RUC to 13-km RUCUse of other RUC fields
• Merge RCPF with NCWF2 (E-NCWF)
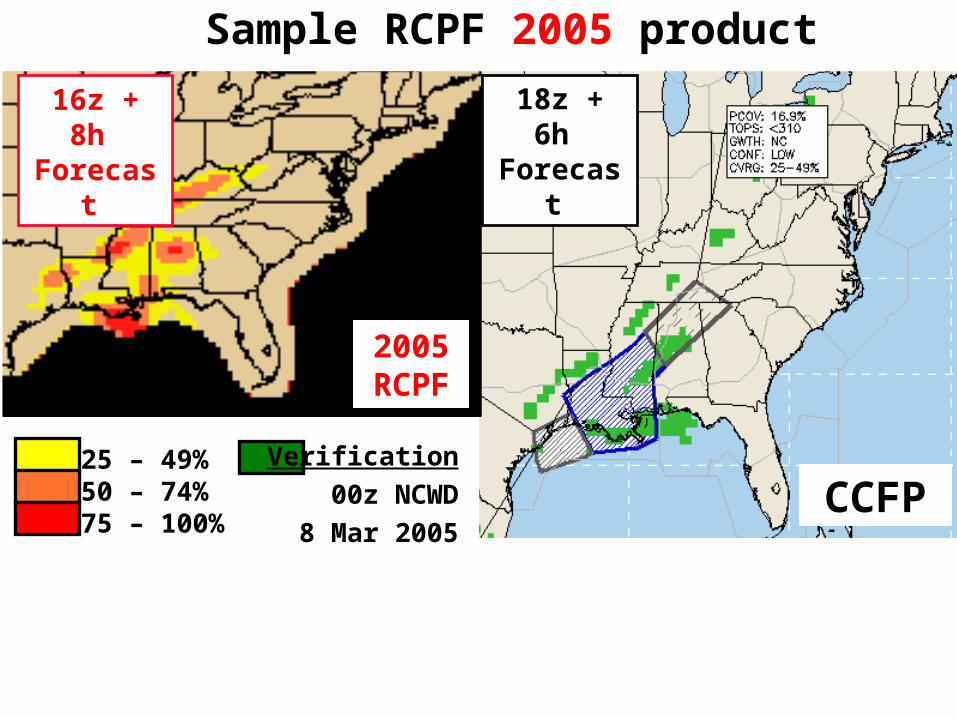
2005RCPF
16z + 8h Forecast
Sample RCPF 2005 product
25 – 49%50 – 74%75 – 100%
Verification
00z NCWD
8 Mar 2005CCFP
18z + 6h Forecast
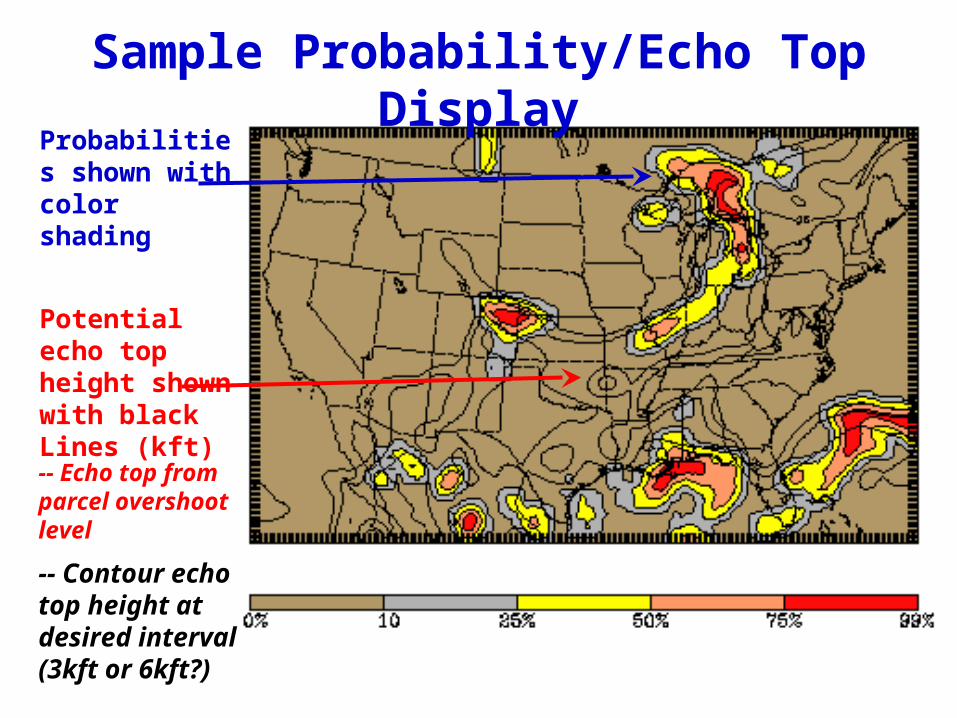
Sample Probability/Echo Top Display
Probabilities shown with color shading
Potentialecho topheight shown with black Lines (kft)
-- Echo top from parcel overshoot level
-- Contour echo top height at desired interval(3kft or 6kft?)
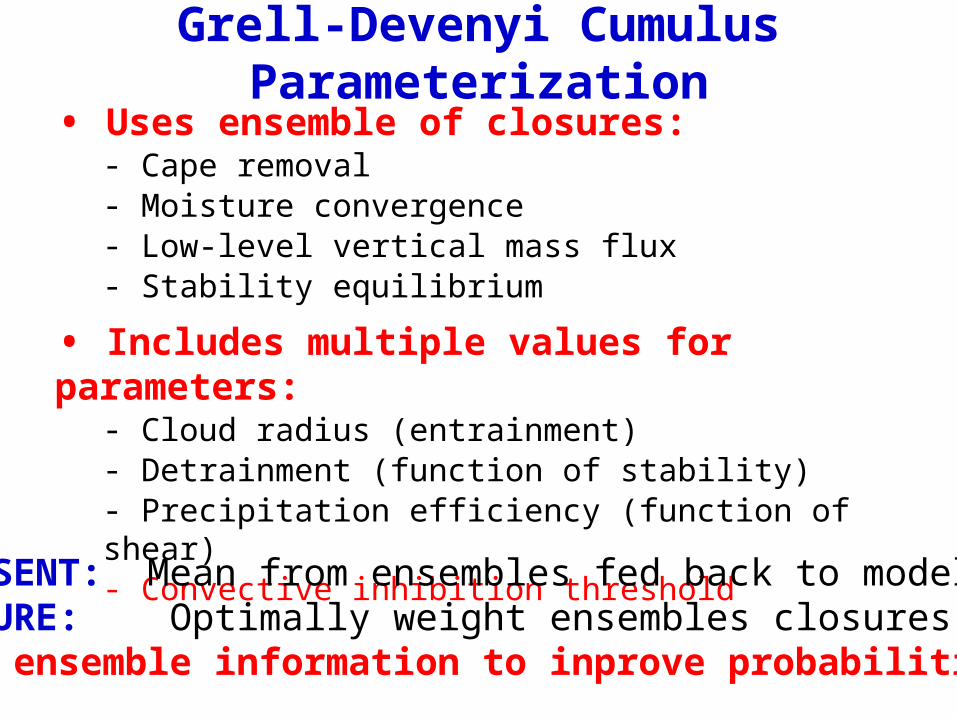
Grell-Devenyi Cumulus Parameterization
• Uses ensemble of closures:- Cape removal - Moisture convergence- Low-level vertical mass flux- Stability equilibrium
• Includes multiple values for parameters:- Cloud radius (entrainment) - Detrainment (function of stability)- Precipitation efficiency (function of shear)- Convective inhibition threshold
PRESENT: Mean from ensembles fed back to modelFUTURE: Optimally weight ensembles closures,Use ensemble information to inprove probabilities
2 hr Nowcast(scale - 60 km)
Fo
rec
as
tP
erf
orm
an
ce
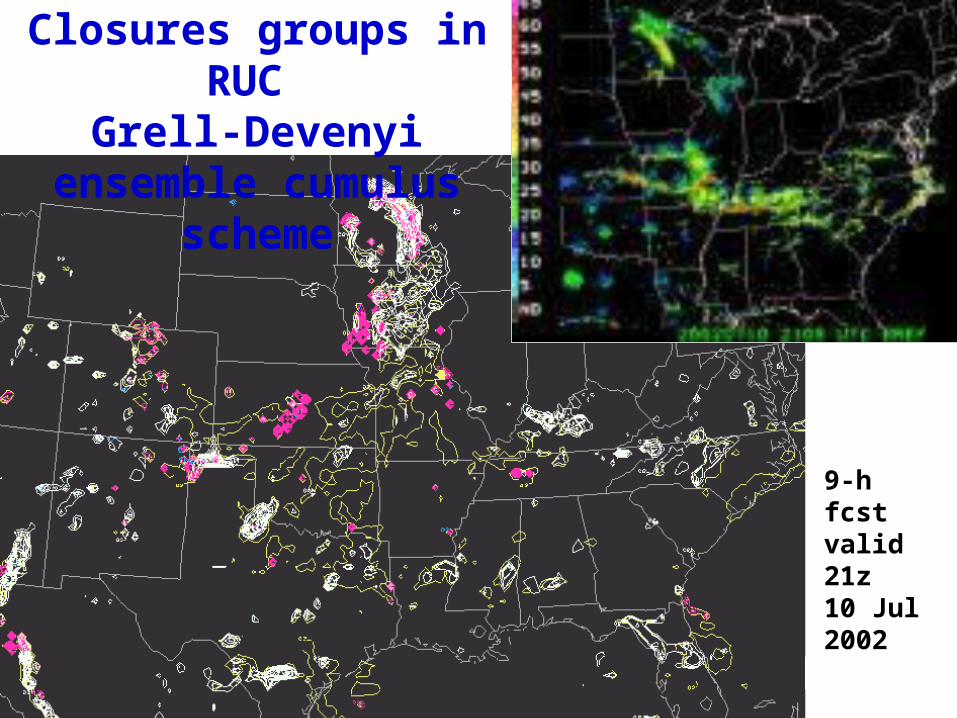
Closures groups in RUC Grell-Devenyi ensemble
cumulus scheme
Radar2100 UTC
10 July, 20029-h
fcst valid 21z 10 Jul 2002
STRENGTHS OF MODEL GUIDANCE
• Capturing initial convective development• Long lead-time and early morning forecasts
Improvements to the model and assimilation system lead directly toimprovements in probability forecasts
For RUC model:
• Assimilate surface obs throughout PBL• 13-km horizontal resolution (June 2005)• Radar data assimilation• Full North American coverage (2007)
ISSUES FOR MODEL GUIDANCE
• Short-range forecasts (spin-up problem)Poor performance for short-range forecastdoes not invalidate longer-range forecasts
• Propagation of convective systems
• Robustness (spurious convection, complete misses)
• Model bias issues
Differences for parameterized vs.explicit treatments of convection
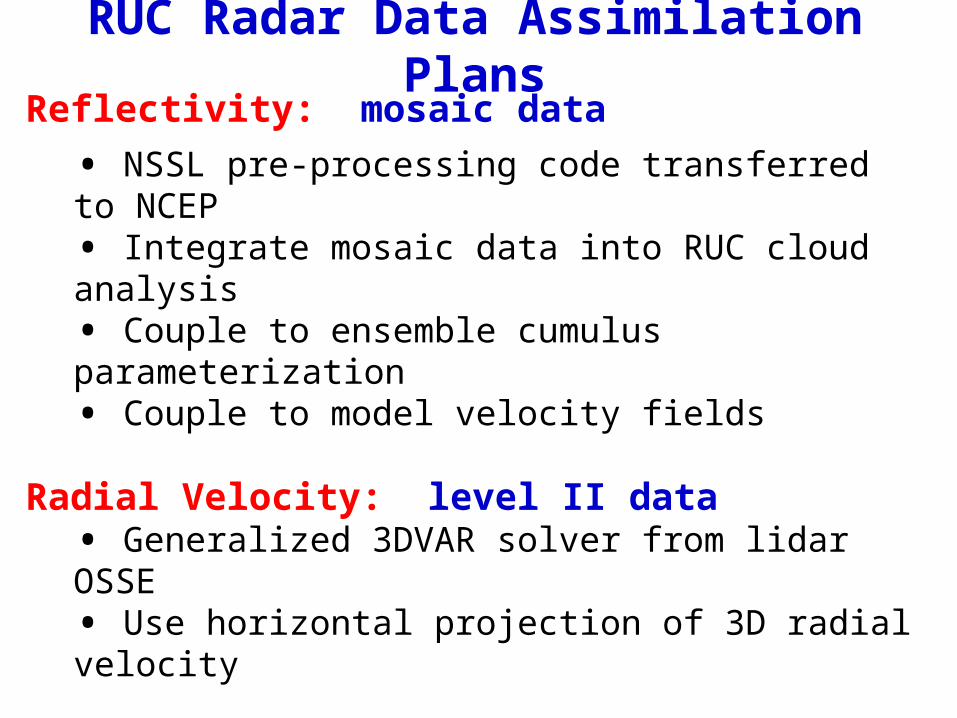
Reflectivity: mosaic data
• NSSL pre-processing code transferred to NCEP • Integrate mosaic data into RUC cloud analysis• Couple to ensemble cumulus parameterization• Couple to model velocity fields
Radial Velocity: level II data • Generalized 3DVAR solver from lidar OSSE • Use horizontal projection of 3D radial velocity
Outstanding Issues
- Data thinning/superobbing - Quality Control (AP, 2nd trip, unfolding, birds,) - Optimal uses (clear-air, stratiform precip., t-storms)
RUC Radar Data Assimilation Plans
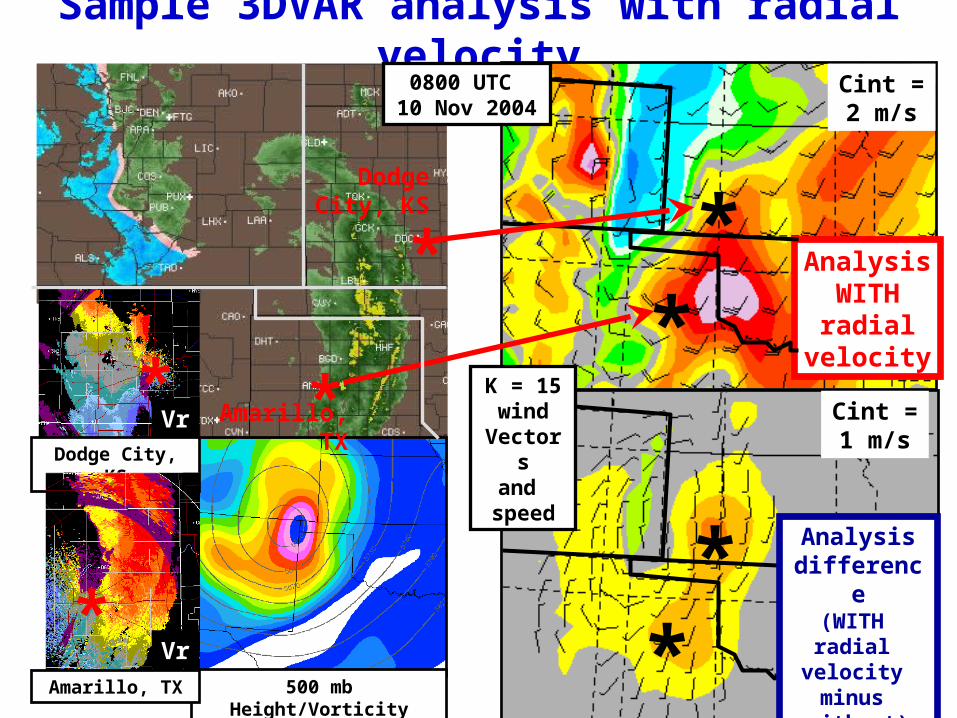
Sample 3DVAR analysis with radial velocity
500 mb Height/Vorticity
*Amarillo, TX
DodgeCity, KS
*
*
*
AnalysisWITHradial
velocity
**
Cint =2 m/s
**
Cint =1 m/s
K = 15wind
Vectors
and speed
0800 UTC 10 Nov 2004
Dodge City, KS
Vr
Amarillo, TX
Vr
*
*
Analysisdifference
(WITH radial
velocity minus
without)

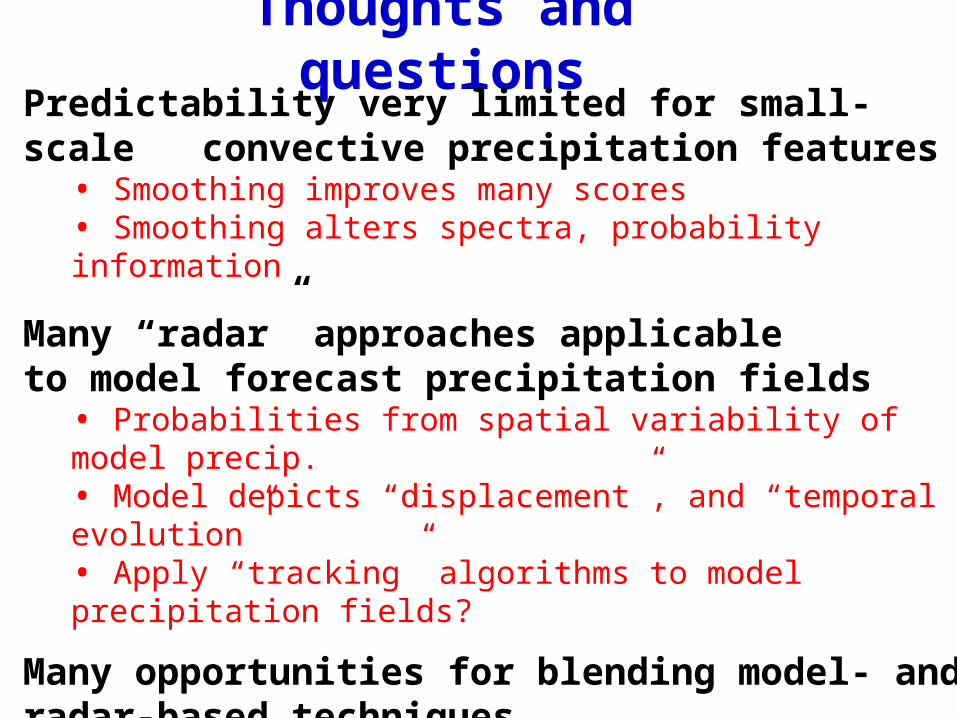
Thoughts and questionsPredictability very limited for small-scale convective precipitation features
• Smoothing improves many scores• Smoothing alters spectra, probability information
Many “radar” approaches applicableto model forecast precipitation fields
• Probabilities from spatial variability of model precip.• Model depicts “displacement”, and “temporal evolution”• Apply “tracking” algorithms to model precipitation fields?
Many opportunities for blending model- andradar-based techniques
• Need extensive comparison to find “break even” points• Assess ability of radar and model for different tasks• Merge radar structure with model favored regions?
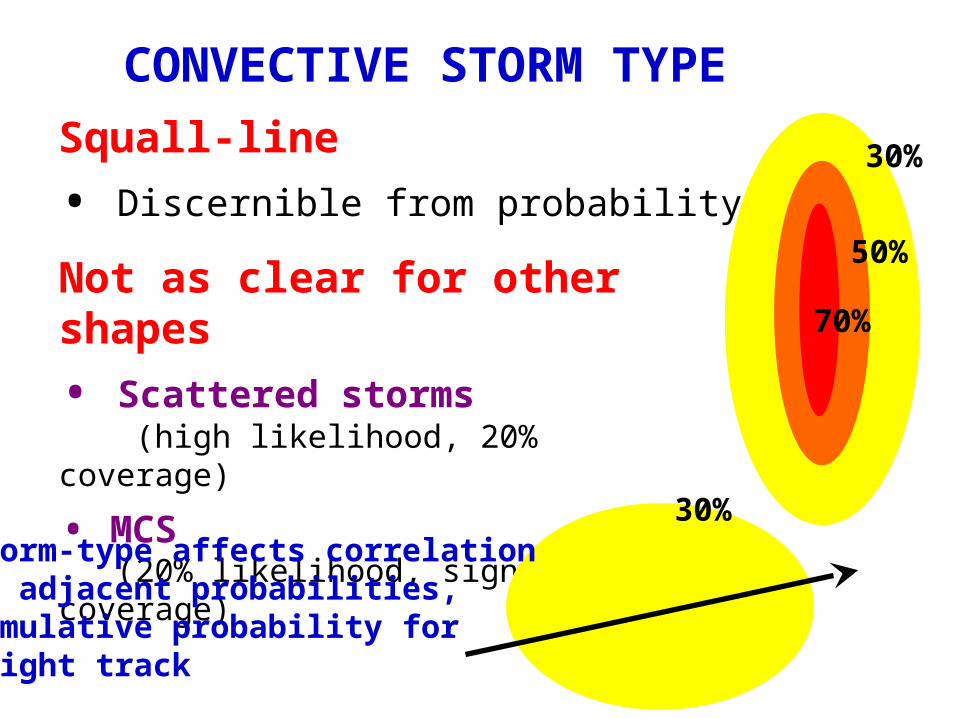
CONVECTIVE STORM TYPE
Squall-line
• Discernible from probability shape30%
50%
70%Not as clear for other shapes
• Scattered storms (high likelihood, 20% coverage)
• MCS (20% likelihood, significant coverage)
30%Storm-type affects correlation of adjacent probabilities,cumulative probability forflight track
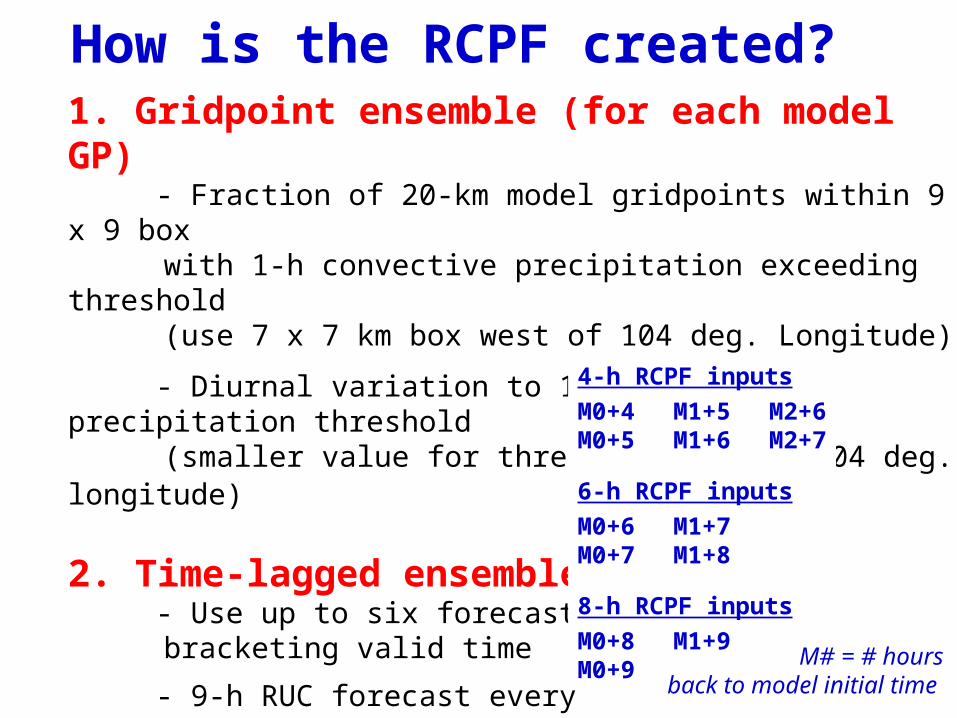
How is the RCPF created?1. Gridpoint ensemble (for each model GP) - Fraction of 20-km model gridpoints within 9 x 9 box
with 1-h convective precipitation exceeding threshold(use 7 x 7 km box west of 104 deg. Longitude)
- Diurnal variation to 1-h convective precipitation threshold(smaller value for threshold west of 104 deg. longitude)
2. Time-lagged ensemble - Use up to six forecasts
bracketing valid time
- 9-h RUC forecast everyhour with hourly output
- 2-h latency to RUC modelforecast output
4-h RCPF inputs
M0+4 M1+5 M2+6M0+5 M1+6 M2+7
6-h RCPF inputs
M0+6 M1+7M0+7 M1+8
8-h RCPF inputs
M0+8 M1+9M0+9
M# = # hoursback to model initial time
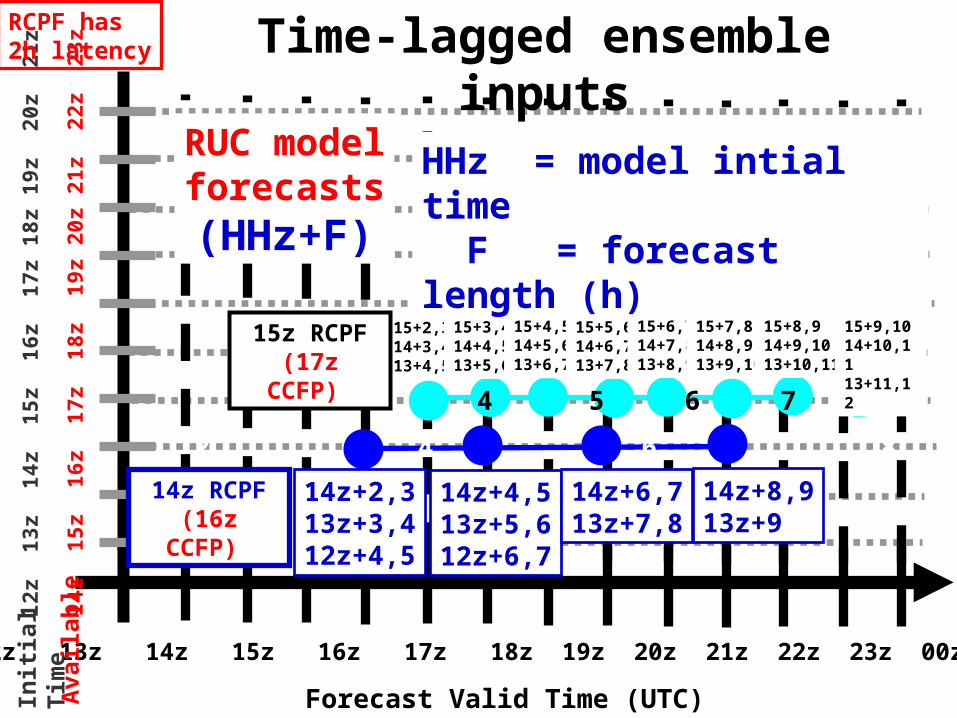
Time-lagged ensemble inputs
Forecast Valid Time (UTC)
12z 13z 14z 15z 16z 17z 18z 19z 20z 21z 22z 23z 00z
RUC modelforecasts(HHz+F)
Init
ial
Tim
e 1
4z
15
z 1
6z
17
z 1
8z
19
z 2
0z
21
z 2
2z
23
z
12
z 1
3z
14
z 1
5z
16
z 1
7z
18
z 1
9z
20
z 2
1z
Availab
le
RCPF has 2h latency
2 4 6 8
14z+2,313z+3,412z+4,5
14z+4,513z+5,612z+6,7
14z+6,713z+7,8
14z+8,913z+9
2 3 4 5 6 7 8 9
15+2,314+3,413+4,5
15+3,414+4,513+5,6
15+4,514+5,613+6,7
15+5,614+6,713+7,8
15+6,714+7,813+8,9
15+7,814+8,913+9,10
15+8,914+9,1013+10,11
15+9,1014+10,1113+11,12
HHz = model intial time F = forecast length (h)
14z RCPF(16z
CCFP)
15z RCPF(17z
CCFP)


