Steel Wire Garment Hangers From China - · PDF filereason of less-than-fair-value imports of...
128
Steel Wire Garment Hangers From China Investigation No. 731-TA-1123 (Preliminary) Publication 3951 October 2007 Washington, DC 20436
Transcript of Steel Wire Garment Hangers From China - · PDF filereason of less-than-fair-value imports of...

Steel Wire Garment HangersFrom China
Investigation No. 731-TA-1123 (Preliminary)
Publication 3951 October 2007
Washington, DC 20436

U.S. International Trade Commission
COMMISSIONERS
Daniel R. Pearson, ChairmanShara L. Aranoff, Vice Chairman
Deanna Tanner OkunCharlotte R. Lane
Irving A. WilliamsonDean A. Pinkert
Robert A. RogowskyDirector of Operations
Staff assigned:
Fred Ruggles, InvestigatorKaren Taylor, Industry Analyst
William Greene, EconomistCharles Yost, Accountant
Michael Haldenstein, AttorneyLita David-Harris, Statistician
Gabriel Ellenberger, Research Assistant
Douglas Corkran, Supervisor Investigator
Address all communications toSecretary to the Commission
United States International Trade CommissionWashington, DC 20436
U.S. International Trade CommissionWashington, DC 20436
www.usitc.gov
Steel Wire Garment HangersFrom China
Investigation No. 731-TA-1123 (Preliminary)
Publication 3951 October 2007


i
CONTENTS
Page
Determination . . . . . . . . . . . . . . . . . . . . . . . . . . . . . . . . . . . . . . . . . . . . . . . . . . . . . . . . . . . . . . . . . . 1Views . . . . . . . . . . . . . . . . . . . . . . . . . . . . . . . . . . . . . . . . . . . . . . . . . . . . . . . . . . . . . . . . . . . . . . . . . 3
Part I: Introduction . . . . . . . . . . . . . . . . . . . . . . . . . . . . . . . . . . . . . . . . . . . . . . . . . . . . . . . . . . . . I-1Background . . . . . . . . . . . . . . . . . . . . . . . . . . . . . . . . . . . . . . . . . . . . . . . . . . . . . . . . . . . . . . . . . . I-1Statutory criteria and organization of the report . . . . . . . . . . . . . . . . . . . . . . . . . . . . . . . . . . . . . . I-1U.S. market summary . . . . . . . . . . . . . . . . . . . . . . . . . . . . . . . . . . . . . . . . . . . . . . . . . . . . . . . . . . I-2Summary data and data sources . . . . . . . . . . . . . . . . . . . . . . . . . . . . . . . . . . . . . . . . . . . . . . . . . . I-3Previous and related investigations . . . . . . . . . . . . . . . . . . . . . . . . . . . . . . . . . . . . . . . . . . . . . . . . I-3Nature and extent of alleged sales at LTFV . . . . . . . . . . . . . . . . . . . . . . . . . . . . . . . . . . . . . . . . . I-3The subject merchandise . . . . . . . . . . . . . . . . . . . . . . . . . . . . . . . . . . . . . . . . . . . . . . . . . . . . . . . . I-4
Commerce’s scope . . . . . . . . . . . . . . . . . . . . . . . . . . . . . . . . . . . . . . . . . . . . . . . . . . . . . . . . . . I-4U.S. tariff treatment . . . . . . . . . . . . . . . . . . . . . . . . . . . . . . . . . . . . . . . . . . . . . . . . . . . . . . . . . I-4
The domestic like product . . . . . . . . . . . . . . . . . . . . . . . . . . . . . . . . . . . . . . . . . . . . . . . . . . . . . . . I-4Physical characteristics and uses . . . . . . . . . . . . . . . . . . . . . . . . . . . . . . . . . . . . . . . . . . . . . . . I-5Manufacturing processes . . . . . . . . . . . . . . . . . . . . . . . . . . . . . . . . . . . . . . . . . . . . . . . . . . . . . I-6Interchangeability and customer and producer perceptions . . . . . . . . . . . . . . . . . . . . . . . . . . I-8Channels of distribution . . . . . . . . . . . . . . . . . . . . . . . . . . . . . . . . . . . . . . . . . . . . . . . . . . . . . . I-9Price . . . . . . . . . . . . . . . . . . . . . . . . . . . . . . . . . . . . . . . . . . . . . . . . . . . . . . . . . . . . . . . . . . . . I-9
Part II: Conditions of competition in the U.S. market . . . . . . . . . . . . . . . . . . . . . . . . . . . . . . . . II-1U.S. market conditions and characteristics . . . . . . . . . . . . . . . . . . . . . . . . . . . . . . . . . . . . . . . . . . II-1Channels of distribution . . . . . . . . . . . . . . . . . . . . . . . . . . . . . . . . . . . . . . . . . . . . . . . . . . . . . . . . II-1Supply and demand considerations . . . . . . . . . . . . . . . . . . . . . . . . . . . . . . . . . . . . . . . . . . . . . . . . II-2
U.S. supply . . . . . . . . . . . . . . . . . . . . . . . . . . . . . . . . . . . . . . . . . . . . . . . . . . . . . . . . . . . . . . . II-2U.S. demand . . . . . . . . . . . . . . . . . . . . . . . . . . . . . . . . . . . . . . . . . . . . . . . . . . . . . . . . . . . . . . II-5
Substitutability issues . . . . . . . . . . . . . . . . . . . . . . . . . . . . . . . . . . . . . . . . . . . . . . . . . . . . . . . . . . II-5Factors affecting purchasing decisions . . . . . . . . . . . . . . . . . . . . . . . . . . . . . . . . . . . . . . . . . . II-5Comparisons of domestic products, subject imports, and nonsubject imports . . . . . . . . . . . . II-6
Part III: U.S. producers’ production, shipments, and employment . . . . . . . . . . . . . . . . . . . . . . III-1U.S. producers . . . . . . . . . . . . . . . . . . . . . . . . . . . . . . . . . . . . . . . . . . . . . . . . . . . . . . . . . . . . . . . III-1U.S. capacity, production, and capacity utilization . . . . . . . . . . . . . . . . . . . . . . . . . . . . . . . . . . . III-3U.S. producers’ shipments . . . . . . . . . . . . . . . . . . . . . . . . . . . . . . . . . . . . . . . . . . . . . . . . . . . . . . III-5U.S. producers’ imports and purchases . . . . . . . . . . . . . . . . . . . . . . . . . . . . . . . . . . . . . . . . . . . . . III-11U.S. producers’ inventories . . . . . . . . . . . . . . . . . . . . . . . . . . . . . . . . . . . . . . . . . . . . . . . . . . . . . III-12U.S. producers’ employment, wages, and productivity . . . . . . . . . . . . . . . . . . . . . . . . . . . . . . . . III-12
Part IV: U.S. imports, apparent U.S. consumption, and market shares . . . . . . . . . . . . . . . . . . IV-1U.S. importers . . . . . . . . . . . . . . . . . . . . . . . . . . . . . . . . . . . . . . . . . . . . . . . . . . . . . . . . . . . . . . . . IV-1U.S. imports . . . . . . . . . . . . . . . . . . . . . . . . . . . . . . . . . . . . . . . . . . . . . . . . . . . . . . . . . . . . . . . . . IV-3
Imports from subject and nonsubject sources . . . . . . . . . . . . . . . . . . . . . . . . . . . . . . . . . . . . . IV-3Negligibility . . . . . . . . . . . . . . . . . . . . . . . . . . . . . . . . . . . . . . . . . . . . . . . . . . . . . . . . . . . . . . . IV-7U.S. imports by type . . . . . . . . . . . . . . . . . . . . . . . . . . . . . . . . . . . . . . . . . . . . . . . . . . . . . . . . IV-7U.S. imports by geographic markets . . . . . . . . . . . . . . . . . . . . . . . . . . . . . . . . . . . . . . . . . . . . IV-8
Apparent U.S. consumption, U.S. market shares, and ratios of imports to U.S. production . . . . IV-10

ii
CONTENTS
Page
Part V: Pricing and related information . . . . . . . . . . . . . . . . . . . . . . . . . . . . . . . . . . . . . . . . . . . . V-1Factors affecting prices . . . . . . . . . . . . . . . . . . . . . . . . . . . . . . . . . . . . . . . . . . . . . . . . . . . . . . . . . V-1
Raw materials . . . . . . . . . . . . . . . . . . . . . . . . . . . . . . . . . . . . . . . . . . . . . . . . . . . . . . . . . . . . . V-1Transportation costs to the U.S. market . . . . . . . . . . . . . . . . . . . . . . . . . . . . . . . . . . . . . . . . . . V-1U.S. inland transportation costs . . . . . . . . . . . . . . . . . . . . . . . . . . . . . . . . . . . . . . . . . . . . . . . . V-2Exchange rates . . . . . . . . . . . . . . . . . . . . . . . . . . . . . . . . . . . . . . . . . . . . . . . . . . . . . . . . . . . . . V-2
Pricing practices . . . . . . . . . . . . . . . . . . . . . . . . . . . . . . . . . . . . . . . . . . . . . . . . . . . . . . . . . . . . . . V-3Pricing methods . . . . . . . . . . . . . . . . . . . . . . . . . . . . . . . . . . . . . . . . . . . . . . . . . . . . . . . . . . . . V-3
Price data . . . . . . . . . . . . . . . . . . . . . . . . . . . . . . . . . . . . . . . . . . . . . . . . . . . . . . . . . . . . . . . . . . . V-4Price trends . . . . . . . . . . . . . . . . . . . . . . . . . . . . . . . . . . . . . . . . . . . . . . . . . . . . . . . . . . . . . . . V-12Price comparisons . . . . . . . . . . . . . . . . . . . . . . . . . . . . . . . . . . . . . . . . . . . . . . . . . . . . . . . . . . V-12
Lost sales and lost revenues . . . . . . . . . . . . . . . . . . . . . . . . . . . . . . . . . . . . . . . . . . . . . . . . . . . . . V-13
Part VI: Financial experience of U.S. producers . . . . . . . . . . . . . . . . . . . . . . . . . . . . . . . . . . . . . VI-1Background . . . . . . . . . . . . . . . . . . . . . . . . . . . . . . . . . . . . . . . . . . . . . . . . . . . . . . . . . . . . . . . . . . VI-1Operations on SWG hangers . . . . . . . . . . . . . . . . . . . . . . . . . . . . . . . . . . . . . . . . . . . . . . . . . . . . . VI-1Capital expenditures and research and development expenses . . . . . . . . . . . . . . . . . . . . . . . . . . . VI-2Assets and return on investment . . . . . . . . . . . . . . . . . . . . . . . . . . . . . . . . . . . . . . . . . . . . . . . . . . VI-2Capital and investment . . . . . . . . . . . . . . . . . . . . . . . . . . . . . . . . . . . . . . . . . . . . . . . . . . . . . . . . . VI-3
Part VII: Threat considerations . . . . . . . . . . . . . . . . . . . . . . . . . . . . . . . . . . . . . . . . . . . . . . . . . . VII-1The industry in China . . . . . . . . . . . . . . . . . . . . . . . . . . . . . . . . . . . . . . . . . . . . . . . . . . . . . . . . . . VII-2U.S. importers’ inventories . . . . . . . . . . . . . . . . . . . . . . . . . . . . . . . . . . . . . . . . . . . . . . . . . . . . . . VII-4U.S. importers’ current orders . . . . . . . . . . . . . . . . . . . . . . . . . . . . . . . . . . . . . . . . . . . . . . . . . . . VII-4Antidumping and countervailing duty orders in third-country markets . . . . . . . . . . . . . . . . . . . . VII-5Information on nonsubject sources . . . . . . . . . . . . . . . . . . . . . . . . . . . . . . . . . . . . . . . . . . . . . . . . VII-5
“Bratsk” considerations . . . . . . . . . . . . . . . . . . . . . . . . . . . . . . . . . . . . . . . . . . . . . . . . . . . . . . VII-5Nonsubject source information . . . . . . . . . . . . . . . . . . . . . . . . . . . . . . . . . . . . . . . . . . . . . . . . VII-6
Appendixes
A. Federal Register notices . . . . . . . . . . . . . . . . . . . . . . . . . . . . . . . . . . . . . . . . . . . . . . . . . . . . . . . A-1B. Conference witnesses . . . . . . . . . . . . . . . . . . . . . . . . . . . . . . . . . . . . . . . . . . . . . . . . . . . . . . . . . B-1C. Summary data . . . . . . . . . . . . . . . . . . . . . . . . . . . . . . . . . . . . . . . . . . . . . . . . . . . . . . . . . . . . . . . C-1D. Supplemental price data . . . . . . . . . . . . . . . . . . . . . . . . . . . . . . . . . . . . . . . . . . . . . . . . . . . . . . . D-1

1 The record is defined in sec. 207.2(f) of the Commission’s Rules of Practice and Procedure (19 CFR § 207.2(f)).
UNITED STATES INTERNATIONAL TRADE COMMISSION
Investigation No. 731-TA-1123 (Preliminary)
STEEL WIRE GARMENT HANGERS FROM CHINA
DETERMINATION
On the basis of the record1 developed in the subject investigation, the United States InternationalTrade Commission (Commission) determines, pursuant to section 733(a) of the Tariff Act of 1930(19 U.S.C. § 1673b(a)) (the Act), that there is a reasonable indication that an industry in the United Statesis materially injured by reason of imports from China of steel wire garment hangers, provided for instatistical reporting number 7326.20.0020 of the Harmonized Tariff Schedule of the United States, thatare alleged to be sold in the United States at less than fair value.
COMMENCEMENT OF FINAL PHASE INVESTIGATION
Pursuant to section 207.18 of the Commission’s rules, the Commission also gives notice of thecommencement of the final phase of its investigation. The Commission will issue a final phase notice ofscheduling, which will be published in the Federal Register as provided in section 207.21 of theCommission’s rules, upon notice from the Department of Commerce (Commerce) of an affirmativepreliminary determination in this investigation under section 733(b) of the Act, or, if the preliminarydetermination is negative, upon notice of an affirmative final determination in the investigation undersection 735(a) of the Act. Parties that filed entries of appearance in the preliminary phase of theinvestigation need not enter a separate appearance for the final phase of the investigation. Industrialusers, and, if the merchandise under investigation is sold at the retail level, representative consumerorganizations have the right to appear as parties in Commission antidumping and countervailing dutyinvestigations. The Secretary will prepare a public service list containing the names and addresses of allpersons, or their representatives, who are parties to the investigation.
BACKGROUND
On July 31, 2007, a petition was filed with the Commission and Commerce by M&B MetalProducts Company, Inc. on behalf of the domestic industry that produces steel wire garment hangers,alleging that an industry in the United States is materially injured or threatened with material injury byreason of less-than-fair-value imports of steel wire garment hangers from China. Accordingly, effectiveJuly 31, 2007, the Commission instituted antidumping duty investigation No. 731-TA-1123(Preliminary).
Notice of the institution of the Commission’s investigation and of a public conference to be heldin connection therewith was given by posting copies of the notice in the Office of the Secretary, U.S.International Trade Commission, Washington, DC, and by publishing the notice in the Federal Registerof August 10, 2007 (72 FR 45069). The conference was held in Washington, DC, on August 21, 2007,and all persons who requested the opportunity were permitted to appear in person or by counsel.

1 19 U.S.C. §§ 1671b(a), 1673b(a); see also, e.g., Co-Steel Raritan, Inc. v. United States, 357 F.3d 1294 (Fed. Cir. 2004); American Lamb Co. v. United States, 785 F.2d 994, 1001-04 (Fed. Cir. 1986); Aristech Chemical Corp.v. United States, 20 CIT 353, 354 (1996). 2 M&B accounted for approximately *** percent of reported U.S. production of SWG hangers in 2006 andvirtually all current production. Confidential Staff Report (“CR”), INV-EE-128, as revised by memorandum INV-EE-130 and supplemented by memorandum INV-EE-132, at Table III-1; Public Staff Report (“PR”) at Table III-1. 3 The China Chamber of Commerce for Importers/Exporters of Light Industrial Products & Arts-Crafts reports itsmembers as consisting of the following Chinese companies: Shaoxing Guochao Metallic Products Co., Ltd.;Shaoxing Liangbao Metal Products Co., Ltd.; Shaoxing Shun Ji Metal Clotheshorse Co.; Shaoxing Dingli MetalClothes Horse Co., Ltd.; Shaoxing Gangyuan Metal Manufacture Co.; Shangyu Baoxiang Metal Manufacture Co.;Shaoxing Tongzhou Metal Manufacture Co.; Shaoxing Andrew Metal Manufacture Co.; Shaoxing Zhangbao MetalManufacture Co.; Pujiang County Command Metal Products Co.; and Ningbo Dasheng Hanger Co. 4 See Certain Steel Wire Garment Hangers from China, Inv. No. TA-421-2, USITC Pub. 3575 (Feb. 2003)(“USITC Pub. 3575”) at I-3.
3
VIEWS OF THE COMMISSION
Based on the record in the preliminary phase of this investigation, we find that there is areasonable indication that an industry in the United States is materially injured by reason of imports ofsteel wire garment hangers (“SWG hangers” or “hangers”) from the People’s Republic of China(“China”) that are allegedly sold in the United States at less than fair value.
I. THE LEGAL STANDARD FOR PRELIMINARY DETERMINATIONS
The legal standard for preliminary antidumping and countervailing duty determinations requiresthe U.S. International Trade Commission (“Commission”) to determine, based upon the informationavailable at the time of the preliminary determinations, whether there is a reasonable indication that adomestic industry is materially injured, threatened with material injury, or whether the establishment ofan industry is materially retarded, by reason of the allegedly unfairly traded imports. In applying thisstandard, the Commission weighs the evidence before it and determines whether “(1) the record as awhole contains clear and convincing evidence that there is no material injury or threat of such injury; and(2) no likelihood exists that contrary evidence will arise in a final investigation.”1
II. BACKGROUND
The petition in this investigation was filed on July 31, 2007, by M&B Metal Products Company,Inc. (“M&B”).2 An association of Chinese companies called the China Chamber of Commerce forImporters/Exporters of Light Industrial Products & Arts-Crafts3(“Chinese Respondents”) opposed thepetition. Counsel for the Chinese Respondents participated at the staff conference and submitted apostconference brief. Laidlaw Company LLC (“Laidlaw”) and United Wire Hanger Corporation (“UnitedWire”), both former U.S. producers that currently import SWG hangers from China, also opposed thepetition, participated at the staff conference, and filed a postconference brief.
On November 27, 2002, CHC Industries, Inc., M&B, and United Wire, all then producers ofSWG hangers, filed a petition pursuant to Section 421 of the Trade Act of 1974 (“section 421”). OnJanuary 27, 2003, the Commission unanimously determined that SWG hanger imports from China werecausing market disruption and that these rapidly increasing imports from China were a significant causeof material injury to the domestic industry.4 Accordingly, on February 5, 2003, the Commission majorityrecommended a remedy consisting of an additional duty on imports of SWG hangers from China for athree-year period, beginning at 25 percent ad valorem in the first year, decreasing to 20 percent ad
5 Id. 6 68 Fed. Reg. 82 (April 29, 2003), Presidential Determination on Wire Hanger Imports from the People’sRepublic of China, April 25, 2003. 7 19 U.S.C. § 1677(4)(A). 8 19 U.S.C. § 1677(4)(A). 9 19 U.S.C. § 1677(10). 10 See, e.g., NEC Corp. v. Department of Commerce, 36 F. Supp. 2d 380, 383 (Ct. Int’l Trade 1998); NipponSteel Corp. v. United States, 19 CIT 450, 455 (1995); Torrington Co. v. United States, 747 F. Supp. 744, 749 n.3(Ct. Int’l Trade 1990), aff’d, 938 F.2d 1278 (Fed. Cir. 1991) (“every like product determination ‘must be made onthe particular record at issue’ and the ‘unique facts of each case’”). The Commission generally considers a numberof factors including: (1) physical characteristics and uses; (2) interchangeability; (3) channels of distribution;(4) customer and producer perceptions of the products; (5) common manufacturing facilities, production processes,and production employees; and, where appropriate, (6) price. See Nippon, 19 CIT at 455 n.4; Timken Co. v. UnitedStates, 913 F. Supp. 580, 584 (Ct. Int’l Trade 1996). 11 See, e.g., S. Rep. No. 96-249 at 90-91 (1979). 12 Nippon, 19 CIT at 455; Torrington, 747 F. Supp. at 748-49; see also S. Rep. No. 96-249 at 90-91 (Congress hasindicated that the like product standard should not be interpreted in “such a narrow fashion as to permit minordifferences in physical characteristics or uses to lead to the conclusion that the product and article are not ‘like’ eachother, nor should the definition of ‘like product’ be interpreted in such a fashion as to prevent consideration of anindustry adversely affected by the imports under consideration.”). 13 See, e.g., USEC, Inc. v. United States, Slip Op. 01-1421 at 9 (Fed. Cir. Apr. 25, 2002) (“The ITC may notmodify the class or kind of imported merchandise examined by Commerce.”); Algoma Steel Corp. v. United States,688 F. Supp. 639, 644 (Ct. Int’l Trade 1988), aff’d, 865 F.3d 240 (Fed. Cir.), cert. denied, 492 U.S. 919 (1989).
4
valorem in the second year, and ending at 15 percent ad valorem in the third year.5 On April 25, 2003,the President declined to impose duties, citing “a strong possibility that if additional tariffs on Chinesewire hangers were imposed, production would simply shift to third countries, which could not be subjectto section 421's China-specific restrictions.”6
III. DOMESTIC LIKE PRODUCT
A. In General
In determining whether there is a reasonable indication that an industry in the United States ismaterially injured or threatened with material injury by reason of imports of the subject merchandise, theCommission first defines the “domestic like product” and the “industry.”7 Section 771(4)(A) of the TariffAct of 1930, as amended (“the Act”), defines the relevant domestic industry as the “producers as a{w}hole of a domestic like product, or those producers whose collective output of a domestic like productconstitutes a major proportion of the total domestic production of the product.”8 In turn, the Act defines“domestic like product” as “a product which is like, or in the absence of like, most similar incharacteristics and uses with, the article subject to an investigation ... .”9
The determination regarding the appropriate domestic like product(s) in an investigation is afactual one, and the Commission has applied the statutory standard of “like” or “most similar incharacteristics and uses” on a case-by-case basis.10 No single factor is dispositive, and the Commissionmay consider other factors it deems relevant based on the facts of a particular investigation.11 TheCommission looks for clear dividing lines among possible like products and disregards minor variations.12
Although the Commission must accept the determination of the U.S. Department of Commerce(“Commerce”) as to the scope of the imported merchandise that is allegedly sold at less than fair value,13
the Commission determines what domestic product is like the imported articles Commerce has

14 Hosiden Corp. v. Advanced Display Mfrs., 85 F.3d 1561, 1568 (Fed. Cir. 1996) (Commission may find a singlelike product corresponding to several different classes or kinds defined by Commerce); Torrington, 747 F. Supp. at748-52 (affirming the Commission’s determination of six like products in investigations where Commerce found fiveclasses or kinds). 15 See, e.g., Acciai Speciali Terni S.p.A. v. United States, 118 F. Supp. 2d 1298, 1304-05 (Ct. Int’l Trade 2000);Nippon, 19 CIT at 455; Asociacion Colombiana de Exportadores de Flores v. United States, 693 F. Supp. 1165,1169 n.5 (Ct. Int’l Trade 1988); Citrosuco Paulista, S.A. v. United States, 704 F. Supp. 1075, 1087-88 (Ct. Int’lTrade 1988). 16 Initiation of Antidumping Investigation, 72 Fed. Reg. 52855 (September 17, 2007). 17 CR at I-6, PR at I-5. 18 CR at I-6, PR at I-5. 19 CR at I-6, PR at I-5. 20 CR at I-6, PR at I-5.
5
identified.14 The Commission must base its domestic like product determination on the record in thisinvestigation. The Commission is not bound by prior determinations, even those pertaining to the sameimported products, but may draw upon previous determinations in addressing pertinent like productissues.15
B. Product Description
In its notice of initiation, Commerce indicated that the imported merchandise subject to thisinvestigation consists of SWG hangers, defining SWG hangers specifically as:
fabricated from carbon steel wire, whether or not galvanized or painted, whether or notcoated with latex or epoxy or similar gripping materials, and/or whether or not fashionedwith paper covers or capes (with or without printing) and/or nonslip features such assaddles or tubes. These products may also be referred to by a commercial designation,such as shirt, suit, strut, caped, or latex (industrial) hangers. Specifically excluded fromthe scope of this investigation are wooden, plastic, and other garment hangers that areclassified under separate subheadings of the Harmonized Tariff Schedule of the UnitedStates (“HTSUS”).16
SWG hangers are used by the dry cleaning, industrial laundry, textile, and uniform rentalindustries. The four most common varieties of dry cleaning hangers are caped hangers, shirt hangers, suithangers, and strut hangers.17 Caped hangers have a paper “cape” or cover, normally white and often withcommercial or custom printing. Strut hangers have a paper tube that runs along the length of the bottomof the hanger.18 This paper “strut” is typically coated with a nonslip material to prevent the garment fromfalling off the hanger. The basic shirt hanger is produced using a lighter gauge wire and is normallypainted white.19 The suit hanger has the same basic shape, but it is manufactured using a wire gauge thatcan support the weight of a suit and is usually painted with a gold-colored paint. Despite somedifferences in finishes and paper accessories, all of these hangers share the same basic configuration,characteristics, and end use.20 Steel wire hangers produced for use in industrial laundries or the uniformrental market are known as textile or uniform rental hangers, or as industrial hangers. These hangers areproduced from heavier gauge wire to support the weight of newly washed textiles and uniforms.

21 CR at I-6, PR at I-5. 22 M&B’s Postconference Brief at 7. 23 USITC Pub. 3575 at 7-9. 24 USITC Pub. 3575 at 8. 25 The Commission is not bound by prior determinations concerning even the same imported product. AcciaiSpeciali Terni S.p.A v. United States, 118 F. Supp.2d 1298, 1304-1305 (Ct. Int’l Trade 2000). Congress intendedthat Commission determinations be sui generis because of its concerns regarding the differing competitive conditionsbetween one industry and another, e.g., S. Rep. No. 249, 96th Cong, 1st Sess. 88-89 (1979), and its concerns that theCommission consider, in each case, the conditions of competition present at the time for the industry at issue, e.g., S.Rep. No. 71, 100th Cong., 1st Sess. 117 (1987). 26 See, e.g., Circular Welded Carbon-Quality Steel Pipe from China, Inv. Nos. 701-TA-447 and 731-TA-1116(Preliminary), USITC Pub. 3938 (July 2007) at 4, n. 7 (and authorities cited therein). 27 CR at I-6 to I-7, PR at I-5; Conference transcript (“Tr.”) at 23. 28 CR at I-6, PR at I-5.
6
Industrial laundries and uniform rental companies typically require a more substantial gauge hanger in aconsistent shape to fit their high-speed processing equipment.21
C. Analysis
Petitioner M&B asks the Commission to define a single domestic like product co-extensive withthe scope of this investigation that includes all SWG hangers.22 Respondents do not dispute petitioner’sproposed definition of the domestic like product.
In the section 421 investigation, the Commission defined a single domestic like product, co-extensive with the scope of that investigation, that encompassed different types of SWG hangers ( i.e.,shirt, strut, suit, and caped hangers).23 The Commission found that the various types of hangers were partof a continuum of hanger products and were one like product. The various types and styles of domesticSWG hangers all had the same physical attributes in terms of appearance and materials (although therewere some differences in paper accessories) and were largely made by the same firms, in the same plants,and on the same equipment using the same production processes; were used for the same end uses and bythe same end users; and were sold through the same marketing channels.24
The Commission must base its domestic like product determination on the record in eachinvestigation.25 Further, findings made pursuant to other statutes, including section 201 of the Trade Actof 1974 and Section 421 of the Trade Act of 1974 are given little weight in investigations and reviewsunder Title VII of the Tariff Act of 1930 due to the different provisions, purposes, and legislative historiesof those other statutory schemes.26 While we are thus not bound by the earlier like product determinationin the section 421 investigation, the record in this investigation, as explained below, supports finding asingle like product co-extensive with the scope of this investigation.
Physical Characteristics and End Uses. Although there are some differences in the differenttypes of SWG hangers, all are made from steel wire. Most (an estimated 85 percent) are used by drycleaners for garments, while uniform rental companies also purchase hangers for their uniforms and use asteel hanger coated with latex.27
Interchangeability. There appear to be some limitations in interchangeability among varioustypes of SWG hangers, as shirt hangers are used for shirts, suit hangers for suits, and latex hangers foruniforms.28

29 CR at II-2, PR at II-1. 30 See CR at I-7 to I-8, PR at I-6; CR/PR at Fig. I-2. 31 M&B’s Postconference Brief at 7. 32 See CR/PR at Tables III-5 and V-1 through V-7. 33 19 U.S.C. § 1677(4)(A). 34 Producers East West Enterprises and Rocky Mountain Hanger Manufacturing have ceased production. CR atI-3 n.3, PR at I-2 n.3.
7
Channels of Distribution. SWG hangers of different types share common channels ofdistribution. They have typically been sold to distributors, although they are increasingly being solddirectly to end users.29
Manufacturing Facilities, Production Processes, and Employees. The record indicates that thevarious types of SWG hangers share the same basic production process and employees until the final step,when a strut, cape, or latex coating may be added to the hanger.30
Producer and Customer Perceptions. While record evidence is limited, it indicates thatproducers and importers of SWG hangers all view SWG hangers as falling within the same basic productcategory.31
Price. The different types of SWG hangers are priced on a continuum based upon the specifictype of hanger; prices range from approximately $30 to $60 per 1,000 SWG hangers.32
D. Conclusion
Based on the record in the preliminary phase of this investigation, we find a range of hangerproducts that have similar uses and characteristics, are produced on the same equipment by the sameemployees, and are sold through the same channels of distribution at comparable prices. We thereforedefine a domestic like product that includes all the various types of SWG hangers and is co-extensivewith the scope of the investigation.
IV. DOMESTIC INDUSTRY
A. In General
The domestic industry is defined as the domestic “producers as a {w}hole of a domestic likeproduct, or those producers whose collective output of a domestic like product constitutes a majorproportion of the total domestic production of the product.”33 In defining the domestic industry, theCommission’s general practice has been to include in the industry producers of all domestic production ofthe like product, whether toll-produced, captively consumed, or sold in the domestic merchant market.
There were at least eight known U.S. producers of SWG hangers during the period ofinvestigation, which covers January 2004 through June 2007: M&B, Ganchos N.V., Laidlaw CompanyLLC, Metro Supply Co., Nagel Manufacturing and Supply Co., Navisa Hanger Manufacturing, Inc.,Shanti Industries, and United Wire.34 Based on our definition of the domestic like product, we define thedomestic industry, for purposes of the preliminary phase of this investigation, as all U.S. producers ofSWG hangers, subject to our consideration of related parties under 19 U.S.C. § 1677(4)(B).

35 19 U.S.C. § 1677(4)(B). 36 The primary factors the Commission has examined in deciding whether appropriate circumstances exist toexclude a related party include: (1) the percentage of domestic production attributable to the importing producer;(2) the reason the U.S. producer has decided to import the product subject to investigation, i.e., whether the firmbenefits from the LTFV sales or subsidies or whether the firm must import in order to enable it to continueproduction and compete in the U.S. market, and (3) the position of the related producer vis-a-vis the rest of theindustry, i.e., whether inclusion or exclusion of the related party will skew the data for the rest of the industry. See,e.g., Torrington Co. v. United States, 790 F. Supp. 1161 (Ct. Int’l Trade 1992), aff’d without opinion, 991 F.2d 809(Fed. Cir. 1993). The Commission has also considered the ratio of import shipments to U.S. production for relatedproducers and whether the primary interest of the related producer lies in domestic production or importation. Theselatter two considerations were cited as appropriate factors in Allied Mineral Products, Inc. v. United States, —F. Supp. 2d—, Slip Op. 04-139 (Ct. Int’l Trade November 12, 2004) at 5-6 (“The most significant factor considered bythe Commission in making the ‘appropriate circumstances’ determination is whether the domestic producer accrueda substantial benefit from its importation of the subject merchandise.”); USEC, Inc. v. United States, 132 F. Supp.2d 1, 12 (Ct. Int’l Trade 2001) (“the provision’s purpose is to exclude from the industry headcount domesticproducers substantially benefitting from their relationships with foreign exporters.”), aff’d, Slip Op. 01-1421 (Fed.Cir. April 22, 2002); S. Rep. No. 249, 96th Cong. 1st Sess. at 83 (1979) (“where a U.S. producer is related to aforeign exporter and the foreign exporter directs his exports to the United States so as not to compete with his relatedU.S. producer, this should be a case where the ITC would not consider the related U.S. producer to be a part of thedomestic industry”). 37 See, e.g., CR/PR at Table III-7. 38 M&B’s Postconference Brief at 9-13. 39 The Chinese Respondents argued that it would be inconsistent for Commerce to exclude consideration ofLaidlaw as a related party for purposes of its determination on standing and for the Commission to then includeLaidlaw in the definition of the industry for purposes of determining material injury. Chinese Respondents’ Brief at4-5. The SAA clearly states “Commerce and the Commission utilize section 771(4)(B) for different purposes:Commerce to eliminate any conflicts of interest that may distort its consideration of the level of industry support[and] the Commission to reduce any distortion in industry data caused by the inclusion in the domestic industry of arelated producer who is being shielded from the effects of the subject imports. For this reason, each agency willhave discretion to apply the provision . . . even where this may lead to somewhat different results . . . .” SAA at 858.Accordingly, we are not bound by Commerce’s definition of the domestic industry and base our determination on therecord before us in this investigation.
8
B. Related Parties
1. In General
We must determine whether any producer of the domestic like product should be excluded fromthe domestic industry pursuant to section 19 U.S.C. § 1677(4)(B). Subsection 1677(4)(B) allows theCommission, if appropriate circumstances exist, to exclude from the domestic industry producers that arerelated to an exporter or importer of subject merchandise or that are themselves importers.35 Exclusion ofsuch a producer is within the Commission’s discretion based upon the facts presented in eachinvestigation.36
Of the eight known U.S. producers, three companies, including petitioner M&B, imported SWGhangers from China during the period of investigation.37 According to M&B, no domestic producersshould be excluded from the definition of the domestic industry, because all three companies thatimported SWG hangers from China were also significant producers of SWG hangers during the period ofinvestigation.38 Respondents did not address exclusion of any related party from the industry under therelated parties provision.39
40 M&B’s Postconference Brief at 9. This explanation is consistent with M&B’s statement in the related section421 investigation. See USITC Pub. 3575 at 21, I-11. 41 M&B’s Postconference Brief at 9. 42 See CR/PR at Table III-6. The ratio of subject imports to domestic production was *** percent in interim 2006and *** percent in interim 2007. 43 See CR/PR at Table VI-2. 44 Consistent with her practice in past investigations and reviews, Vice Chairman Shara L. Aranoff does not relyon individual-company operating income margins in assessing whether a related party has benefitted fromimportation of subject merchandise. Rather, she determines whether to exclude a related party based principally onits ratio of subject imports to domestic shipments and whether its primary interests lie in domestic production orimportation. 45 For purposes of this preliminary investigation, Commissioner Pinkert does not rely upon related parties’financial performance as a factor in determining whether there are appropriate circumstances to exclude them fromthe domestic industry and relies instead on other information relevant to this issue. The present record is notsufficient to infer from the related parties’ profitability on U.S. operations that they have derived a specific benefitfrom importing or from their relationships to foreign producers. See Allied Mineral Products, Slip Op. 04-139, at 8. For the final investigation, Commissioner Pinkert invites the parties to provide any information they may have withrespect to whether related parties are benefitting financially from their status as related parties.
9
2. Analysis
M&B Metal Products Co.
Petitioner M&B indicates that it has imported Chinese SWG hangers in order to remaincompetitive with low-priced imports.40 It states that it remains committed to domestic production ofSWG hangers in the United States and maintains that it still produces significant quantities of SWGhangers.41 M&B’s ratio of subject imports to domestic production never exceeded *** percent during theperiod, declining from *** percent in 2004 to *** percent in 2005 before increasing to *** percent in2006.42 It remains primarily a producer rather than an importer of SWG hangers. Its financial data do notreveal any clear benefit from its imports.43 44 45 Finally, we note that M&B also was a petitioner in thesection 421 investigation on SWG hangers, indicating that its primary interest has been in domesticproduction since the beginning of the period of investigation. For these reasons, we do not find thatappropriate circumstances exist in this preliminary investigation to exclude M&B from the definition ofthe domestic industry.

46 Commissioners Williamson and Pinkert do not join in the discussion regarding United Wire and Laidlaw. Theydetermine that, for purposes of this preliminary phase of the investigation, the circumstances are not appropriate toexclude either United Wire or Laidlaw from the domestic industry. Both companies were significant producers ofthe domestic like product during the period of investigation, together accounting for *** percent of domesticproduction in 2004. CR/PR at Table III-3. Each company’s domestic production substantially *** of the period ofinvestigation, as imports from China increased significantly, until both discontinued domestic production andbecame exclusively importers of subject imports by the end of the period. Id. Excluding these companies that exitedthe industry during the period of investigation would significantly alter the data examined by the Commission andmask the effects of the subject imports on the domestic industry as a whole.
Just as importantly, United Wire and Laidlaw *** of the industry’s condition. Thus, it appears that theywere not shielded from the adverse impact of the subject imports, but were affected by the subject imports in thesame manner as the domestic industry as a whole, and their decision to shift to importation largely resulted from theimpact of the rapidly increasing imports from China. CR/PR at Table III-6 (footnotes excerpting statements at thestaff conference and in domestic producers’ questionnaire responses). Under these circumstances and for purposesof this preliminary investigation, neither the degree to which Laidlaw and United Wire shifted to importation duringthe period of investigation, nor any benefit that they enjoyed as a consequence of such importation, provides anadequate basis for excluding them from the domestic industry.
Commissioners Williamson and Pinkert note that the trends in the trade data for the industry they havedefined (all domestic producers) are similar to those for the industry as defined by the majority (excluding Laidlaw). Moreover, the financial indicators are identical, as Laidlaw did not submit usable financial data. 47 Laidlaw and United Wire’s Postconference Brief at 1. 48 See CR/PR at Table III-6. 49 CR/PR at Table III-6. 50 CR/PR at Table III-6. 51 Even during the entirety of 2006, its *** was only *** percent. 52 USITC Pub. 3575 at I-1. 53 See USITC Pub. 3575 at 21, I-11. 54 CR/PR at Table VI-2.
10
United Wire Hanger Corporation 46
United Wire is a respondent in this investigation and opposes the petition. In addition, UnitedWire currently is an importer of SWG hangers from China.47 However, during most of the period ofinvestigation, United Wire was a domestic producer of SWG hangers.48 It did not begin to import subjectmerchandise until *** and only ceased production of SWG hangers in June of 2006.49 Moreover, whileUnited Wire ***, (1) *** was relatively small in those years (never exceeding *** percent),50(2) there isno information that United Wire ***, and (3) it did not ***, when United Wire closed its U.S. facility and***.51 Finally, while United Wire opposes the petition in this investigation, it was a petitioner in thesection 421 investigation in 2002-2003, indicating that its primary interest was in domestic production atleast at the beginning of the period of investigation, which is borne out by its complete lack of subjectimports in 2004 and 2005.52 Indeed, even though it reported importing subject merchandise in the earlierinvestigation, it claimed it had done so to remain competitive in the market.53 Its financial data also donot reveal any clear benefit from either its imports or purchases.54 On balance, because of its emphasis ondomestic production during the period of investigation, we find that it is not appropriate to excludeUnited Wire from the domestic industry as a related party. We intend to consider this issue further in anyfinal phase of this investigation.

55 Laidlaw and United Wire’s Postconference Brief at 1. 56 CR/PR at Table III-1 57 CR/PR at Table III-6. 58 CR/PR at Table III-2. 59 CR/PR at Tables III-2, III-6. See also M&B’s Postconference Brief at 12. 60 USITC Pub. 3575 at 18, 21 n.117. 61 USITC Pub. 3575 at 27-28. 62 USITC Pub. 3575 at 29. 63 Presidential Determination on Wire Hanger Imports from the People’s Republic of China, 68 Fed Reg. 23019(Apr. 29, 2003). 64 Although Laidlaw provided a questionnaire response, it was unable to segregate financial information for itsU. S. production operations and its distribution of subject imports. CR at VI-1 n.1, PR at VI-1 n.1. As a result,while the Staff Report includes trade data and pricing and related information for Laidlaw, it contains no financialinformation for Laidlaw.”
11
Laidlaw Company LLC
Laidlaw is a respondent in this investigation, and opposes the petition.55 While Laidlaw was the*** U.S. producer of SWG hangers in 2004 and still accounted for over *** of domestic production in2006,56 it has *** its importation of hangers from China each year of the period of investigation and itaccounted for nearly *** of total imports of SWG hangers from China in 2006. Its ratio of subjectimports to domestic production *** from *** percent in 2004 to *** percent in 2006 and was *** percentin the 2006 interim period and *** percent in the 2007 interim period.57
Throughout the period of investigation, Laidlaw closed domestic production facilities in favor ofimportation – it closed its Delaware and Baltimore, MD facilities and reduced production and jobs at itsIllinois facility in 2004; it closed its Kingman, AZ facility in 2005; and it closed its Ontario and Illinoisfacilities and sold its Wisconsin facility in 2006.58 Laidlaw closed its last U.S. production facility inJanuary 2007, and it is now exclusively an importer of SWG hangers from China.59 Unlike United Wire,however, Laidlaw focused on importation of subject merchandise years before the beginning of the periodof investigation.60 In the section 421 investigation in 2002-03, Laidlaw opposed relief even though it wasone of the largest domestic producers, indicating its interest was shifting toward importation as early asthe beginning of the period of investigation.61 Laidlaw’s opposition to relief in the section 421investigation was based in part on its business strategy, which at the time was one of supplying the marketthrough domestic production and importation.62 Indeed, the President denied relief to the industry in thesection 421 investigation in part because Laidlaw’s strategy was “based in part on distribution ofimported hangers.” 63 64
On balance, because Laidlaw has long had a business strategy of supplying its customers ***through U.S. production and *** through importation, and its interest changed during the period ofinvestigation to that of an importer rather than a U.S. producer, we find it appropriate to exclude Laidlawfrom the domestic SWG hanger industry as a related party. We intend, however, to consider the issuefurther in any final phase of this investigation.
3. Conclusion
M&B and United Wire were primarily focused on domestic production during the period ofinvestigation. However, for purposes of the preliminary phase of this investigation, we find that it isappropriate to exclude Laidlaw from the domestic industry because of its primary emphasis on importingthe subject product during the period of investigation. In any final phase of this investigation, we intend

65 Negligibility is not an issue in this investigation under 19 U.S.C. § 1677(24). The petition was filed on July 31,2007. Subject imports from China accounted for 87.7 percent of total imports of SWG hangers for the most recent12-month period (June 2006-July 2007) for which data were available that preceded the filing of the petition. CR atIV-7, PR at IV-7. 66 19 U.S.C. §§ 1671b(a) and 1673b(a). 67 19 U.S.C. § 1677(7)(B)( i). The Commission “may consider such other economic factors as are relevant to thedetermination” but shall “identify each [such] factor . . . [a]nd explain in full its relevance to the determination.”19 U.S.C. § 1677(7)(B). See also Angus Chemical Co. v. United States, 140 F.3d 1478 (Fed. Cir. 1998). 68 19 U.S.C. § 1677(7)(A). 69 19 U.S.C. § 1677(7)(C)(iii). 70 19 U.S.C. § 1677(7)(C)(iii). 71 See, e.g., CR at II-7, PR at II-5.
12
to explore the degree to which U.S. producers have changed their emphasis from domestic production toimporting subject merchandise.
V. REASONABLE INDICATION OF MATERIAL INJURY BY REASON OF SUBJECTIMPORTS 65
In the preliminary phase of antidumping or countervailing duty investigations, the Commissiondetermines whether there is a reasonable indication that an industry in the United States is materiallyinjured by reason of the imports under investigation.66 In making this determination, the Commissionmust consider the volume of subject imports, their effect on prices for the domestic like product, and theirimpact on domestic producers of the domestic like product, but only in the context of U.S. productionoperations.67 The statute defines “material injury” as “harm which is not inconsequential, immaterial, orunimportant.”68 In assessing whether there is a reasonable indication that the domestic industry ismaterially injured by reason of subject imports, we consider all relevant economic factors that bear on thestate of the industry in the United States.69 No single factor is dispositive, and all relevant factors areconsidered “within the context of the business cycle and conditions of competition that are distinctive tothe affected industry.”70
For the reasons stated below, we determine that there is a reasonable indication that the domesticindustry producing SWG hangers is materially injured by reason of subject imports from China.
A. Conditions of Competition and the Business Cycle
The following conditions of competition inform our analysis of whether there is a reasonableindication of material injury by reason of subject imports. Given the wide variety of customers, we findthat, unlike some other industries, the SWG hangers market is not characterized by a regular andmeasurable business cycle.
1. Demand Considerations
An estimated 85 percent of SWG hangers are used by dry cleaners.71 Questionnaire data indicatethat SWG hangers account for between 1 and 2 percent of the total cost of the end use products to which

72 See, e.g., CR at II-7, PR at II-5. 73 Apparent U.S. consumption was 3.2 billion SWG hangers in 2004, 2.9 billion SWG hangers in 2005, and2.8 billion SWG hangers in 2006. Apparent U.S. consumption was *** SWG hangers in the first six months of 2007compared with 1.5 billion SWG hangers in the first six months of 2006. CR/PR at Table IV-7. 74 CR/PR at Tables IV-2 and IV-3. 75 Subject imports increased their share of the U.S. market from 23.8 percent in 2004 to 63.0 percent in 2006. They also increased from 57.4 percent in interim 2006 to *** percent in interim 2007. CR/PR at Table IV-7. 76 See CR/PR at Table IV-7; CR/PR at Fig. IV-3. Nonsubject imports accounted for 9.6 percent of the U.S.market in 2004, 11.1 percent in 2006. They were *** percent of the U.S. market in interim 2007 compared with11.4 percent in interim 2006. CR/PR at Table IV-7. 77 See CR/PR at Tables IV-6 and IV-7; CR/PR at Fig. IV-3. 78 CR/PR at Tables I-3 and II-1. 79 CR/PR at Table III-2. 80 CR/PR Table III-2. 81 CR/PR at Table III-2. As noted earlier, Commissioners Williamson and Pinkert include Laidlaw in thedomestic industry. 82 Memorandum INV-EE-132 (Sept. 19, 2007) at Table C-3. 83 Memorandum INV-EE-132 (Sept. 19, 2007) at Table C-3.
13
they are applied, suggesting that demand for dry cleaning is not affected by prices of SWG hangers.72 Apparent U.S. consumption of SWG hangers fell slightly from 2004 to 2006.73
2. Supply Considerations
There are three primary sources of supply in the U.S. market: imports of subject merchandisefrom China, nonsubject imports from Mexico, and domestic shipments.74 In terms of apparent U.S.consumption, the volume of subject imports dramatically increased over the period of investigation,75 butnonsubject imports held a relatively steady share of the market.76 Shipments by domestic producers anddomestic producers’ market share both declined.77
Over the period for which data were collected, U.S. importers reported selling most of theirproduct to distributors of SWG hangers, but sales to distributors decreased substantially from 2004 to2006, when U.S. producers reported selling only 31.9 percent of their product to distributors.78
The period of investigation was marked by bankruptcies and the shuttering of much of thedomestic industry’s capacity as subject imports increased. In 2003, CHC Industries, Inc. filed forbankruptcy, liquidated its assets and terminated its 325 employees.79 In 2004, U.S. Hanger shut down itsdomestic production. M&B closed its South Hill, VA plant and terminated 67 employees.80 United Wirealso terminated 100 employees that year before ceasing domestic production and terminating another ***employees in 2006.81
The result of these closings and layoffs was that U.S. capacity fell from *** hangers in 2004 to*** hangers in 2006.82 Capacity also declined from *** hangers in interim 2006 to *** hangers ininterim 2007.83 Production of hangers declined from *** SWG hangers in 2004 to *** hangers in 2006,
84 Memorandum INV-EE-132 (Sept. 19, 2007) at Table C-3. 85 Memorandum INV-EE-132 (Sept. 19, 2007) at Table C-3. 86 These indicators showed similar trends for the domestic industry as defined by Commissioners Williamson andPinkert. See CR/PR at Table C-1. 87 CR/PR at Table II-3; CR at I-12, PR at I-8; Tr. at 42, 65. 88 Laidlaw and United Wire’s Postconference Brief at 20; M&B’s Postconference Brief at 15 (citing Tr. at 81, 82,93, 94. 89 CR at V-4, PR at V-3. 90 CR at II-7, PR at II-5; M&B’s Postconference Brief at 8. 91 19 U.S.C. § 1677(7)(C)(i). 92 CR/PR at Table IV-6. Subject imports measured by value increased from $31 million in 2004 to $39 million in2005, and then to $56 million in 2006. Id. Imports of subject merchandise by domestic producers accounted for*** percent of total subject imports in 2006. CR/PR at Table IV-1. 93 Subject import market share was *** percent in the first half of 2007 and 57.4 percent in the first half of 2006.CR/PR at Table IV-7. 94 Calculated from Memorandum INV-EE-132 (Sept. 19, 2007) at Table C-3. 95 CR/PR at Table IV-8 Memorandum INV-EE-132 (Sept. 19, 2007) at Table C-3. Apparent U.S. consumptiondeclined by 13.1 percent from 2004 to 2006, but it was *** percent higher in interim period 2007 than in interimperiod 2006. Id.
14
and it was only *** hangers in interim 2007, compared with *** hangers in interim 2006.84 Despitedeclines in capacity, capacity utilization also fell over the period examined.85 86
3. Substitutability and Other Conditions
The parties generally agree that SWG hangers are commodity products87and that price plays alarge role in deciding upon a supplier.88 SWG hangers are generally sold on a spot basis, and sales aremade from inventory.89 Because other types of hangers (e.g., plastic or wood) are much more expensive,they are not potential substitutes for SWG hangers.90
B. Volume of the Subject Imports
Section 771(7)(C) of the Act provides that the “Commission shall consider whether the volume ofimports of the merchandise, or any increase in that volume, either in absolute terms or relative toproduction or consumption in the United States, is significant.”91
The volume of subject imports increased significantly from 2004 to 2006, both in absolute termsand relative to consumption and production in the United States. The volume of subject importsmeasured by quantity increased from 774 million hangers in 2004 to 1.0 billion hangers in 2005, and thenincreased to 1.8 billion in 2006. Such imports were 1.3 billion in the first half of 2007 compared with839 million in the first half of 2006.92 The market share of subject imports by volume increased from23.8 percent in 2004 to 63.0 percent in 2006.93 The ratio of subject imports to U.S. production rosesteadily from *** percent in 2004 to *** percent in 2006, and was *** percent in the first half of 2007 ascompared to *** percent in the first half of 2006.94
Subject imports made significant gains in market share over the period examined, which was atime of declining consumption.95 The increase in subject imports’ share of the U.S. market from23.8 percent in 2004 to 63.0 percent in 2006 was accompanied by a steady decline in domestic producers’

96 Memorandum INV-EE-132 (Sept. 19, 2007) at Table C-3. The U.S. market share held by the domesticproducer excluded from the domestic industry as a related party (Laidlaw) *** in 2006. Id. 97 CR/PR at Table IV-7. Nonsubject imports were 311 million SWG hangers in 2004, 316 million SWG hangersin 2005 and 312 million SWG hangers in 2006. Such imports were 172 million SWG hangers in the first half of2007, compared with 167 million in the first half of 2006. CR/PR at Table IV-6. The nonsubject imports’ U.S.market share was 9.6 percent in 2004, 11.0 percent in 2005, and 11.1 percent in 2006; nonsubject imports’ marketshare was 11.4 percent in interim period 2006 and *** percent in interim period 2007. Memorandum INV-EE-132at Table C-3. 98 See CR/PR at Table IV-7. 99 In any final phase investigation, we will seek additional information on the role of nonsubject imports in theU.S. market. We invite parties to comment in any final phase investigation on whether Bratsk Aluminium Smelter v.United States, 444 F.3d 1369 (Fed. Cir. 2006), is applicable to the facts of this investigation. In particular, partiesare encouraged to focus on whether the second triggering factor under Bratsk (whether price competitive nonsubjectimports are a significant factor in the market) is met. The Commission also invites parties to comment on whatadditional information the Commission should collect to address the issues raised by the Federal Circuit, how thatinformation should be collected, and which nonsubject sources should be the focus of additional informationgathering by the Commission in any final phase investigation. 100 Chairman Pearson and Commissioner Okun do not join the preceding footnote. They determine that thepreliminary record reflects that SWG hangers are commodity products, and, therefore, one of the predicates of theBratsk test is satisfied. See, e.g., Tr. at 65 (Mr. Waite), M&B’s Postconference Brief at 15. With respect to whethernonsubject imports are price competitive, the Commission requested product-specific price data from nonsubjectcountries in its importers’ questionnaires. These data show predominant underselling of the domestic like productby nonsubject imports. Compare INV-EE-132 at Tables 1A - 7A with CR/PR at Tables D-1 - D-7. The prices ofnonsubject imports show almost complete overselling compared with prices of subject imports. CR/PR at TablesD-1 - D-7. On the other hand, while the average unit values of nonsubject imports from Mexico were consistentlybelow the average unit values of subject imports (and consistently below the average unit values of U.S. producers’U.S. shipments), the difference lessened from 2004 to 2006, and by 2007, the average unit value of U.S. importsfrom China were below the average unit value of imports from Mexico. CR at VII-8, PR at VII-6; CR/PR at FigureVII-2. On balance, it appears that nonsubject imports are price-competitive with the domestic like product.
As to whether price-competitive nonsubject imports are a significant factor in the U.S. market, the record inthe preliminary phase of this investigation indicates that nonsubject imports were present throughout the periodexamined. CR/PR at Table IV-3. Nonsubject imports accounted for 28.7 percent of total imports (on a quantitybasis) in 2004, 23.2 percent in 2005, and 14.9 percent in 2006. Nonsubject imports accounted for 16.6 percent oftotal imports in interim 2006 and 11.5 percent in interim 2007. CR/PR at Table IV-3. The U.S. market share ofnonsubject imports ranged from 9.6 percent in 2004 to 11.0 percent in 2005 and to 11.1 percent in 2006. The U.S.market share of nonsubject imports was 11.4 percent in interim 2006 and *** percent in interim 2007. CR/PR atTable C-1. The volume of subject imports exceeded the volume of SWG hanger imports from all nonsubjectcountries throughout the period examined. The largest supplier of nonsubject imports was Mexico, which, inquantity terms, accounted for 26.2 percent of total imports in 2004, 21.8 percent in 2005 and 14.3 percent in 2006. Mexico accounted for 16.0 percent of total imports in interim 2006 and 11.2 percent in interim 2007. CR/PR atTable IV-3.
Respondents contend that nonsubject imports from Mexico are a significant factor in the U.S. market basedon their continued presence and on their volume. Chinese Respondents’ Postconference Brief at 10, 12; Laidlaw and
(continued...)
15
market share, from *** percent in 2004 to *** in 2006.96 As noted, nonsubject imports, both in absoluteterms and relative to U.S. consumption, were relatively steady from 2004 to 2006.97 Thus, subjectimports gained market share at the expense of the domestic industry as the U.S. industry’s share of themarket plummeted.98
For the foregoing reasons, we find for purposes of the preliminary phase of this investigation thatthe volume and increase in volume of subject imports were significant, both in absolute terms and relativeto consumption and production in the United States.99 100
100(...continued)United Wire’s Postconference Brief at 5. While an 11 percent share of the U.S. market may be considered asignificant factor in other cases, in the present investigation, the largest supplier of SWG hangers from Mexico isaffiliated with U.S. producer M&B and M&B is responsible for almost *** percent of imports from Mexico in 2006. CR at VII-10, PR at VII-7; CR at VII-10, PR at VII-7. These trends and this relationship suggest that nonsubjectimports of SWG hangers likely will not be a significant factor in the U.S. market. Accordingly, Chairman Pearsonand Commissioner Okun do not address the remaining requirements of the Bratsk test. For a complete statement ofChairman Pearson’s and Commissioner Okun’s interpretation of Bratsk in a preliminary investigation, see Separateand Additional Views of Chairman Daniel R. Pearson and Commissioner Deanna Tanner Okun Concerning BratskAluminum v. United States in Sodium Hexametaphosphate from China, Inv. No. 731-TA-1110 (Preliminary),USITC Pub. 3912 (Apr. 2007) at 19-25. In any final phase investigation, any party holding a contrary view shouldso indicate, and provide a basis for its view, at the time written comments on the draft questionnaires are submitted. 101 19 U.S.C. § 1677(7)(C)(ii). 102 CR/PR at Table II-3. 103 The seven types of SWG hangers for which pricing data were requested were: Product 1 – 18-inch white shirthangers; Product 2 – 13 gauge/16-inch caped hangers; Product 3 – 13 gauge/16-inch stock print caped hangers;Product 4 – 14½ gauge/16-inch plain caped hangers; Product 5 – 14½ gauge/16-inch stock print caped hangers;Product 6 – 16-inch strut hangers; and Product 7 – 13 gauge/16-inch latex hangers. CR at V-5, PR at V-4. 104 See Memorandum INV-EE-132 (Sept. 19, 2007) at Tables 1A, 2A, 3A, 4A, 5A, 6A, and 7A (excludingLaidlaw’s production). 105 See Memorandum INV-EE-132 (Sept. 19, 2007) at Tables 1A, 2A, 3A, 4A, 5A, 6A, and 7A. In the singleinstance of overselling, the margin was *** percent. 106 The pricing data for the industry defined by Commissioners Williamson and Pinkert similarly show consistentunderselling by subject imports. CR/PR at Tables V-1 to V-7.
16
C. Price Effects of the Subject Imports
Section 771(7)(C)(ii) of the Act provides that, in evaluating the price effects of the subjectimports, the Commission shall consider whether –
(I) there has been significant price underselling by the imported merchandise ascompared with the price of domestic like products of the United States, and
(II) the effect of imports of such merchandise otherwise depresses prices to a significantdegree or prevents price increases, which otherwise would have occurred, to a significantdegree.101
As noted, SWG hangers are a commodity product, and the great majority of responding domesticproducers and importers indicated that subject imports from China were always or frequentlyinterchangeable with domestically produced SWG hangers.102 Price, therefore, is important in purchasingdecisions.
U.S. producers and importers provided quarterly pricing data for seven types of SWG hangers.103 The pricing information showed underselling of domestic hangers by the subject imports in nearly everycomparison, and by substantial margins.104 Subject imports undersold the domestic industry’s SWGhangers in *** quarterly price comparisons, with margins of underselling ranging from *** percent to*** percent.105 106 For purposes of the preliminary phase of this investigation, we find that there has beensignificant underselling of the domestic like product by subject imports.
The available data do not provide persuasive evidence of significant price depressing orsuppressing effects by the subject imports. The domestic industry reported that its sales for a majority of
107 See Memorandum INV-EE-132 (Sept. 19, 2007) at Tables 1A, 2A, 3A, 4A, 5A, 6A, and 7A. 108 We note that product volumes for each of the seven products on which pricing information was collecteddeclined significantly over the period of investigation. In any final phase of this investigation, we anticipatecollecting data on additional products in order to increase coverage of the domestic industry’s sales and obtain amore complete understanding of the price effects of the subject imports. We invite the parties to propose pricingproducts that are likely to increase the coverage of domestic producers’ sales. 109 See CR/PR at Table VI-2. 110 See CR/PR at Table VI-2. 111 See CR/PR at Table VI-2. 112 Petitioner M&B generally alleged that it lost sales, rather than revenue, due to the presence of the subjectimports in the U.S. market. See CR at V-19 to V-20, PR at V-13. *** alleged lost sales totaling $*** wereconfirmed. See CR/PR at Table V-8. 113 Commerce estimated that the dumping margins for imports of SWG hangers from China ranged from203.02 percent to 618 percent. Initiation of Antidumping Investigation, 72 Fed. Reg. 52855 (September 17, 2007). 114 19 U.S.C. § 1677(7)(C)(iii); see also SAA at 851 and 885 (“In material injury determinations, the Commissionconsiders, in addition to imports, other factors that may be contributing to overall injury. While these factors, insome cases, may account for the injury to the domestic industry, they also may demonstrate that an industry is facingdifficulties from a variety of sources and is vulnerable to dumped or subsidized imports.”). SAA at 885. 115 19 U.S.C. § 1677(7)(C)(iii); see also SAA at 851, 885; Live Cattle from Canada and Mexico, Inv. Nos. 701-TA-386, 731-TA-812-813 (Preliminary), USITC Pub. 3155 (Feb. 1999) at 25 n.148.
17
its pricing products were made at relatively steady prices over the period, with prices for products 3 and 4showing very slight to modest declines. Only pricing product 6 showed a steep decline.107 Thus, it doesnot appear that domestic prices were significantly depressed by the subject imports, as the domesticindustry apparently sacrificed sales volume in order to maintain its prices.108
The domestic industry’s unit cost of goods sold (“unit COGS”) declined from $*** per 1,000hangers in 2004 to $*** per 1,000 hangers in 2006, but it was $*** per 1,000 hangers in interim 2006compared to $*** per 1,000 hangers in interim 2007.109 The unit value of net sales followed a similartrend.110 The ratio of COGS to net sales values fluctuated slightly over the period of investigation andwas always close to *** percent.111 This evidence suggests that any price suppression by the subjectimports was not significant.112 We intend to reexamine this issue closely in any final phase of thisinvestigation. Nevertheless, the record suggests that in the face of widespread underselling by the subjectimports the domestic industry sacrificed market share in order to maintain and/or increase its prices,demonstrating that the underselling has contributed to the domestic industry’s declining market share aswell as declines in other volume-based indicators discussed below.
For the foregoing reasons we find, for purposes of the preliminary phase of this investigation, thatsubject imports significantly undersold domestic SWG hangers, although we do not find that subjectimports had significant price suppressing or depressing effects.
D. Impact of the Subject Imports on the Domestic Industry113
Section 771(7)(C)(iii) of the Act provides that the Commission, in examining the impact of thesubject imports on the domestic industry, “shall evaluate all relevant economic factors which have abearing on the state of the industry.”114 These factors include output, sales, inventories, ability to raisecapital, research and development, and factors affecting domestic prices. No single factor is dispositive,and all relevant factors are considered “within the context of the business cycle and conditions ofcompetition that are distinctive to the affected industry.”115

116 Of the eight known producers of SWG hangers in the United States during the period, financial information ondomestic production was received only for M&B, Metro, and United Wire. See CR/PR at Table VI-2. 117 Commissioners Williamson and Pinkert note that the trends for the trade data are similar for the domesticindustry they analyzed, which included Laidlaw. Because Laidlaw did not submit usable financial data, the financialtrends are identical regardless of whether Laidlaw is excluded from the industry. 118 Memorandum INV-EE-132 (Sept. 19, 2007) at Table C-3. Domestic producers’ share of the U.S. marketdeclined from *** percent in 2004 to *** percent in 2006, and was *** percent in the first half of 2007, compared to*** percent in the first half of 2006. While only *** alleged lost sales totaling $*** were confirmed, the record isotherwise clear that the subject imports rapidly captured market share from the domestic industry. See CR/PR atTable V-8. 119 Domestic production capacity fell from *** SWG hangers in 2004 to *** SWG hangers in 2006, and was ***SWG hangers in the first half of 2007, compared to *** SWG hangers in the first half of 2006. Memorandum INV-EE-132 (Sept. 19, 2007) at Table C-3 (excluding Laidlaw). 120 Domestic production fell from *** SWG hangers in 2004 to *** SWG hangers in 2006 and was *** SWGhangers in the first half of 2007, compared to *** SWG hangers in the first half of 2006. Memorandum INV-EE-132 (Sept. 19, 2007) at Table C-3 (excluding Laidlaw). 121 The industry’s capacity utilization fell from *** percent in 2004 to *** percent in 2006 and was *** percent inthe first half of 2007, compared to *** percent in the first half of 2006. Memorandum INV-EE-132 (Sept. 19, 2007)at Table C-3 (excluding Laidlaw). 122 U.S. shipments fell from *** SWG hangers in 2004 to *** SWG hangers in 2006 and were *** SWG hangersin the first half of 2007, compared to *** SWG hangers in the first half of 2006. Memorandum INV-EE-132 (Sept. 19, 2007) at Table C-3 (excluding Laidlaw). 123 U.S. sales fell from $*** in 2004 to $*** in 2006, and were just $*** in the first half of 2007, compared to$*** in the first half of 2006. Memorandum INV-EE-132 (Sept. 19, 2007) at Table C-3 (excluding Laidlaw). 124 See Memorandum INV-EE-132 (Sept. 19, 2007) at Table C-3 (excluding Laidlaw).
18
We have examined the trade and financial data for the domestic industry producing SWGhangers.116 117 The data indicate sharp declines in the size and performance of the industry during theperiod examined as subject imports gained U.S. market share at the expense of the domestic producers.118 The domestic industry’s capacity,119 production,120 capacity utilization,121 shipments,122 and salesrevenue123 all declined overall from 2004 to 2006 and when the 2006 and 2007 interim periods arecompared. By the end of the period, the industry was producing only *** as many hangers (on anannualized basis) as it had been at the beginning of the period.124
125 The number of workers employed by the industry fell from *** in 2004 to *** in 2006 and was only *** in thefirst half of 2007, compared to *** in the first half of 2006. Memorandum INV-EE-132 (Sept. 19, 2007) at Table C-3 (excluding Laidlaw). 126 The number of hours worked in the production of SWG hangers fell from *** in 2004 to *** in 2006 and were*** in the first half of 2007, compared to *** in the first half of 2006. Memorandum INV-EE-132 (Sept. 19, 2007)at Table C-3 (excluding Laidlaw). 127 Wages paid by the industry declined from $*** in 2004 to $*** in 2006. Wages paid were $*** in the firsthalf of 2007, compared to $*** in the first half of 2006. Memorandum INV-EE-132 (Sept. 19, 2007) at Table C-3(excluding Laidlaw). 128 Productivity increased from *** hangers per hour in 2004 to *** hangers per hour in 2006, and was ***hangers per hour in the first half of 2007, compared to *** hangers per hour in the first half of 2006. MemorandumINV-EE-132 (Sept. 19, 2007) at Table C-3 (excluding Laidlaw). 129 The industry’s capital expenditures declined from $*** in 2004 to $*** in 2006 and were just $*** in the firsthalf of 2007, compared to $*** in the first half of 2006. Memorandum INV-EE-132 (Sept. 19, 2007) at Table C-3(excluding Laidlaw). 130 See Memorandum INV-EE-132 (Sept. 19, 2007) at Table C-3. The industry’s ratio of operating loss to netsales was *** percent in 2004, *** percent in 2005 and *** percent in 2006. Id. 131 The industry’s ratio of operating loss to net sales was *** percent in interim period 2006 and *** percent ininterim period 2007. Memorandum INV-EE-132 (Sept. 19, 2007) at Table C-3 (excluding Laidlaw). 132 The industry’s unit operating loss was $*** per 1,000 hangers in 2004 and was $*** per 1,000 hangers in2006. By the first half of 2007, it totaled $*** per thousand hangers, compared to $*** per 1,000 hangers in the firsthalf of 2006. Memorandum INV-EE-132 (Sept. 19, 2007) at Table C-3 (excluding Laidlaw). 133 Respondents assert that the domestic industry cannot meet the entirety of U.S. demand for SWG hangers.Laidlaw and United Wire’s Postconference Brief at 14. The Commission has previously observed that “there is noshort supply provision in the statute” and “the fact that the domestic industry may not be able to supply all ofdemand does not mean the industry may not be materially injured or threatened with material injury by reason ofsubject imports.” Softwood Lumber from Canada, Inv. Nos. 701-TA-414 and 731-TA-928 (Article 1904 NAFTARemand) at 108, n. 310 (December 2003). 134 See, e.g., Chinese Respondents’ Brief at 18-19. 135 INV-EE-132 at Table C-3. See also CR/PR at Table III-6. 136 See Artists’ Canvas from China, Inv. No. 731-TA-1091 (Final), USITC Pub. 3853 (May 2006) at 25.
19
The average number of production related workers,125 hours worked,126 and wages paid127 for theindustry producing SWG hangers declined during the period examined. Productivity appears to haveincreased due to the industry’s layoffs,128 but the industry’s capital expenditures fell ***.129
The domestic industry’s financial indicators all suffered over the period examined, with thedomestic industry reporting operating losses throughout the period.130 The industry’s largest loss was atthe end of the period,131 and its unit operating losses steadily increased over the period as the industrycontracted.132
For purposes of the preliminary phase of this investigation, we attribute the domestic industry’sdeclines in performance over the period of investigation in significant part to the rapid increases insubject import volume and market share. Subject imports have used their price advantage to gain asignificant share of the U.S. market at the expense of the domestic industry.133
Chinese Respondents argue that the impact on the domestic industry of Petitioner’s decision tomove certain production to Mexico should not be attributed to subject imports.134 We find that thedeclines in U.S. SWG hanger production and shipments are not explained by the increase of imports ofSWG hangers from Mexico.135 136 U.S. producers’ share of apparent U.S. consumption of SWG hangershas declined *** percentage points during the period of investigation, from *** percent in 2004 to ***
137 INV-EE-132 at Table C-3. In first half 2007, U.S. producers’ share of apparent U.S. consumption of SWGhangers was *** percent as compared to *** percent in first half 2006. 138 INV-EE-132 at Table C-3. In first half 2007, nonsubject imports’ share of apparent U.S. consumption of SWGhangers was *** percent as compared to 11.4 percent in first half 2006. 139 INV-EE-132 at Table C-3. In first half 2007, subject imports’ share of apparent U.S. consumption of SWGhangers was *** percent as compared to 57.4 percent in first half 2006.
20
percent in 2006.137 Nonsubject imports’ share of apparent U.S. consumption (including M&B’s importsfrom Mexico) increased by only 1.5 percentage points during this same period, from 9.6 percent in 2004to 11.1 percent in 2006.138 Imports of SWG hangers from China account for the remainder; subjectimports’ share increased from 23.8 percent in 2004 to 63.0 percent in 2006.139
The subject imports have had a significant negative impact on the condition of the domesticindustry during the period of investigation. In sum, we find that the absolute and relative volumes ofsubject imports are significant, that subject imports have gained significant market share at the expense ofthe domestic industry, that they have significantly undersold the domestic product, and that they haveadversely affected sales of domestic SWG hangers.
CONCLUSION
For the reasons stated above, we find that there is a reasonable indication that the domesticindustry producing SWG hangers is materially injured by reason of subject imports of SWG hangers fromChina that allegedly are sold in the United States at less than fair value.
1 The definition of the SWG hangers subject to this investigation is presented later in Part I of this report in thesection entitled “The Subject Merchandise.” 2 Federal Register notices cited in the tabulation are presented in app. A.
I-1
PART I: INTRODUCTION
BACKGROUND
This investigation results from a petition filed by M&B Metal Products Company, Inc.(“M&B”) on behalf of the domestic industry that produces steel wire garment hangers (“SWG hangers”),on July 31, 2007, alleging that an industry in the United States is materially injured or threatened withmaterial injury by reason of less-than-fair-value (“LTFV”) imports of SWG hangers1 from China. Information relating to the background of the investigation is provided below.2
Effective date Action
July 31, 2007 Petition filed with Commerce and the Commission; institution of theCommission's investigation (72 FR 45069, August 10, 2007)
August 21 Commerce’s notice of extension of the deadline for determining petitionadequacy (72 FR 46606)
August 21 Commission’s conference1
September 10 Commerce’s notice of initiation (72 FR 52855, September 17, 2007)
September 20 Commission’s vote
October 10 Commission’s determination transmitted to Commerce
October 10 Commission’s views transmitted to Commerce 1 A list of witnesses appearing at the conference is presented in app. B.
STATUTORY CRITERIA AND ORGANIZATION OF THE REPORT
Section 771(7)(B) of the Tariff Act of 1930 (the “Act”) (19 U.S.C. § 1677(7)(B)) provides that inmaking its determination of injury to an industry in the United States, the Commission--
shall consider (I) the volume of imports of the subject merchandise, (II)the effect of imports of that merchandise on prices in the United Statesfor domestic like products, and (III) the impact of imports of suchmerchandise on domestic producers of domestic like products, but onlyin the context of production operations within the United States; and . . .may consider such other economic factors as are relevant to thedetermination regarding whether there is material injury by reason ofimports.
Section 771(7)(C) of the Act (19 U.S.C. § 1677(7)(C)) further provides that--
In evaluating the volume of imports of merchandise, the Commissionshall consider whether the volume of imports of the merchandise, or anyincrease in that volume, either in absolute terms or relative to productionor consumption in the United States is significant.

3 CHC Industries, Inc. (“CHC”) ceased production in 2003, Nagel Manufacturing and Supply Co. (“NagelManufacturing”) in 2004, United Wire Hanger Corp. (“United Wire”) in 2006, and Laidlaw Corp. (“Laidlaw”) andNavisa Hanger Manufacturer, Inc. (“Navisa”) in 2007. East West Enterprises and Rocky Mountain HangerManufacturing also have ceased production. Conference transcript, p. 16 (Magnus).
I-2
. . .In evaluating the effect of imports of such merchandise on prices, theCommission shall consider whether . . . (I) there has been significantprice underselling by the imported merchandise as compared with theprice of domestic like products of the United States, and (II) the effect ofimports of such merchandise otherwise depresses prices to a significantdegree or prevents price increases, which otherwise would haveoccurred, to a significant degree.. . .In examining the impact required to be considered under subparagraph(B)(i)(III), the Commission shall evaluate (within the context of thebusiness cycle and conditions of competition that are distinctive to theaffected industry) all relevant economic factors which have a bearing onthe state of the industry in the United States, including, but not limited to. . . (I) actual and potential declines in output, sales, market share, profits,productivity, return on investments, and utilization of capacity, (II)factors affecting domestic prices, (III) actual and potential negativeeffects on cash flow, inventories, employment, wages, growth, ability toraise capital, and investment, (IV) actual and potential negative effectson the existing development and production efforts of the domesticindustry, including efforts to develop a derivative or more advancedversion of the domestic like product, and (V) in {an antidumpinginvestigation}, the magnitude of the margin of dumping.
Part I of this report presents information on the subject merchandise, alleged dumping margins,and domestic like product. Part II of this report presents information on conditions of competition andother relevant economic factors. Part III presents information on the condition of the U.S. industry,including data on capacity, production, shipments, inventories, and employment. Parts IV and V presentthe volume and pricing of imports of the subject merchandise, respectively. Part VI presents informationon the financial experience of U.S. producers. Part VII presents the statutory requirements andinformation obtained for use in the Commission’s consideration of the question of threat of materialinjury.
U.S. MARKET SUMMARY
SWG hangers are used by dry cleaning establishments, industrial laundries, and textile industriesto drape and transport clothing and other textiles. Consumption of SWG hangers totaled approximately$96.8 million (2.8 billion hangers) in the U.S. market in 2006. Currently, four firms are known toproduce SWG hangers in the United States: M&B, Metro Supply, Shanti, and Ganchos.3 U.S. producers’reported U.S. shipments of SWG hangers totaled $29.5 million (731.0 million hangers) in 2006 andaccounted for 30.5 percent of apparent U.S. consumption by value and 25.9 percent by quantity. U.S.imports from China totaled $56.3 million (1.8 billion hangers) in 2006 and accounted for 58.2 percent ofapparent U.S. consumption by value and 63.0 percent by quantity. U.S. imports from nonsubject sources
4 See Certain Steel Wire Garment Hangers from China, Inv. No. TA-421-2, USITC Publication 3575 (February2003), pp. I-3 and I-2. 5 Ibid., pp. 10-17. 6 Ibid., p. 1. Alterative remedies included a 30 percent increase in duties for a three-year period, and increasedduties of 20 percent and 15 percent, respectively, over a two-year period. 7 Presidential Determination on Wire Hanger Imports from the People’s Republic of China, 68 FR 82 (April 29,2003), April 25, 2003. 8 Steel Wire Garment Hangers from the People’s Republic of China: Initiation of Antidumping DutyInvestigation, 72 FR 52855 (September 17, 2007).
I-3
(primarily Mexico) totaled $10.9 million (312.2 million hangers) in 2006 and accounted for 11.3 percentof apparent U.S. consumption by value and 11.1 percent by quantity.
SUMMARY DATA AND DATA SOURCES
A summary of data collected in the investigation is presented in appendix C, table C-1. Except asnoted, U.S. industry data are based on questionnaire responses of four firms that accounted forapproximately *** of U.S. production of SWG hangers during 2006. U.S. imports are based on officialstatistics from the Department of Commerce (“Commerce”) except where noted.
PREVIOUS AND RELATED INVESTIGATIONS
On November 27, 2002, CHC Industries, Inc.; M&B Metal Products Company, Inc.; and UnitedWire Hanger Corporation, producers of steel wire garment hangers, filed a petition pursuant to section421 of the Trade Act of 1974 alleging that certain steel wire garment hangers from China were beingimported into the United States in such increased quantities or under such conditions as to cause orthreaten to cause market disruption to the domestic garment hanger industry. On January 27, 2003, theCommission voted unanimously to determine that Chinese imports were causing market disruption.4 TheCommission found that shipments from China had increased by more than 800 percent from 1997 to 2001and more than doubled between January-September 2001 (interim 2001) and January-September 2002(interim 2002). The Commission also found that rapidly increasing imports from China were a significantcause of material injury to the domestic industry.5 Accordingly, on February 5, 2003, the Commissionmajority voted to propose to the President a remedy consisting of an additional duty on imports ofgarment hangers from China for a three-year period, beginning at 25 percent ad valorem in the first year,20 percent ad valorem in the second year, and 15 percent ad valorem in the third year.6 On April 25,2003, the President opted to grant expedited consideration for trade adjustment assistance claims byU.S. workers displaced by foreign competition but not to impose duties, citing “a strong possibility that ifadditional tariffs on Chinese wire hangers were imposed, production would simply shift to third countries,which could not be subject to section 421’s China-specific restrictions.”7
NATURE AND EXTENT OF ALLEGED SALES AT LTFV
On September 11, 2007, the Commission received notification of Commerce’s initiation ofantidumping duty investigation concerning SWG hangers from China. The estimated weighted-averagedumping margins (in percent ad valorem), as reported by Commerce (based on petitioners’ comparison ofthe export price and normal value) ranged from 203 percent to 618 percent.8
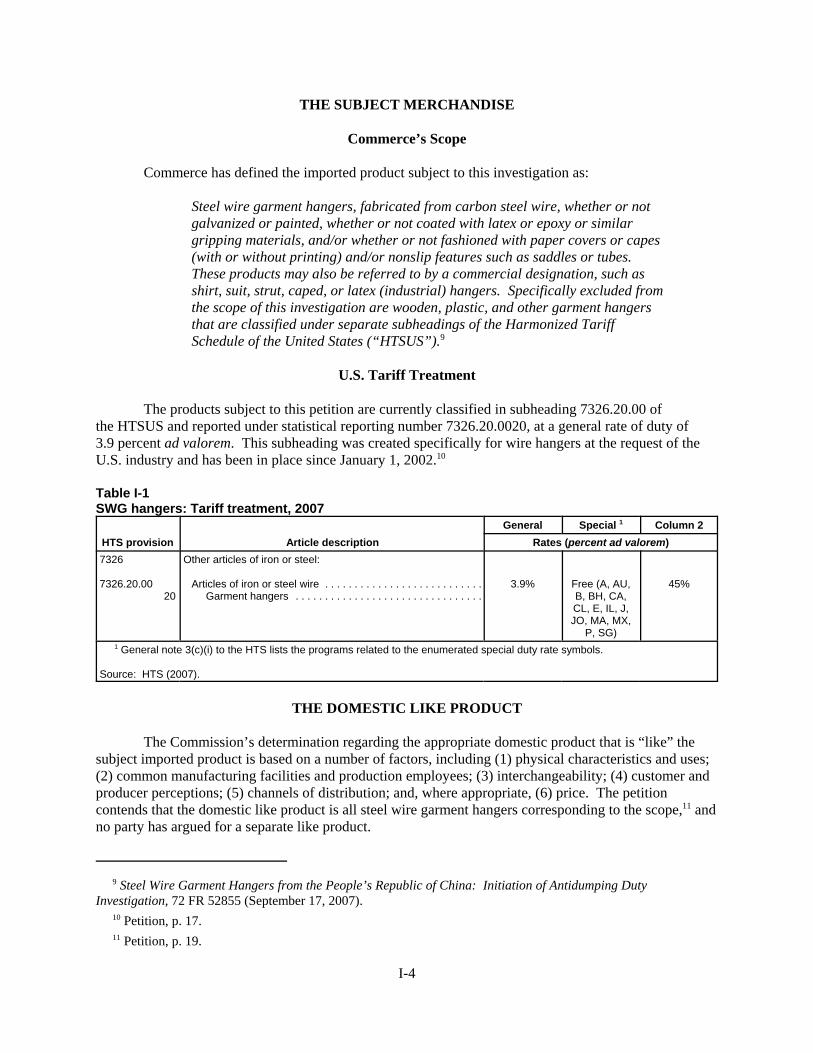
9 Steel Wire Garment Hangers from the People’s Republic of China: Initiation of Antidumping DutyInvestigation, 72 FR 52855 (September 17, 2007). 10 Petition, p. 17. 11 Petition, p. 19.
I-4
THE SUBJECT MERCHANDISE
Commerce’s Scope
Commerce has defined the imported product subject to this investigation as:
Steel wire garment hangers, fabricated from carbon steel wire, whether or notgalvanized or painted, whether or not coated with latex or epoxy or similargripping materials, and/or whether or not fashioned with paper covers or capes(with or without printing) and/or nonslip features such as saddles or tubes. These products may also be referred to by a commercial designation, such asshirt, suit, strut, caped, or latex (industrial) hangers. Specifically excluded fromthe scope of this investigation are wooden, plastic, and other garment hangersthat are classified under separate subheadings of the Harmonized TariffSchedule of the United States (“HTSUS”).9
U.S. Tariff Treatment
The products subject to this petition are currently classified in subheading 7326.20.00 ofthe HTSUS and reported under statistical reporting number 7326.20.0020, at a general rate of duty of3.9 percent ad valorem. This subheading was created specifically for wire hangers at the request of theU.S. industry and has been in place since January 1, 2002.10
Table I-1SWG hangers: Tariff treatment, 2007
HTS provision Article descriptionGeneral Special 1 Column 2
Rates (percent ad valorem)7326
7326.20.0020
Other articles of iron or steel:
Articles of iron or steel wire . . . . . . . . . . . . . . . . . . . . . . . . . . .Garment hangers . . . . . . . . . . . . . . . . . . . . . . . . . . . . . . . .
3.9% Free (A, AU,B, BH, CA,CL, E, IL, J,JO, MA, MX,
P, SG)
45%
1 General note 3(c)(i) to the HTS lists the programs related to the enumerated special duty rate symbols.
Source: HTS (2007).
THE DOMESTIC LIKE PRODUCT
The Commission’s determination regarding the appropriate domestic product that is “like” thesubject imported product is based on a number of factors, including (1) physical characteristics and uses;(2) common manufacturing facilities and production employees; (3) interchangeability; (4) customer andproducer perceptions; (5) channels of distribution; and, where appropriate, (6) price. The petitioncontends that the domestic like product is all steel wire garment hangers corresponding to the scope,11 andno party has argued for a separate like product.
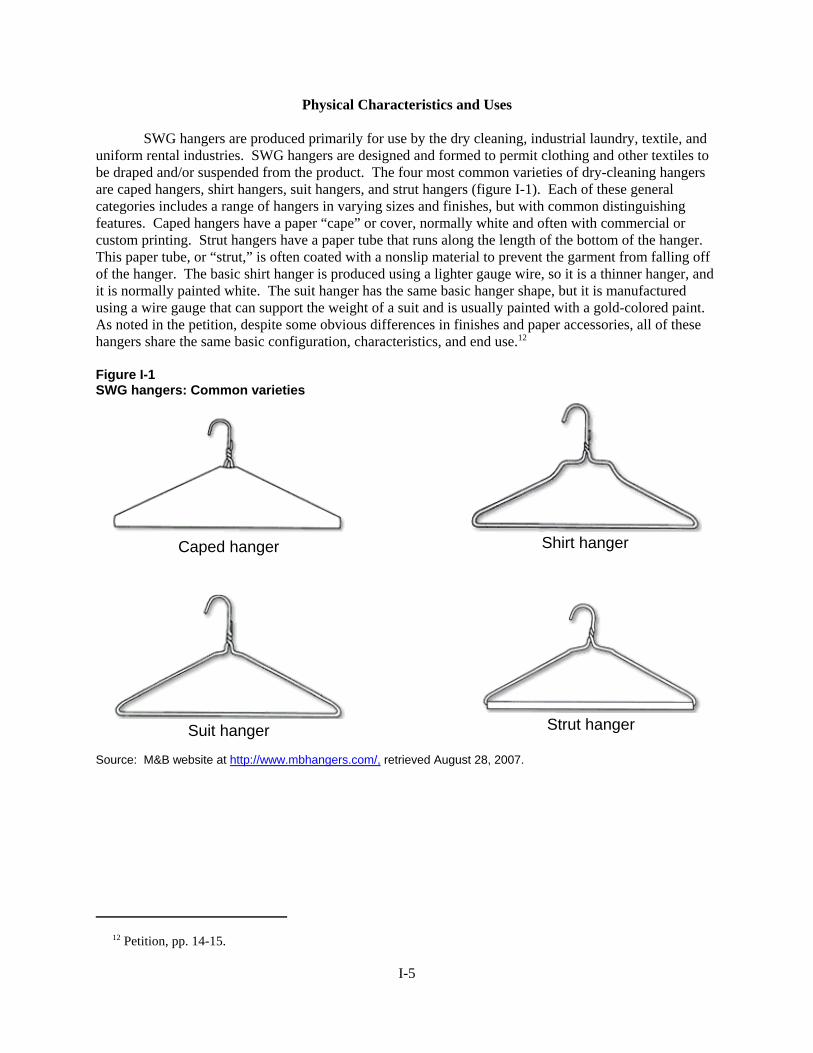
12 Petition, pp. 14-15.
I-5
Physical Characteristics and Uses
SWG hangers are produced primarily for use by the dry cleaning, industrial laundry, textile, anduniform rental industries. SWG hangers are designed and formed to permit clothing and other textiles tobe draped and/or suspended from the product. The four most common varieties of dry-cleaning hangersare caped hangers, shirt hangers, suit hangers, and strut hangers (figure I-1). Each of these generalcategories includes a range of hangers in varying sizes and finishes, but with common distinguishingfeatures. Caped hangers have a paper “cape” or cover, normally white and often with commercial orcustom printing. Strut hangers have a paper tube that runs along the length of the bottom of the hanger. This paper tube, or “strut,” is often coated with a nonslip material to prevent the garment from falling offof the hanger. The basic shirt hanger is produced using a lighter gauge wire, so it is a thinner hanger, andit is normally painted white. The suit hanger has the same basic hanger shape, but it is manufacturedusing a wire gauge that can support the weight of a suit and is usually painted with a gold-colored paint. As noted in the petition, despite some obvious differences in finishes and paper accessories, all of thesehangers share the same basic configuration, characteristics, and end use.12
Figure I-1SWG hangers: Common varieties
Source: M&B website at http://www.mbhangers.com/, retrieved August 28, 2007.
Shirt hangerCaped hanger
Suit hanger Strut hanger
13 The term “gauge” refers to the diameter of wire. A 13-gauge wire has a diameter of 0.0915 inch. 14 Petition, pp. 15-16. 15 Conference transcript, p. 23 (Magnus). 16 For example, Shanghai Wells Hanger Co. Ltd., a manufacturer in China, states that it is “the world’s leadingmanufacturer of quality wire hangers” and that the majority of its production equipment was brought in from theUnited States (Petition, exhibit 25 and website of Shanghai Wells Hanger Co. Ltd., athttp://www.wellshanger.com/about.asp, retrieved August 28, 2007). 17 Conference transcript, pp. 57-58 (Magnus) and pp. 129-130 (Schultz). 18 Conference transcript, p. 66 (Waite).
I-6
Manufacturing Processes
The manufacturing process to produce SWG hangers consists of purchasing low-carbon steel wireor drawing wire from low-carbon steel wire rod, cutting the wire to length, and fabricating the hangers. After the wire is straightened and cut to length, the hangers are formed and painted. The process may becontinuous or require separate stages to straighten, cut, and form the hanger, and painting may take placeeither before or after the hanger is formed. In all cases, the forming machines are dedicated to theproduction of hangers; they are not used and cannot be used to produce other products.
After forming and painting, some hangers require the addition of a paper covering or “cape”which can be plain or printed with custom or stock messages for drycleaner customers. In addition, struthangers receive a cardboard tube or “strut” along the bottom bar which drycleaners use to hang pants. Although referred to by a separate name in the industry, these hangers are produced using the sameequipment and workers as the various types of dry-cleaning hangers described below.
Steel wire hangers produced for use in industrial laundries or the uniform rental market areknown as textile or uniform rental hangers or as industrial hangers. These hangers are normally producedusing a 13-gauge wire13 to support the weight of newly washed textiles and uniforms. Industrial laundriesand uniform rental companies typically require a more substantial gauge hanger in a consistent shape tofit their high-speed processing equipment. These hangers may be coated with a latex or other coating toprevent slippage during the steaming and pressing operations.14 Latex hangers, however, are not used bydry cleaners because the bottom wire bar would put a crease in the trousers.15 Otherwise, there are nosignificant differences in the production process or uses for industrial hangers and dry-cleaning hangers.
The formation of the hanger itself is similar in China and the United States.16 However, whileoperations such as the addition of the capes and struts, and painting the wire are done by machine in theUnited States but they are performed manually in China.17 Specific production differences between M&Band firms in China are presented in table I-2. Figures I-2 and I-3 present flow charts for themanufacturing of U.S. and Chinese SWG hangers, respectively. All of the common types of SWGhangers mentioned above are produced in China.18
Table I-2SWG hangers: Production process differences between M&B and producers in China
* * * * * * *
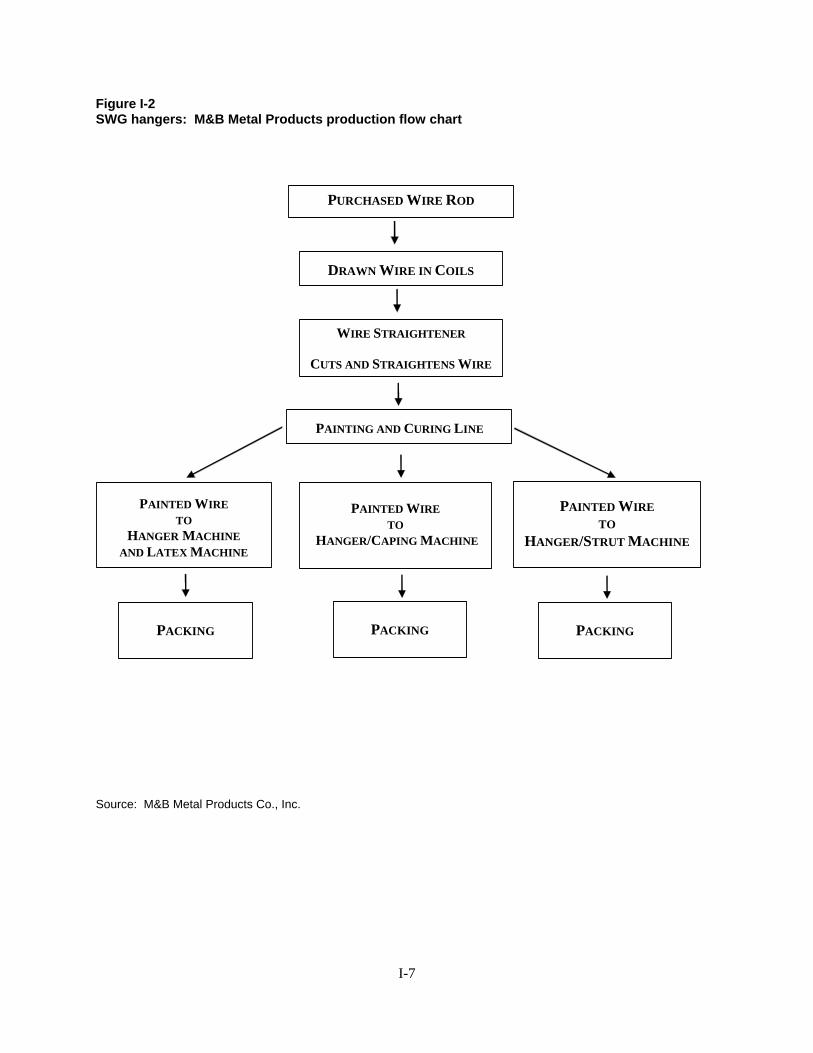
I-7
Figure I-2SWG hangers: M&B Metal Products production flow chart
Source: M&B Metal Products Co., Inc.
PURCHASED WIRE ROD
DRAWN WIRE IN COILS
WIRE STRAIGHTENER
CUTS AND STRAIGHTENS WIRE
PAINTING AND CURING LINE
PAINTED WIRE TO
HANGER/CAPING MACHINE
PAINTED WIRE TO
HANGER MACHINE AND LATEX MACHINE
PACKING
PAINTED WIRE TO
HANGER/STRUT MACHINE
PACKING PACKING
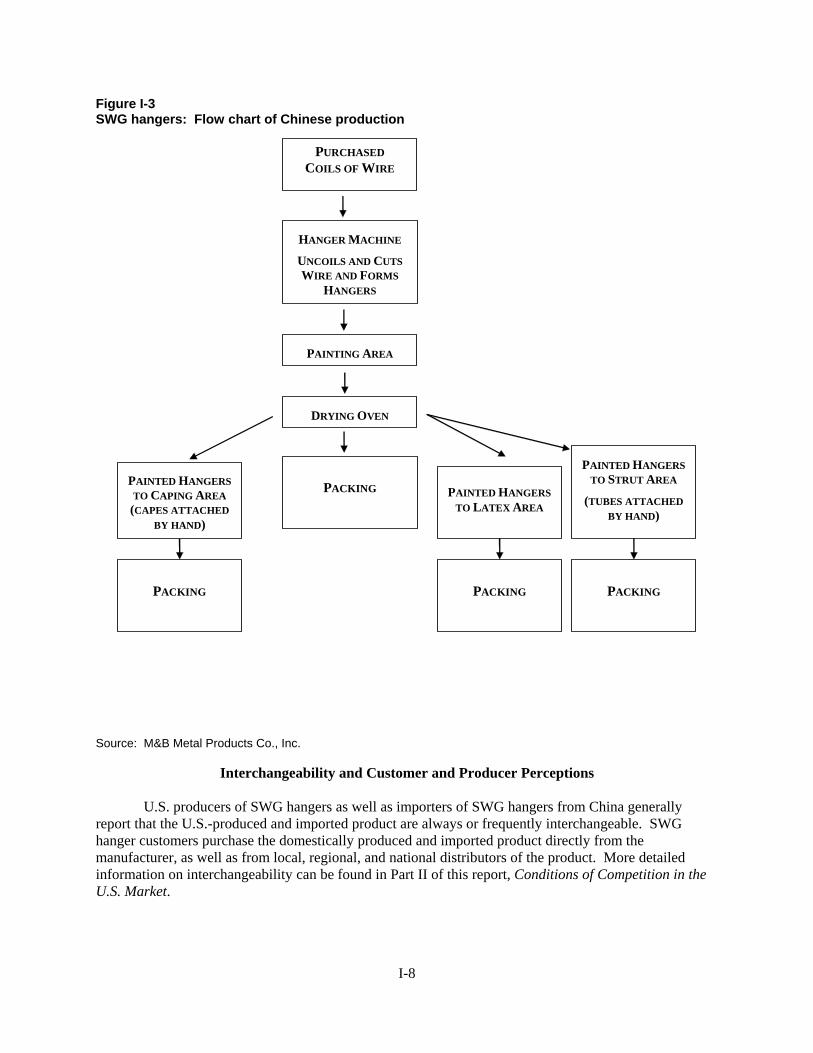
I-8
Figure I-3SWG hangers: Flow chart of Chinese production
Source: M&B Metal Products Co., Inc.
Interchangeability and Customer and Producer Perceptions
U.S. producers of SWG hangers as well as importers of SWG hangers from China generallyreport that the U.S.-produced and imported product are always or frequently interchangeable. SWGhanger customers purchase the domestically produced and imported product directly from themanufacturer, as well as from local, regional, and national distributors of the product. More detailedinformation on interchangeability can be found in Part II of this report, Conditions of Competition in theU.S. Market.
PAINTED HANGERS TO STRUT AREA
(TUBES ATTACHED BY HAND)
PURCHASED COILS OF WIRE
HANGER MACHINE
UNCOILS AND CUTS WIRE AND FORMS
HANGERS
PAINTING AREA
DRYING OVEN
PACKING
PAINTED HANGERS TO CAPING AREA (CAPES ATTACHED
BY HAND)
PAINTED HANGERS TO LATEX AREA
PACKING PACKING
PACKING

19 Petition, pp. 31-33.
I-9
Channels of Distribution
Over the period for which data were collected, U.S. importers reported selling most of theirproduct to distributors of SWG hangers (in 2006, 74.2 percent). This was true for U.S. producers in 2004,but sales to distributors decreased by 84.1 percent from 2004 to 2006, until in 2006 U.S. producersreported selling only 31.9 percent of their product to distributors. Table I-3 presents both producers’ andimporters’ reported methods of distribution. Additional information on channels of distribution can befound in Part II of this report, Conditions of Competition in the U.S. Market.
Table I-3SWG hangers: U.S. producers’ and importers’ channels of distribution, 2004-06, January-June2006, and January-June 2007
Item
Calendar year January-June
2004 2005 2006 2006 2007
Producers:Distributors (1,000 hangers) 1,464,788 915,598 233,476 170,533 ***
End users (1,000 hangers) 695,221 602,003 497,549 285,462 ***
Importers:Distributors (1,000 hangers) 573,503 878,813 1,047,660 519,955 531,743
End users (1,000 hangers) 101,048 166,863 311,534 148,295 352,444
Total:Distributors (1,000 hangers) 2,038,291 1,794,411 1,281,136 690,488 ***
End users (1,000 hangers) 796,269 768,866 809,083 433,757 ***
Source: Compiled from data submitted in response to Commission questionnaires.
Price
Petitioners contend that the market for SWG hangers is highly price-sensitive, with competitionoccurring between imports and domestic producers for sales on the basis of price.19 Table I-4 and figureI-4 present average unit values for U.S. shipments of SWG hangers in the United States from varioussources. Average unit value for both domestic and imported SWG hangers initially increased in 2005 andthen in 2006 decreased to levels below those that existed in 2004. Throughout the period for which datawere collected the average unit value for U.S. shipments of SWG imports from China was between 73and 75 percent of the average unit value for domestically produced SWG hangers. Pricing practices andprices reported for specific types of SWG hangers in response to the Commission’s questionnaires arepresented in Part V of this report, Pricing and Related Information.

I-10
Table I-4SWG hangers: Average unit values of U.S. shipments, by source, 2004-06, January-June 2006, andJanuary-June 2007
ItemCalendar year January-June
2004 2005 2006 2006 2007Unit value (per 1,000 hangers)
U.S. producers’ U.S. shipments $43.66 $44.16 $40.39 $41.27 $***U.S. shipments of imports from-- China 32.03 33.18 30.78 30.43 28.81 All other sources 35.74 38.94 42.82 41.97 ***Source: Compiled from data submitted in response to Commission questionnaires.
Figure I-4SWG hangers: Average unit values of U.S. shipments, by source, 2004-06, January-June 2006, andJanuary-June 2007
Note.--Confidential data in interim 2007 have been suppressed.
Source: Table I-4.

1 Conference transcript, p. 26 (Pedelty). 2 There were four national U.S. producers of SWG hangers in 2004, as well as five local/regional producers;today there is only one national U.S. producer of SWG hangers, and only three regional producers. 3 Conference transcript, pp. 60-61 (Magnus).
II-1
PART II: CONDITIONS OF COMPETITION IN THE U.S. MARKET
U.S. MARKET CONDITIONS AND CHARACTERISTICS
U.S. producers’ U.S. commercial shipments of SWG hangers are increasingly made primarily toend users. Typical end users include major dry cleaning chains, industrial laundries, and the uniformrental industry.1 U.S. shipments of imported product from China are made primarily through tradingcompanies and distributors. Distributors (including the former domestic producers) may buy directlyfrom China or import through a trading company.2
Two of the four responding U.S. producers reported nationwide sales and a third reported sales toat least four regions (Northwest, Mid-Atlantic, Midwest, and Southeast). With respect to the two U.S.firms that imported SWG hangers from China, one concentrated its sales *** and the other sold its SWGhangers in the *** regions. On average U.S. producers sold 46.3 percent of their SWG hangers within101 miles of their storage or production facilities, 48.8 percent between 101 and 1,000 miles, and5.0 percent beyond 1,000 miles. Three of the 19 responding importers also reported nationwide sales,with another four reporting sales to at least three regions. Thirteen importers reported shipping to onlyone region. On average, U.S. importers of Chinese SWG hangers sold 53.8 percent of their SWG hangerswithin 100 miles of their storage or production facilities, 26.2 percent between 101 and 1,000 miles, and20.0 percent over 1,000 miles.
In 2006, 55.2 percent of all SWG hangers imported into the United States entered through portson the West Coast during 2006, as were 55.1 percent during January-June 2007 (table IV-5). PetitionerM&B reported that it shipped SWG hangers in limited quantities to the West Coast by freight line and bypiggyback (truck on a railway).3
CHANNELS OF DISTRIBUTION
During January 2004 through June 2007, a majority (58.3 percent on average) of U.S. producers’U.S. shipments of SWG hangers was shipped to distributors, although since 2006 distributor sales havefallen below end user sales. U.S. shipments of subject imported SWG hangers also went primarily todistributors. During January 2004 through June 2007, 74.6 percent of U.S. shipments of SWG hangersimported from China (on average) were to distributors. Table II-1 presents information on channels ofdistribution for U.S. producers as well as for U.S. importers of subject product from China.

II-2
Table II-1SWG hangers: U.S. producers’ and importers’ shares of reported U.S. shipments, by sources andchannels of distribution, 2004-06, January-June 2006, and January-June 2007
Item
Calendar year January-June
2004 2005 2006 2006 2007
Share of reported shipments (percent)
Domestic producers’ U.S. shipments ofSWG hangers to:
Distributors 67.8 60.3 31.9 37.4 ***
End users 32.2 29.7 68.1 62.6 ***
U.S. importers’ U.S. shipments of SWGhangers from China to:
Distributors 88.6 84.8 74.2 74.5 55.2
End users 11.4 15.2 25.8 25.5 44.8
U.S. importers’ U.S. shipments of SWGhangers from all other countries to:
Distributors *** *** *** *** ***
End users *** *** *** *** ***
Source: Complied from data submitted in response to Commission questionnaires.
SUPPLY AND DEMAND CONSIDERATIONS
U.S. Supply
Domestic Production
Based on available information, staff believes that U.S. producers are likely to respond to changesin demand with relatively large increases in shipments of SWG hangers to the U.S. market. Low levels ofcapacity utilization indicate that U.S. producers have the ability to increase production of SWG hangerssubstantially in the short run. Factors contributing to this degree of responsiveness of supply arediscussed below.
Industry capacity
Total U.S. capacity decreased from 2.6 billion SWG hangers in 2004 to 1.5 billion SWG hangersin 2006, and continued to decrease during the interim 2006-07 period, from 892 million in 2006 to *** in2007. U.S. producers’ reported capacity utilization for SWG hangers decreased from 84.7 percent in2004 to 45.6 percent in 2006, and decreased between the interim periods, from 51.0 percent in interim2006 to *** percent in interim 2007. These levels of capacity utilization indicate that U.S. producers ofSWG hangers have a fairly substantial amount of available capacity with which they could increaseproduction of SWG hangers in the short run in the event of a price change.

4 Conference transcript, p. 26 (Pedelty). 5 Conference transcript, p. 48 (Magnus).
II-3
Alternative markets
U.S. producers reported minimal export shipments in 2006, accounting for only *** percent ofU.S. producers’ total shipments. The petitioner stated that there is limited demand for SWG hangers inthe rest of the world, in particular, limited demand in Europe (France) and parts of South America.4 Thelow levels of exports during the period indicates that domestic producers of SWG hangers are constrainedin their ability to shift shipments from the United States to other markets in the short run in response toprice changes.
Inventory levels
U.S. producers of SWG hangers reported that combined end-of-period inventory quantitiesdeclined during 2004-06 from 111 million hangers to 27 million hangers, or by 76 percent. U.S.producers also reported that the ratio of U.S. producers’ inventory to total shipments of SWG hangersdeclined from 5.1 percent in 2004 to 3.6 percent in 2006 and was only *** percent in June 2007. Theselevels of inventory suggest that U.S. producers are limited in their ability to use inventory to respond toprice changes in the short term.
Production alternatives
None of the four responding U.S. producers reported producing other products on the sameequipment or machinery or using the same labor as it used to produce SWG hangers. Petitioners statedthat no other products could be produced on wire hanger machines besides SWG hangers.5
Subject Imports from China
Based on available information, staff believes that Chinese producers of SWG hangers are likelyto respond to changes in demand with relatively small changes in the quantity shipped to the U.S. market.The response of Chinese producers will be limited by a high capacity utilization rate, an inability toproduce other products using the same equipment with which SWG hangers are produced, and theabsence of alternative markets.
Imported SWG hangers from China increased by 82 percent from $31.0 million in 2004 to$56.3 million in 2006, and increased by 46 percent between the interim periods. On an absolute basis,U.S. subject imports from China rose from 774 million hangers in 2004 to 1.8 billion hangers in 2006 andbetween the interim periods increased from 839 million hangers to 1.3 billion hangers. Imported SWGhangers from China, as a share of the total value of U.S. imports of SWG hangers, increased from73.9 percent in 2004 to 83.8 percent in 2006, and continued to rise during the interim periods 2006-07, to*** percent in January-June 2007. Imported SWG hangers from China, as a share of total quantity ofU.S. imports of SWG hangers, increased from 71.3 percent in 2004 to 85.1 percent in 2006, and reached*** percent in January-June 2007. Subject Chinese imports’ share of apparent U.S. consumption rosefrom 23.8 percent in 2004 to 63.0 percent in 2006, and rose between the interim period, from 57.4 percentto *** percent.

6 Staff notes that Chinese exports of SWG hangers to the U.S. market increased from 1.2 billion SWG hangers in2004 to 1.6 billion SWG hangers in 2005 (35.3 percent), and to 2.2 billion SWG hangers in 2006 (36.7 percent). Chinese exports were 39.5 percent higher during January-June of 2007 than during the corresponding period of2006. Exports to the United States for full year 2007 are expected to reach 2.4 billion SWG hangers.
II-4
Industry capacity
Twelve responding Chinese producers reported total capacity utilization for SWG hangers thatincreased steadily from 69.8 percent in 2004 to 83.5 percent in 2006 as both capacity and production ofSWG hangers increased by more than 1 billion hangers. Chinese production capacity increased fromapproximately 1.9 billion hangers in 2004 to nearly 2.4 billion hangers in 2005, or by 29.0 percent, andincreased to nearly 3 billion in 2006 (23.8 percent); this trend is projected to continue into 2007 with anincrease to 3.3 billion SWG hangers. Overall, Chinese production capacity increased by 59.7 percentduring 2004-2006. Chinese capacity utilization rates, however, reached 83.5 percent in 2006 and97.3 percent in January-June 2007. These levels of capacity utilization indicate that Chinese producers ofSWG hangers may have limited existing available capacity with which they could increase production ofSWG hangers in the short run in the event of a price change.
Inventory levels
Responding Chinese producers of SWG hangers reported combined end-of-period inventoriesthat increased from 37.3 million SWG hangers in 2004 to 76.8 million SWG hangers in 2006, andcontinued to rise during the interim 2006-07 period from 59.1 million in 2006 to 98.0 million in 2007.Inventories as a ratio to shipments of Chinese SWG hangers also increased from 2.9 percent in 2004 to3.1 percent in 2006 and from 2.5 percent in interim 2006 to 2.9 percent in interim 2007. These dataindicate that Chinese producers have a limited ability to use inventories as a means to increase shipmentsto the U.S. market in the short run.6
Alternative markets
The responding Chinese producers of SWG hangers reported that their products were shippedprincipally to the U.S. market, secondarily to third-country markets, thirdly to their home market; theseproducers reported that this shipment pattern is projected to continue in 2007 and 2008. According toquestionnaire responses from Chinese producers of SWG hangers, exports to the United States accountedfor 90.4 percent of all shipments of SWG hangers in 2006, similar to the 94.1 percent share in 2004, whileonly 3.4 percent of total shipments were consumed in the Chinese home market and 6.2 percent wereexported to other markets in 2006. Accordingly, reporting producers have a limited ability to divertproduct from other markets in response to relative changes in the price of SWG hangers between theUnited States and other markets.
Production alternatives
None of the 20 responding Chinese producers indicated that they produced other products usingthe same equipment used to produce SWG hangers.

II-5
U.S. Demand
Based on available information, U.S. consumers of SWG hangers are likely to respond to changesin the price of SWG hangers with relatively small changes in their purchases of SWG hangers. The maincontributing factors to the low responsiveness of demand is the low cost share accounted for by SWGhangers in most end uses and the lack of products that can be substituted for SWG hangers in many enduses.
Demand Characteristics
SWG hangers are used by dry cleaners, industrial laundries, and uniform rental companies tohang clothes. Three of the responding U.S. producers and seven importers responded that at least85 percent of their hangers were used by dry cleaners or industrial laundries and the remaining U.S.producer and one importer reported that its hangers were used by uniform rental companies.
Available data indicate that apparent U.S. consumption of SWG hangers decreased from3.2 billion SWG hangers in 2004 to 2.8 billion SWG hangers in 2006. Apparent U.S. consumption ofSWG hangers rose between the interim periods, from 1.5 billion SWG hangers in interim 2006 to ***SWG hangers in interim 2007. When asked if demand for SWG hangers had changed since January 1,2004, three responding producers and 8 of 18 responding importers reported that there had been nochange in demand. The remaining responding producer and 2 importers reported that demand decreased,whereas 6 importers reported that demand increased. One importer reported that demand increased forSWG hangers because of inflation and another due to increase usage.
Substitute Products
Two of the three responding U.S. producers and all 20 responding importers reported that thereare no practical substitutes for SWG hangers. The one remaining U.S. producer and six importersmentioned either cardboard, plastic, crystal, or wood hangers as possible substitutes. The U.S. produceradded that cardboard hangers have very limited applications because they do not travel well onconveyors, which is a requirement for both dry cleaners and uniform rental companies.
Cost Share
U.S. producers and importers reported that SWG hangers are used primarily by dry cleaners,industrial laundries, and uniform rental companies to hang clothes. Most estimates of the share of thetotal cost of the end use product accounted for by the cost of SWG hangers ranged from less than1 percent to 2 percent.
SUBSTITUTABILITY ISSUES
Factors Affecting Purchasing Decisions
Producers and importers were also asked to assess how often differences other than price (i.e.,quality, availability, transportation network, product range, technical support, ect.) were significant insales of SWG hangers from the United States, China, or nonsubject countries (table II-2). Two of thethree responding U.S. producers reported that non-price differences between U.S.-produced and Chinese-produced SWG hangers are never a factor in their sales of SWG hangers, while the third reported thatthey sometimes are a factor. Six of the responding importers of SWG hangers reported that non-pricedifferences between U.S.-produced and Chinese-produced SWG hangers are always a factor, one reportedthat they are frequently a factor, and three reported that they are sometimes a factor.
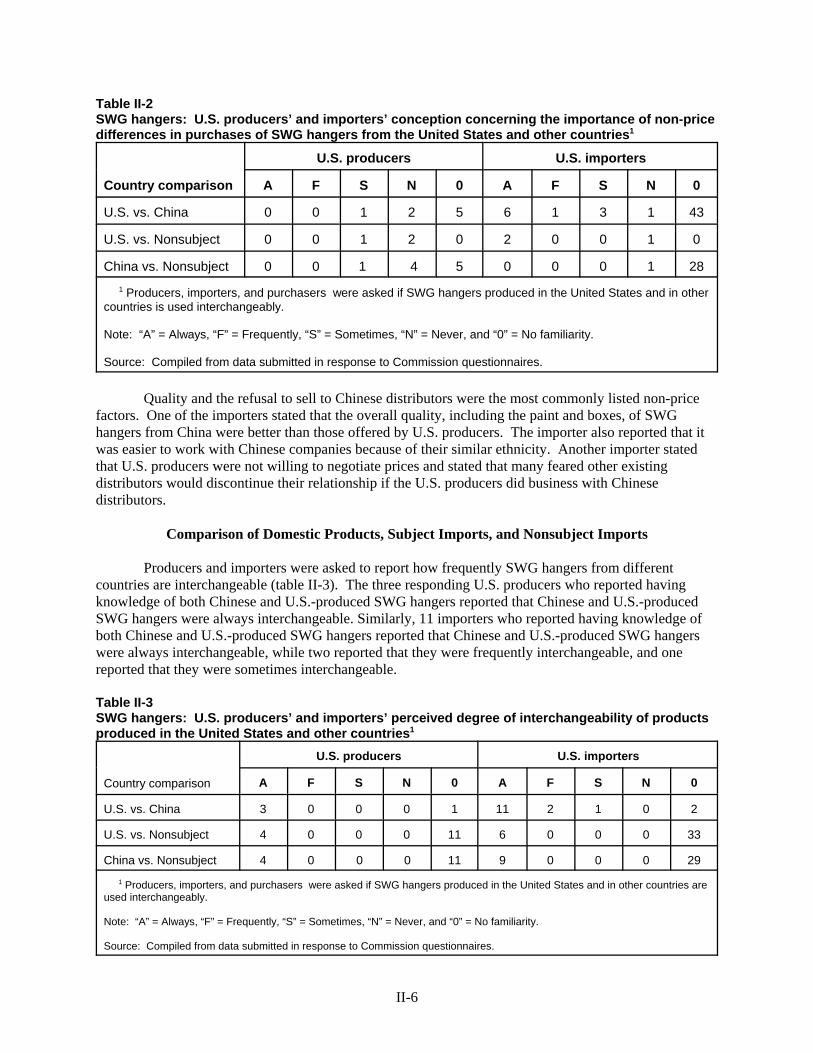
II-6
Table II-2SWG hangers: U.S. producers’ and importers’ conception concerning the importance of non-price differences in purchases of SWG hangers from the United States and other countries1
Country comparison
U.S. producers U.S. importers
A F S N 0 A F S N 0
U.S. vs. China 0 0 1 2 5 6 1 3 1 43
U.S. vs. Nonsubject 0 0 1 2 0 2 0 0 1 0
China vs. Nonsubject 0 0 1 4 5 0 0 0 1 28
1 Producers, importers, and purchasers were asked if SWG hangers produced in the United States and in othercountries is used interchangeably.
Note: “A” = Always, “F” = Frequently, “S” = Sometimes, “N” = Never, and “0” = No familiarity.
Source: Compiled from data submitted in response to Commission questionnaires.
Quality and the refusal to sell to Chinese distributors were the most commonly listed non-pricefactors. One of the importers stated that the overall quality, including the paint and boxes, of SWGhangers from China were better than those offered by U.S. producers. The importer also reported that itwas easier to work with Chinese companies because of their similar ethnicity. Another importer statedthat U.S. producers were not willing to negotiate prices and stated that many feared other existingdistributors would discontinue their relationship if the U.S. producers did business with Chinesedistributors.
Comparison of Domestic Products, Subject Imports, and Nonsubject Imports
Producers and importers were asked to report how frequently SWG hangers from differentcountries are interchangeable (table II-3). The three responding U.S. producers who reported havingknowledge of both Chinese and U.S.-produced SWG hangers reported that Chinese and U.S.-producedSWG hangers were always interchangeable. Similarly, 11 importers who reported having knowledge ofboth Chinese and U.S.-produced SWG hangers reported that Chinese and U.S.-produced SWG hangerswere always interchangeable, while two reported that they were frequently interchangeable, and onereported that they were sometimes interchangeable.
Table II-3SWG hangers: U.S. producers’ and importers’ perceived degree of interchangeability of productsproduced in the United States and other countries1
Country comparison
U.S. producers U.S. importers
A F S N 0 A F S N 0
U.S. vs. China 3 0 0 0 1 11 2 1 0 2
U.S. vs. Nonsubject 4 0 0 0 11 6 0 0 0 33
China vs. Nonsubject 4 0 0 0 11 9 0 0 0 29
1 Producers, importers, and purchasers were asked if SWG hangers produced in the United States and in other countries areused interchangeably.
Note: “A” = Always, “F” = Frequently, “S” = Sometimes, “N” = Never, and “0” = No familiarity.
Source: Compiled from data submitted in response to Commission questionnaires.

1 Current producers M&B and Metro Supply Co. (“Metro”) and former producers Laidlaw and United Wireresponded to questionnaires. Additionally, the Commission did not receive questionnaires from current producersGanchos and Shanti and from former producers Nagel Manufacturing, Navisa, Rocky Mountain HangerManufacturing, and East West Enterprises. Former producer CHC ceased operations in 2003, prior to the period forwhich data were collected.
III-1
PART III: U.S. PRODUCERS’ PRODUCTION, SHIPMENTS, AND EMPLOYMENT
U.S. PRODUCERS
The petition identified three current and seven former U.S. producers of SWG hangers. TheCommission received completed questionnaire responses from the petitioner and from three of the otherseven firms identified in the petition.1 Table III-1 presents U.S. producers’ positions on the petition,ownership, plant locations, and shares of total reported U.S. production in 2006.Table III-1SWG hangers: U.S. producers, positions on the petition, ownership, plant locations, and shares oftotal reported U.S. production, 2006
Firm
Positionon
petitionFirm
ownershipU.S. plant location(s)
2006 U.S. productionQuantity
(1,000hangers)
Share (percent)
Ganchos1 (2) (2) Puerto Rico *** ***
Laidlaw3 Oppose noneMetropolis, IL; Monticello,WI *** ***
M&B Support none Leeds, AL; South Hill, VA *** ***Metro Support none Montebello, CA *** ***Nagel Manufacturing4 (2) (2) Caldwell, TX *** ***Navisa5 (2) (2) Houston, TX *** ***
Shanti6 (2) (2)Lake Forest, CA;Monticello, WI *** ***
United Wire7 Oppose none Bergen County, NJ *** ***Total *** 100.0
1 Ganchos did not respond to Commission requests for data. All data presented here are from the petition. 2 Not provided. 3 Stopped production in 2007. 4 Stopped production in 2004. 5 Navisa did not respond to Commission requests for data; all data presented here are from the petition. Navisastopped production in 2007. 6 Purchased Laidlaw’s Monticello, WI plant and began production in 2007. 7 Stopped production in 2006.
Note.–Total U.S. production in this table includes estimates for Ganchos, Nagel Manufacturing, and Navisa whichare not included elsewhere in this report.
Source: Compiled from data submitted in response to Commission questionnaires and from Petition, exhibits 5, 7,and 8.
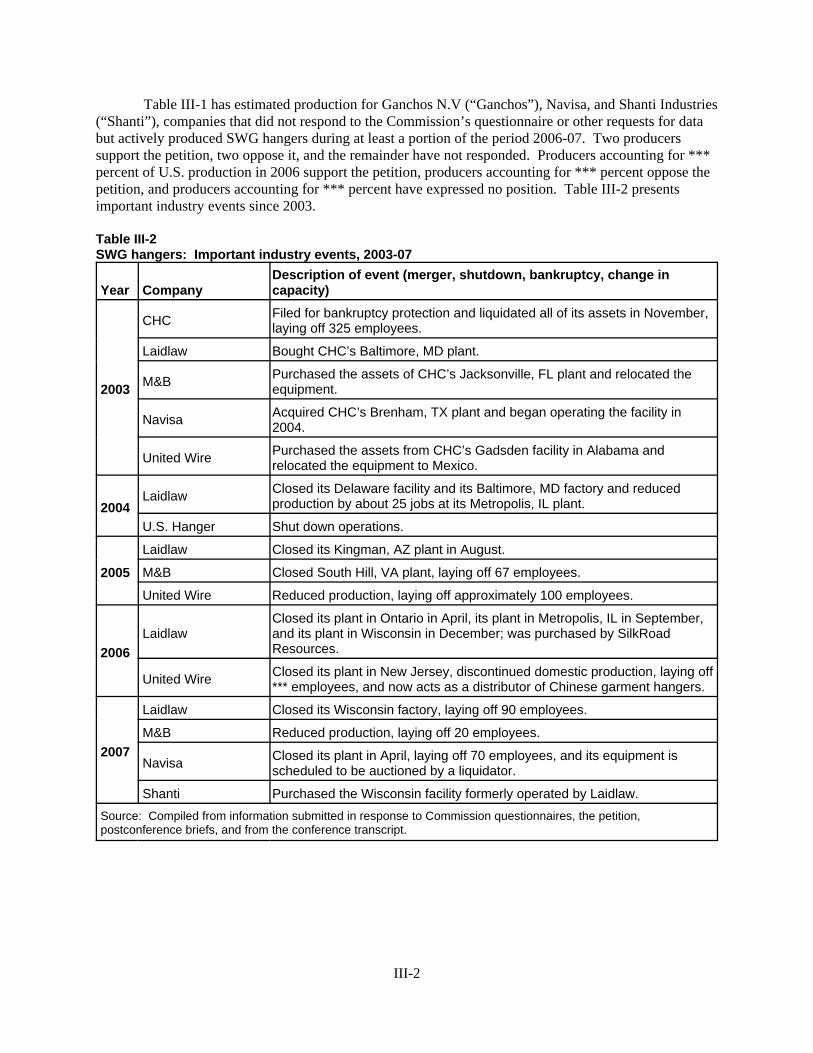
III-2
Table III-1 has estimated production for Ganchos N.V (“Ganchos”), Navisa, and Shanti Industries(“Shanti”), companies that did not respond to the Commission’s questionnaire or other requests for databut actively produced SWG hangers during at least a portion of the period 2006-07. Two producerssupport the petition, two oppose it, and the remainder have not responded. Producers accounting for ***percent of U.S. production in 2006 support the petition, producers accounting for *** percent oppose thepetition, and producers accounting for *** percent have expressed no position. Table III-2 presentsimportant industry events since 2003.
Table III-2SWG hangers: Important industry events, 2003-07
Year Company Description of event (merger, shutdown, bankruptcy, change incapacity)
2003
CHC Filed for bankruptcy protection and liquidated all of its assets in November,laying off 325 employees.
Laidlaw Bought CHC’s Baltimore, MD plant.
M&B Purchased the assets of CHC’s Jacksonville, FL plant and relocated theequipment.
Navisa Acquired CHC’s Brenham, TX plant and began operating the facility in2004.
United Wire Purchased the assets from CHC’s Gadsden facility in Alabama andrelocated the equipment to Mexico.
2004Laidlaw Closed its Delaware facility and its Baltimore, MD factory and reduced
production by about 25 jobs at its Metropolis, IL plant.
U.S. Hanger Shut down operations.
2005
Laidlaw Closed its Kingman, AZ plant in August.
M&B Closed South Hill, VA plant, laying off 67 employees.
United Wire Reduced production, laying off approximately 100 employees.
2006Laidlaw
Closed its plant in Ontario in April, its plant in Metropolis, IL in September,and its plant in Wisconsin in December; was purchased by SilkRoadResources.
United Wire Closed its plant in New Jersey, discontinued domestic production, laying off*** employees, and now acts as a distributor of Chinese garment hangers.
2007
Laidlaw Closed its Wisconsin factory, laying off 90 employees.
M&B Reduced production, laying off 20 employees.
Navisa Closed its plant in April, laying off 70 employees, and its equipment isscheduled to be auctioned by a liquidator.
Shanti Purchased the Wisconsin facility formerly operated by Laidlaw.Source: Compiled from information submitted in response to Commission questionnaires, the petition,postconference briefs, and from the conference transcript.

2 The data in this and other tables in Part III are shown on a company-by-company basis and aggregated based onwhether SWG hanger production is ongoing or has ceased.
III-3
U.S. CAPACITY, PRODUCTION, AND CAPACITY UTILIZATION
Table III-3 presents data on U.S. producers’ capacity, production, and capacity utilizationbetween 2004 and 2006, and interim data for 2006 and 2007.2 The data are graphically presented infigure III-1.
Table III-3SWG hangers: U.S. capacity, production, and capacity utilization, 2004-06, January-June 2006, andJanuary-June 2007
Item
Calendar year January-June
2004 2005 2006 2006 2007
Capacity: Quantity (1,000 hangers)
M&B *** *** *** *** ***
Metro *** *** *** *** ***
Subtotal *** *** *** *** ***
Laidlaw *** *** *** *** ***
United Wire *** *** *** *** ***
Subtotal *** *** *** *** ***
Total 2,610,278 2,069,378 1,511,678 891,539 ***
Production: Quantity (1,000 hangers)
M&B *** *** *** *** ***
Metro *** *** *** *** ***
Subtotal *** *** *** *** ***
Laidlaw *** *** *** *** ***
United Wire *** *** *** *** ***
Subtotal *** *** *** *** ***
Total 2,211,559 1,486,650 689,680 454,912 ***
Capacity utilization: Ratio (percent)
M&B *** *** *** *** ***
Metro *** *** *** *** ***
Subtotal *** *** *** *** ***
Laidlaw *** *** *** *** ***
United Wire *** *** *** *** ***
Subtotal *** *** *** *** ***
Average 84.7 71.8 45.6 51.0 ***
Source: Compiled from data submitted in response to Commission questionnaires.

3 At its plant in Leeds, AL, M&B reported ***. Petitioner’s postconference brief, p. 3.
III-4
Figure III-1SWG hangers: U.S. capacity, production, and capacity utilization, 2004-06, January-June 2006, andJanuary-June 2007
Note.--Confidential data in interim 2007 have been suppressed.
Source: Table III-3.
Reported U.S. production of SWG hangers decreased from 2.2 million hangers in 2004 to689,680 hangers in 2006. Further, production was lower in interim 2007 than in interim 2006. Capacityalso fell over the period, and the average capacity utilization for U.S. producers fell from 84.7 percent in2004 to 45.6 percent in 2006, and was *** percent in interim 2007. U.S. producers’ reported capacitydecreased by 42.1 percent from 2004 to 2006 and was below apparent U.S. consumption in each year andinterim period for which data were collected, such that by January-June 2007 reported capacity wasequivalent to only *** percent of apparent U.S. consumption.3
Generally, U.S. producers of SWG hangers reported mill closures and production consolidationand curtailment from 2004 to 2006, consistent with the decreasing levels of capacity and productionpresented in table III-3. M&B reported the closures of its Virginia plant and other firms’ operations due

4 Conference transcript, pp. 34, 37, and 43 (Magrath). 5 Conference transcript, pp. 98 (Schultz), 105-107 (Goldman), and questionnaire responses of United Wire andLaidlaw.
III-5
to competition with lower priced Chinese SWG hangers.4 Additionally, United Wire ceased production in2006 and now imports SWG hangers from China ***. Laidlaw reported that it began closingmanufacturing plants in order to change its model, moving towards importation, and away fromproduction, of SWG hangers.5
Reported constraints in the manufacturing process for U.S. producers of SWG hangers includethe machinery used to produce the hangers, as well as labor availability, maintenance of the machines,and consistent orders.
U.S. PRODUCERS’ SHIPMENTS
Table III-4 presents information on U.S. producers’ shipments of SWG hangers between 2004and 2006. ***. U.S. producers’ U.S. commercial shipments of SWG hangers decreased by 29.7 percentby quantity (and 28.9 percent by value) from 2004 to 2005, and such shipments decreased by a further51.8 percent by quantity (55.9 percent by value) between 2005 and 2006. Laidlaw and United Wirereported commercial shipments in 2006 were equivalent to only *** percent of the quantity of their 2004commercial shipments, while ***’s 2006 commercial shipments were equivalent to *** percent of thequantity of its 2004 commercial shipments. ***’s 2006 commercial shipments were *** its 2004 levels.
Two U.S. producers reported exporting hangers, which constituted a modest portion of thequantity of U.S. producers’ shipments of SWG hangers throughout the period for which data werecollected. U.S. producers of SWG hangers reported exporting to Canada and Mexico.
Table III-5 presents information on U.S. producers’ U.S. commercial shipments of hangers bytype in 2006. Almost three-quarters of U.S. shipments (by quantity) of SWG hangers in 2006 wereuniform rental hangers (54.8 percent of which were latex uniform rental hangers), and uniform rentalhangers were nearly two-thirds of the sales value of SWG hangers. Low-volume drapery hangerscommanded the highest average unit values, while suit hangers and shirt hangers commanded the lowestaverage unit values.

III-6
Table III-4SWG hangers: U.S. producers’ shipments, by types, and shares, 2004-06, January-June 2006, andJanuary-June 2007
Item
Calendar year January-June
2004 2005 2006 2006 2007
Quantity (1,000 hangers)
U.S. shipments:M&B *** *** *** *** ***
Metro *** *** *** *** ***
Subtotal *** *** *** *** ***
Laidlaw *** *** *** *** ***
United Wire *** *** *** *** ***
Subtotal *** *** *** *** ***
Total U.S. shipments 2,160,009 1,517,601 731,025 455,995 ***
Export shipments:M&B *** *** *** *** ***
Metro *** *** *** *** ***
Subtotal *** *** *** *** ***
Laidlaw *** *** *** *** ***
United Wire *** *** *** *** ***
Subtotal *** *** *** *** ***
Total export shipments *** *** *** *** ***
Total shipments:M&B *** *** *** *** ***
Metro *** *** *** *** ***
Subtotal *** *** *** *** ***
Laidlaw *** *** *** *** ***
United Wire *** *** *** *** ***
Subtotal *** *** *** *** ***
Total shipments *** *** *** *** ***
Table continued on next page.
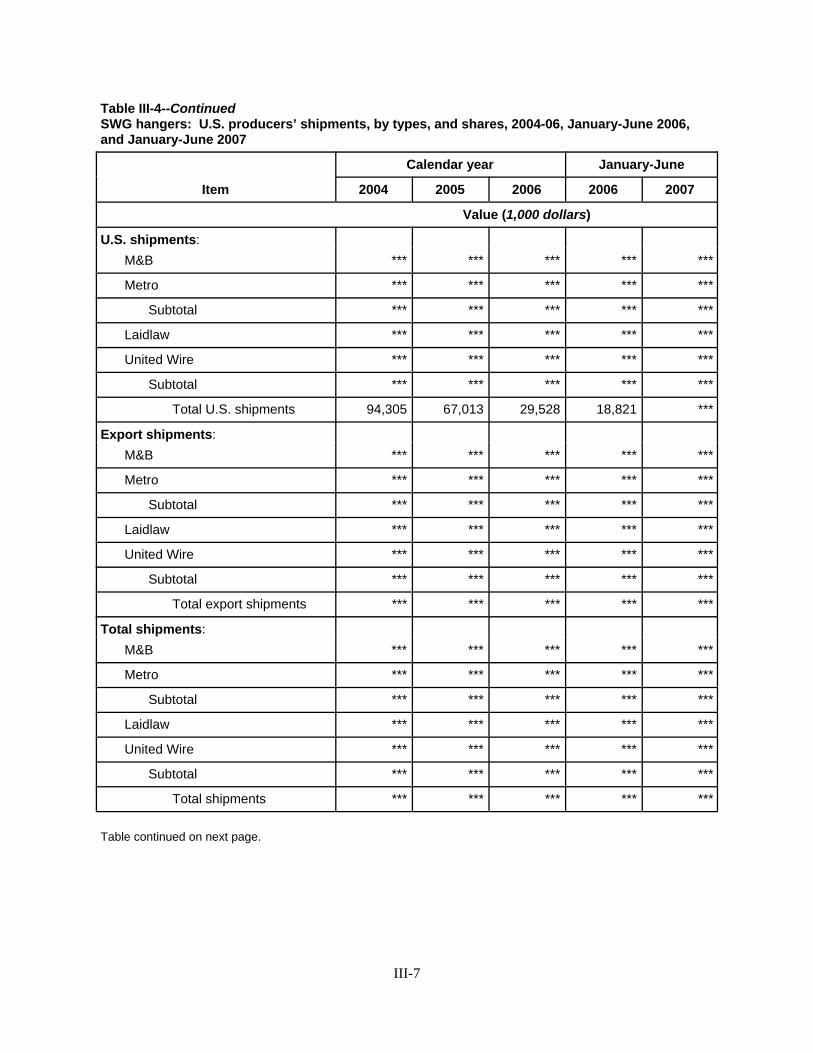
III-7
Table III-4--ContinuedSWG hangers: U.S. producers’ shipments, by types, and shares, 2004-06, January-June 2006,and January-June 2007
Item
Calendar year January-June
2004 2005 2006 2006 2007
Value (1,000 dollars)
U.S. shipments:M&B *** *** *** *** ***
Metro *** *** *** *** ***
Subtotal *** *** *** *** ***
Laidlaw *** *** *** *** ***
United Wire *** *** *** *** ***
Subtotal *** *** *** *** ***
Total U.S. shipments 94,305 67,013 29,528 18,821 ***
Export shipments:M&B *** *** *** *** ***
Metro *** *** *** *** ***
Subtotal *** *** *** *** ***
Laidlaw *** *** *** *** ***
United Wire *** *** *** *** ***
Subtotal *** *** *** *** ***
Total export shipments *** *** *** *** ***
Total shipments:M&B *** *** *** *** ***
Metro *** *** *** *** ***
Subtotal *** *** *** *** ***
Laidlaw *** *** *** *** ***
United Wire *** *** *** *** ***
Subtotal *** *** *** *** ***
Total shipments *** *** *** *** ***
Table continued on next page.

III-8
Table III-4--ContinuedSWG hangers: U.S. producers’ shipments, by types, and shares, 2004-06, January-June 2006,and January-June 2007
Item
Calendar year January-June
2004 2005 2006 2006 2007
Unit value (per 1,000 hangers)
U.S. shipments:M&B $*** $*** $*** $*** $***
Metro *** *** *** *** ***
Subtotal *** *** *** *** ***
Laidlaw *** *** *** *** ***
United Wire *** *** *** *** ***
Subtotal *** *** *** *** ***
Total U.S. shipments 43.66 44.16 40.39 41.27 ***
Export shipments:M&B *** *** *** *** ***
Metro *** *** *** *** ***
Subtotal *** *** *** *** ***
Laidlaw *** *** *** *** ***
United Wire *** *** *** *** ***
Subtotal *** *** *** *** ***
Total export shipments *** *** *** *** ***
Total shipments:M&B *** *** *** *** ***
Metro *** *** *** *** ***
Subtotal *** *** *** *** ***
Laidlaw *** *** *** *** ***
United Wire *** *** *** *** ***
Subtotal *** *** *** *** ***
Total shipments *** *** *** *** ***
Table continued on next page.

III-9
Table III-4--ContinuedSWG hangers: U.S. producers’ shipments, by types, and shares, 2004-06, January-June 2006,and January-June 2007
Item
Calendar year January-June
2004 2005 2006 2006 2007
Share of quantity (percent)
U.S. shipments:M&B *** *** *** *** ***
Metro *** *** *** *** ***
Subtotal *** *** *** *** ***
Laidlaw *** *** *** *** ***
United Wire *** *** *** *** ***
Subtotal *** *** *** *** ***
Total U.S. shipments *** *** *** *** ***
Export shipments:M&B *** *** *** *** ***
Metro *** *** *** *** ***
Subtotal *** *** *** *** ***
Laidlaw *** *** *** *** ***
United Wire *** *** *** *** ***
Subtotal *** *** *** *** ***
Total export shipments *** *** *** *** ***
Total shipments:M&B *** *** *** *** ***
Metro *** *** *** *** ***
Subtotal *** *** *** *** ***
Laidlaw *** *** *** *** ***
United Wire *** *** *** *** ***
Subtotal *** *** *** *** ***
Total shipments 100.0 100.0 100.0 100.0 100.0
Table continued on next page.

III-10
Table III-4--ContinuedSWG hangers: U.S. producers’ shipments, by types, and shares, 2004-06, January-June 2006,and January-June 2007
Item
Calendar year January-June
2004 2005 2006 2006 2007
Share of value (percent)
U.S. shipments:M&B *** *** *** *** ***
Metro *** *** *** *** ***
Subtotal *** *** *** *** ***
Laidlaw *** *** *** *** ***
United Wire *** *** *** *** ***
Subtotal *** *** *** *** ***
Total U.S. shipments *** *** *** *** ***
Export shipments:M&B *** *** *** *** ***
Metro *** *** *** *** ***
Subtotal *** *** *** *** ***
Laidlaw *** *** *** *** ***
United Wire *** *** *** *** ***
Subtotal *** *** *** *** ***
Total export shipments *** *** *** *** ***
Total shipments:M&B *** *** *** *** ***
Metro *** *** *** *** ***
Subtotal *** *** *** *** ***
Laidlaw *** *** *** *** ***
United Wire *** *** *** *** ***
Subtotal *** *** *** *** ***
Total shipments 100.0 100.0 100.0 100.0 100.01 Not applicable.
Note.–Because of rounding, figures may not add to the totals shown.
Source: Compiled from data submitted in response to Commission questionnaires.

6 ***.
III-11
Table III-5Hangers: U.S. producers’ U.S. shipments by type of hanger, 2006
Type of hangerQuantity
(1,000 hangers) Value ($1,000)Unit value
(per 1,000 hangers)
Steel wire garment hangers: Shirt hangers 71,620 2,272 $31.73
Suit hangers 13,745 416 30.25
Strut hangers 63,877 3,870 60.59
Caped hangers 45,881 2,758 60.12
Drapery hangers *** *** ***
Latex uniform rental hangers 290,150 10,626 36.62
Other uniform rental hangers 238,864 8,925 37.36
Other steel wire garment hangers *** *** ***
Subtotal 731,025 29,528 40.39
Wooden garment hangers 0 0 (1)
Plastic garment hangers 0 0 (1)
Aluminum garment hangers 0 0 (1)
Other garment hangers 0 0 (1)
Total 731,025 29,528 40.39
1 Not applicable.
Source: Compiled from data submitted in response to Commission questionnaires.
U.S. PRODUCERS’ IMPORTS AND PURCHASES
During the period for which data were collected, three U.S. producers imported SWG hangersfrom China, and one imported SWG hangers from Mexico.6 Table III-6 presents data, by company, ondomestic producers’ direct imports, purchases of imported product, and purchases from other domesticproducers.
Table III-6SWG hangers: Selected U.S. producers’ imports, purchases, and ratios to production, 2004-06,January-June 2006, and January-June 2007
* * * * * * *

7 Employees that formerly produced SWG hangers at Laidlaw and United Wire were not absorbed within theircontinuing businesses, but instead were laid off. Conference transcript, p. 139 (Schultz, Goldman).
III-12
Table III-7 presents combined data of three domestic producers’ direct imports, purchases ofimported product, and purchases from other domestic producers. U.S. producers of SWG hangerssourced SWG hangers from other domestic producers, China (both direct imports and purchases fromimporters), and directly from Mexico. U.S. producers’ imports from China *** from 2004 to 2006, whiletheir imports from nonsubject sources increased by over *** percent. Additionally, U.S. producers'purchases of SWG hangers imported from China more than *** by 2006. The ratio of imports toproduction increased from *** percent in 2004 to *** percent in 2006. *** imported *** of SWGhangers it produced (mostly from ***); *** imported *** of SWG hangers it produced, and *** importedand purchased from subject sources *** it produced. These ratios were *** in January-June 2007 (or inthe case of *** reflected *** on imported SWG hangers). The reasons cited for making these imports andpurchases are presented in table III-6.
Table III-7SWG hangers: U.S. producers’ imports, purchases, and ratios to production, 2004-06, January-June 2006, and January-June 2007
* * * * * * *
U.S. PRODUCERS’ INVENTORIES
Table III-8, which presents end-of-period inventories for SWG hangers, shows that inventorieswere relatively low as a ratio to production and shipments over the period. Inventories as a ratio toproduction were lower in the interim period January-June 2007 than in January-June 2006.
U.S. PRODUCERS’ EMPLOYMENT, WAGES, AND PRODUCTIVITY
Table III-9 presents data on U.S. producers’ employment-related indicia. Employment ofproduction-related workers (“PRWs”) in the U.S. SWG hanger industry declined by 59.4 percent between2004 and 2006, and hours worked decreased by 68.8 percent.7 Wages paid to PRWs also declined from2004 to 2006, as did unit labor costs, but hourly wages increased. Productivity fluctuated from 2004 to2006, and was up in interim period January-June 2007 compared to January-June 2006.

III-13
Table III-8SWG hangers: U.S. producers’ end-of-period inventories, 2004-06, January-June 2006, andJanuary-June 2007
Item
Calendar year January-June
2004 2005 2006 2006 2007
Inventories (1,000 hangers):M&B *** *** *** *** ***
Metro *** *** *** *** ***
Subtotal *** *** *** *** ***
Laidlaw *** *** *** *** ***
United Wire *** *** *** *** ***
Subtotal *** *** *** *** ***
Total 110,846 71,861 26,810 67,779 ***
Ratio to production (percent):
M&B *** *** *** *** ***
Metro *** *** *** *** ***
Subtotal *** *** *** *** ***
Laidlaw *** *** *** *** ***
United Wire *** *** *** *** ***
Subtotal *** *** *** *** ***
Average 5.0 4.8 3.9 7.5 ***
Ratio to U.S. shipments (percent):M&B *** *** *** *** ***
Metro *** *** *** *** ***
Subtotal *** *** *** *** ***
Laidlaw *** *** *** *** ***
United Wire *** *** *** *** ***
Subtotal *** *** *** *** ***
Average 5.1 4.7 3.7 7.4 ***
Ratio to total shipments (percent):M&B *** *** *** *** ***
Metro *** *** *** *** ***
Subtotal *** *** *** *** ***
Laidlaw *** *** *** *** ***
United Wire *** *** *** *** ***
Subtotal *** *** *** *** ***
Average *** *** *** *** ***
1 Not applicable.
Source: Compiled from data submitted in response to Commission questionnaires.

III-14
Table III-9SWG hangers: U.S. producers’ employment-related data, 2004-06, January-June 2006, andJanuary-June 2007
Item
Calendar year January-June
2004 2005 2006 2006 2007
Production and related workers (PRWs):
M&B *** *** *** *** ***
Metro *** *** *** *** ***
Subtotal *** *** *** *** ***
Laidlaw *** *** *** *** ***
United Wire *** *** *** *** ***
Subtotal *** *** *** *** ***
Total 564 446 229 236 ***
Hours worked by PRWs (1,000 hours):
M&B *** *** *** *** ***
Metro *** *** *** *** ***
Subtotal *** *** *** *** ***
Laidlaw *** *** *** *** ***
United Wire *** *** *** *** ***
Subtotal *** *** *** *** ***
Total 1,344 978 420 326 ***
Hours worked per PRW:
M&B *** *** *** *** ***
Metro *** *** *** *** ***
Subtotal *** *** *** *** ***
Laidlaw *** *** *** *** ***
United Wire *** *** *** *** ***
Subtotal *** *** *** *** ***
Total 2,383 2,193 1,834 1,381 ***
Wages paid to PRWs (1,000 dollars):
M&B *** *** *** *** ***
Metro *** *** *** *** ***
Subtotal *** *** *** *** ***
Laidlaw *** *** *** *** ***
United Wire *** *** *** *** ***
Subtotal *** *** *** *** ***
Total 15,697 13,894 6,064 4,748 ***
Table continued on next page.

III-15
Table III-9--ContinuedSWG hangers: U.S. producers’ shipments, by types, and shares, 2004-06, January-June 2006, andJanuary-June 2007
Item
Calendar year January-June
2004 2005 2006 2006 2007
Hourly wages:
M&B $*** $*** $*** $*** $***
Metro *** *** *** *** ***
Subtotal *** *** *** *** ***
Laidlaw *** *** *** *** ***
United Wire *** *** *** *** ***
Subtotal *** *** *** *** ***
Average 11.68 14.21 14.44 14.56 ***
Productivity (1,000 hangers produced per hour):
M&B *** *** *** *** ***
Metro *** *** *** *** ***
Subtotal *** *** *** *** ***
Laidlaw *** *** *** *** ***
United Wire *** *** *** *** ***
Subtotal *** *** *** *** ***
Average 1,646 1,520 1,642 1,395 ***
Unit labor costs (per 1,000 hangers):
M&B $*** $*** $*** $*** $***
Metro *** *** *** *** ***
Subtotal *** *** *** *** ***
Laidlaw *** *** *** *** ***
United Wire *** *** *** *** ***
Subtotal *** *** *** *** ***
Average 7.10 9.35 8.79 10.44 ***
1 Not applicable.
Note.--***.
Source: Compiled from data submitted in response to Commission questionnaires.


IV-1
PART IV: U.S. IMPORTS, APPARENT U.S. CONSUMPTION, AND MARKET SHARES
U.S. IMPORTERS
Table IV-1 presents information on U.S. importers. All of the importers that submitted data inresponse to the Commission’s U.S. importers’ questionnaire indicated that they imported SWG hangersfrom China. These 22 firms’ imports of SWG hangers from China account for (*** percent) of total U.S.imports from China by quantity in 2006, as measured in official Commerce statistics.
*** of the importers that submitted data in response to the Commission’s U.S. importers’questionnaire indicated that they imported SWG hangers from Mexico: U.S. producer M&B and ***. These *** firms’ imports of SWG hangers from Mexico are believed to account for nearly all of U.S.imports from Mexico by quantity in 2006.

IV-2
Table IV-1SWG hangers: U.S. importers and imports, by source, 2006
Importer
China All others China All othersShare of total
imports1
Quantity (1,000 hangers) Share by source (percent)1 (percent)
Ace Capital LLC *** *** *** *** ***
All Best Distributors, Inc. *** *** *** *** ***
ANA Systems, LLC *** *** *** *** ***
Chung Hwa Prince Group, Inc. *** *** *** *** ***
GoSource USA, LLC *** *** *** *** ***
KC Supply Corp. *** *** *** *** ***
Laidlaw *** *** *** *** ***
M&B *** *** *** *** ***
Micom CHB, Inc. *** *** *** *** ***
NC Supply Inc. *** *** *** *** ***
NuClean Supply, Inc. *** *** *** *** ***
Peter Paul Yee *** *** *** *** ***
Richard Homewares, Inc. *** *** *** *** ***
Royce Hangers, Inc.2 *** *** *** *** ***
SouthWest Laundry & Cleaning Supply, Inc. *** *** *** *** ***
Sunrise Display, Inc. *** *** *** *** ***
Texas Cleaners Supply, Inc.3 *** *** *** *** ***
Tradenet Enterprise, Inc. *** *** *** *** ***
Tyler International Trade, LLC *** *** *** *** ***
United Wire *** *** *** *** ***
Willert Home Products, Inc.4 *** *** *** *** ***
Winca Inc *** *** *** *** ***
Y&S International Trading, Inc. *** *** *** *** ***
Subtotal *** *** *** *** ***
Official Commerce imports 1,777,680 312,182
1 Shares are based on official import statistics. 2 Closed in 2004. 3 ***. 4 Reported importing from ***.
Source: Compiled from data submitted in response to Commission questionnaires and official Commerce statistics.

1 HTS statistical reporting number 7326.20.0020.
IV-3
U.S. IMPORTS
Imports from Subject and Nonsubject Sources
Table IV-2 and figure IV-1 present and depict U.S. imports of SWG hangers during 2004 to 2006and January-June 2006 and 2007. U.S. import data are based on official Commerce statistics of SWGhangers.1 U.S. imports of SWG hangers from China more than doubled, rising from 774 million SWGhangers in 2004 to nearly 1.8 billion hangers in 2006, and exceeded 1.3 billion hangers in the first half of2007. U.S. imports from all other sources, in contrast, remained generally stable over the period forwhich data were collected.
Table IV-2SWG hangers: U.S. imports, by sources, 2004-06, January-June 2006, and January-June 2007
Source
Calendar year January-June
2004 2005 2006 2006 2007
Quantity (1,000 hangers)
China 773,684 1,044,701 1,777,680 838,943 1,321,194
Other sources 311,488 315,631 312,182 167,253 172,315
Total 1,085,172 1,360,331 2,089,862 1,006,196 1,493,509
Value (1,000 dollars)1
China 31,007 39,445 56,335 26,673 38,858
Other sources 10,947 12,231 10,928 5,745 5,746
Total 41,954 51,677 67,263 32,419 44,604
Unit value (per 1,000 hangers)1
China $40.08 $37.76 $31.69 $31.79 $29.41
Other sources 35.14 38.75 35.01 34.35 33.35
Total 38.66 37.99 32.19 32.22 29.87
Share of quantity (percent)
China 71.3 76.8 85.1 83.4 88.5
Other sources 28.7 23.2 14.9 16.6 11.5
Total 100.0 100.0 100.0 100.0 100.0
Share of value (percent)
China 73.9 76.3 83.8 82.3 87.1
Other sources 26.1 23.7 16.2 17.7 12.9
Total 100.0 100.0 100.0 100.0 100.01 Landed, duty-paid.
Source: Compiled from official Commerce statistics.

IV-4
Figure IV-1SWG hangers: Quantity of subject and nonsubject U.S. imports, 2004-06, January-June 2006, andJanuary-June 2007
Source: Table IV-2.
As shown in table IV-3, China is the largest single source of U.S. imports of SWG hangers. Mexico (accounting for 14.3 percent of total U.S. imports of SWG hangers during 2006), Canada(0.4 percent), Korea (0.1 percent), Taiwan (0.1 percent), and 30 other countries (generally less than0.05 percent of 2006 imports) also exported SWG hangers to the United States during the period forwhich data were collected. These nonsubject imports increased by less than one percent during 2004-06. Additionally, in interim period 2007, nonsubject imports were 3.0 percent higher than in January-June2006. Figure IV-2 presents monthly imports from China, Mexico, and all other sources over the periodfor which data were collected.
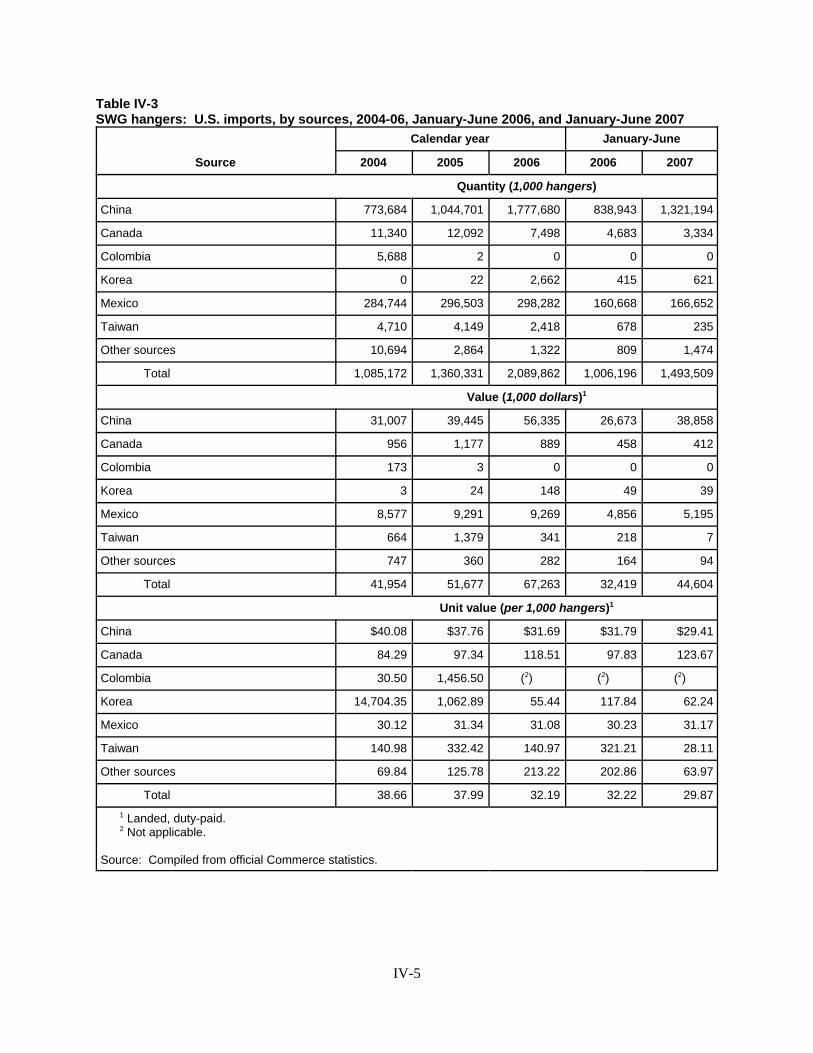
IV-5
Table IV-3SWG hangers: U.S. imports, by sources, 2004-06, January-June 2006, and January-June 2007
Source
Calendar year January-June
2004 2005 2006 2006 2007
Quantity (1,000 hangers)
China 773,684 1,044,701 1,777,680 838,943 1,321,194
Canada 11,340 12,092 7,498 4,683 3,334
Colombia 5,688 2 0 0 0
Korea 0 22 2,662 415 621
Mexico 284,744 296,503 298,282 160,668 166,652
Taiwan 4,710 4,149 2,418 678 235
Other sources 10,694 2,864 1,322 809 1,474
Total 1,085,172 1,360,331 2,089,862 1,006,196 1,493,509
Value (1,000 dollars)1
China 31,007 39,445 56,335 26,673 38,858
Canada 956 1,177 889 458 412
Colombia 173 3 0 0 0
Korea 3 24 148 49 39
Mexico 8,577 9,291 9,269 4,856 5,195
Taiwan 664 1,379 341 218 7
Other sources 747 360 282 164 94
Total 41,954 51,677 67,263 32,419 44,604
Unit value (per 1,000 hangers)1
China $40.08 $37.76 $31.69 $31.79 $29.41
Canada 84.29 97.34 118.51 97.83 123.67
Colombia 30.50 1,456.50 (2) (2) (2)
Korea 14,704.35 1,062.89 55.44 117.84 62.24
Mexico 30.12 31.34 31.08 30.23 31.17
Taiwan 140.98 332.42 140.97 321.21 28.11
Other sources 69.84 125.78 213.22 202.86 63.97
Total 38.66 37.99 32.19 32.22 29.871 Landed, duty-paid.2 Not applicable.
Source: Compiled from official Commerce statistics.

IV-6
Figure IV-2SWG hangers: Monthly imports
Source: Compiled from official Commerce statistics.
The quantity of subject imports increased by 35.0 percent between 2004 and 2005 and by70.2 percent between 2005 and 2006, raising the share of total imports accounted for by subject importsfrom 71.3 percent in 2004 to 85.1 percent in 2006. Total imports increased during 2004-06 by 92.6percent. This increase in imports was almost entirely accounted for by subject imports.
According to the import data presented in table IV-2, subject imports from China in 2004 had ahigher average unit value than that for nonsubject imports. However, in 2005 and 2006, while theaverage unit values for nonsubject imports remained relatively stable, the average unit values for importsfrom China decreased to levels lower than those of nonsubject imports. In January-June 2007, the

2 However, as shown in table IV-3, until January-June 2007, the average unit values of U.S. imports fromMexico, the single largest nonsubject source, were lower than those of U.S. imports from China. 3 Section 733(a)(1) of the Act. 4 Section 771(24) of the Act. 5 Calculated from official Commerce statistics.
IV-7
average unit value for nonsubject imports did begin to decrease, however, the average unit value forChinese imports remained lower.2
Negligibility
The statute requires that an investigation be terminated without an injury determination if importsof the subject merchandise are found to be negligible.3 Negligible imports are generally defined in theTariff Act of 1930, as amended, as imports from a country of merchandise corresponding to a domesticlike product where such imports account for less than 3 percent of the volume of all such merchandiseimported into the United States in the most recent 12-month period for which data are available thatprecedes the filing of the petition or the initiation of the investigation. However, if there are imports ofsuch merchandise from a number of countries subject to investigations initiated on the same day thatindividually account for less than 3 percent of the total volume of the subject merchandise, and if theimports from those countries collectively account for more than 7 percent of the volume of all suchmerchandise imported into the United States during the applicable 12-month period, then imports fromsuch countries are deemed not to be negligible.4 Subject imports accounted for 87.7 percent of totalimports of SWG hangers by quantity between July 2006 and June 2007.5
U.S. Imports by Type
Table IV-4 presents data on reported 2006 U.S. imports of SWG hangers by type. In 2006, shirthangers comprised 32.1 percent of U.S. imports of SWG hangers from China by quantity, followed bystrut hangers at 22.2 percent, and caped hangers at 17.8 percent. All other types of hangers made up 10percent or less of U.S. imports. Drapery hangers had the highest average unit value among identifiedhanger types (i.e., excluding “other” SWG hangers), at $54.74 per 1,000 hangers, followed by struthangers at $40.53. At $27.98, shirt hangers had the lowest average unit value. Importers who importedSWG hangers from China also imported nonsubject wooden and plastic garment hangers, but in relativelysmall volumes.

IV-8
Table IV-4Hangers: Reported U.S. imports from China, by type, 2006
ItemQuantity
(1.000 hangers)Value
(1,000 dollars)
Unit value(dollars per 1,000
hangers)
Subject:Shirt hangers 380,343 10,641 $27.98
Suit hangers 116,458 3,437 29.51
Strut hangers 263,041 10,660 40.53
Caped hangers 211,198 6,817 32.28
Drapery hangers 6,354 348 54.74
Latex uniform rental hangers 98,365 3,460 35.18
Other uniform hangers 58,872 1,821 30.93
Other SWG hangers 48,878 6,563 134.28
Subtotal (SWG hangers) 1,183,508 43,747 36.96
Nonsubject:Wooden garment hangers 9,618 4,711 489.81
Plastic garment hangers 5,280 630 119.25
Aluminum hangers 0 0 (1)
Other garment hangers 0 0 (1)
Subtotal other hangers 14,898 5,341 358.48
Total 1,198,406 49,088 40.96
1 Not applicable.
Source: Compiled from data submitted in response to Commission questionnaires.
U.S. Imports by Geographic Markets
Table IV-5 presents the Customs districts of entry for subject imports of SWG hangers from 2004to 2006. Los Angeles, CA, was the largest district of entry for imports from China, accounting for43 percent of total subject imports from 2004 to 2006 and more than two times the quantity of importslanded at any other port. New York, NY, was the next largest port with 17 percent of subject imports. Three of the top four ports of entry were on the West Coast.

IV-9
Table IV-5SWG hangers: U.S. imports from China, by Customs district, 2004-06, January-June 2006, andJanuary-June 2007
Customs district
Calendar year January-June
2004 2005 2006 2006 2007
Quantity (1,000 hangers)
Los Angeles, CA 330,413 471,630 752,838 379,988 509,070
New York, NY 140,904 90,557 368,070 157,758 227,702
Seattle, WA 38,037 91,166 111,490 62,784 139,097
San Francisco, CA 40,260 83,810 103,798 46,420 73,094
Houston-Galveston, TX 58,188 74,208 67,201 24,414 72,539
Savannah, GA 21,898 42,887 63,792 41,666 45,476
Baltimore, MD 42,752 27,863 54,070 20,536 32,108
Norfolk, VA 16,921 45,747 45,249 21,487 19,083
Miami, FL 24,100 11,028 22,183 13,423 14,951
Chicago, IL 4,871 14,962 28,486 13,009 21,496
Dallas-Fort Worth, TX 15,082 12,938 26,320 7,560 15,058
Charlotte, NC 1,552 21,160 18,889 7,187 12,557
Tampa, FL 5,240 5,098 21,418 11,051 20,331
Charleston, SC 7 8,630 9,980 1,660 29,695
St. Louis, MO 8,640 1,295 15,102 5,381 19,128
Boston, MA 0 8,618 11,184 2,457 8,128
Columbia-Snake, OR 2,835 5,055 12,337 5,532 6,309
Great Falls, MT 7,542 4,848 8,650 7,773 2,216
Minneapolis, MN 716 2,908 5,409 1,996 11,705
Philadelphia, PA 2,970 1,580 4,174 70 11,244
San Juan, PR 842 5,859 2,560 625 10,053
Detroit, MI 7,462 2,923 4,713 1,566 2,346
Cleveland, OH 197 2,860 6,808 156 4,031
New Orleans, LA 621 2,027 2,986 1,167 4,380
Mobile, AL 270 0 3,583 346 6,076
Honolulu, HI 919 2,529 3,299 1,666 3,108
Nogales, AZ 6 2,277 0 0 0
El Paso, TX 0 0 1,974 575 15
Buffalo, NY 435 235 160 75 201
San Diego, CA 0 0 956 612 0
Ogdensburg, NY 5 0 0 0 0
Anchorage, AK 0 0 3 2 0
Total 773,684 1,044,701 1,777,680 838,943 1,321,194
Source: Compiled from official Commerce statistics.

IV-10
APPARENT U.S. CONSUMPTION, U.S. MARKET SHARES, AND RATIOS OF IMPORTS TO U.S. PRODUCTION
Table IV-6 presents data on the apparent U.S. consumption of SWG hangers. Table IV-7presents data on U.S. market shares. Figure IV-3 graphically presents data on apparent U.S. consumptionand U.S. market shares.
Table IV-6SWG hangers: Apparent U.S. consumption, by sources, 2004-06, January-June 2006, and January-June 2007
Item
Calendar year January-June
2004 2005 2006 2006 2007
Quantity (1,000 hangers)
U.S. producers’ shipments 2,160,009 1,517,601 731,025 455,995 ***
U.S. imports from--China 773,684 1,044,701 1,777,680 838,943 1,321,194
All other sources 311,488 315,631 312,182 167,253 172,315
Total imports 1,085,172 1,360,331 2,089,862 1,006,196 1,493,509
Apparent U.S. consumption 3,245,181 2,877,932 2,820,887 1,462,191 ***
Value (1,000 dollars)
U.S. producers’ shipments 94,305 67,013 29,528 18,821 ***
U.S. imports from--China 31,007 39,445 56,335 26,673 38,858
All other sources 10,947 12,231 10,928 5,745 5,746
Total imports 41,954 51,677 67,263 32,419 44,604
Apparent U.S. consumption 136,259 118,690 96,791 51,240 ***
Source: Compiled from data submitted in response to Commission questionnaires and from official Commercestatistics.
Over the period for which data were collected, total apparent U.S. consumption decreased. Imports nearly doubled between 2004 and 2006 while U.S. producers’ U.S. shipments decreased bynearly two-thirds. From 2004 to 2006, imports of SWG hangers from China increased by 130 percent,while imports increased marginally from nonsubject sources. Imports from China and nonsubject sourcesincreased between the interim periods.

IV-11
Table IV-7SWG hangers: Apparent U.S. consumption and market shares, by sources, 2004-06, January-June2006, and January-June 2007
Item
Calendar year January-June
2004 2005 2006 2006 2007
Quantity (1,000 hangers)
Apparent U.S. consumption 3,245,181 2,877,932 2,820,887 1,462,191 ***
Value (1,000 dollars)
Apparent U.S. consumption 136,259 118,690 96,791 51,240 ***
Share of quantity (percent)
U.S. producers’ U.S. shipments 66.6 52.7 25.9 31.2 ***
U.S. imports from--China 23.8 36.3 63.0 57.4 ***
Nonsubject countries 9.6 11.0 11.1 11.4 ***
All countries 33.4 47.3 74.1 68.8 ***
Share of value (percent)
U.S. producers’ U.S. shipments 69.2 56.5 30.5 36.7 ***
U.S. imports from--China 22.8 33.2 58.2 52.1 ***
Nonsubject countries 8.0 10.3 11.3 11.2 ***
All countries 30.8 43.5 69.5 63.3 ***
Source: Compiled from data submitted in response to Commission questionnaires and from official Commerce statistics.
U.S. producers’ U.S. shipments’ share of the quantity and value of apparent U.S. consumption ofSWG hangers decreased from 2004 to 2006, while imports from China increased in both share of quantityand share of value. Subject imports accounted for a higher percentage of the U.S. market with respect toquantity than with respect to value in each year. Throughout the period for which data were collected,nonsubject imports accounted for a relatively stable share of the market in terms of quantity and value (in2006, nonsubject imports accounted for 11.1 percent of the U.S. market by quantity, and 11.3 percent ofthe U.S. market by value).

IV-12
Figure IV-3SWG hangers: Apparent U.S. consumption, by sources, 2004-06, January-June 2006, and January-June 2007
Note.--Confidential data in interim 2007 have been suppressed.
Source: Table IV-6.
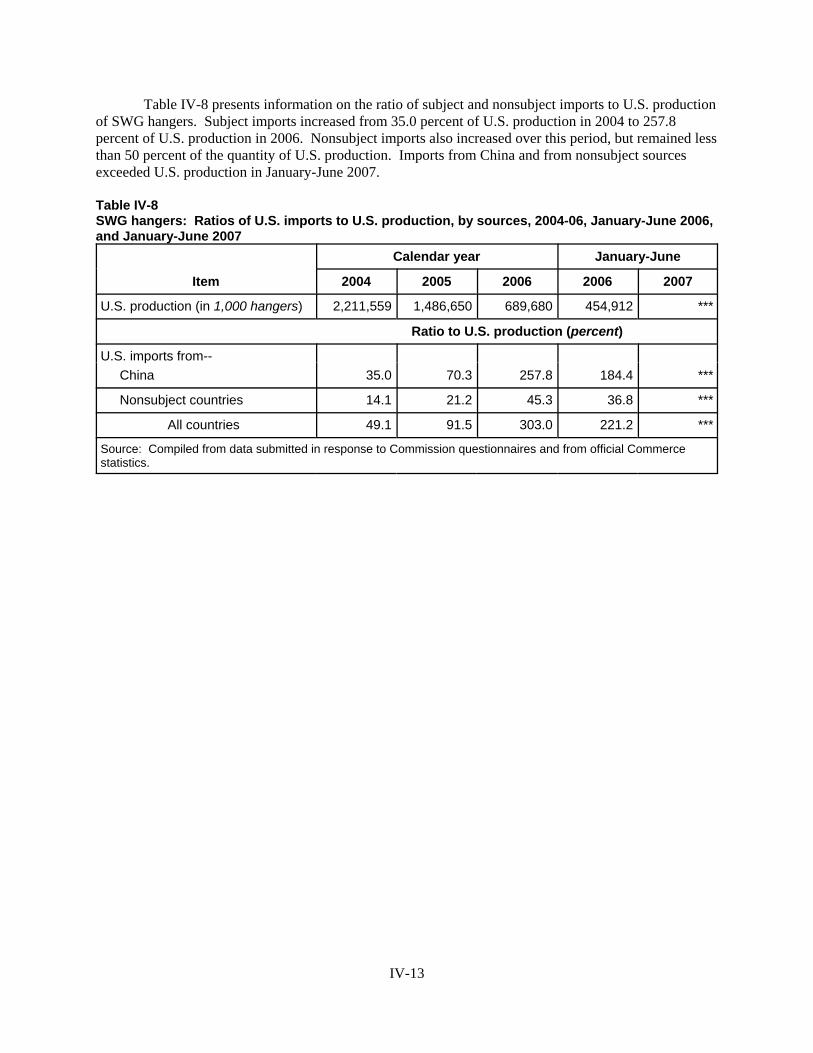
IV-13
Table IV-8 presents information on the ratio of subject and nonsubject imports to U.S. productionof SWG hangers. Subject imports increased from 35.0 percent of U.S. production in 2004 to 257.8percent of U.S. production in 2006. Nonsubject imports also increased over this period, but remained lessthan 50 percent of the quantity of U.S. production. Imports from China and from nonsubject sourcesexceeded U.S. production in January-June 2007.
Table IV-8SWG hangers: Ratios of U.S. imports to U.S. production, by sources, 2004-06, January-June 2006,and January-June 2007
Item
Calendar year January-June
2004 2005 2006 2006 2007
U.S. production (in 1,000 hangers) 2,211,559 1,486,650 689,680 454,912 ***
Ratio to U.S. production (percent)
U.S. imports from--China 35.0 70.3 257.8 184.4 ***
Nonsubject countries 14.1 21.2 45.3 36.8 ***
All countries 49.1 91.5 303.0 221.2 ***
Source: Compiled from data submitted in response to Commission questionnaires and from official Commerce statistics.

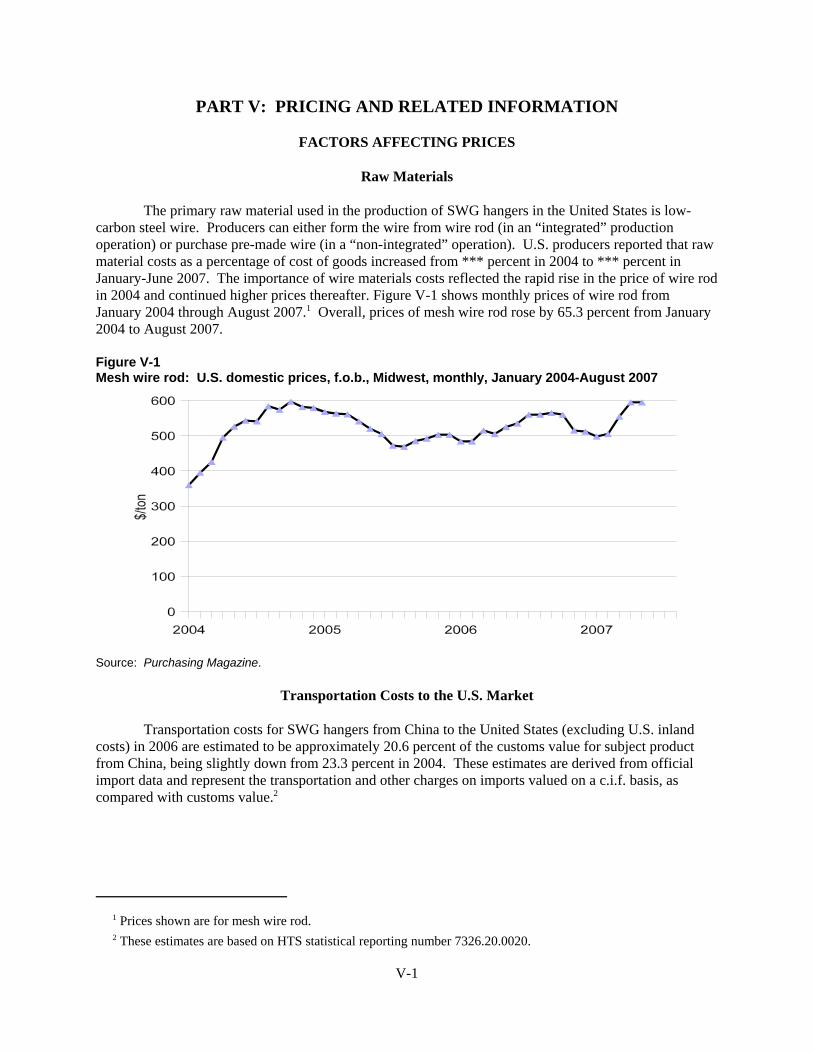
1 Prices shown are for mesh wire rod. 2 These estimates are based on HTS statistical reporting number 7326.20.0020.
V-1
PART V: PRICING AND RELATED INFORMATION
FACTORS AFFECTING PRICES
Raw Materials
The primary raw material used in the production of SWG hangers in the United States is low-carbon steel wire. Producers can either form the wire from wire rod (in an “integrated” productionoperation) or purchase pre-made wire (in a “non-integrated” operation). U.S. producers reported that rawmaterial costs as a percentage of cost of goods increased from *** percent in 2004 to *** percent inJanuary-June 2007. The importance of wire materials costs reflected the rapid rise in the price of wire rodin 2004 and continued higher prices thereafter. Figure V-1 shows monthly prices of wire rod fromJanuary 2004 through August 2007.1 Overall, prices of mesh wire rod rose by 65.3 percent from January2004 to August 2007.
Figure V-1Mesh wire rod: U.S. domestic prices, f.o.b., Midwest, monthly, January 2004-August 2007
Source: Purchasing Magazine.
Transportation Costs to the U.S. Market
Transportation costs for SWG hangers from China to the United States (excluding U.S. inlandcosts) in 2006 are estimated to be approximately 20.6 percent of the customs value for subject productfrom China, being slightly down from 23.3 percent in 2004. These estimates are derived from officialimport data and represent the transportation and other charges on imports valued on a c.i.f. basis, ascompared with customs value.2

3 These data are from U.S. producers who produced during the period, but now there is only one domesticnational U.S. producer of SWG hangers. 4 Producer price data in China were not available to calculate real exchange rates of the yuan vis-a-vis the U.S.dollar during January 2004-June 2007. 5 The Chinese government effectively pegged the yuan to the U.S. dollar at 8.28 yuan per dollar during the earlypart of this period. On July 21, 2005, the Chinese government announced that it would no longer peg the yuan to theU.S. dollar but would tie the yuan to a basket of currencies. Within this new basket, the yuan was revalued upwardagainst the U.S. dollar by 2.1 percent, or from 8.28 yuan per dollar under the old peg to 8.11 yuan per dollar underthe new exchange rate policy. The Chinese government has not disclosed which currencies are in the new basket,but indicated that the weight of the U.S. dollar represented less than 50 percent of the new basket of currencies.
V-2
U.S. Inland Transportation Costs
U.S. inland transportation costs, as a percent of total delivered cost for SWG hangers, werereported by three U.S. producers to be between 3 percent and 10 percent, with one responding U.S.producer reporting transportation costs of 100 percent of the delivered price.3 The 18 responding Chineseimporters reported that U.S. inland transportation costs generally ranged from 0.2 percent and 25 percentof the total delivered costs, with 14 reporting transportation costs of 10 percent or less. All U.S.producers and nearly all U.S. importers reported that their firm arranged for transportation. Producersand importers were also asked to estimate the percentage of their sales that occurred within certaindistance ranges. On average, U.S. producers responded that 46.3 percent of their sales occurred within100 miles, 48.8 percent between 101 and 1,000, and 5.0 percent more than 1,000 miles. Seven of 14responding importers reported shipping at least 52.6 percent of their shipments were within 100 miles;five reported shipping at least 28.7 percent of their sales between 101 and 1,000 miles; and one reportedshipping at least 18.7 percent of its sales more than 1,000 miles.
Exchange Rates
From January 2004 to June of 2005, the Chinese currency was pegged at 8.28 yuan per U.S.dollar. There was a small revaluation in the third quarter of 2005, raising the value of the Chinese yuan to8.14 yuan per dollar after which the yuan was moved to a partial float against the dollar. The yuanappreciated further in the fourth quarter of 2005, averaging 8.08 yuan per dollar. The yuan continued toappreciate in 2006, averaging 7.97 yuan per dollar.
Figure V-2 shows the quarterly nominal exchange rate index of the Chinese yuan relative to theU.S. dollar during January 2004-March 2007.4 The nominal exchange rate for the Chinese yuan vis-a-visthe U.S. dollar remained stable during January 2004-June 2005, with some appreciation (6.6 percent) ofthe Chinese yuan against the U.S. dollar by January-March 2007.5

V-3
Figure V-2Nominal exchange rate indices of the Chinese yuan relative to the U.S. dollar, by quarters, January2004-March 2007
Note.--Index (Jan.-Mar. 2004=100). Exchange rates are in U.S. dollars per Chinese yuan.
Source: International Monetary Fund, International Financial Statistics, February 2006 and May 2007.
PRICING PRACTICES
Pricing Methods
SWG hangers are generally sold on a spot basis. Two of the four responding U.S. producers,including ***, reported that *** percent of their sales were made on a spot basis, with the third reportingthat *** percent of its sales were made on a spot basis and *** percent of its sales were made on a short-term contract basis with contracts lasting three months. This producer also reported that its contracts did***. Twelve of 19 responding importers also reported that 100 percent of their sales were made on a spotbasis, while 3 reported that 2 percent, 20 percent, and 10 percent, respectively, of their sales were madeon a spot basis. Three importers reported that at least 80 percent of their sales were on a short termcontract basis; one importer reported that long-term sales accounted for 100 percent of its sales; and theremaining importers reported that they accepted orders as needed.
Responding U.S. producers reported making at least 75 percent of their sales from inventory.Lead times for sales from inventory were 3 days to a week while lead times on product-to-order averaged7 days. Responding importers also sell both from inventory and on a produced-to-order basis. Five of18 responding importers reported making 100 percent of their sales from inventory, with another4 importers reported that at least 75 percent of their sales were from inventory. Six responding importersreported 100 percent of their sales were on a produce-to-order basis. Reported lead times on sales frominventory made by importers ranged from 2 days to two weeks while lead times on produced-to-ordersales range from 30 days to 90 days, with 5 of the responding importers that sold on a produce-to-orderbasis reporting lead times of at least 30 days. Two of the four responding U.S. producers reported havinga price list, another producer reported determining prices through transaction-by-transaction negotiations,and the remaining producer used verbal contracts for multiple shipments.
Eight of 17 responding importers reported determining price through transaction-by-transactionnegotiations. Five responding importers reported using price lists, although some of these also relied onnegotiations. Five responding importers reported using a “cost-plus” method to determine price, and
V-4
7 reported that their prices were determined by market conditions. Eight of 19 responding importersreported giving some sort of discount. Most discounts are based on individual order quantity or annualvolume. Eleven importers reported that they have no discount policy. Eight of the responding importersreported typical sales terms ranging from net 10 to 60 days, four reported COD at delivery or at the port,and three reported net 30 to 60 days at the port.
PRICE DATA
The Commission requested U.S. producers and importers of SWG hangers to provide quarterlydata for the total quantity and f.o.b (U.S. point of shipment) value of SWG hangers that were shipped tounrelated customers in the U.S. market. Data were requested for the period January 2004 to June 2007.The products for which pricing data were requested are defined as follows:
Product 1. - 18-inch white shirt hangersProduct 2. - 13 gauge / 16-inch caped hangersProduct 3. - 13 gauge / 16-inch stock print caped hangersProduct 4. - 14 ½ gauge / 16-inch plain caped hangersProduct 5. - 14 ½ gauge / 16-inch stock print caped hangersProduct 6. - 16-inch strut hangersProduct 7. - 13 gauge / 16-inch latex hangers
Four U.S. producers, as well as 21 importers of SWG hangers from China, provided usablepricing data for sales of the requested products, although not all firms reported pricing for all quarters.Tables V-1 through V-7 and figures V-3 through V-9 present f.o.b. (U.S. point of shipment) selling pricesto unrelated customers for the seven products defined above which were produced and sold in the UnitedStates as well as for products produced in China and sold in the United States. By quantity, pricing datareported by reporting firms accounted for 37.5 percent of U.S. commercial shipments of U.S.-producedSWG hangers and 18.0 percent of reported U.S. commercial shipments of Chinese-produced SWGhangers for January 1, 2004 through June 2007.

V-5
Table V-1SWG hangers: Weighted-average f.o.b. prices and quantities of domestic and imported product 1and margins of underselling/(overselling), by quarters, January 2004 - June 2007
Period
United States China
Price(per 1,000hangers)
Quantity(1,000 hangers)
Price(per 1,000hangers)
Quantity (1,000 hangers)
Margin(percent)
2004:Jan.-Mar. *** *** 26.61 22,356 ***
Apr.-June *** *** 26.81 29,062 ***
July-Sept. *** *** 26.22 33,483 ***
Oct.-Dec. *** *** 26.70 36,642 ***
2005:Jan.-Mar. *** *** 24.74 26,059 ***
Apr.-June *** *** 24.90 32,481 ***
July-Sept. *** *** 23.33 19,344 ***
Oct.-Dec. *** *** 23.28 30,879 ***
2006:Jan.-Mar. *** *** 24.76 24,458 ***
Apr.-June *** *** 23.36 32,148 ***
July-Sept. *** *** 23.26 29,341 ***
Oct.-Dec. *** *** 22.92 28,079 ***
2007:Jan.-Mar. *** *** 22.65 27,378 ***
Apr.-June *** *** 22.97 37,500 ***
Source: Compiled from data submitted in response to Commission questionnaires.
Figure V-3SWG hangers: Weighted-average prices of domestic and imported product 1, by quarters, January2004-June 2007
* * * * * * *

V-6
Table V-2SWG hangers: Weighted-average f.o.b. prices and quantities of domestic and imported product 2and margins of underselling/(overselling), by quarters, January 2004 - June 2007
Period
United States China
Price(per 1,000hangers)
Quantity(1,000 hangers)
Price(per 1,000hangers)
Quantity (1,000 hangers)
Margin(percent)
2004:Jan.-Mar. *** *** $43.13 2,608 ***
Apr.-June *** *** 43.16 3,441 ***
July-Sept. *** *** 40.13 5,628 ***
Oct.-Dec. *** *** 42.30 3,771 ***
2005:Jan.-Mar. *** *** 36.49 3,426 ***
Apr.-June *** *** 36.17 3,319 ***
July-Sept. *** *** 35.27 3,703 ***
Oct.-Dec. *** *** 27.95 4,163 ***
2006:Jan.-Mar. *** *** 32.36 2,283 ***
Apr.-June *** *** 29.00 3,203 ***
July-Sept. *** *** 30.33 3,267 ***
Oct.-Dec. *** *** 30.21 3,781 ***
2007:Jan.-Mar. *** *** 30.27 2,868 ***
Apr.-June *** *** 28.06 3,721 ***
Source: Compiled from data submitted in response to Commission questionnaires.
Figure V-4SWG hangers: Weighted-average prices of domestic and imported product 2, by quarters, January2004-June 2007
* * * * * * *
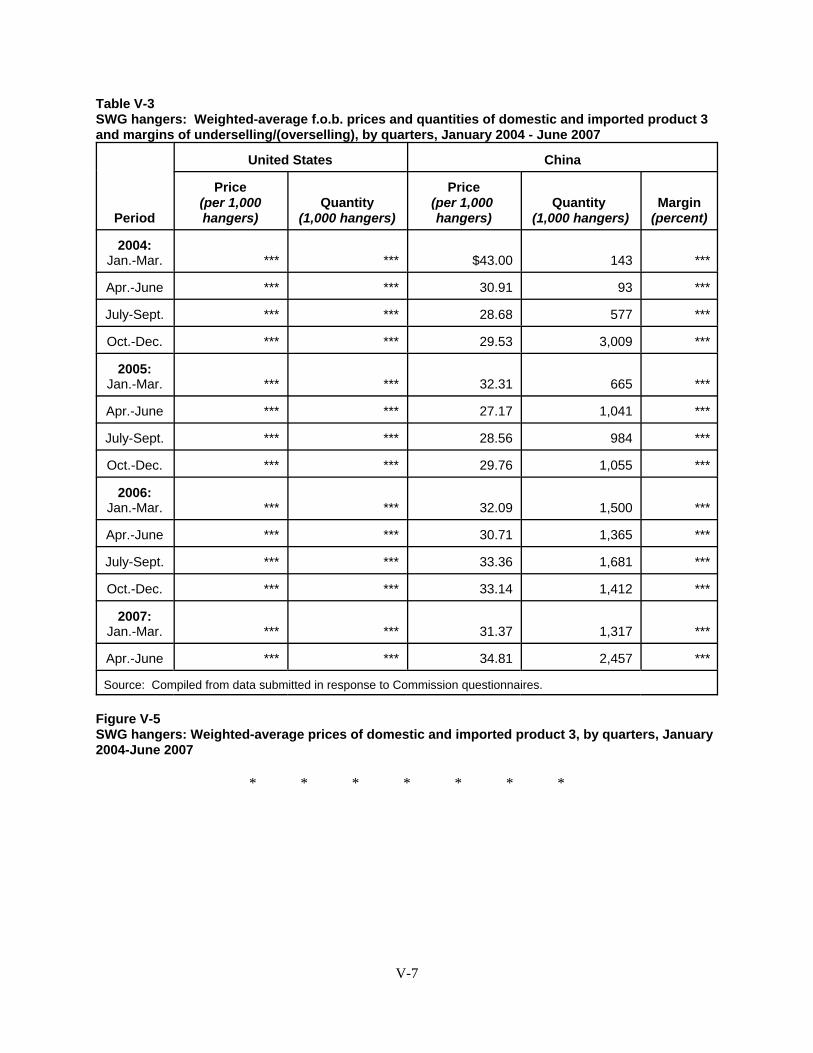
V-7
Table V-3SWG hangers: Weighted-average f.o.b. prices and quantities of domestic and imported product 3and margins of underselling/(overselling), by quarters, January 2004 - June 2007
Period
United States China
Price(per 1,000hangers)
Quantity(1,000 hangers)
Price(per 1,000hangers)
Quantity (1,000 hangers)
Margin(percent)
2004:Jan.-Mar. *** *** $43.00 143 ***
Apr.-June *** *** 30.91 93 ***
July-Sept. *** *** 28.68 577 ***
Oct.-Dec. *** *** 29.53 3,009 ***
2005:Jan.-Mar. *** *** 32.31 665 ***
Apr.-June *** *** 27.17 1,041 ***
July-Sept. *** *** 28.56 984 ***
Oct.-Dec. *** *** 29.76 1,055 ***
2006:Jan.-Mar. *** *** 32.09 1,500 ***
Apr.-June *** *** 30.71 1,365 ***
July-Sept. *** *** 33.36 1,681 ***
Oct.-Dec. *** *** 33.14 1,412 ***
2007:Jan.-Mar.
*** *** 31.37 1,317 ***
Apr.-June *** *** 34.81 2,457 ***
Source: Compiled from data submitted in response to Commission questionnaires.
Figure V-5SWG hangers: Weighted-average prices of domestic and imported product 3, by quarters, January2004-June 2007
* * * * * * *

V-8
Table V-4SWG hangers: Weighted-average f.o.b. prices and quantities of domestic and imported product 4and margins of underselling/(overselling), by quarters, January 2004 - June 2007
Period
United States China
Price(per 1,000hangers)
Quantity(1,000 hangers)
Price(per 1,000hangers)
Quantity (1,000 hangers)
Margin(percent)
2004:Jan.-Mar. *** *** $39.54 1,524 ***
Apr.-June *** *** 44.24 3,229 ***
July-Sept. *** *** 39.39 4,681 ***
Oct.-Dec. *** *** 38.04 4,243 ***
2005:Jan.-Mar. *** *** 37.27 3,352 ***
Apr.-June *** *** 34.56 4,368 ***
July-Sept. *** *** 30.90 2,221 ***
Oct.-Dec. *** *** 28.24 1,688 ***
2006:Jan.-Mar. *** *** 27.52 2,520 ***
Apr.-June *** *** 27.08 2,345 ***
July-Sept. *** *** 28.05 2,768 ***
Oct.-Dec. *** *** 27.52 2,216 ***
2007:Jan.-Mar. *** *** 27.59 2,200 ***
Apr.-June *** *** 28.15 2,592 ***
Source: Compiled from data submitted in response to Commission questionnaires.
Figure V-6SWG hangers: Weighted-average prices of domestic and imported product 4, by quarters, January2004-June 2007
* * * * * * *

V-9
Table V-5SWG hangers: Weighted-average f.o.b. prices and quantities of domestic and imported product 5and margins of underselling/(overselling), by quarters, January 2004 - June 2007
Period
United States China
Price(per 1,000hangers)
Quantity(1,000 hangers)
Price(per 1,000hangers)
Quantity (1,000 hangers)
Margin(percent)
2004:Jan.-Mar. *** ***
$36.23
2,077 ***
Apr.-June *** *** 37.32 1,904 ***
July-Sept. *** *** 36.05 706 ***
Oct.-Dec. *** *** 34.01 902 ***
2005:Jan.-Mar. *** ***
32.30
3,501 ***
Apr.-June *** *** 30.95 7,286 ***
July-Sept. *** *** 30.38 3,966 ***
Oct.-Dec. *** *** 26.77 6,788 ***
2006:Jan.-Mar. *** ***
26.93 5,553 ***
Apr.-June *** *** 29.05 6,286 ***
July-Sept. *** *** 29.01 5,015 ***
Oct.-Dec. *** *** 28.99 5,110 ***
2007:Jan.-Mar.
*** *** 27.96 3,950 ***
Apr.-June *** *** 28.31 6,015 ***
Source: Compiled from data submitted in response to Commission questionnaires.
Figure V-7SWG hangers: Weighted-average prices of domestic and imported product 5, by quarters, January2004-June 2007
* * * * * * *
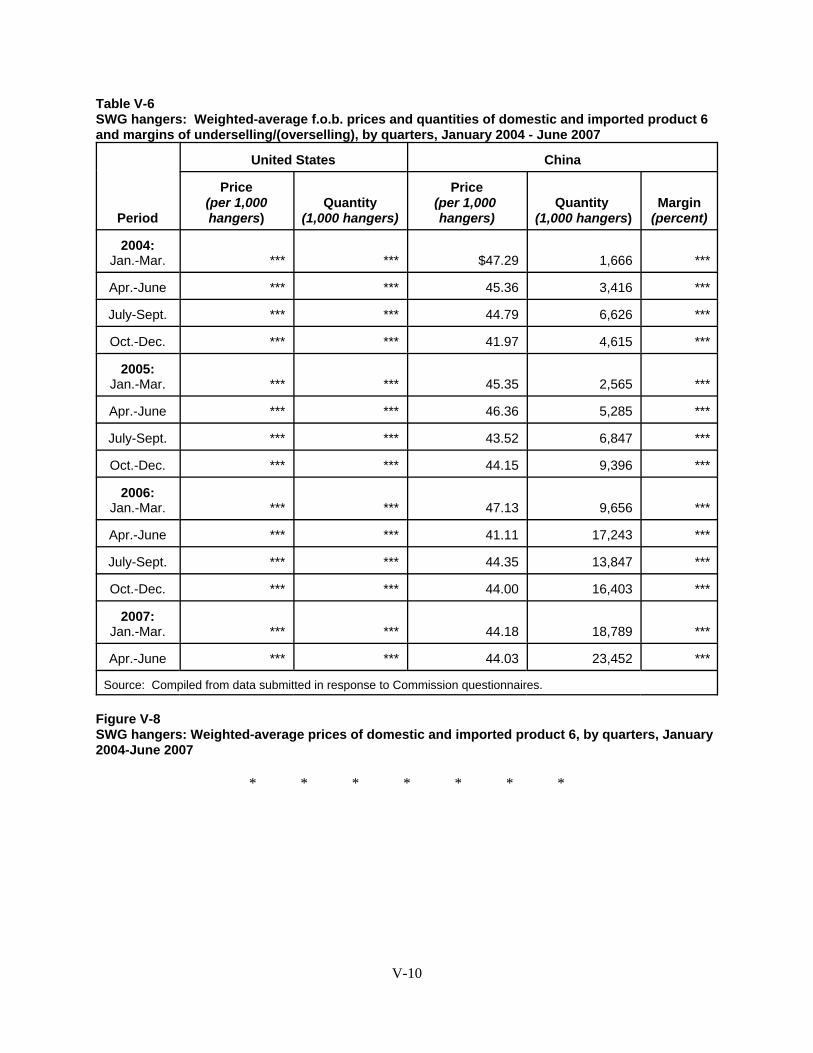
V-10
Table V-6SWG hangers: Weighted-average f.o.b. prices and quantities of domestic and imported product 6and margins of underselling/(overselling), by quarters, January 2004 - June 2007
Period
United States China
Price(per 1,000hangers)
Quantity(1,000 hangers)
Price(per 1,000hangers)
Quantity (1,000 hangers)
Margin(percent)
2004:Jan.-Mar. *** *** $47.29 1,666 ***
Apr.-June *** *** 45.36 3,416 ***
July-Sept. *** *** 44.79 6,626 ***
Oct.-Dec. *** *** 41.97 4,615 ***
2005:Jan.-Mar. *** *** 45.35
2,565 ***
Apr.-June *** *** 46.36 5,285 ***
July-Sept. *** *** 43.52 6,847 ***
Oct.-Dec. *** *** 44.15 9,396 ***
2006:Jan.-Mar. *** *** 47.13 9,656 ***
Apr.-June *** *** 41.11 17,243 ***
July-Sept. *** *** 44.35 13,847 ***
Oct.-Dec. *** *** 44.00 16,403 ***
2007:Jan.-Mar.
***
***
44.18
18,789 ***
Apr.-June *** *** 44.03 23,452 ***
Source: Compiled from data submitted in response to Commission questionnaires.
Figure V-8SWG hangers: Weighted-average prices of domestic and imported product 6, by quarters, January2004-June 2007
* * * * * * *

V-11
Table V-7SWG hangers: Weighted-average f.o.b. prices and quantities of domestic and imported product 7and margins of underselling/(overselling), by quarters, January 2004 - June 2007
Period
United States China
Price(per 1,000hangers)
Quantity(1,000 hangers)
Price(per 1,000hangers)
Quantity (1,000 hangers)
Margin(percent)
2004:Jan.-Mar. *** *** - - -
Apr.-June *** *** - - -
July-Sept. *** *** - - -
Oct.-Dec. *** *** - - -
2005:Jan.-Mar. *** *** $25.79 266 ***
Apr.-June *** *** 25.80 953 ***
July-Sept. *** *** 23.54 2,089 ***
Oct.-Dec. *** *** 25.80 906 ***
2006:Jan.-Mar. *** *** 23.55 3,345 ***
Apr.-June *** *** 26.48 3,248 ***
July-Sept. *** *** 27.30 17,574 ***
Oct.-Dec. *** *** 27.35 18,543 ***
2007:Jan.-Mar. *** *** 26.60 26,218 ***
Apr.-June *** *** 27.95 38,568 ***
Source: Compiled from data submitted in response to Commission questionnaires.
Figure V-9SWG hangers: Weighted-average prices of domestic and imported product 7, by quarters, January2004-June 2007
* * * * * * *

V-12
Price Trends
The weighted average quarterly selling prices of SWG hangers produced domestically andimported from China fluctuated during 2004-June 2007, but tended downward during this period (tablesV-1 through V-7). Quarterly selling prices of U.S. produced product 1 decreased by *** percent, whileprices of product category 1 imported from China declined by a total of 13.7 percent. Selling prices ofthe U.S.-produced product category 2 decreased by *** percent, while prices of product category 2imported from China decreased by 34.9 percent. Prices of domestic product category 3 decreased by ***percent, while prices of product 3 imported from China decreased by 19.1 percent; prices of domesticproduct category 4 decreased by *** percent, while prices of product 4 imported from China decreased by28.8 percent; on average prices of domestic product category 5 increased by *** percent, while prices ofproduct 5 imported from China decreased on average by 21.9 percent; and prices of domestic productcategory 6 decreased by *** percent, while prices of product 6 imported from China decreased by6.9 percent. On the other hand, prices of domestic product category 7 increased by *** percent, whileprices of product 7 imported from China increased on average by 7.4 percent (January 2005-June 2007).
Total quarterly sales quantities reported by the U.S. producers and importers of SWG hangersfluctuated during January 2004-June 2007, with the quantities of the domestic products trendingdownward during this period while quantities of product of the products imported from China trendedupward. U.S. producers’ quarterly shipment quantities of product category 1 decreased by *** percentduring January 2004-June 2007, while shipment quantities of product category 1 imported from Chinaincreased by 42.7 percent during this period. During this period, U.S. producers’ quarterly shipmentquantities of product category 2 decreased by *** percent, while quarterly shipment quantities of theimported product category 2 increased by 42.7 percent. U.S. producers’ quarterly shipment quantities ofproduct category 3 decreased by *** percent, while quarterly shipment quantities of the imported productcategory 3 increased by 1,618 percent. U.S. producers’ quarterly shipment quantities of product category4 decreased by *** percent, while quarterly shipment quantities of the imported product category 4increased by 70.1. U.S. producers’ quarterly shipment quantities of product category 5 decreased by ***percent and quarterly shipment quantities of imported product category 5 also increased by 189.6 percent. U.S. producers’ quarterly shipment quantities of product category 6 decreased by *** percent, whilequarterly shipment quantities of the imported product category 6 increased by 1,307.7 percent. U.S.producers’ quarterly shipment quantities of product category 7 decreased by *** percent, while quarterlyshipment quantities of the imported product category 7 increased by 7.4 percent.
Price Comparisons
Prices of imported Chinese products 1-7 were lower than reported prices of U.S. products 1-7 inevery quarter for which price comparisons were available. Prices of imported Chinese product 1 werelower than prices of U.S. product 1 in 14 quarters by margins ranging from 15.0 percent to 32.0 percent.Prices of imported Chinese product 2 were lower than prices of U.S. product 2 in 14 quarters by marginsranging from 10.9 percent to 49.4 percent. Prices of imported Chinese product 3 were lower than pricesof U.S. product 3 in 14 quarters by margins ranging from 15.2 percent to 53.2 percent. Prices of importedChinese product 4 were lower than prices of U.S. product 4 in 14 quarters by margins ranging from 2.7percent to 44.5 percent. Prices of imported Chinese product 5 were lower than prices of U.S. product 5 in14 quarters by margins ranging from 16.4 percent to 47.0 percent. Prices of imported Chinese product 6were lower than prices of U.S. product 6 in 14 quarters by margins ranging from 18.7 percent to 29.1percent. Prices of imported Chinese product 7 were lower than prices of U.S. product 6 in 10 quarters bymargins ranging from 29.9 percent to 42.0 percent.
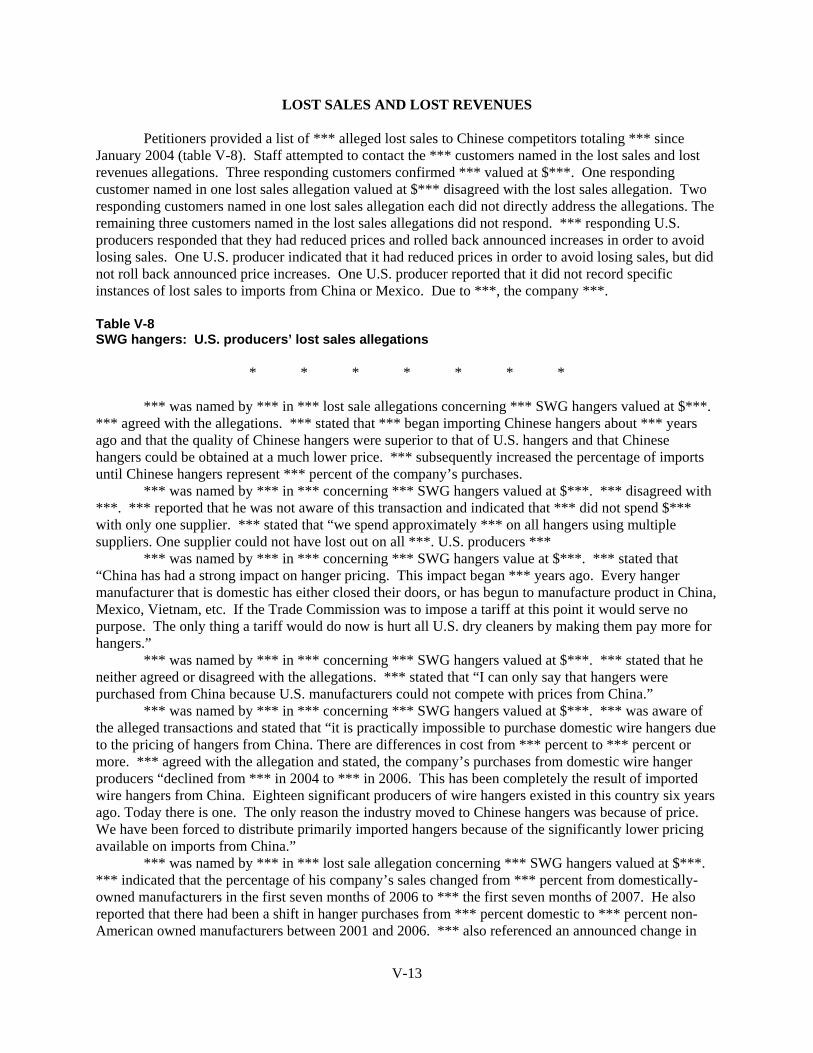
V-13
LOST SALES AND LOST REVENUES
Petitioners provided a list of *** alleged lost sales to Chinese competitors totaling *** sinceJanuary 2004 (table V-8). Staff attempted to contact the *** customers named in the lost sales and lostrevenues allegations. Three responding customers confirmed *** valued at $***. One respondingcustomer named in one lost sales allegation valued at $*** disagreed with the lost sales allegation. Tworesponding customers named in one lost sales allegation each did not directly address the allegations. Theremaining three customers named in the lost sales allegations did not respond. *** responding U.S.producers responded that they had reduced prices and rolled back announced increases in order to avoidlosing sales. One U.S. producer indicated that it had reduced prices in order to avoid losing sales, but didnot roll back announced price increases. One U.S. producer reported that it did not record specificinstances of lost sales to imports from China or Mexico. Due to ***, the company ***.
Table V-8SWG hangers: U.S. producers’ lost sales allegations
* * * * * * *
*** was named by *** in *** lost sale allegations concerning *** SWG hangers valued at $***. *** agreed with the allegations. *** stated that *** began importing Chinese hangers about *** yearsago and that the quality of Chinese hangers were superior to that of U.S. hangers and that Chinesehangers could be obtained at a much lower price. *** subsequently increased the percentage of importsuntil Chinese hangers represent *** percent of the company’s purchases.
*** was named by *** in *** concerning *** SWG hangers valued at $***. *** disagreed with***. *** reported that he was not aware of this transaction and indicated that *** did not spend $***with only one supplier. *** stated that “we spend approximately *** on all hangers using multiplesuppliers. One supplier could not have lost out on all ***. U.S. producers ***
*** was named by *** in *** concerning *** SWG hangers value at $***. *** stated that“China has had a strong impact on hanger pricing. This impact began *** years ago. Every hangermanufacturer that is domestic has either closed their doors, or has begun to manufacture product in China,Mexico, Vietnam, etc. If the Trade Commission was to impose a tariff at this point it would serve nopurpose. The only thing a tariff would do now is hurt all U.S. dry cleaners by making them pay more forhangers.”
*** was named by *** in *** concerning *** SWG hangers valued at $***. *** stated that heneither agreed or disagreed with the allegations. *** stated that “I can only say that hangers werepurchased from China because U.S. manufacturers could not compete with prices from China.”
*** was named by *** in *** concerning *** SWG hangers valued at $***. *** was aware ofthe alleged transactions and stated that “it is practically impossible to purchase domestic wire hangers dueto the pricing of hangers from China. There are differences in cost from *** percent to *** percent ormore. *** agreed with the allegation and stated, the company’s purchases from domestic wire hangerproducers “declined from *** in 2004 to *** in 2006. This has been completely the result of importedwire hangers from China. Eighteen significant producers of wire hangers existed in this country six yearsago. Today there is one. The only reason the industry moved to Chinese hangers was because of price. We have been forced to distribute primarily imported hangers because of the significantly lower pricingavailable on imports from China.”
*** was named by *** in *** lost sale allegation concerning *** SWG hangers valued at $***. *** indicated that the percentage of his company’s sales changed from *** percent from domestically-owned manufacturers in the first seven months of 2006 to *** the first seven months of 2007. He alsoreported that there had been a shift in hanger purchases from *** percent domestic to *** percent non-American owned manufacturers between 2001 and 2006. *** also referenced an announced change in

6 “China to adjust export rebate policy on 2,831 commodities,” Ministry of Commerce of the People’s Republicof China, June 20, 2007. “China to adjust export rebates policy on metal products from July 1,” ABC Money, June12, 2007.
V-14
China’s rebate policy for steel products such as SWG hangers. He stated that China announced plans tocut or eliminate export tax rebates for 2,831 commodities including steel and other metal products. Thecut, effective as of July 1, 2007, would cut the export tax rebate from 13 percent to 5 percent.6

1 M&B’s fiscal year *** while Metro and United Wire have a fiscal year that ends on ***. M&B reported on thebasis of GAAP (revenues are recognized when realized or realizable and when earned and costs are accrued to matchagainst relevant revenues); Metro reported on a cash basis (revenues are recorded when received and expenses arerecorded when paid); and United Wire reported on a tax basis (a hybrid method which is closer to the cash basis thanto GAAP). Differences between sales and shipments are attributable to timing differences and the inclusion ofLaidlaw’s data in shipments but not sales; as well, Metro ***. A questionnaire response was received from Laidlaw,but the financial data are not included in this section of the report because the firm was unable to provide data for itsU.S. operations only–it estimated that its total sales were composed of between *** during the period for which datawere collected. Staff telephone interview with *** on August 21, 2007. 2 For a list of other current and former U.S. producers, see Part III. As noted, these firms either closed or movedproduction outside of the United States. 3 Trends in Laidlaw’s shipment data *** in table VI-1, ***. Laidlaw’s questionnaire response, answer toquestion II-9. Laidlaw, like United Wire, ceased producing SWG hangers in the United States during the period forwhich data were collected.
VI-1
PART VI: FINANCIAL EXPERIENCE OF U.S. PRODUCERS
BACKGROUND
Three firms, M&B, Metro, and United Wire,1 provided usable financial information related totheir U.S. SWG hanger operations.2 Generally, each company draws carbon steel wire rod into wire, themajority of which is used for the production of SWG hangers. Production and sales of SWG hangersrepresent the majority of each company’s business, which also includes sales of steel wire and garmentcovers. Each of the companies is privately held.
OPERATIONS ON SWG HANGERS
Income-and-loss data for U.S. producers’ SWG hangers operations are presented in table VI-1,and are briefly summarized here. Both the quantity and value of total sales fell sharply between 2004 and2006 and were markedly lower in January-June 2007 compared to the same period in 2006. The absolutevalue of costs generally decreased with the decline in sales, although certain categories of fixed costsincreased through 2006 as a ratio of sales and on a per-unit basis (discussed later). The three firmstogether incurred *** in each period for which data were collected.
Table VI-1SWG hangers: Results of operations of U.S. producers, fiscal years 2004-06, January-June 2006,and January-June 2007
* * * * * * *
The absolute value of costs fell with the decline in production and sales. This decline reflectsboth the ***, plant closures by M&B and United Wire, and the complete market exit of United Wire.3 Many fixed costs are included with the categories of “other factory costs” and selling, general, andadministrative (“SG&A”) expenses. The ratio of other factory costs to sales and the average unit value ofother factory costs increased through 2006. The average unit value and the ratio to sales of other factorycosts declined between January-June 2006 and January-June 2007 because ***. The average unit valueand the ratio to sales of SG&A expenses increased during the period for which data were collected.
Table VI-2 presents data on total net sales, cost of goods sold (“COGS”), SG&A expenses, andoperating income on a firm-by-firm basis.

VI-2
Table VI-2SWG hangers: Results of operations of U.S. producers, by firms, fiscal years 2004-06, January-June 2006, and January-June 2007
* * * * * * *
Table VI-3 presents data on raw material costs by the three reporting U.S. producers.
Table VI-3SWG hangers: Raw material costs of U.S. producers, by firms, fiscal years 2004-06, January-June2006, and January-June 2007
* * * * * * *
A variance analysis for the three U.S. producers is presented in table VI-4. The information forthis variance analysis is derived from table VI-1. The variance analysis provides an assessment ofchanges in profitability as related to changes in pricing, cost, and volume. Between 2004 and 2006, therewas a favorable operating income variance of $*** because *** in 2006 was lower than *** in 2004. This was attributable to an unfavorable variance on price (lower unit prices) that was more than offset byfavorable variances on net cost/expense and volume (lower unit costs and lower volume). The decreasein the *** between January-June 2006 and the same period in 2007 of $*** was attributable to afavorable price variance and a favorable net volume variance that overcame an unfavorable netcost/expense variance. The very large favorable net volume variance component underscores the verylarge decline in sales quantities from period to period.
Table VI-4SWG hangers: Variance analysis on results of operations of domestic producers, fiscal years2004-06, January-June 2006, and January-June 2007
* * * * * * *
CAPITAL EXPENDITURES AND RESEARCH AND DEVELOPMENT EXPENSES
The responding firms’ data on capital expenditures and research and development (“R&D”)expenses related to the production of SWG hangers are shown in table VI-5. No firm reported R&Dexpenses during any one of the periods for which data were collected, although *** stated that theseexpenses are included in its capital expenditures.
Table VI-5SWG hangers: Capital expenditures and R&D expenses of U.S. producers, fiscal years 2004-06,January-June 2006, and January-June 2007
* * * * * * *
ASSETS AND RETURN ON INVESTMENT
The Commission’s questionnaire requested data on assets used in the production, warehousing,and sale of SWG hangers to compute return on investment (“ROI”) for 2004 to 2006. The data foroperating income are from table VI-1. Operating income was divided by total assets, resulting in ROI,shown in table VI-6.

4 United Wire discontinued domestic production ***.
VI-3
Table VI-6SWG hangers: Value of assets used in the production, warehousing, and sale, and return oninvestment, fiscal years 2004-06
* * * * * * *
CAPITAL AND INVESTMENT
The Commission requested U.S. producers to describe any actual or potential negative effects ofimports of SWG hangers from China on the firms’ growth, investment, and ability to raise capital ordevelopment and production efforts (including efforts to develop a derivative or more advanced versionof the product). Their responses with respect to actual negative effects are as follows:
Metro
***.
M&B
***.
United Wire
***.4
Company responses with respect to anticipated negative effects are as follows:
Metro
***.
M&B
***.
United Wire
***.


1 Section 771(7)(F)(ii) of the Act (19 U.S.C. § 1677(7)(F)(ii)) provides that “The Commission shall consider{these factors} . . . as a whole in making a determination of whether further dumped or subsidized imports areimminent and whether material injury by reason of imports would occur unless an order is issued or a suspensionagreement is accepted under this title. The presence or absence of any factor which the Commission is required toconsider . . . shall not necessarily give decisive guidance with respect to the determination. Such a determinationmay not be made on the basis of mere conjecture or supposition.”
VII-1
PART VII: THREAT CONSIDERATIONS
Section 771(7)(F)(I) of the Act (19 U.S.C. § 1677(7)(F)(I)) provides that–
In determining whether an industry in the United States is threatenedwith material injury by reason of imports (or sales for importation) ofthe subject merchandise, the Commission shall consider, among otherrelevant economic factors1--
(I) if a countervailable subsidy is involved, such information as may bepresented to it by the administering authority as to the nature of thesubsidy (particularly as to whether the countervailable subsidy is asubsidy described in Article 3 or 6.1 of the Subsidies Agreement), andwhether imports of the subject merchandise are likely to increase,
(II) any existing unused production capacity or imminent, substantialincrease in production capacity in the exporting country indicating thelikelihood of substantially increased imports of the subject merchandiseinto the United States, taking into account the availability of other exportmarkets to absorb any additional exports,
(III) a significant rate of increase of the volume or market penetration ofimports of the subject merchandise indicating the likelihood ofsubstantially increased imports,
(IV) whether imports of the subject merchandise are entering at pricesthat are likely to have a significant depressing or suppressing effect ondomestic prices, and are likely to increase demand for further imports,
(V) inventories of the subject merchandise,
(VI) the potential for product-shifting if production facilities in theforeign country, which can be used to produce the subject merchandise,are currently being used to produce other products,
(VII) in any investigation under this title which involves imports of botha raw agricultural product (within the meaning of paragraph (4)(E)(iv))and any product processed from such raw agricultural product, thelikelihood that there will be increased imports, by reason of productshifting, if there is an affirmative determination by the Commissionunder section 705(b)(1) or 735(b)(1) with respect to either the raw

2 Section 771(7)(F)(iii) of the Act (19 U.S.C. § 1677(7)(F)(iii)) further provides that, in antidumpinginvestigations, “. . . the Commission shall consider whether dumping in the markets of foreign countries (asevidenced by dumping findings or antidumping remedies in other WTO member markets against the same class orkind of merchandise manufactured or exported by the same party as under investigation) suggests a threat of materialinjury to the domestic industry.” 3 At the Commission’s conference, Mr. Zhong, President of Market Direct International, LLC, testified that “ . . .right now in China they have about 40 or 45 manufacturers in China.” Conference transcript, p. 120. 4 This is caused by the timing of the reported exports compared to the documented imports.
VII-2
agricultural product or the processed agricultural product (but notboth),
(VIII) the actual and potential negative effects on the existingdevelopment and production efforts of the domestic industry, includingefforts to develop a derivative or more advanced version of the domesticlike product, and
(IX) any other demonstrable adverse trends that indicate the probabilitythat there is likely to be material injury by reason of imports (or sale forimportation) of the subject merchandise (whether or not it is actuallybeing imported at the time).2
Information on the volume and pricing of imports of the subject merchandise is presented in PartsIV and V. Information on the effects of imports of the subject merchandise on U.S. producers’ existingdevelopment and production efforts is presented in Part VI. Information on inventories of the subjectmerchandise; foreign producers’ operations, including the potential for “product-shifting;” any otherthreat indicators, if applicable; and any dumping in third-country markets, follows.
THE INDUSTRY IN CHINA
The petition identified 64 alleged producers of SWG hangers in China.3 Table VII-1 listsinformation on 12 responding Chinese firms in 2006. Exports to the United States by these firmssurpassed the official U.S. import statistics for SWG hangers from China during 2006.4 With theexception of ***, responding Chinese producers reported that SWG hanger production was between 95and 100 percent of their total sales. All 12 reported that they did not produce or have the ability toproduce anything other than SWG hangers on their machinery and equipment.
Table VII-1SWG hangers: Chinese firms’ 2006 production, exports to the United States, and exports to theUnited States as a share of their production
* * * * * * *
Table VII-2 presents data for these 12 firms during 2004-06, January-June 2006, January-June2007, and forecasts for 2007 and 2008. *** were the largest reporting Chinese producers, togetheraccounting for almost 40 percent of Chinese SWG hanger imports. Over 90 percent of reported Chinese-produced SWG hangers were exported to the United States. Reported Chinese capacity and production ofSWG hangers increased by nearly 60 percent from 2004 to 2006, and capacity utilization increased by13.7 percentage points. Reported Chinese exports of SWG hangers to the United States rose by more
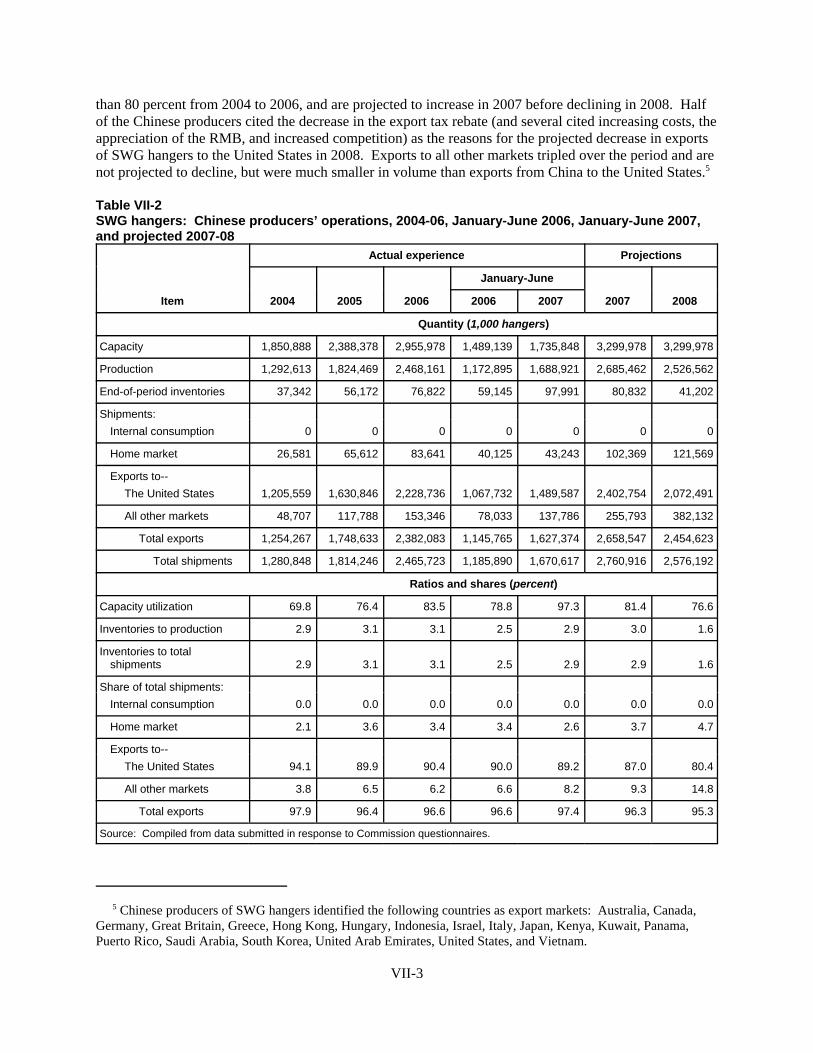
5 Chinese producers of SWG hangers identified the following countries as export markets: Australia, Canada,Germany, Great Britain, Greece, Hong Kong, Hungary, Indonesia, Israel, Italy, Japan, Kenya, Kuwait, Panama,Puerto Rico, Saudi Arabia, South Korea, United Arab Emirates, United States, and Vietnam.
VII-3
than 80 percent from 2004 to 2006, and are projected to increase in 2007 before declining in 2008. Halfof the Chinese producers cited the decrease in the export tax rebate (and several cited increasing costs, theappreciation of the RMB, and increased competition) as the reasons for the projected decrease in exportsof SWG hangers to the United States in 2008. Exports to all other markets tripled over the period and arenot projected to decline, but were much smaller in volume than exports from China to the United States.5
Table VII-2SWG hangers: Chinese producers’ operations, 2004-06, January-June 2006, January-June 2007,and projected 2007-08
Item
Actual experience Projections
2004 2005 2006
January-June
2007 20082006 2007
Quantity (1,000 hangers)
Capacity 1,850,888 2,388,378 2,955,978 1,489,139 1,735,848 3,299,978 3,299,978
Production 1,292,613 1,824,469 2,468,161 1,172,895 1,688,921 2,685,462 2,526,562
End-of-period inventories 37,342 56,172 76,822 59,145 97,991 80,832 41,202
Shipments:Internal consumption 0 0 0 0 0 0 0
Home market 26,581 65,612 83,641 40,125 43,243 102,369 121,569
Exports to--The United States 1,205,559 1,630,846 2,228,736 1,067,732 1,489,587 2,402,754 2,072,491
All other markets 48,707 117,788 153,346 78,033 137,786 255,793 382,132
Total exports 1,254,267 1,748,633 2,382,083 1,145,765 1,627,374 2,658,547 2,454,623
Total shipments 1,280,848 1,814,246 2,465,723 1,185,890 1,670,617 2,760,916 2,576,192
Ratios and shares (percent)
Capacity utilization 69.8 76.4 83.5 78.8 97.3 81.4 76.6
Inventories to production 2.9 3.1 3.1 2.5 2.9 3.0 1.6
Inventories to total shipments 2.9 3.1 3.1 2.5 2.9 2.9 1.6
Share of total shipments:Internal consumption 0.0 0.0 0.0 0.0 0.0 0.0 0.0
Home market 2.1 3.6 3.4 3.4 2.6 3.7 4.7
Exports to--The United States 94.1 89.9 90.4 90.0 89.2 87.0 80.4
All other markets 3.8 6.5 6.2 6.6 8.2 9.3 14.8
Total exports 97.9 96.4 96.6 96.6 97.4 96.3 95.3
Source: Compiled from data submitted in response to Commission questionnaires.
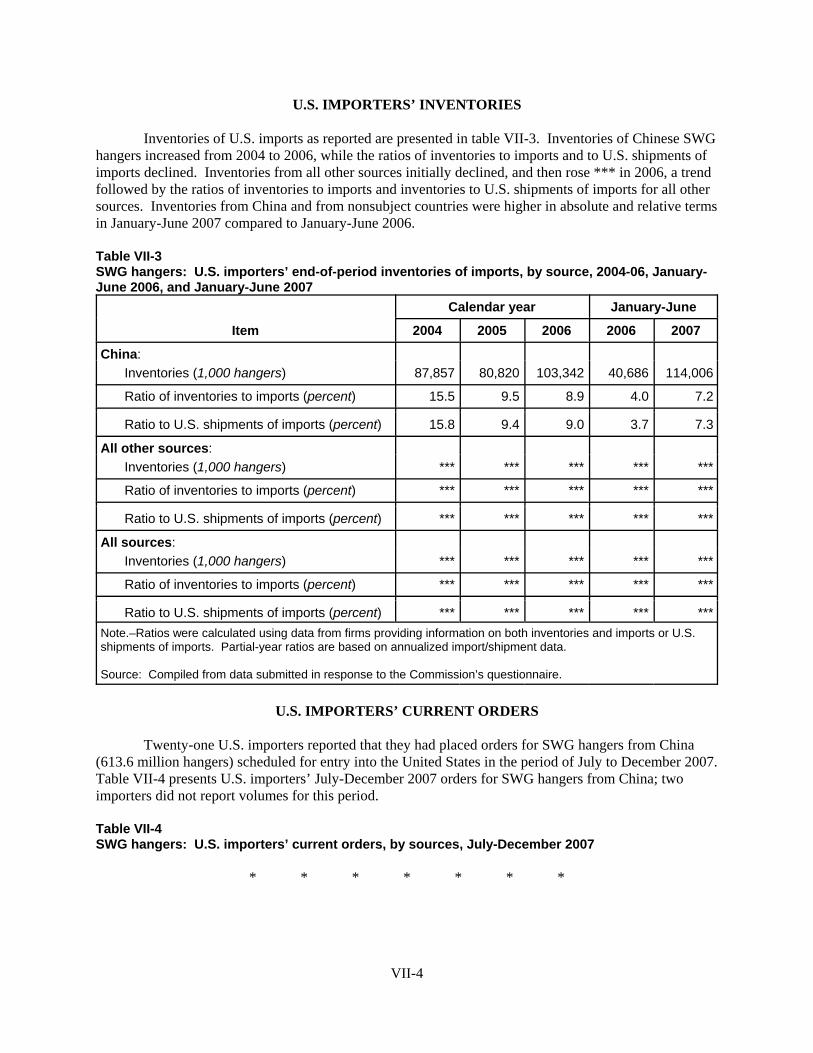
VII-4
U.S. IMPORTERS’ INVENTORIES
Inventories of U.S. imports as reported are presented in table VII-3. Inventories of Chinese SWGhangers increased from 2004 to 2006, while the ratios of inventories to imports and to U.S. shipments ofimports declined. Inventories from all other sources initially declined, and then rose *** in 2006, a trendfollowed by the ratios of inventories to imports and inventories to U.S. shipments of imports for all othersources. Inventories from China and from nonsubject countries were higher in absolute and relative termsin January-June 2007 compared to January-June 2006.
Table VII-3SWG hangers: U.S. importers’ end-of-period inventories of imports, by source, 2004-06, January-June 2006, and January-June 2007
Item
Calendar year January-June
2004 2005 2006 2006 2007
China:Inventories (1,000 hangers) 87,857 80,820 103,342 40,686 114,006
Ratio of inventories to imports (percent) 15.5 9.5 8.9 4.0 7.2
Ratio to U.S. shipments of imports (percent) 15.8 9.4 9.0 3.7 7.3
All other sources:Inventories (1,000 hangers) *** *** *** *** ***
Ratio of inventories to imports (percent) *** *** *** *** ***
Ratio to U.S. shipments of imports (percent) *** *** *** *** ***
All sources:Inventories (1,000 hangers) *** *** *** *** ***
Ratio of inventories to imports (percent) *** *** *** *** ***
Ratio to U.S. shipments of imports (percent) *** *** *** *** ***Note.–Ratios were calculated using data from firms providing information on both inventories and imports or U.S.shipments of imports. Partial-year ratios are based on annualized import/shipment data.
Source: Compiled from data submitted in response to the Commission’s questionnaire.
U.S. IMPORTERS’ CURRENT ORDERS
Twenty-one U.S. importers reported that they had placed orders for SWG hangers from China(613.6 million hangers) scheduled for entry into the United States in the period of July to December 2007. Table VII-4 presents U.S. importers’ July-December 2007 orders for SWG hangers from China; twoimporters did not report volumes for this period.
Table VII-4SWG hangers: U.S. importers’ current orders, by sources, July-December 2007
* * * * * * *

6 Silicon Metal from Russia, Inv. No. 731-TA-991 (Second Remand), USITC Publication 3910, June 2007, p. 2;citing Bratsk Aluminum Smelter v. United States, 444 F.3d at 1375. 7 Conference transcript, pp. 11-13. See also conference transcript, pp. 91-92 (Perry), pp. 82-87 (Neely), and 95,99 and 104 (Schultz). 8 Conference transcript, pp. 68-73 (Waite). 9 Laidlaw’s and United Wire’s postconference brief, pp. 6-14. 10 Light Industries Chamber’s postconference brief, pp. 10-14.
VII-5
ANTIDUMPING AND COUNTERVAILING DUTY ORDERS IN THIRD-COUNTRY MARKETS
No producer, importer, or foreign producer reported any countervailing or antidumping dutyorders on SWG hangers from China in third-country markets.
INFORMATION ON NONSUBJECT SOURCES
“Bratsk” Considerations
As a result of the Court of Appeals for the Federal Circuit (“CAFC”) decision in BratskAluminum Smelter v. United States (“Bratsk”), the Commission is directed to:6
undertake an “additional causation inquiry” whenever certain triggering factors aremet: “whenever the antidumping investigation is centered on a commodity product, andprice competitive non-subject imports are a significant factor in the market.” Theadditional inquiry required by the Court, which we refer to as the Bratskreplacement/benefit test, is “whether non-subject imports would have replaced thesubject imports without any beneficial effect on domestic producers.
Respondents identified this investigation as a “Bratsk case” in their opening remarks at theCommission’s conference and throughout subsequent testimony.7 Petitioners disagree.8 In their briefs,parties elaborated on their arguments as follows:
C Counsel on behalf of Laidlaw and United Wire argues that SWG hangers are a commodityproduct, that the imposition of antidumping duties would result in increased imports from Mexicoor other low-cost producing countries (e.g., Vietnam), and that U.S. production costs would resultin any benefits accruing to the petitioner’s non-U.S. operations rather than SWG hangeroperations in the United States, which are directed toward premium-priced specialty use andservice items.9
C Counsel for the Chinese producers argues that SWG hangers are an acknowledged commodityproduct; that the level of U.S. capacity is such that imports are required to meet demand in theU.S. market; that imports from Mexico are a “substantial” presence that holds down prices; andthat low barriers to entry into the U.S. market suggest that additional import sources (e.g.,Vietnam), and price pressure, can develop rapidly.10
C Counsel for the petitioner argues that nonsubject imports of SWG hangers, with the exception ofa “steady but small level” of imports from Mexico, have been “virtually nonexistent.” Counselcontends that there currently are few suppliers outside of China and that nonsubject imports are

11 Petitioner’s postconference brief, pp. 31-35. 12 Comparisons of the average unit value of the U.S. shipments of imports appear in table I-4. Price data forSWG hangers from Mexico, as well as those produced in the United States and China, appear in appendix D.
VII-6
higher-priced (based on a comparison of unitized Customs values) and unable to replace “even afraction” of the far larger volume of imports from China.11
Nonsubject Source Information
As discussed in Part IV of this report, the leading nonsubject countries are Mexico (accountingfor 14.3 percent of total U.S. imports of SWG hangers during 2006), Canada (0.4 percent), Korea(0.1 percent), and Taiwan (0.1 percent), with eight other countries accounting for the remainder of 2006imports (figure VII-1). Mexico was the only source of U.S. imports of SWG hangers that had a loweraverage unit value than those from China, with the difference lessening from 2004 to 2006, so that in2006 the average unit value for subject imports from Mexico was only $0.61 less than that for those fromChina. By 2007, the average unit value of U.S. imports from China had fallen below the average unitvalue of imports from Mexico.12 Figure VII-2 shows the average unit values of imports from China,Mexico, and all other sources during the period for which data were collected.
Figure VII-1SWG hangers: U.S. imports, by sources, 2004-06, January-June 2006, and January-June 2007
Source: Table IV-3.

13 ***. ***, however, reported that it does not produce or import any hangers from Mexico. According to thecompany’s CEO, “***.” Correspondence from ***, August 30, 2007. 14 When M&B shut down its Virginia plant in 2005, it shifted approximately one-third of its SWG hangerequipment to Mexico and two-thirds to Alabama. Conference transcript, pp. 62-63 (Magnus). See also M&B’spostconference brief, attachment 1 to exhibit 1.
VII-7
Figure VII-2SWG hangers: Average unit values of U.S. imports, by sources, 2004-06, January-June 2006, andJanuary-June 2007
Source: Table IV-3.
Table VII-5 presents data for M&B’s Mexican operations. Reported imports from thePetitioner’s Mexican operations accounted for *** percent of SWG hanger imports from Mexico, in2006, according to Commerce statistics.13 The Petitioner’s Mexican operation *** their capacity between2004 and 2005 by nearly *** percent14. *** exports to the United States accounted for their subsequentincrease in production. M&B exported hangers only to the United States, and its home market shipments

15 Conference transcript, p. 59 (Magnus). 16 Conference transcript, pp. 37-38 (Magrath).
VII-8
accounted for just under *** percent of its shipments. Production in Mexico accounted for *** percent ofM&B’s total production of SWG hangers in 2006.
Table VII-5SWG hangers: Petitioner’s Mexican operations, 2004-06, January-June 2006, January-June 2007,and projected 2007-08
* * * * * * *
Overall, it is believed that there are several small producers of hangers in Mexico as well as theM&B facility.15 According to witness testimony, “U.S. Hanger, also known as Nagel, shut down itsTexas hanger facility in 2004 and moved its production equipment to Mexico, according to the U.S.Department of Labor's Office of Trade Adjustment Assistance. The company produced hangers inMexico for only a few months before it shut down altogether.”16 M&B has identified the following firmsas producers of SWG hangers: Productos de Alambre S.A. (PASA); Clavos Nacionales S.A.; Diamante2000; Ganchos El Cedro S. A.; and Hangarme. According to M&B, there are also two known (there maybe others) Mexican importers of Chinese hangers into Mexico, Calormatic and Teran.

A-1
APPENDIX A
FEDERAL REGISTER NOTICES


45069 Federal Register / Vol. 72, No. 154 / Friday, August 10, 2007 / Notices
Section, International Boundary and Water Commission, San Diego Field Office, 2225 Dairy Mart Road, San Ysidro, CA 92173; and San Diego Central Library, 820 E. Street, San Diego, CA 92101. A copy of the Draft PEIS will also be posted at the USIBWC Web site at http://www.ibwc.state.gov. SUPPLEMENTARY INFORMATION: The Draft PEIS analyzes potential effects of the No Action Alternative and two action alternatives for future improvement of the Tijuana River FCP. Potential future improvements to the Tijuana River Flood Control Project were organized in two action alternatives, Enhanced Operation and Maintenance Alternative, focusing on engineering improvements; and Multipurpose Project Management Alternative, incorporating additional measures for multiple use of the floodway and environmental measures supporting initiatives by federal agencies, local governments, and other organizations; these initiatives would be conducted largely under cooperative agreements. The two action alternatives were evaluated in terms of their potential effects relative to those of the No Action Alternative, in the areas of water, biological, cultural and socioeconomic resources, land use, and environmental health issues.
A copy of the DEIS has been filed with EPA in accordance with 40 CFR parts 1500–1508 and USIBWC procedures. The public comment period of the Draft PEIS will end 45 days after publication of the NOA in the Federal Register by EPA.
Dated: August 1, 2007. Susan E. Daniel, General Counsel. [FR Doc. E7–15429 Filed 8–9–07; 8:45 am] BILLING CODE 7010–01–P
INTERNATIONAL TRADE COMMISSION
[Investigation No. 731–TA–1123 (Preliminary)]
Steel Wire Garment Hangers From China
AGENCY: United States International Trade Commission. ACTION: Institution of antidumping duty investigation and scheduling of a preliminary phase investigation.
SUMMARY: The Commission hereby gives notice of the institution of an investigation and commencement of preliminary phase antidumping duty investigation No. 731–TA–1123 (Preliminary) under section 733(a) of the Tariff Act of 1930 (19 U.S.C. 1673b(a))
(the Act) to determine whether there is a reasonable indication that an industry in the United States is materially injured or threatened with material injury, or the establishment of an industry in the United States is materially retarded, by reason of imports from China of steel wire garment hangers, provided for in subheading 7326.20.00 of the Harmonized Tariff Schedule of the United States, that are alleged to be sold in the United States at less than fair value. Unless the Department of Commerce extends the time for initiation pursuant to section 732(c)(1)(B) of the Act (19 U.S.C. 1673a(c)(1)(B)), the Commission must reach a preliminary determination in antidumping investigations in 45 days, or in this case by September 14, 2007. The Commission’s views are due at Commerce within five business days thereafter, or by September 21, 2007.
For further information concerning the conduct of this investigation and rules of general application, consult the Commission’s Rules of Practice and Procedure, part 201, subparts A through E (19 CFR part 201), and part 207, subparts A and B (19 CFR part 207). EFFECTIVE DATE: July 31, 2007. FOR FURTHER INFORMATION CONTACT: Fred Ruggles (202–205–3187/ [email protected]), Office of Investigations, U.S. International Trade Commission, 500 E Street, SW., Washington, DC 20436. Hearing- impaired persons can obtain information on this matter by contacting the Commission’s TDD terminal on 202– 205–1810. Persons with mobility impairments who will need special assistance in gaining access to the Commission should contact the Office of the Secretary at 202–205–2000. General information concerning the Commission may also be obtained by accessing its internet server (http:// www.usitc.gov). The public record for this investigation may be viewed on the Commission’s electronic docket (EDIS) at http://edis.usitc.gov. SUPPLEMENTARY INFORMATION:
Background. This investigation is being instituted in response to a petition filed on July 31, 2007, by M&B Metal Products Company, Inc. (‘‘M&B’’), Leeds, AL, on behalf of the domestic industry that produces steel wire garment hangers.
Participation in the investigation and public service list. Persons (other than petitioners) wishing to participate in the investigation as parties must file an entry of appearance with the Secretary to the Commission, as provided in sections 201.11 and 207.10 of the
Commission’s rules, not later than seven days after publication of this notice in the Federal Register. Industrial users and (if the merchandise under investigation is sold at the retail level) representative consumer organizations have the right to appear as parties in Commission antidumping investigations. The Secretary will prepare a public service list containing the names and addresses of all persons, or their representatives, who are parties to this investigation upon the expiration of the period for filing entries of appearance.
Limited disclosure of business proprietary information (BPI) under an administrative protective order (APO) and BPI service list. Pursuant to section 207.7(a) of the Commission’s rules, the Secretary will make BPI gathered in this investigation available to authorized applicants representing interested parties (as defined in 19 U.S.C.1677(9)) who are parties to the investigation under the APO issued in the investigation, provided that the application is made not later than seven days after the publication of this notice in the Federal Register. A separate service list will be maintained by the Secretary for those parties authorized to receive BPI under the APO.
Conference. The Commission’s Director of Operations has scheduled a conference in connection with this investigation for 9:30 a.m. on August 21, 2007, at the U.S. International Trade Commission Building, 500 E Street SW., Washington, DC. Parties wishing to participate in the conference should contact Fred Ruggles (202–205–3187/ [email protected]) not later than August 17, 2007, to arrange for their appearance. Parties in support of the imposition of antidumping duties in this investigation and parties in opposition to the imposition of such duties will each be collectively allocated one hour within which to make an oral presentation at the conference. A nonparty who has testimony that may aid the Commission’s deliberations may request permission to present a short statement at the conference.
Written submissions. As provided in sections 201.8 and 207.15 of the Commission’s rules, any person may submit to the Commission on or before August 24, 2007, a written brief containing information and arguments pertinent to the subject matter of the investigation. Parties may file written testimony in connection with their presentation at the conference no later than three days before the conference. If briefs or written testimony contain BPI, they must conform with the
VerDate Aug<31>2005 16:37 Aug 09, 2007 Jkt 211001 PO 00000 Frm 00064 Fmt 4703 Sfmt 4703 E:\FR\FM\10AUN1.SGM 10AUN1srob
erts
on
PR
OD
1PC
70 w
ith P
RO
PO
SA
LS

45070 Federal Register / Vol. 72, No. 154 / Friday, August 10, 2007 / Notices
requirements of sections 201.6, 207.3, and 207.7 of the Commission’s rules. The Commission’s rules do not authorize filing of submissions with the Secretary by facsimile or electronic means, except to the extent permitted by section 201.8 of the Commission’s rules, as amended, 67 Fed. Reg. 68036 (November 8, 2002). Even where electronic filing of a document is permitted, certain documents must also be filed in paper form, as specified in II (C) of the Commission’s Handbook on Electronic Filing Procedures, 67 Fed. Reg. 68168, 68173 (November 8, 2002).
In accordance with sections 201.16(c) and 207.3 of the rules, each document filed by a party to the investigation must be served on all other parties to the investigation (as identified by either the public or BPI service list), and a certificate of service must be timely filed. The Secretary will not accept a document for filing without a certificate of service.
Authority: This investigation is being conducted under authority of title VII of the Tariff Act of 1930; this notice is published pursuant to section 207.12 of the Commission’s rules.
Issued: July 31, 2007. By order of the Commission.
Marilyn R. Abbott, Secretary to the Commission. [FR Doc. E7–15660 Filed 8–9–07; 8:45 am] BILLING CODE 7020–02–P
DEPARTMENT OF LABOR
Office of the Secretary
Submission for OMB Review: Comment Request
August 3, 2007. The Department of Labor has
submitted the following public information collection request (ICR) to the Office of Management and Budget (OMB) for review and approval in accordance with the Paperwork Reduction Act of 1995 (Pub. L. 104–13, 44 U.S.C. chapter 35). Copies of the ICR announced herein with applicable supporting documentation; including inter alia a description of the likely respondents, proposed frequency of response, and estimated total burden may be obtained from the http:// RegInfo.gov Web site at http:// www.reginfo.gov/public/do/PRAMain or by contacting Darrin King on 202–693– 4129 (this is not a toll-free number)/e- mail: [email protected].
Comments should be sent to Office of Information and Regulatory Affairs, Attn: Katherine Astrich, OMB Desk
Officer for the Employment and Training Administration (ETA), Office of Management and Budget, 725 17th Street, NW., Room 10235, Washington, DC 20503, Telephone: 202–395–4816/ Fax: 202–395–6974 (these are not a toll- free numbers), E-mail: [email protected] within 30 days from the date of this publication in the Federal Register. Since this is a request for a new OMB control number, in order to ensure the appropriate consideration, comments should reference the title of the collection (see below).
The OMB is particularly interested in comments which:
• Evaluate whether the proposed collection of information is necessary for the proper performance of the functions of the agency, including whether the information will have practical utility;
• Evaluate the accuracy of the agency’s estimate of the burden of the proposed collection of information, including the validity of the methodology and assumptions used;
• Enhance the quality, utility, and clarity of the information to be collected; and
• Minimize the burden of the collection of information on those who are to respond, including through the use of appropriate automated, electronic, mechanical, or other technological collection techniques or other forms of information technology, e.g., permitting electronic submission of responses.
Agency: Employment and Training Administration.
Type of Review: New Collection (Request for a new OMB Control Number).
Title: YouthBuild Reporting System. OMB Number: 1205–0NEW. Number of Respondents: 85. Estimated Total Annual Burden
Hours: 16,280. Affected Public: Private Sector: Not-
for-profit institutions. Description: YouthBuild grantees will
collect and report selected standardized information pertaining to customers in YouthBuild programs for the purposes of general program oversight, evaluation, and performance assessment. ETA will provide all grantees with a YouthBuild management information system (MIS) to use for collecting participant data and for preparing and submitting the required quarterly reports.
Darrin A. King, Acting Departmental Clearance Officer. [FR Doc. E7–15566 Filed 8–9–07; 8:45 am] BILLING CODE 4510–FT–P
LEGAL SERVICES CORPORATION
Request for Comments—LSC Budget Request for FY 2009
AGENCY: Legal Services Corporation. ACTION: Request for Comments—LSC Budget Request for FY 2009.
SUMMARY: The Legal Services Corporation is beginning the process of developing its FY 2009 budget request to Congress and is soliciting suggestions as to what the request should be. DATES: Written comments must be received by August 31, 2007. ADDRESSES: Written comments may be submitted by mail, fax or e-mail to Charles Jeffress, Chief Administrative Officer, Legal Services Corporation, 3333 K St., NW., Washington, DC 20007; 202–295–1630 (phone); 202–337–6386 (fax); [email protected]. FOR FURTHER INFORMATION CONTACT: Charles Jeffress, Chief Administrative Officer, Legal Services Corporation, 3333 K St., NW., Washington, DC 20007; 202–295–1630 (phone); 202–337–6386 (fax); [email protected]. SUPPLEMENTARY INFORMATION: The Legal Services Corporation’s (LSC) mission is to promote equal access to justice in our Nation and to provide for high-quality civil legal assistance to low income persons. LSC submits an annual budget request directly to Congress and receives an annual direct appropriation to carry out its mission. For the current fiscal year (FY 2007), LSC received an appropriation of $348,578,000, of which $330,760,500 was for basic field programs, $2,970,000 was for the Office of Inspector General, $12,743,000 was for management and administration; and $2,104,500 was for technology initiative grants. Revised Continuing Appropriations Resolution, 2007, Public Law 110–5, 20918, 121 Stat. 8, 44 (2007). (The FY 2008 budget request has already been submitted to Congress and LSC is awaiting Congressional action.)
As part of its annual budget and appropriation process, LSC notifies the Office of Management and Budget (OMB) as to what the LSC budget request to Congress will be for the next fiscal year. OMB has requested this information by September 10 of this year. Accordingly, LSC is currently in the process of formulating its FY 2009 budget request.
LSC invites public comment on what its FY 2009 budget request should be. Interested parties may submit comments to LSC by September 1, 2007. More information about LSC can be found at LSC’s Web site: http://www.lsc.gov.
VerDate Aug<31>2005 16:37 Aug 09, 2007 Jkt 211001 PO 00000 Frm 00065 Fmt 4703 Sfmt 4703 E:\FR\FM\10AUN1.SGM 10AUN1srob
erts
on
PR
OD
1PC
70 w
ith P
RO
PO
SA
LS
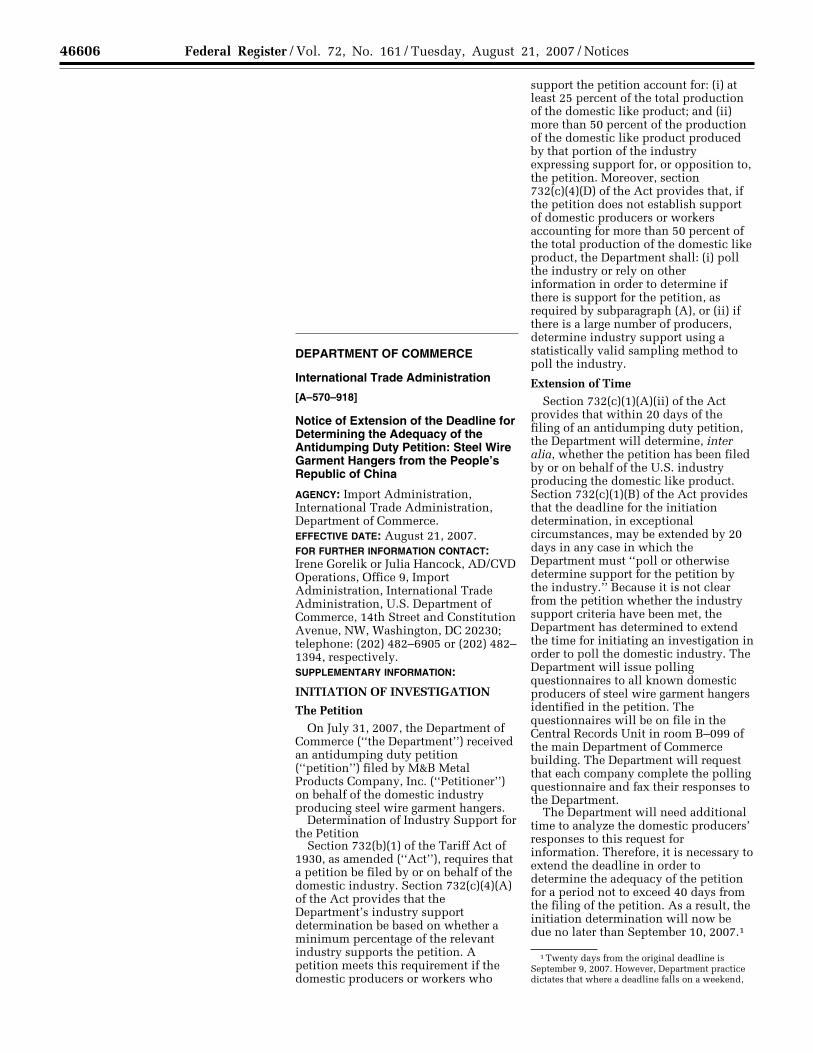
46606 Federal Register / Vol. 72, No. 161 / Tuesday, August 21, 2007 / Notices
1 Twenty days from the original deadline is September 9, 2007. However, Department practice dictates that where a deadline falls on a weekend,
Corp. Vinh Hoan explained that its, and subsequently, Vinh Hoan Corp.’s major U.S. customer remained the same. See Vinh Hoan’s CCR Request at 6 and Exhibit 5. Accordingly, we find that Vinh Hoan’s customer base has remained the same since becoming Vinh Hoan Corp.
In summary, Vinh Hoan reported that its conversion from Vinh Hoan to Vinh Hoan Corp. did not meaningfully affect the supplier relationships, customer base, management, marketing or sale of products and services. Moreover, there have been no material changes to Vinh Hoan’s operations or the way it produces and sells subject merchandise resulting in the conversion from Vinh Hoan to Vinh Hoan Corp.
Based on evidence provided by Vinh Hoan regarding its change from an LLC to a joint stock company, and absent any other record evidence that would contradict Vinh Hoan’s statements, we preliminarily determine, pursuant to section 351.221(c)(3)(ii) of the Department’s regulations, that Vinh Hoan Corp. is the succesor–in-interest to Vinh Hoan. If the above preliminary results are affirmed in the Department’s final results, the cash deposit rate most recently calculated for Vinh Hoan will apply to all entries of subject merchandise by Vinh Hoan Corp. entered, or withdrawn from warehouse, for consumption on or after the date of publication of the final results of this changed circumstances review. See, e.g., Granular Polytetrafluoroethylene Resin from Italy; Final Results of Changed Circumstances Review, 68 FR 25327 (May 12, 2003). This cash deposit rate, if imposed, shall remain in effect until further notice.
Public Comment
Any interested party may request a hearing within 30 days of publication of this notice in accordance with 19 CFR 351.310(c). Interested parties may submit case briefs no later than 30 days after the date of publication of this notice, in accordance with 19 CFR 351.309(c)(1)(ii). Rebuttal briefs, which must be limited to issues raised in the case briefs, may be filed no later than 5 days after the case briefs, in accordance with 19 CFR 351.309(d)(1). Any hearing, if requested, will normally be held two days after rebuttal briefs are due, in accordance with 19 CFR 351.310(d)(1).
The Department will issue its final results of review within 270 days after the date on which the changed circumstances review is initiated, or within 45 days if all parties to the proceeding agree to the outcome of the review, in accordance with 19 CFR
351.216(e), and will publish these results in the Federal Register.
The current requirement for a cash deposit of estimated antidumping duties on all subject merchandise will continue unless and until it is modified pursuant to the final results of this changed circumstances review.
This notice is published in accordance with sections 751(b)(1) and 777(i) of the Act and 19 CFR 351.216 of the Department’s regulations.
Dated: August 10, 2007. Joseph A. Spetrini, Deputy Assistant Secretary for Import Administration. [FR Doc. E7–16447 Filed 8–20–07; 8:45 am] BILLING CODE 3510–DS–S
DEPARTMENT OF COMMERCE
International Trade Administration
[A–570–918]
Notice of Extension of the Deadline for Determining the Adequacy of the Antidumping Duty Petition: Steel Wire Garment Hangers from the People’s Republic of China
AGENCY: Import Administration, International Trade Administration, Department of Commerce. EFFECTIVE DATE: August 21, 2007. FOR FURTHER INFORMATION CONTACT: Irene Gorelik or Julia Hancock, AD/CVD Operations, Office 9, Import Administration, International Trade Administration, U.S. Department of Commerce, 14th Street and Constitution Avenue, NW, Washington, DC 20230; telephone: (202) 482–6905 or (202) 482– 1394, respectively. SUPPLEMENTARY INFORMATION:
INITIATION OF INVESTIGATION
The Petition On July 31, 2007, the Department of
Commerce (‘‘the Department’’) received an antidumping duty petition (‘‘petition’’) filed by M&B Metal Products Company, Inc. (‘‘Petitioner’’) on behalf of the domestic industry producing steel wire garment hangers.
Determination of Industry Support for the Petition
Section 732(b)(1) of the Tariff Act of 1930, as amended (‘‘Act’’), requires that a petition be filed by or on behalf of the domestic industry. Section 732(c)(4)(A) of the Act provides that the Department’s industry support determination be based on whether a minimum percentage of the relevant industry supports the petition. A petition meets this requirement if the domestic producers or workers who
support the petition account for: (i) at least 25 percent of the total production of the domestic like product; and (ii) more than 50 percent of the production of the domestic like product produced by that portion of the industry expressing support for, or opposition to, the petition. Moreover, section 732(c)(4)(D) of the Act provides that, if the petition does not establish support of domestic producers or workers accounting for more than 50 percent of the total production of the domestic like product, the Department shall: (i) poll the industry or rely on other information in order to determine if there is support for the petition, as required by subparagraph (A), or (ii) if there is a large number of producers, determine industry support using a statistically valid sampling method to poll the industry.
Extension of Time Section 732(c)(1)(A)(ii) of the Act
provides that within 20 days of the filing of an antidumping duty petition, the Department will determine, inter alia, whether the petition has been filed by or on behalf of the U.S. industry producing the domestic like product. Section 732(c)(1)(B) of the Act provides that the deadline for the initiation determination, in exceptional circumstances, may be extended by 20 days in any case in which the Department must ‘‘poll or otherwise determine support for the petition by the industry.’’ Because it is not clear from the petition whether the industry support criteria have been met, the Department has determined to extend the time for initiating an investigation in order to poll the domestic industry. The Department will issue polling questionnaires to all known domestic producers of steel wire garment hangers identified in the petition. The questionnaires will be on file in the Central Records Unit in room B–099 of the main Department of Commerce building. The Department will request that each company complete the polling questionnaire and fax their responses to the Department.
The Department will need additional time to analyze the domestic producers’ responses to this request for information. Therefore, it is necessary to extend the deadline in order to determine the adequacy of the petition for a period not to exceed 40 days from the filing of the petition. As a result, the initiation determination will now be due no later than September 10, 2007.1
VerDate Aug<31>2005 15:08 Aug 20, 2007 Jkt 211001 PO 00000 Frm 00008 Fmt 4703 Sfmt 4703 E:\FR\FM\21AUN1.SGM 21AUN1rmaj
ette
on
PR
OD
1PC
64 w
ith N
OT
ICE
S

46607 Federal Register / Vol. 72, No. 161 / Tuesday, August 21, 2007 / Notices
the appropriate deadline is the next business day. See Notice of Clarification: Application of ‘‘Next Business Day’’ Rule for Administrative Determination Deadlines Pursuant to the Act, 70 FR 24533 (May 10, 2005).
International Trade Commission Notification
The Department will contact the International Trade Commission (‘‘ITC’’) and will make this extension notice available to the ITC.
Dated: August 15, 2007.
Gary Taverman, Acting Deputy Assistant Secretary for Import Administration. [FR Doc. E7–16448 Filed 8–20–07; 8:45 am]
BILLING CODE 3510–DS–S
DEPARTMENT OF COMMERCE
International Trade Administration
The President’s Export Council: Meeting of the President’s Export Council; Correction
AGENCY: International Trade Administration, U.S. Department of Commerce.
ACTION: Notice of a time change for an open meeting via teleconference.
SUMMARY: The President’s Export Council will hold a meeting via teleconference to deliberate a draft letter of recommendation to the President. This meeting was announced in a Federal Register document published on August 13, 2007 (72 FR 45224). This notice corrects the time of that meeting.
Date: August 23, 2007. Time: 1 p.m. (EDT); Correction. For the Conference Call-In Number
and Further Information, Contact: The President’s Export Council Executive Secretariat, Room 4043, Washington, DC 20230 (Phone: 202–482–1124), or visit the PEC Web site, http:// www.ita.doc.gov/td/pec.
Dated: August 16, 2007.
J. Marc Chittum, Executive Secretary and Staff Director, President’s Export Council. [FR Doc. 07–4111 Filed 8–17–07; 9:33 am]
BILLING CODE 3510–DR–P
DEPARTMENT OF COMMERCE
National Oceanic and Atmospheric Administration
RIN 0648–XC04
Fisheries of the Caribbean, Gulf of Mexico, and South Atlantic; Amendment 29 to the Fishery Management Plan for the Reef Fish Resources of the Gulf of Mexico
AGENCY: National Marine Fisheries Service (NMFS), National Oceanic and Atmospheric Administration (NOAA), Commerce. ACTION: Notice; intent to prepare a draft environmental impact statement (DEIS); scoping meetings; request for comments.
SUMMARY: NMFS, Southeast Region, in collaboration with the Gulf of Mexico Fishery Management Council (Council) intends to prepare a DEIS to describe and analyze management alternatives to be included in an amendment to the Fishery Management Plan for the Reef Fish Resources of the Gulf of Mexico. These alternatives will consider measures to rationalize effort and reduce overcapacity in the commercial grouper fishery to achieve and maintain optimum yield in the multi-species grouper fishery. The purpose of this notice of intent is to solicit public comments on the scope of issues to be addressed in the DEIS. DATES: Written comments on the scope of issues to be addressed in the DEIS must be received by NMFS by September 20, 2007. Nine scoping meetings will be held in September 2007. See SUPPLEMENTARY INFORMATION for specific dates and times. ADDRESSES: Written comments on the scope of the DEIS, suggested alternatives and potential impacts, and requests for additional information on the amendment should be sent to Sarah DeVido, National Marine Fisheries Service, Southeast Regional Office, 263 13th Avenue South, St. Petersburg, FL 33701–5511; telephone (727) 824–5305; fax (727) 824–5308. Comments may also be sent by email to [email protected].
Requests for information packets and for sign language interpretation or other auxiliary aids should be directed to the Gulf of Mexico Fishery Management Council, 2203 North Lois Avenue, Suite 1100, Tampa, FL 33607; telephone: 813– 348–1630; fax: 813–348–1711. Requests may also be sent by email to [email protected].
FOR FURTHER INFORMATION CONTACT: Sarah DeVido; phone: (727) 824–5305;
fax: (727) 824–5308; email: [email protected].
SUPPLEMENTARY INFORMATION: Current regulatory measures used in the management of the grouper complex include a license limitation system, quotas, trip limits, minimum size limits, area/gear restrictions, and season closures. Nonetheless, the commercial grouper fishery has become overcapitalized which means the collective harvest capacity of participants is in excess of that required to efficiently harvest the commercial share of the total allowable catch. The overcapitalization observed in the fishery has caused commercial grouper regulations to become increasingly restrictive over time, intensifying derby conditions under which fishermen race to harvest as many fish as possible before the quota is reached. The intensification of derby conditions has, in some years, led to premature closures of the fishery.
Incentives for overcapitalization and derby fishery conditions are expected to be maintained as long as the current management structure persists. Under this management structure, the commercial grouper fishery is expected to continue to be characterized by higher than necessary levels of capital investment, increased operating costs, increased likelihood of shortened seasons, reduced safety at-sea, wide fluctuations in grouper supply and depressed ex vessel prices. These conditions lead to deteriorating working conditions and profitability for participants.
Therefore, NMFS, in collaboration with the Council will develop a DEIS to describe and analyze management alternatives to rationalize effort and reduce overcapacity in the commercial grouper fishery in order to achieve and maintain optimum yield in this multi- species fishery. These alternatives include, but are not limited to: elimination of latent permits, a buyback or buyout program, permit endorsements, an individual fishing quota program, or an individual transferable effort quota program.
In accordance with NOAA’s Administrative Order 216–6, Section 5.02(c), Scoping Process, NMFS in collaboration with the Council has identified preliminary environmental issues as a means to initiate discussion for scoping purposes only. These preliminary issues may not represent the full range of issues that eventually will be evaluated in the EIS.
NMFS, in collaboration with the Council, has scheduled the following nine scoping meetings to provide the
VerDate Aug<31>2005 15:08 Aug 20, 2007 Jkt 211001 PO 00000 Frm 00009 Fmt 4703 Sfmt 4703 E:\FR\FM\21AUN1.SGM 21AUN1rmaj
ette
on
PR
OD
1PC
64 w
ith N
OT
ICE
S

52855 Federal Register / Vol. 72, No. 179 / Monday, September 17, 2007 / Notices
1 Twenty days from the original deadline is September 9, 2007. However, Department practice dictates that where a deadline falls on a weekend, the appropriate deadline is the next business day. See Notice of Clarification: Application of ‘‘Next
Business Day’’ Rule for Administrative Determination Deadlines Pursuant to the Act, 70 FR 24533 (May 10, 2005).
Separate Rates and Combination Rates Bulletin, at 6, explains that, while continuing the practice of assigning separate rates only to exporters, all separate rates that the Department will now assign in its NME investigations will be specific to those producers that supplied the exporter during the POI. Note, however, that one rate is calculated for the exporter and all of the producers which supplied subject merchandise to it during the POI. This practice applies both to mandatory respondents receiving an individually calculated separate rate as well as the pool of non–investigated firms receiving the weighted–average of the individually calculated rates. This practice is referred to as the application of ‘‘combination rates’’ because such rates apply to specific combinations of exporters and one or more producers. The cash–deposit rate assigned to an exporter will apply only to merchandise both exported by the firm in question and produced by a firm that supplied the exporter during the POI.
Distribution of Copies of the Petitions
In accordance with section 732(b)(3)(A) of the Act, a copy of the public version of the Petitions has been provided to representatives of the governments of Australia and the PRC. We will attempt to provide a copy of the public version of the Petitions to all exporters named in the Petitions, as provided for in 19 CFR 351.203(c)(2).
ITC Notification
We have notified the ITC of our initiation, as required by section 732(d) of the Act.
Preliminary Determinations by the ITC
The ITC will preliminarily determine no later than October 9, 2007, whether there is a reasonable indication that imports of EMD from Australia and the PRC are materially injuring or threatening material injury to a U.S. industry. A negative ITC determination for any country will result in the investigation being terminated with respect to that country; otherwise, these investigations will proceed according to statutory and regulatory time limits.
This notice is issued and published pursuant to section 777(i) of the Act.
Dated: September 11, 2007.
Joseph A. Spetrini, Deputy Assistant Secretary for Import Administration. [FR Doc. E7–18257 Filed 9–14–07; 8:45 am]
BILLING CODE 3510–DS–S
DEPARTMENT OF COMMERCE
International Trade Administration
[A–570–918]
Steel Wire Garment Hangers from the People’s Republic of China: Initiation of Antidumping Duty Investigation
AGENCY: Import Administration, International Trade Administration, Department of Commerce. EFFECTIVE DATE: September 17, 2007. FOR FURTHER INFORMATION CONTACT: Julia Hancock or Irene Gorelik, AD/CVD Operations, Office 9, Import Administration, International Trade Administration, U.S. Department of Commerce, 14th Street and Constitution Avenue, NW, Washington, DC 20230; telephone: (202) 482–1394 or (202) 482– 6905, respectively. SUPPLEMENTARY INFORMATION:
The Petition
On July 31, 2007, the Department of Commerce (‘‘Department’’) received a petition concerning imports of steel wire garment hangers from the People’s Republic of China (‘‘PRC’’) (‘‘Petition’’) filed in proper form by M&B Metal Products Company, Inc. (‘‘Petitioner’’). In accordance with section 732(b) of the Tariff Act of 1930, as amended (‘‘Act’’), Petitioner alleges that imports of steel wire garment hangers from the PRC are being, or are likely to be, sold in the United States at less than fair value, within the meaning of section 731 of the Act, and that such imports are materially injuring, or threatening material injury to, an industry in the United States.
On August 3, 2007, the Department issued a request for additional information and clarification of certain areas of the Petition. Based on the Department’s request, Petitioner filed its response on August 8, 2007. On August 16, 2007, the Department issued polling questionnaires to the domestic industry. In addition, the Department extended the initiation deadline because, pursuant to section 732(c)(1)(B) of the Act, the Department determined that it needed to poll the domestic industry to determine support for the Petition. See Steel Wire Garment Hangers from the People’s Republic of China: Extension of the Deadline for Determining the Adequacy of the Antidumping Duty Petition, 72 FR 46606 (August 21, 2007) (‘‘Extension of Initiation Deadline’’).1
On August 17, 2007, the Department issued a second request for additional information and clarification of certain areas of the Petition, to which Petitioner responded on August 27, 2007.
The Department finds that Petitioner filed this Petition on behalf of the domestic industry because Petitioner is an interested party as defined in section 771(9)(C) and (D) of the Act, and has demonstrated sufficient industry support with respect to the antidumping duty investigation that Petitioner is requesting that the Department initiate (see ‘‘Determination of Industry Support for the Petition’’ section below). The period of investigation (‘‘POI’’) is January 1, 2007, through June 30, 2007. See 19 CFR 351.204(b).
Scope of Investigation
The merchandise that is subject to this investigation is steel wire garment hangers, fabricated from carbon steel wire, whether or not galvanized or painted, whether or not coated with latex or epoxy or similar gripping materials, and/or whether or not fashioned with paper covers or capes (with or without printing) and/or nonslip features such as saddles or tubes. These products may also be referred to by a commercial designation, such as shirt, suit, strut, caped, or latex (industrial) hangers. Specifically excluded from the scope of this investigation are wooden, plastic, and other garment hangers that are classified under separate subheadings of the Harmonized Tariff Schedule of the United States (‘‘HTSUS’’). The products subject to this investigation are currently classified under HTSUS subheading 7326.20.0020. Although the HTSUS subheading is provided for convenience and customs purposes, the written description of the merchandise is dispositive.
Comments on the Scope of Investigation
During our review of the Petition, we discussed the scope with Petitioner to ensure that it is an accurate reflection of the products for which the domestic industry is seeking relief. Moreover, as discussed in the preamble to the regulations, we are setting aside a period for interested parties to raise issues regarding product coverage. See Antidumping Duties; Countervailing Duties; Final Rule, 62 FR 27296, 27323 (May 19, 1997). The Department encourages all interested parties to submit such comments within 20 calendar days of signature of this notice.
VerDate Aug<31>2005 17:00 Sep 14, 2007 Jkt 211001 PO 00000 Frm 00009 Fmt 4703 Sfmt 4703 E:\FR\FM\17SEN1.SGM 17SEN1jlent
ini o
n P
RO
D1P
C65
with
NO
TIC
ES

52856 Federal Register / Vol. 72, No. 179 / Monday, September 17, 2007 / Notices
Comments should be addressed to Import Administration’s Central Records Unit (‘‘CRU’’), Room 1870, U.S. Department of Commerce, 14th Street and Constitution Avenue, NW, Washington, DC 20230 - Attention: Julia Hancock and Irene Gorelik, Room 2814B. The period of scope consultations is intended to provide the Department with ample opportunity to consider all comments and to consult with parties prior to the issuance of the preliminary determination.
Comments on Product Characteristics for Antidumping Duty Questionnaire
We are requesting comments from interested parties regarding the appropriate physical characteristics of steel wire garment hangers to be reported in response to the Department’s antidumping questionnaire. For example, we are considering whether physical characteristics such as steel grade, types of steel wire and/or steel wire rod, steel wire gauge, hanger length, whether or not painted, type of latex, fashioned with a strut or saddle, fashioned with paper covers or capes, and the bottom bar length are relevant. This information will be used to identify the key physical characteristics of the subject merchandise in order for respondents to report more accurately the relevant factors of production, in accordance with the Department’s non–market economy (‘‘NME’’) methodology, as described in the ‘‘Normal Value’’ section below.
Interested parties may provide any information or comments that they believe are relevant to the development of an accurate listing of physical characteristics. Specifically, they may provide comments as to which characteristics are appropriate to use as the product reporting criteria. We note that it is not always appropriate to use all product characteristics as product reporting criteria.
In order to consider the suggestions of interested parties in developing and issuing the antidumping duty questionnaire, we must receive non– proprietary comments at the above– referenced address by October 1, 2007, and rebuttal comments must be timely filed by October 11, 2007.
Determination of Industry Support for the Petition
Section 732(b)(1) of the Act requires that a petition be filed on behalf of the domestic industry. Section 732(c)(4)(A) of the Act provides that a petition meets this requirement if the domestic producers or workers who support the petition account for: (i) at least 25
percent of the total production of the domestic like product; and (ii) more than 50 percent of the production of the domestic like product produced by that portion of the industry expressing support for, or opposition to, the petition. Moreover, section 732(c)(4)(D) of the Act provides that, if the petition does not establish support of domestic producers or workers accounting for more than 50 percent of the total production of the domestic like product, the Department shall: (i) poll the industry or rely on other information in order to determine if there is support for the petition, as required by subparagraph (A), or (ii) determine industry support using a statistically valid sampling method.
Section 771(4)(A) of the Act defines the ‘‘industry’’ as the producers as a whole of a domestic like product. Thus, to determine whether a petition has the requisite industry support, the statute directs the Department to look to producers and workers who produce the domestic like product. The International Trade Commission (‘‘ITC’’), which is responsible for determining whether ‘‘the domestic industry’’ has been injured, must also determine what constitutes a domestic like product in order to define the industry. While both the Department and the ITC must apply the same statutory definition regarding the domestic like product (section 771(10) of the Act), they do so for different purposes and pursuant to a separate and distinct authority. In addition, the Department’s determination is subject to limitations of time and information. Although this may result in different definitions of the like product, such differences do not render the decision of either agency contrary to law. See USEC, Inc. v. United States, 132 F. Supp. 2d 1, 8 (CIT 2001), citing Algoma Steel Corp. Ltd. v. United States, 688 F. Supp. 639, 644 (CIT 1988), aff’d 865 F.2d 240 (Fed. Cir. 1989), cert. denied 492 U.S. 919 (1989).
Section 771(10) of the Act defines the domestic like product as ‘‘a product which is like, or in the absence of like, most similar in characteristics and uses with, the article subject to an investigation under this subtitle.’’ Thus, the reference point from which the domestic like product analysis begins is ‘‘the article subject to an investigation,’’ (i.e., the class or kind of merchandise to be investigated, which normally will be the scope as defined in the petition).
With regard to the domestic like product, Petitioner does not offer a definition of domestic like product distinct from the scope of the investigation. Based on our analysis of the information submitted on the
record, we have determined that wire hangers constitute a single domestic like product and we have analyzed industry support in terms of that domestic like product. For a discussion of the domestic like product analysis in this case, see the Antidumping Duty Investigation Initiation Checklist: Steel Wire Garment Hangers from the People’s Republic of China (PRC), Industry Support at Attachment II (‘‘Initiation Checklist’’), on file in the CRU.
As stated above, on August 21, 2007, the Department published a notice extending the initiation deadline by 20 days to poll the domestic industry, in accordance with section 732(c)(4)D) of the Act, because it was ‘‘not clear from the Petition whether the industry support criteria have been met...’’ See Extension of Initiation Deadline, 72 FR at 46606. On August 16, 2007, we issued polling questionnaires to all known domestic producers of wire hangers identified in the Petition and by the Department’s research. The questionnaires are on file in the CRU. For a detailed discussion of the responses received, see Initiation Checklist at Attachment II.
Based on an analysis of the data collected from polling the domestic industry, we determine that the domestic producers or workers who support the Petition account for at least 25 percent of the total production of the domestic like product, and the requirements of section 732(c)(4)(A)(i) of the Act are met. Furthermore, given that Petitioner and supporters of the Petition represent more than 50 percent of the production of the domestic like product provided by that portion of the industry expressing support or opposition to the Petition, the requirements of section 732(c)(4)(A)(ii) of the Act are also met. Accordingly, we determine that this Petition is filed on behalf of the domestic industry within the meaning of section 732(b)(1) of the Act. See Initiation Checklist at Attachment II.
The Department finds that Petitioner filed the Petition on behalf of the domestic industry because it is an interested party as defined in sections 771(9)(C) and (D) of the Act and it has demonstrated sufficient industry support with respect to the antidumping duty investigation that it is requesting the Department initiate. See Initiation Checklist at Attachment II.
Allegations and Evidence of Material Injury and Causation
Petitioner alleges that the U.S. industry producing the domestic like product is being materially injured by reason of the imports of the subject
VerDate Aug<31>2005 17:00 Sep 14, 2007 Jkt 211001 PO 00000 Frm 00010 Fmt 4703 Sfmt 4703 E:\FR\FM\17SEN1.SGM 17SEN1jlent
ini o
n P
RO
D1P
C65
with
NO
TIC
ES

52857 Federal Register / Vol. 72, No. 179 / Monday, September 17, 2007 / Notices
merchandise sold at less than NV. Petitioner contends that the industry’s injured condition is illustrated by reduced market share, production, capacity and capacity utilization, shipments, by underselling and price depressing and suppressing effects, by lost revenue and sales, by reduced employment, by decline in financial performance, and by an increase in import penetration. We have assessed the allegations and supporting evidence regarding material injury, threat of material injury, and causation, and we have determined that these allegations are properly supported by adequate evidence and meet the statutory requirements for initiation. See Initiation Checklist at Attachment III.
Allegations of Sales at Less Than Fair Value
The following is a description of the allegations of sales at less than fair value upon which the Department based its decision to initiate this investigation of imports of steel wire garment hangers from the PRC. The sources of data for the deductions and adjustments relating to the U.S. price and the factors of production are also discussed in the Initiation Checklist. See Initiation Checklist. Should the need arise to use any of this information as facts available, pursuant to section 776 of the Act, in our preliminary or final determination, we will reexamine the information and revise the margin calculations, if appropriate.
Export Price Petitioner relied on 12 U.S. prices for
steel wire garment hangers manufactured in the PRC and offered for sale in the United States. The prices quoted were for four different types of steel wire garment hangers falling within the scope of the this Petition, for delivery to the U.S. customer within the POI. Petitioner deducted from the prices the costs associated with exporting and delivering the product, including ocean freight and insurance charges, and U.S. duty, port and wharfage fees. See Initiation Checklist. Petitioner provided declarations indicating the importer profit margin and based international freight on its knowledge and experience. See Petition at Exhibit 36, and Supplement to the Petition, dated August 8, 2007, at pages 16–17. Additionally, Petitioner deducted from the prices a U.S. credit adjustment using the average prime rate for the POI from the U.S. Federal Reserve, at http:// www.federalreserve.gov. See Initiation Checklist, at Attachment V; Supplement to the Petition, dated August 27, 2007, at Attachment 3.
Petitioner also calculated a margin based on the weighted average unit value (‘‘AUV’’) data for the POI of imports from the PRC under HTSUS subheading 7326.20.0020, which contains only subject merchandise. Since the AUV for HTS 7326.20.0020 is on an FOB basis, there were no deductions made from the AUV to obtain the U.S. price.
Normal Value Petitioner stated that the PRC remains
an NME country and no determination to the contrary has yet been made by the Department. Recently, the Department examined the PRC’s market status and determined that NME status should continue for the PRC. See Memorandum from the Office of Policy to David M. Spooner, Assistant Secretary for Import Administration, Regarding the People’s Republic of China Status as a Non– Market Economy, dated May 15, 2006. (This document is available online at http://ia.ita.doc.gov/download /prc– nme-status/prc–nme-status–memo.pdf.) In addition, in two recent investigations, the Department also determined that the PRC is an NME country. See Final Determination of Sales at Less Than Fair Value: Certain Activated Carbon from the People’s Republic of China, 72 FR 9508 (March 2, 2007); Final Determination of Sales at Less Than Fair Value and Partial Affirmative Determination of Critical Circumstances: Certain Polyester Staple Fiber from the People’s Republic of China, 72 FR 19690 (April 19, 2007). In accordance with section 771(18)(C)(i) of the Act, the presumption of NME status remains in effect until revoked by the Department. The presumption of NME status for the PRC has not been revoked by the Department and remains in effect for purposes of the initiation of this investigation. Accordingly, the NV of the product is appropriately based on factors of production valued in a surrogate market economy country in accordance with section 773(c) of the Act. In the course of this investigation, all parties will have the opportunity to provide relevant information related to the issues of the PRC’s NME status and the granting of separate rates to individual exporters.
Petitioner selected India as the surrogate country arguing that, pursuant to section 773(c)(4) of the Act, India is an appropriate surrogate because it is a market economy country that is at a level of economic development comparable to that of the PRC and there is publicly available information from India. See Petition at 39. Although India is not a significant producer of steel wire garment hangers, Petitioner argued
that India is a significant producer of comparable steel wire products. Id. at 40. Moreover, Petitioner argued that other potential surrogate countries, i.e., Egypt, Indonesia, the Philippines, and Sri Lanka, not only are not significant producers of steel wire garment hangers, but also are not significant producers of comparable steel wire products. Based on the information provided by Petitioner, we believe that the use of India as a surrogate country is appropriate for purposes of initiation. After the initiation of the investigation, we will solicit comments regarding surrogate country selection. Also, pursuant to 19 CFR 351.301(c)(3)(i), interested parties will be provided an opportunity to submit publicly available information to value factors of production within 40 days of the date of signature of the preliminary determination.
Petitioner provided dumping margin calculations using the Department’s NME methodology as required by 19 CFR 351.202(b)(7)(i)(C) and 19 CFR 351.408. Petitioner calculated NVs for each U.S. price discussed above based on the consumption rates for producing steel wire garment hangers from a U.S. producer, which it stated should be similar to the consumption of PRC producers. See Petition at 41. Petitioner used this U.S. producer’s consumption figures for October 2005 to September 2006. See Supplement to the Petition, dated August 8, 2007, at Exhibit I.
For the NV calculations, Petitioner was unable to obtain surrogate value figures contemporaneous with the POI for all material inputs, and accordingly relied upon the most recent information available. The source of this data is the World Trade Atlas compilation of Indian import statistics, which provided data through December 2006 at the time the Petition was filed. See Petition at Exhibit 29. To value certain factors of production, Petitioner used official Indian government import statistics, excluding those values from countries previously determined by the Department to be NME countries and excluding imports into India from Indonesia, the Republic of Korea, and Thailand, because the Department has previously excluded prices from these countries because they maintain broadly available, non–industry specific export subsidies. See Final Results of Administrative Review and Final Results of New Shipper Review: Hand Trucks and Certain Parts Thereof from the People’s Republic of China, 72 FR 27287 (May 15, 2007), and accompanying Issues and Decision Memorandum at Comment 23. Additionally, Petitioner also
VerDate Aug<31>2005 17:00 Sep 14, 2007 Jkt 211001 PO 00000 Frm 00011 Fmt 4703 Sfmt 4703 E:\FR\FM\17SEN1.SGM 17SEN1jlent
ini o
n P
RO
D1P
C65
with
NO
TIC
ES

52858 Federal Register / Vol. 72, No. 179 / Monday, September 17, 2007 / Notices
disregarded prices from North Korea, as the Department has in previous cases. See Final Results of Antidumping Duty Administrative Review: Chrome–Plated Lug Nuts from the People’s Republic of China, 61 FR 58514 (November 15, 1996); Preliminary Results of Antidumping Duty Administrative Review: Certain Frozen Fish Fillets from the Socialist Republic of Vietnam, 71 FR 53387, 53399 (September 11, 2006).
For inputs valued in Indian rupees and not contemporaneous with the POI, Petitioner used information from the wholesale price indices (‘‘WPI’’) in India as published in International Financial Statistics by the International Monetary Fund to inflate the input prices. See Petition at Exhibits 33 and 34; Supplement to the Petition, dated August 27, 2007, at Attachment 1. In addition, Petitioner made currency conversions, where necessary, based on the average rupee/U.S. dollar exchange rate for the POI, as reported on the Department’s Web site at http:// ia.ita.doc.gov/exchange/index.html.
Petitioner valued electricity in the production of steel wire garment hangers based on the Indian electricity rate as reported in the Key World Energy Statistics 2003, published by the International Energy Agency for the year 2000. See Petition at Exhibit 30 (Memorandum to the File, through Alex Villanueva, Program Manager, Office 9, Import Administration, from Matthew Renkey, Senior Analyst, RE: Antidumping Duty Administrative Review of Glycine from the People’s Republic of China: Surrogate Values for the Preliminary Results, dated April 2, 2007 (‘‘Glycine from the PRC’’)). Petitioner valued water using the value from Glycine from the PRC, which was calculated from the simple average rate of water for industrial use from various regions as reported by the Maharashtra Industrial Development Corporation at http://midcindia.org., dated June 1, 2003. Id. Petitioner valued natural gas using the 2005 rate for India published by the American Chemistry Council. See Petition at Exhibit 31. In each case, Petitioner adjusted these figures for inflation to the POI using WPI data. See Supplement to the Petition, dated August 27, 2007, at Attachments 1–2.
For the NV calculations, Petitioner calculated the surrogate financial ratios from the factory overhead, selling, general and administrative expenses, and profitability of an Indian manufacturer of steel fasteners, Lakshmi Precision Screws Ltd. (‘‘Lakshmi’’), which were used in the initiation of certain steel nails from the PRC. See Initiation of Antidumping Investigation: Certain Steel Nails from the People’s
Republic of China and the United Arab Emirates, 72 FR 38816 (July 16, 2007) (‘‘Initiation of Nails from the PRC’’); see also Petition at 42 and Exhibit 35. Petitioner claims that Lakshmi is an appropriate source for surrogate financial ratios because the company produces fabricated wire products that use the same input, steel wire, as steel wire garment hangers and the company’s data is publicly available. Petitioner states that Lakshmi produces its finished downstream wire products in a manner similar to steel wire garment hangers, i.e., specifically feeding the steel wire from coils into a machine where the wire is straightened, cut to the designated length, and formed into the finished product. See Supplement to the Petition, dated August 8, 2007, at 26. Petitioner stated that it was unable to find public financial statements from Indian steel wire garment hanger producers because India does not have a domestic garment hanger industry; therefore, Petitioner argues, Lakshmi provides the best information reasonably available as a surrogate for the production of steel wire garment hangers in the PRC. See Supplement to the Petition, dated August 8, 2007, at 19.
The Department finds that Petitioner’s use of Lakshmi as the source for the surrogate financial expenses is appropriate for purposes of initiation. Specifically, the Department finds that Lakshmi is the best publicly available source for the surrogate financial ratios because Lakshmi produces wire products using a main input and a production process similar to that of steel wire garment hangers. However, the Department made minor modifications to the surrogate financial ratios calculated by Petitioner. Additionally, the Department made a minor modification to the weighted average NV for the POI of imports from the PRC under HTSUS subheading 7326.20.0020. As a result, the calculations for the 12 NVs, the weighted–average NV, and the resulting margin calculations changed slightly. See Initiation Checklist at Attachment V.
Fair Value Comparisons Based on the data provided by
Petitioner, there is reason to believe that imports of steel wire garment hangers from the PRC are being, or are likely to be, sold in the United States at less than fair value. Based on comparisons of export price to NV, calculated in accordance with section 773(c) of the Act, the estimated dumping margins for steel wire garment hangers from the PRC range from 203.02 to 618 percent.
However, the Department may re– examine these carefully if it becomes necessary to consider the Petition margins for purposes of applying adverse facts available.
Initiation of Antidumping Investigation Based upon the examination of
Petition on steel wire garment hangers from the PRC, the Department finds that the Petition meets the requirements of section 732 of the Act. Therefore, we are initiating this antidumping duty investigation to determine whether imports of steel wire garment hangers from the PRC are being, or are likely to be, sold in the United States at less than fair value. In accordance with section 733(b)(1)(A) of the Act, unless postponed, we will make our preliminary determination no later than 140 days after the date of this initiation.
Separate Rates The Department recently modified the
process by which exporters and producers may obtain separate–rate status in NME investigations. See Policy Bulletin 05.1: Separate–Rates Practice and Application of Combination Rates in Antidumping Investigations involving Non–Market Economy Countries (April 5, 2005) (Separate Rates and Combination Rates Bulletin), available on the Department’s website at http://ia.ita.doc.gov/policy/bull05– 1.pdf. The process requires the submission of a separate–rate status application. Based on our experience in processing the separate–rate applications in the following antidumping duty investigations, we have modified the application for this investigation to make it more administrable and easier for applicants to complete. See Initiation of Antidumping Duty Investigation: Certain New Pneumatic Off–the-Road Tires from the People’s Republic of China, 72 FR 43591 (August 6, 2007) (‘‘Tires from the PRC’’); Initiation of Nails from the PRC, 72 FR 38816; Initiation of Antidumping Duty Investigation: Circular Welded Carbon Quality Steel Pipe from the People’s Republic of China, 72 FR 36663 (July 5, 2007); and Initiation of Antidumping Duty Investigations: Coated Free Sheet Paper from Indonesia, the People’s Republic of China, and the Republic of Korea, 71 FR 68537 (November 27, 2006). The specific requirements for submitting the separate–rate application in this investigation are outlined in detail in the application itself, which will be available on the Department’s website at http://ia.ita.doc.gov/ia– highlights-and–news.html on the date of publication of this initiation notice in
VerDate Aug<31>2005 18:22 Sep 14, 2007 Jkt 211001 PO 00000 Frm 00012 Fmt 4703 Sfmt 4703 E:\FR\FM\17SEN1.SGM 17SEN1jlent
ini o
n P
RO
D1P
C65
with
NO
TIC
ES
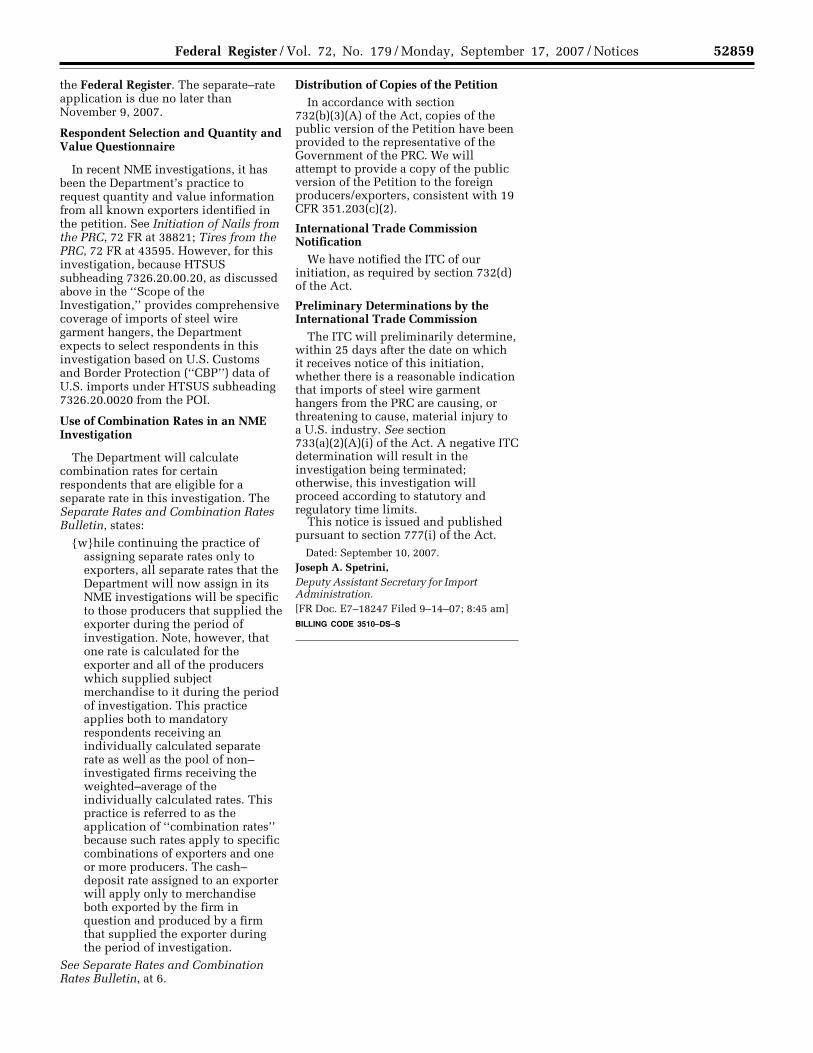
52859 Federal Register / Vol. 72, No. 179 / Monday, September 17, 2007 / Notices
the Federal Register. The separate–rate application is due no later than November 9, 2007.
Respondent Selection and Quantity and Value Questionnaire
In recent NME investigations, it has been the Department’s practice to request quantity and value information from all known exporters identified in the petition. See Initiation of Nails from the PRC, 72 FR at 38821; Tires from the PRC, 72 FR at 43595. However, for this investigation, because HTSUS subheading 7326.20.00.20, as discussed above in the ‘‘Scope of the Investigation,’’ provides comprehensive coverage of imports of steel wire garment hangers, the Department expects to select respondents in this investigation based on U.S. Customs and Border Protection (‘‘CBP’’) data of U.S. imports under HTSUS subheading 7326.20.0020 from the POI.
Use of Combination Rates in an NME Investigation
The Department will calculate combination rates for certain respondents that are eligible for a separate rate in this investigation. The Separate Rates and Combination Rates Bulletin, states:
{w}hile continuing the practice of assigning separate rates only to exporters, all separate rates that the Department will now assign in its NME investigations will be specific to those producers that supplied the exporter during the period of investigation. Note, however, that one rate is calculated for the exporter and all of the producers which supplied subject merchandise to it during the period of investigation. This practice applies both to mandatory respondents receiving an individually calculated separate rate as well as the pool of non– investigated firms receiving the weighted–average of the individually calculated rates. This practice is referred to as the application of ‘‘combination rates’’ because such rates apply to specific combinations of exporters and one or more producers. The cash– deposit rate assigned to an exporter will apply only to merchandise both exported by the firm in question and produced by a firm that supplied the exporter during the period of investigation.
See Separate Rates and Combination Rates Bulletin, at 6.
Distribution of Copies of the Petition In accordance with section
732(b)(3)(A) of the Act, copies of the public version of the Petition have been provided to the representative of the Government of the PRC. We will attempt to provide a copy of the public version of the Petition to the foreign producers/exporters, consistent with 19 CFR 351.203(c)(2).
International Trade Commission Notification
We have notified the ITC of our initiation, as required by section 732(d) of the Act.
Preliminary Determinations by the International Trade Commission
The ITC will preliminarily determine, within 25 days after the date on which it receives notice of this initiation, whether there is a reasonable indication that imports of steel wire garment hangers from the PRC are causing, or threatening to cause, material injury to a U.S. industry. See section 733(a)(2)(A)(i) of the Act. A negative ITC determination will result in the investigation being terminated; otherwise, this investigation will proceed according to statutory and regulatory time limits.
This notice is issued and published pursuant to section 777(i) of the Act.
Dated: September 10, 2007. Joseph A. Spetrini, Deputy Assistant Secretary for Import Administration. [FR Doc. E7–18247 Filed 9–14–07; 8:45 am] BILLING CODE 3510–DS–S
DEPARTMENT OF COMMERCE
International Trade Administration
[C–570–913]
Certain New Pneumatic Off–the-Road Tires from the People’s Republic of China: Postponement of Preliminary Determination in the Countervailing Duty Investigation
AGENCY: Import Administration, International Trade Administration, Department of Commerce. EFFECTIVE DATE: September 17, 2007. FOR FURTHER INFORMATION CONTACT: Mark Hoadley, Toni Page, or Jack Zhao, AD/CVD Operations, Office 6, Import Administration, International Trade Administration, U.S. Department of Commerce, 14th Street and Constitution Avenue, NW, Washington, DC 20230; telephone: (202) 482–3148, (202) 482– 1398 and (202) 482–1396, respectively. SUPPLEMENTARY INFORMATION:
Background On July 30, 2007, the Department of
Commerce (Department) initiated the countervailing duty investigation of certain new pneumatic off–the-road tires (OTR tires) from the People’s Republic of China. See Certain New Pneumatic Off–the-Road Tires From the People’s Republic of China: Initiation of Countervailing Duty Investigation, 72 FR 44122 (August 7, 2007). Currently, the preliminary determination is due no later than October 3, 2007.
Postponement of Due Date for Preliminary Determination
On August 23, 2007, Titan Tire Corporation and United Steel, Paper and Forestry, Rubber, Manufacturing, Energy Allied Industrial and Service Workers International Union, AFL–CIO-CLC (collectively, petitioners), submitted a letter requesting that the Department postpone the preliminary determination of the countervailing duty investigation of OTR tires from the People’s Republic of China by 65 days. Under section 703(c)(1)(A) of the Tariff Act of 1930, as amended (the Act), the Department may extend the period for reaching a preliminary determination in a countervailing duty investigation until not later than the 130th day after the date on which the administering authority initiates an investigation if the petitioner makes a timely request for an extension of the period within which the determination must be made under section 703(b) of the Act. Pursuant to section 351.205(e) of the Department’s regulations, the petitioners’ request for postponement of the preliminary determination was made 25 days or more before the scheduled date of the preliminary determination. Accordingly, we are extending the due date for the preliminary determination by 65 days to December 7, 2007.
This notice is issued and published pursuant to section 703(c)(2) of the Act.
Dated: September 11, 2007. Joseph A. Spetrini, Deputy Assistant Secretary for Import Administration. [FR Doc. E7–18256 Filed 9–14–07; 8:45 am] BILLING CODE 3510–DS–S
DEPARTMENT OF COMMERCE
National Institute of Standards and Technology
National Institute of Standards and Technology Performance Review Board Membership
The National Institute of Standards and Technology (NIST PRB) reviews
VerDate Aug<31>2005 17:00 Sep 14, 2007 Jkt 211001 PO 00000 Frm 00013 Fmt 4703 Sfmt 4703 E:\FR\FM\17SEN1.SGM 17SEN1jlent
ini o
n P
RO
D1P
C65
with
NO
TIC
ES


B-1
APPENDIX B
CONFERENCE WITNESSES


B-3
CALENDAR OF PUBLIC HEARING
Those listed below appeared as witnesses at the United States International Trade Commission’sconference:
Subject: Steel Wire Garment Hangers from China
Inv. No.: 731-TA-1123 (Preliminary)
Date and Time: August 21, 2007 - 9:30 a.m.
The conference was held in Room 101 (Main Hearing Room) of the United States InternationalTrade Commission Building, 500 E Street, SW, Washington, DC.
In Support of the Imposition of an Antidumping Duty Order:
Vorys, Sater, Seymour and Pease LLPWashington, DCon behalf of
M & B Metal Products Co., Inc.
Milton M. Magnus, III, President, M&B Metal Products Co., Inc.
Cathy J. Cronic, Controller and Secretary/Treasurer, M&B Metal Products Co., Inc.
Steven M. Pedelty, Sales Representative, M&B Metal Products Co., Inc.
Dr. Patrick J. Magrath, Economist, Georgetown Economic Services
Frederick P. Waite )–OF COUNSELKimberly R. Young )

B-4
In Opposition to the Imposition of an Antidumping Duty Order:
Greenberg Traurig LLPWashington, DCon behalf of
China Chamber of Commerce for I/E of Light Industrial Products & Arts -CraftsShaoxing Guochao Metallic Products Co., Ltd.Shaoxing Liangbao Metal Products Co., Ltd.Shaoxing Shun Ji Metal Clotheshores Co.Shaoxing Dingli Metal Clothes Horse Co., Ltd.Shaoxing Gangyuan Metal Manufacture Co.Shangyu Baoxiang Metal Manufacture Co.Shaoxing Tongzhou Metal Manufacture Co.Shaoxing Andrew Metal Manufacture Co.Shaoxing Zhangbao Metal Manufacture Co.Pujiang County Command Metal Products Co.Ningbo Dasheng Hanger Co.
Jeff S. Neeley )–OF COUNSELRobert D. Stang )
Garvey Schubert Barer Washington, DCon behalf of
Laidlaw Corp.United Wire Hanger Corp.Fabricare Choice Distributors Group
Tom Shultz, CEO, Laidlaw Corp.
Brent McWilliams, V.P. Sales, Laidlaw Corp.
Lawrence Goldman, President, United Wire Hanger Corp.
Joel Goldman, Executive VP and Secretary/Treasurer, United Wire Hanger
Eddy W. McLoud, National Accounts Manager, Fabricare Choice Distributors Group
William Perry )–OF COUNSELRonald Wisla )
Market Direct International, LLC
Weixiong Zhong, President, Market Direct International, LLC
C-1
APPENDIX C
SUMMARY DATA


Table C-1SWG hangers: Summary data concerning the U.S. market, 2004-06, January-June 2006, and January-June 2007
(Quantity=1,000 hangers, value=1,000 dollars, unit values, unit labor costs, and unit expenses are per 1,000 hangers; period changes=percent, except where noted)Reported data Period changes
January-June Jan.-JuneItem 2004 2005 2006 2006 2007 2004-06 2004-05 2005-06 2006-07
U.S. consumption quantity: Amount . . . . . . . . . . . . . . . . . . . . 3,245,181 2,877,932 2,820,887 1,462,191 *** -13.1 -11.3 -2.0 *** Producers' share (1) . . . . . . . . . . 66.6 52.7 25.9 31.2 *** -40.6 -13.8 -26.8 *** Importers' share (1): China . . . . . . . . . . . . . . . . . . . . 23.8 36.3 63.0 57.4 *** 39.2 12.5 26.7 *** Other sources . . . . . . . . . . . . . . 9.6 11.0 11.1 11.4 *** 1.5 1.4 0.1 *** Total imports . . . . . . . . . . . . . . 33.4 47.3 74.1 68.8 *** 40.6 13.8 26.8 ***
U.S. consumption value: Amount . . . . . . . . . . . . . . . . . . . . 136,259 118,690 96,791 51,240 *** -29.0 -12.9 -18.5 *** Producers' share (1) . . . . . . . . . . 69.2 56.5 30.5 36.7 *** -38.7 -12.7 -26.0 *** Importers' share (1): China . . . . . . . . . . . . . . . . . . . . 22.8 33.2 58.2 52.1 *** 35.4 10.5 25.0 *** Other sources . . . . . . . . . . . . . . 8.0 10.3 11.3 11.2 *** 3.3 2.3 1.0 *** Total imports . . . . . . . . . . . . . . 30.8 43.5 69.5 63.3 *** 38.7 12.7 26.0 ***
U.S. imports from: China: Quantity . . . . . . . . . . . . . . . . . . 773,684 1,044,701 1,777,680 838,943 1,321,194 129.8 35.0 70.2 57.5 Value . . . . . . . . . . . . . . . . . . . . 31,007 39,445 56,335 26,673 38,858 81.7 27.2 42.8 45.7 Unit value . . . . . . . . . . . . . . . . . $40.08 $37.76 $31.69 $31.79 $29.41 -20.9 -5.8 -16.1 -7.5 Ending inventory quantity . . . . . 87,857 80,820 103,342 40,686 114,006 17.6 -8.0 27.9 180.2 All other sources: Quantity . . . . . . . . . . . . . . . . . . 311,488 315,631 312,182 167,253 172,315 0.2 1.3 -1.1 3.0 Value . . . . . . . . . . . . . . . . . . . . 10,947 12,231 10,928 5,745 5,746 -0.2 11.7 -10.7 0.0 Unit value . . . . . . . . . . . . . . . . . $35.14 $38.75 $35.01 $34.35 $33.35 -0.4 10.3 -9.7 -2.9 Ending inventory quantity . . . . . *** *** *** *** *** *** *** *** *** All sources: Quantity . . . . . . . . . . . . . . . . . . 1,085,172 1,360,331 2,089,862 1,006,196 1,493,509 92.6 25.4 53.6 48.4 Value . . . . . . . . . . . . . . . . . . . . 41,954 51,677 67,263 32,419 44,604 60.3 23.2 30.2 37.6 Unit value . . . . . . . . . . . . . . . . . $38.66 $37.99 $32.19 $32.22 $29.87 -16.7 -1.7 -15.3 -7.3 Ending inventory quantity . . . . . *** *** *** *** *** *** *** *** ***
U.S. producers': Average capacity quantity . . . . . 2,610,278 2,069,378 1,511,678 891,539 *** -42.1 -20.7 -27.0 *** Production quantity . . . . . . . . . . 2,211,559 1,486,650 689,680 454,912 *** -68.8 -32.8 -53.6 *** Capacity utilization (1) . . . . . . . . 84.7 71.8 45.6 51.0 *** -39.1 -12.9 -26.2 *** U.S. shipments: Quantity . . . . . . . . . . . . . . . . . . 2,160,009 1,517,601 731,025 455,995 *** -66.2 -29.7 -51.8 *** Value . . . . . . . . . . . . . . . . . . . . 94,305 67,013 29,528 18,821 *** -68.7 -28.9 -55.9 *** Unit value . . . . . . . . . . . . . . . . . $43.66 $44.16 $40.39 $41.27 $*** -7.5 1.1 -8.5 *** Export shipments: Quantity . . . . . . . . . . . . . . . . . . *** *** *** *** *** *** *** *** *** Value . . . . . . . . . . . . . . . . . . . . *** *** *** *** *** *** *** *** *** Unit value . . . . . . . . . . . . . . . . . $*** $*** $*** $*** $*** *** *** *** *** Ending inventory quantity . . . . . . 110,846 71,861 26,810 67,779 *** -75.8 -35.2 -62.7 *** Inventories/total shipments (1) . . *** *** *** *** *** *** *** *** *** Production workers . . . . . . . . . . 564 446 229 236 *** -59.4 -20.9 -48.7 *** Hours worked (1,000s) . . . . . . . . 1,344 978 420 326 *** -68.8 -27.2 -57.1 *** Wages paid ($1,000s) . . . . . . . . 15,697 13,894 6,064 4,748 *** -61.4 -11.5 -56.4 *** Hourly wages . . . . . . . . . . . . . . . $11.68 $14.21 $14.44 $14.56 $*** 23.6 21.6 1.6 *** Productivity (hangers per hour) . 1,646 1,520 1,642 1,395 *** -0.2 -7.6 8.0 *** Unit labor costs . . . . . . . . . . . . . $7.10 $9.35 $8.79 $10.44 $*** 23.9 31.7 -5.9 *** Net sales: Quantity . . . . . . . . . . . . . . . . . . *** *** *** *** *** *** *** *** *** Value . . . . . . . . . . . . . . . . . . . . *** *** *** *** *** *** *** *** *** Unit value . . . . . . . . . . . . . . . . . $*** $*** $*** $*** $*** *** *** *** *** Cost of goods sold (COGS) . . . . *** *** *** *** *** *** *** *** *** Gross profit or (loss) . . . . . . . . . *** *** *** *** *** *** *** *** *** SG&A expenses . . . . . . . . . . . . . *** *** *** *** *** *** *** *** *** Operating income or (loss) . . . . . *** *** *** *** *** *** *** *** *** Capital expenditures . . . . . . . . . *** *** *** *** *** *** *** *** *** Unit COGS . . . . . . . . . . . . . . . . . $*** $*** $*** $*** $*** *** *** *** *** Unit SG&A expenses . . . . . . . . . $*** $*** $*** $*** $*** *** *** *** *** Unit operating income or (loss) . $*** $*** $*** $*** $*** *** *** *** *** COGS/sales (1) . . . . . . . . . . . . . *** *** *** *** *** *** *** *** *** Operating income or (loss)/ sales (1) . . . . . . . . . . . . . . . . . . *** *** *** *** *** *** *** *** ***
(1) "Reported data" are in percent and "period changes" are in percentage points.
Note.--Financial data are reported on a fiscal year basis and may not necessarily be comparable to data reported on a calendar year basis. Financial data do not include Laidlaw.Because of rounding figures may not add to the totals shown. Unit values and shares are calculated from the unrounded figures.
Source: Compiled from data submitted in response to Commission questionnaires and from official Commerce statistics.
C-3


D-1
APPENDIX D
SUPPLEMENTAL PRICE DATA

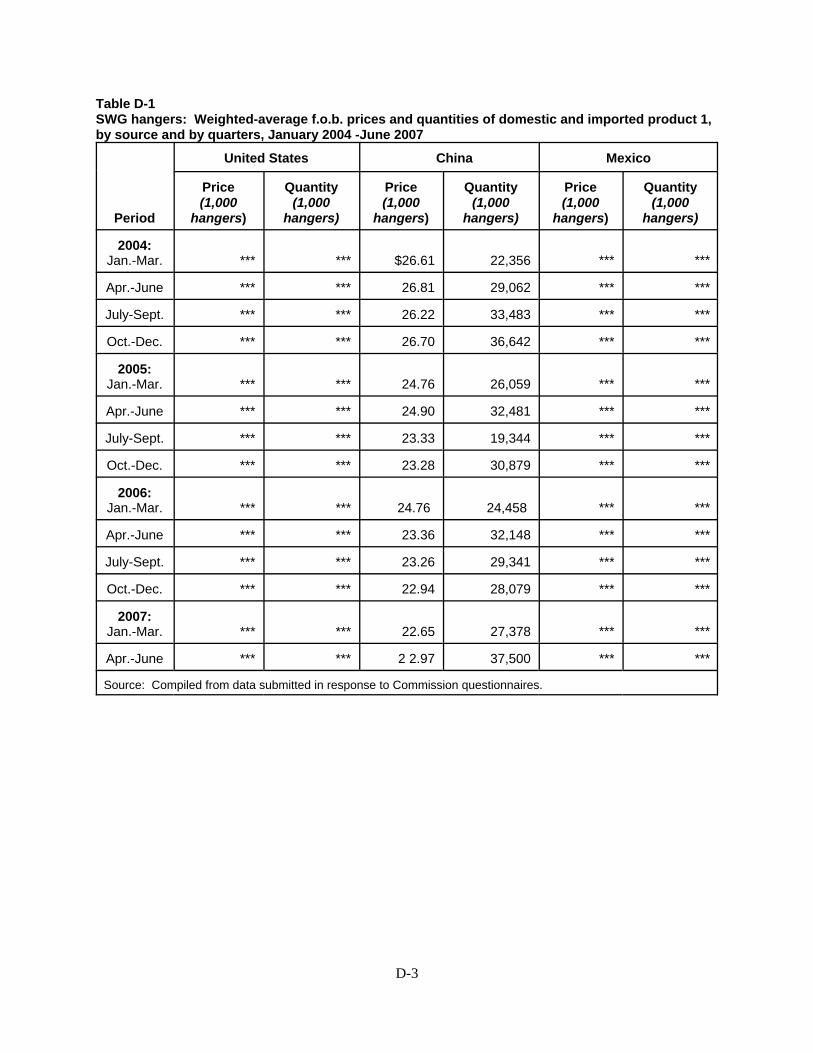
D-3
Table D-1SWG hangers: Weighted-average f.o.b. prices and quantities of domestic and imported product 1,by source and by quarters, January 2004 -June 2007
Period
United States China Mexico
Price(1,000
hangers)
Quantity(1,000
hangers)
Price(1,000
hangers)
Quantity(1,000
hangers)
Price(1,000
hangers)
Quantity(1,000
hangers)
2004:Jan.-Mar. *** ***
$26.61
22,356 *** ***
Apr.-June *** *** 26.81 29,062 *** ***
July-Sept. *** *** 26.22 33,483 *** ***
Oct.-Dec. *** *** 26.70 36,642 *** ***
2005:Jan.-Mar. *** *** 24.76 26,059 *** ***
Apr.-June *** *** 24.90 32,481 *** ***
July-Sept. *** *** 23.33 19,344 *** ***
Oct.-Dec. *** *** 23.28 30,879 *** ***
2006:Jan.-Mar. *** ***
24.76
24,458 *** ***
Apr.-June *** *** 23.36 32,148 *** ***
July-Sept. *** *** 23.26 29,341 *** ***
Oct.-Dec. *** *** 22.94 28,079 *** ***
2007:Jan.-Mar. *** ***
22.65 27,378 *** ***
Apr.-June *** *** 2 2.97 37,500 *** ***
Source: Compiled from data submitted in response to Commission questionnaires.

D-4
Table D-2SWG hangers: Weighted-average f.o.b. prices and quantities of domestic and imported product 2,by source and by quarters, January 2004 -June 2007
Period
United States China Mexico
Price(1,000
hangers)
Quantity(1,000
hangers)
Price(1,000
hangers)
Quantity(1,000
hangers)
Price(1,000
hangers
Quantity(1,000
hangers)
2004:Jan.-Mar. *** *** $43.13 2,608 *** ***
Apr.-June *** *** 43.16 3,441 *** ***
July-Sept. *** *** 40.13 5,628 *** ***
Oct.-Dec. *** *** 42.30 3,771 *** ***
2005:Jan.-Mar. *** *** 36.49 3,426 *** ***
Apr.-June *** *** 36.17 3,319 *** ***
July-Sept. *** *** 35.27 3,703 *** ***
Oct.-Dec. *** *** 27.95 4,163 *** ***
2006:Jan.-Mar. *** ***
32.36
2,283 *** ***
Apr.-June *** *** 29.00 3,203 *** ***
July-Sept. *** *** 30.33 3,267 *** ***
Oct.-Dec. *** *** 30.21 3,781 *** ***
2007:Jan.-Mar. *** *** 30.27
2,868 *** ***
Apr.-June *** *** 28.06 3,721 *** ***
Source: Compiled from data submitted in response to Commission questionnaires.

D-5
Table D-3SWG hangers: Weighted-average f.o.b. prices and quantities of domestic and imported product 3,by source and by quarters, January 2004 -June 2007
Period
United States China Mexico
Price(1,000
hangers)
Quantity(1,000
hangers)
Price(1,000
hangers)
Quantity(1,000
hangers)
Price(1,000
hangers
Quantity(1,000
hangers)
2004:Jan.-Mar. *** *** $43.0 143 *** ***
Apr.-June *** *** 30.91 93 *** ***
July-Sept. *** *** 28.68 577 *** ***
Oct.-Dec. *** *** 29.53 3,009 *** ***
2005:Jan.-Mar. *** *** 32.31 665 *** ***
Apr.-June *** *** 27.17 1,041 *** ***
July-Sept. *** *** 28.56 984 *** ***
Oct.-Dec. *** *** 29.76 1,055 *** ***
2006:Jan.-Mar. *** *** 29.62 1,500 *** ***
Apr.-June *** *** 27.17 1,365 *** ***
July-Sept. *** *** 28.10 1,681 *** ***
Oct.-Dec. *** *** 27.61 1,412 *** ***
2007:Jan.-Mar. *** *** 29.49 1,317 *** ***
Apr.-June *** *** 31.68 2,457 *** ***
Source: Compiled from data submitted in response to Commission questionnaires.

D-6
Table D-4SWG hangers: Weighted-average f.o.b. prices and quantities of domestic and imported product 4,by source and by quarters, January 2004 -June 2007
Period
United States China Mexico
Price(1,000
hangers)
Quantity(1,000
hangers)
Price(1,000
hangers)
Quantity(1,000
hangers)
Price(1,000
hangers
Quantity(1,000
hangers)
2004:Jan.-Mar. *** *** $39.54
1,524 *** ***
Apr.-June *** *** 44.24 3,229 *** ***
July-Sept. *** *** 39.39 4,681 *** ***
Oct.-Dec. *** *** 38.04 4,243 *** ***
2005:Jan.-Mar. *** *** 37.27 3,352 *** ***
Apr.-June *** *** 34.56 4,368 *** ***
July-Sept. *** *** 30.90 2,221 *** ***
Oct.-Dec. *** *** 28.24 1,688 *** ***
2006:Jan.-Mar. *** *** 27.52 2,520
*** ***
Apr.-June *** *** 27.08 2,345 *** ***
July-Sept. *** *** 28.05 2,768 *** ***
Oct.-Dec. *** *** 27.52 2,216 *** ***
2007:Jan.-Mar. *** *** 27.59
2,200 *** ***
Apr.-June *** *** 28.15 2,593 *** ***
Source: Compiled from data submitted in response to Commission questionnaires.

D-7
Table D-5SWG hangers: Weighted-average f.o.b. prices and quantities of domestic and imported product 5,by source and by quarters, January 2004 -June 2007
Period
United States China Mexico
Price(1,000
hangers)
Quantity(1,000
hangers)
Price(1,000
hangers)
Quantity(1,000
hangers)
Price(1,000
hangers
Quantity(1,000
hangers)
2004:Jan.-Mar. *** ***
$36.23
2,077 *** ***
Apr.-June *** *** 37.32 1,904 (1) (1)
July-Sept. *** *** 36.05 706 *** ***
Oct.-Dec. *** *** 34.01 902 *** ***
2005:Jan.-Mar. *** ***
32.30
3,501 *** ***
Apr.-June *** *** 30.95 7,286 *** ***
July-Sept. *** *** 30.38 3,966 *** ***
Oct.-Dec. *** *** 26.77 6,788 *** ***
2006:Jan.-Mar. *** ***
26.93
5,553 *** ***
Apr.-June *** *** 29.05 6,286 *** ***
July-Sept. *** *** 29.01 5,015 *** ***
Oct.-Dec. *** *** 28.99 5,110 *** ***
2007:Jan.-Mar. *** ***
27.96
3,950 *** ***
Apr.-June *** *** 28.31 6,015 *** ***1 Not available.
Source: Compiled from data submitted in response to Commission questionnaires.

D-8
Table D-6SWG hangers: Weighted-average f.o.b. prices and quantities of domestic and imported product 6,by source and by quarters, January 2004 -June 2007
Period
United States China Mexico
Price(1,000
hangers)
Quantity(1,000
hangers)
Price(1,000
hangers)
Quantity(1,000
hangers)
Price(1,000
hangers
Quantity(1,000
hangers)
2004:Jan.-Mar. *** *** $47.29
1,666 *** ***
Apr.-June *** *** 45.36 3,416 *** ***
July-Sept. *** *** 44.79 6,626 *** ***
Oct.-Dec. *** *** 41.97 4,615 *** ***
2005:Jan.-Mar. *** *** 45.35
2,565 *** ***
Apr.-June *** *** 46.36 5,285 *** ***
July-Sept. *** *** 43.52 6,847 *** ***
Oct.-Dec. *** *** 44.15 9,396 *** ***
2006:Jan.-Mar. *** *** 47.13
9,656 *** ***
Apr.-June *** *** 41.11 17,243 *** ***
July-Sept. *** *** 44.35 13,847 *** ***
Oct.-Dec. *** *** 44.00 16,403 *** ***
2007:Jan.-Mar. *** ***
44.18
18,789 ***
***
Apr.-June *** *** 44.03 22,452 *** ***
Source: Compiled from data submitted in response to Commission questionnaires.

D-9
Table D-7SWG hangers: Weighted-average f.o.b. prices and quantities of domestic and imported product 7,by source and by quarters, January 2004 -June 2007
Period
United States China Mexico
Price(1,000
hangers)
Quantity(1,000
hangers)
Price(1,000
hangers)
Quantity(1,000
hangers)
Price(1,000
hangers
Quantity(1,000
hangers)
2004:Jan.-Mar. *** *** - - *** ***
Apr.-June *** *** - - *** ***
July-Sept. *** *** - - *** ***
Oct.-Dec. *** *** - - *** ***
2005:Jan.-Mar. *** *** $25.79
266 *** ***
Apr.-June *** *** 25.80 953 *** ***
July-Sept. *** *** 23.54 2,089 *** ***
Oct.-Dec. *** *** 25.80 906 *** ***
2006:Jan.-Mar. *** *** 25.80
3,345 *** ***
Apr.-June *** *** 26.48 3,248 *** ***
July-Sept. *** *** 27.30 17,574 *** ***
Oct.-Dec. *** *** 27.35 18,543 *** ***
2007:Jan.-Mar. *** *** 26.60
26,218 ***
***
Apr.-June *** *** 27.95 38,568 *** ***
Source: Compiled from data submitted in response to Commission questionnaires.