
Optimization of Melt Treatment for Austenitic Steel Grain ...
description

TestSpecification
109-8909Jul07 Rev F
All Paragraphs Revised
Grain Size of Metallic Strip
©2007 Tyco Electronics CorporationHarrisburg, PAAll International Rights Reserved.
* Trademark| Indicates change
For latest revision, visit our website at www.tycoelectronics.com\documents.
For Regional Customer Service, visit our website at www.tycoelectronics.com
1 of 17LOC B
1. SCOPE
1.1. Content
This specification covers the test procedure for determining the grain size of metal strip.
1.2. Reference Documents
! 100-746: Material Specification (Phosphor Bronze Strip, UNS C51000, Special Grain Size)! ASTM E112: Standard Test Methods for Determining Average Grain Size! ISO 2624: Copper and Copper Alloys - Estimation of Average Grain Size, Second Edition
1.3. Descriptions
! 109-89-1: Estimating Grain Size visually shall be used as the primary method of determining grainsize for metallic strip.
! 109-89-2: Linear Intercept (Heyn), unless otherwise specified in the referencing document, thisprocedure shall be used as a referee method only.
! 109-89-3: Linear Intercept (Abrams), unless otherwise specified in the referencing document, thisprocedure shall be used as a referee method only.
2. TEST EQUIPMENT
Metallograph: Capable of magnification of 75 to 1600X
3. TEST SPECIMEN
Specimen to be examined shall have the surface polished and etched using any technique that willresult in clearly distinguishable grain boundaries. Surface to be examined is indicated in Figure 1.
Figure 1

109-89
Rev F 2 of 17
4. TEST PROCEDURE
The characterization and understanding of the properties of a material involve an unbiased and accurateassessment of the structure of the material. The importance of an accurate grain size determination andthe influence of grain size on the material properties are evidenced by the common use of theHall-Petch relationship between strength and grain size. Accordingly, it would be extremely valuable tohave a fast and accurate method of measuring the grain size of a material. To be of practical value,such a method should require a minimum number of observations, provide data having statisticalsignificance, and be applicable to a wide range of single-phase microstructures. These requirements aremet by the procedure described and demonstrated in this specification.
4.1. Visual Method, 109-89-1
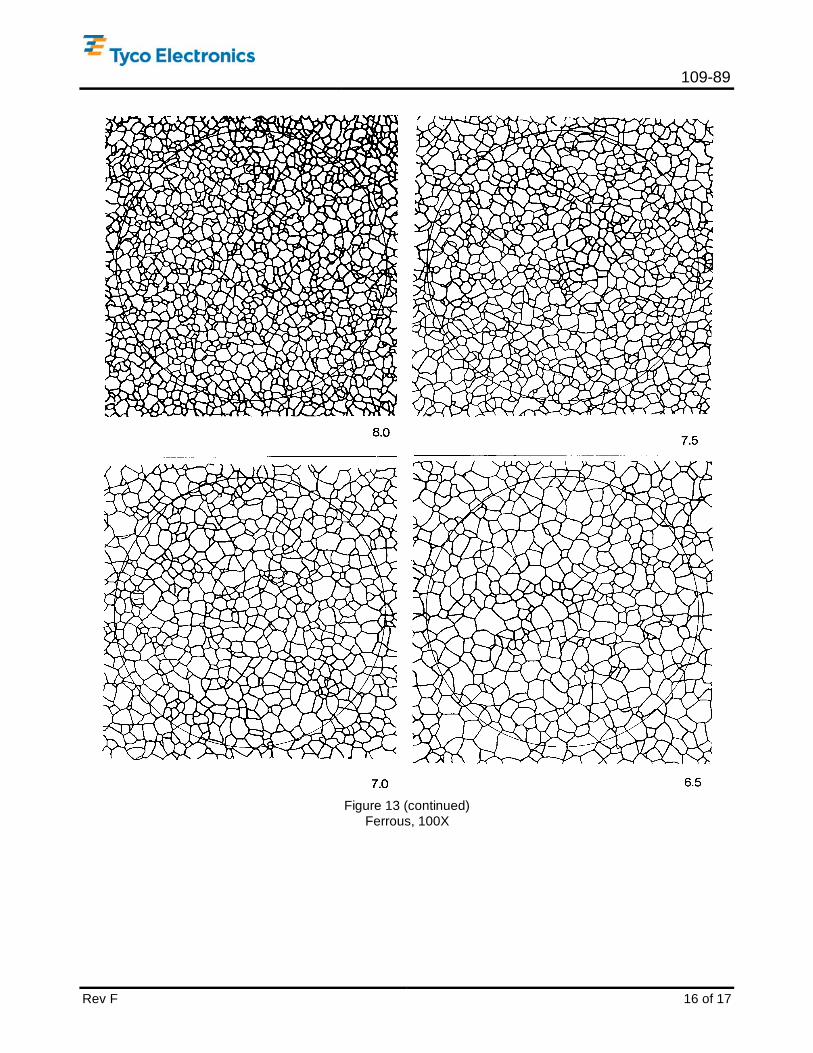
A. Prepared specimen shall be compared visually to Figure 12 for nonferrous materials and Figure 13for ferrous materials.
B. In the event of conflict, either method 109-89-2 or 109-89-3 shall be used as the referee method.
4.2. Heyn's Intercept Method, 109-89-2
A. Prepared specimen surface shall be examined under magnification using a metallograph. Select amagnification that will result in an intercept count within the range shown in Figure 3.
B. Viewed area shall either be photographed or displayed on a viewing screen at the selectedmagnification.
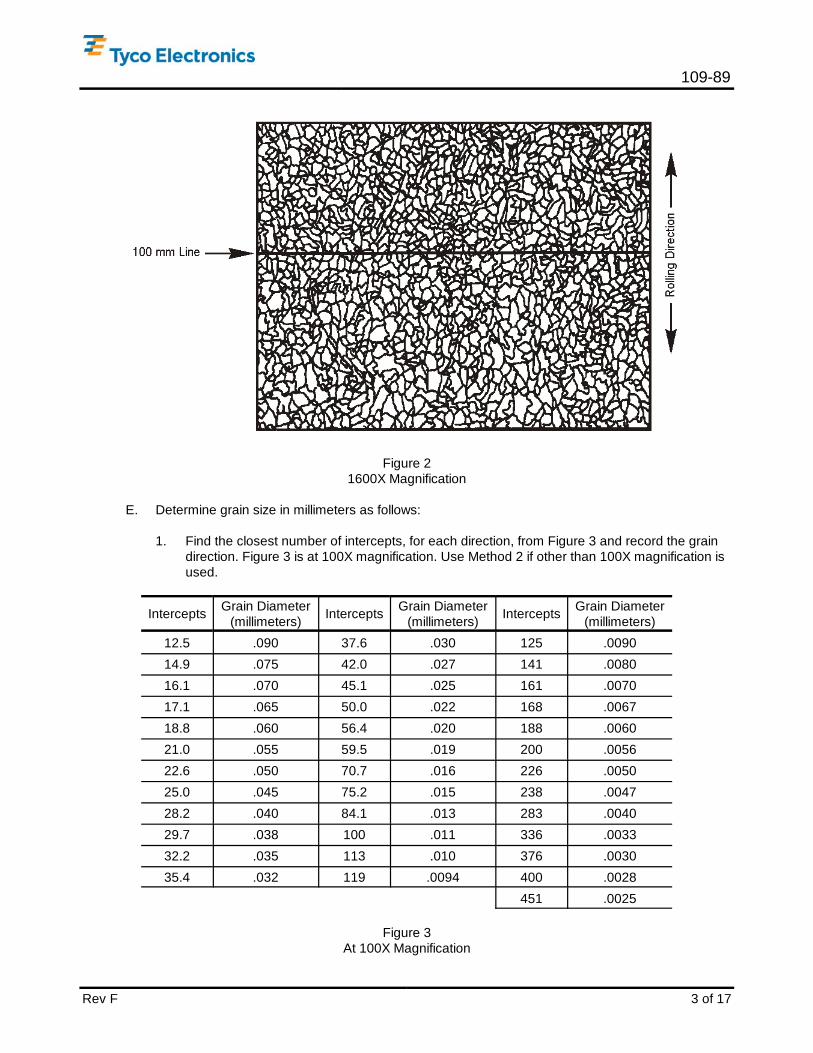
1. Photograph shall have 2 thin lines, 100 millimeters long, placed on it. One line shall be parallelto the rolling direction and the other perpendicular as indicated in Figure 2.
2. Viewing screen shall be capable of having a thin, 100 millimeters long, line superimposed onthe image parallel to the rolling direction and perpendicular as indicated in Figure 2.
C. Count the number of grains which intercept the line in each direction and record. Grains touched bythe ends of a line count as half grains. If the number of grains intercepted by the line is outside therange of intercepts shown in Figure 3, increase or decrease magnification until the intercepts arewithin the range.
D. Grain size measurements shall be made on 2 representative fields from each specimen. If thespecimens have a duplex grain size, measurements shall be made in each representative area.
109-89
Rev F 3 of 17
Figure 21600X Magnification
E. Determine grain size in millimeters as follows:
1. Find the closest number of intercepts, for each direction, from Figure 3 and record the graindirection. Figure 3 is at 100X magnification. Use Method 2 if other than 100X magnification isused.
InterceptsGrain Diameter
(millimeters)Intercepts
Grain Diameter(millimeters)
InterceptsGrain Diameter
(millimeters)
12.5 .090 37.6 .030 125 .0090
14.9 .075 42.0 .027 141 .0080
16.1 .070 45.1 .025 161 .0070
17.1 .065 50.0 .022 168 .0067
18.8 .060 56.4 .020 188 .0060
21.0 .055 59.5 .019 200 .0056
22.6 .050 70.7 .016 226 .0050
25.0 .045 75.2 .015 238 .0047
28.2 .040 84.1 .013 283 .0040
29.7 .038 100 .011 336 .0033
32.2 .035 113 .010 376 .0030
35.4 .032 119 .0094 400 .0028
451 .0025
Figure 3At 100X Magnification

109-89
Rev F 4 of 17
2. Calculate the grain size for each direction as follows:
3. Calculate average grain size by adding the grain sizes parallel and perpendicular to rollingdirection and divide by 2 as follows:
4. Rounding Off Procedure
The combined grain size shall be expressed to the nearest .0001 millimeter. In the reportingprocedure, round off to the nearest .001 millimeter grain size.
Example: .0044 millimeters rounds off to .004 millimeters.0045 millimeters rounds off to .005 millimeters
F. Example
The following example is for 37 grain intercepts in the direction perpendicular to the rolling directionand 25 grain intercepts parallel to the rolling direction. The intercept count was made at 1600Xmagnification.
1. Perpendicular Direction Grain Size
From Figure 3, for 37 grains, the closest grain diameter is .030 millimeters. Using the equationin paragraph 4.2.E.2., determine the grain size as follows:
2. Parallel Direction Grain Size
From Figure 3, for 25 grains, the closest grain diameter is .045 millimeters. Using the equationin paragraph 4.2.E.2., determine the grain size as follows:
3. Average Grain Size
Using the equation in paragraph 4.2.E.3., determine the average grain size as follows:

109-89
Rev F 5 of 17
4.3. Abrams Intercept Method, 109-89-3
A. The procedure is based on the intercept method and utilizes a 50 cm total length circular patternconsisting of three concentric circles whose radii obey an arithmetic progression. The statisticaladvantage of large numbers is assured by selecting an appropriate magnification that will yieldapproximately 100 intercepts with the above-described 50 cm pattern. In addition, application of thecentral limit theorem permits the data to be interpreted as a normal distribution. The applicablility ofnormal statistics is substantiated by the fact that a chi-square test on the data showed that themeasurement variation for the procedure is quite normal. Treating the measurements as a normaldistribution provides a simple and relatively accurate means of qualifying the results. Thus, bothaccuracy and a confidence level are indicated for each grain size measurement.
Figure 4Relationship Between ASTM Grain Size Number & The Magnification To Provide
Approximately 100 Intercepts On A 50 cm Pattern (NL of 2)

109-89
Rev F 6 of 17
Figure 5Circular Pattern With Total Length of 50 cm For Use With Intercept Method
Figure 6Nomograph To Convert Intercept Value To Grain Size

109-89
Rev F 7 of 17
B. The step-by-step procedure for the method is outlined below, and amplification of each step ispresented in the discussion segment.
1. Perform a cursory examination of the microstructure and estimate its equivalent grain sizenumber using the comparison method, (Figures 12 and 13).
2. Refer to Figure 4 to ascertain the appropriate magnification that will yield approximately 100intercepts for the 50-cm circular pattern shown in Figure 5. A nearby convenient magnificationmay be used.
3. Randomly select five areas on the specimen that will be used for counting to prevent biasing,the observer should not keep a consecutive count of the number of intercepts but should usea manual counter. Either direct measurement on the microscope using the appropriatereticule or measurement on the micrographs for permanent record may be used. Obtain fivecounts (X1 X5) of the grain size. Triple points should be given a double count; this willintroduce a small systematic error, since 1.5 counts for triple points is technically correct.However, use of the manual counter, which does not permit half-counts, is consideredimportant enough to justify this small error.
4. Calculate the average, the standard deviation, and the coefficient of variation using thefollowing equations:
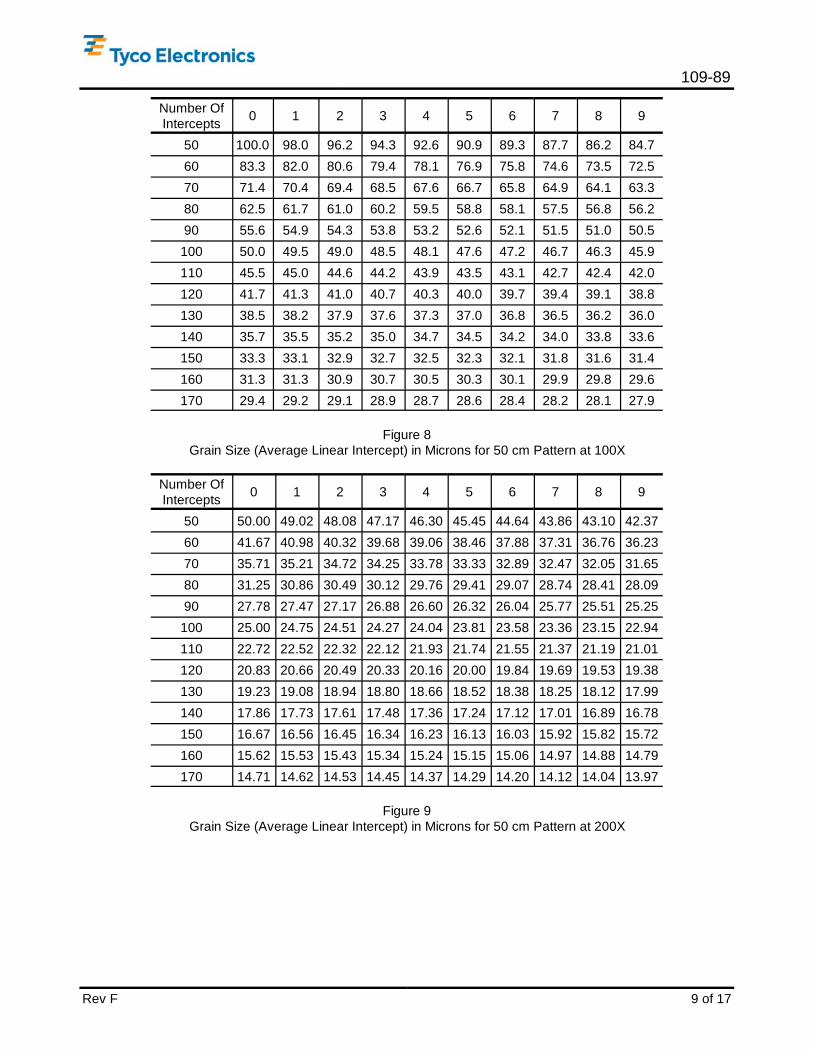
5. Convert the average number of intercepts, D, to the equivalent Heyn grain size in micronsusing Hilliard's nomograph adapted to our purposes Figure 6. For more accuracy, Figures 8through 11, which are for the common magnification, may be used.

109-89
Rev F 8 of 17
6. For the five fields observed (N=5), and the coefficient of variation calculated, use the curvesshown in Figure 7 to qualify the measurement. Precise values for the accuracy andconfidence level may be calculated by applying the equation which was used to generate thecurves in Figure 7, namely:
Where: N = number of fields or number of independent measurements.Zcl = the number of standard deviations corresponding to a given confidence levelfor a normal distribution.A = % accuracy or % deviation of estimated value from the "true" value.Fx = standard deviation of population.0 = Arithmetic mean of population.
Figure 7Coefficient Of Variation Versus The Number Of Fields Measured For A 5% Accuracy
7. If a desired accuracy and confidence level are not achieved by five measurements, then,since the coefficient of variation does not change very much as a function of N, Figure 7 canbe used to determine approximately how many additional measurements are necessary.
109-89
Rev F 9 of 17
Number OfIntercepts
0 1 2 3 4 5 6 7 8 9
50 100.0 98.0 96.2 94.3 92.6 90.9 89.3 87.7 86.2 84.7
60 83.3 82.0 80.6 79.4 78.1 76.9 75.8 74.6 73.5 72.5
70 71.4 70.4 69.4 68.5 67.6 66.7 65.8 64.9 64.1 63.3
80 62.5 61.7 61.0 60.2 59.5 58.8 58.1 57.5 56.8 56.2
90 55.6 54.9 54.3 53.8 53.2 52.6 52.1 51.5 51.0 50.5
100 50.0 49.5 49.0 48.5 48.1 47.6 47.2 46.7 46.3 45.9
110 45.5 45.0 44.6 44.2 43.9 43.5 43.1 42.7 42.4 42.0
120 41.7 41.3 41.0 40.7 40.3 40.0 39.7 39.4 39.1 38.8
130 38.5 38.2 37.9 37.6 37.3 37.0 36.8 36.5 36.2 36.0
140 35.7 35.5 35.2 35.0 34.7 34.5 34.2 34.0 33.8 33.6
150 33.3 33.1 32.9 32.7 32.5 32.3 32.1 31.8 31.6 31.4
160 31.3 31.3 30.9 30.7 30.5 30.3 30.1 29.9 29.8 29.6
170 29.4 29.2 29.1 28.9 28.7 28.6 28.4 28.2 28.1 27.9
Figure 8Grain Size (Average Linear Intercept) in Microns for 50 cm Pattern at 100X
Number OfIntercepts
0 1 2 3 4 5 6 7 8 9
50 50.00 49.02 48.08 47.17 46.30 45.45 44.64 43.86 43.10 42.37
60 41.67 40.98 40.32 39.68 39.06 38.46 37.88 37.31 36.76 36.23
70 35.71 35.21 34.72 34.25 33.78 33.33 32.89 32.47 32.05 31.65
80 31.25 30.86 30.49 30.12 29.76 29.41 29.07 28.74 28.41 28.09
90 27.78 27.47 27.17 26.88 26.60 26.32 26.04 25.77 25.51 25.25
100 25.00 24.75 24.51 24.27 24.04 23.81 23.58 23.36 23.15 22.94
110 22.72 22.52 22.32 22.12 21.93 21.74 21.55 21.37 21.19 21.01
120 20.83 20.66 20.49 20.33 20.16 20.00 19.84 19.69 19.53 19.38
130 19.23 19.08 18.94 18.80 18.66 18.52 18.38 18.25 18.12 17.99
140 17.86 17.73 17.61 17.48 17.36 17.24 17.12 17.01 16.89 16.78
150 16.67 16.56 16.45 16.34 16.23 16.13 16.03 15.92 15.82 15.72
160 15.62 15.53 15.43 15.34 15.24 15.15 15.06 14.97 14.88 14.79
170 14.71 14.62 14.53 14.45 14.37 14.29 14.20 14.12 14.04 13.97
Figure 9Grain Size (Average Linear Intercept) in Microns for 50 cm Pattern at 200X

109-89
Rev F 10 of 17
Number OfIntercepts
0 1 2 3 4 5 6 7 8 9
50 25.00 24.51 24.04 23.58 23.15 22.73 22.32 21.93 21.55 21.19
60 20.83 20.49 20.16 19.84 19.53 19.23 18.94 18.66 18.38 18.12
70 17.86 17.61 17.36 17.12 16.89 16.67 16.45 16.23 16.03 15.82
80 15.62 15.43 15.24 15.06 14.88 14.71 14.53 14.37 14.20 14.04
90 13.89 13.74 13.59 13.44 13.30 13.16 13.02 12.89 12.76 12.63
100 12.50 12.38 12.25 12.14 12.02 11.90 11.79 11.68 11.57 11.47
110 11.36 11.36 11.26 11.16 11.06 10.96 10.78 10.68 10.59 10.50
120 10.42 10.33 10.25 10.16 10.08 10.00 9.92 9.84 9.77 9.69
130 9.62 9.54 9.47 9.40 9.33 9.26 9.19 9.12 9.06 8.99
140 8.93 8.87 8.80 8.74 8.68 8.62 8.56 8.50 8.45 8.39
150 8.33 8.28 8.22 8.17 8.12 8.06 8.01 7.96 7.91 7.86
160 7.81 7.76 7.72 7.67 7.62 7.58 7.53 7.49 7.44 7.40
170 7.35 7.31 7.27 7.23 7.18 7.14 7.10 7.06 7.02 6.98
Figure 10Grain Size (Average Linear Intercept) in Microns for 50 cm Pattern at 400X
Number OfIntercepts
0 1 2 3 4 5 6 7 8 9
50 12.50 12.25 12.02 11.79 11.57 11.36 11.16 10.96 10.78 10.59
60 10.42 10.25 10.08 9.92 9.77 9.62 9.47 9.33 9.19 9.06
70 8.93 8.80 8.68 8.56 8.45 8.33 8.22 8.12 8.01 7.91
80 7.81 7.72 7.62 7.53 7.44 7.35 7.27 7.18 7.10 7.02
90 6.94 6.87 6.79 6.72 6.65 6.58 6.51 6.44 6.38 6.31
100 6.25 6.19 6.13 6.07 6.01 5.95 5.90 5.84 5.79 5.73
110 5.68 5.63 5.58 5.53 5.48 5.43 5.39 5.34 5.30 5.25
120 5.21 5.17 5.12 5.08 4.66 4.63 4.60 4.56 4.53 4.50
140 4.46 4.43 4.40 4.37 4.34 4.31 4.28 4.25 4.22 4.19
150 4.17 4.14 4.11 4.08 4.06 4.03 4.01 3.98 3.96 3.93
160 3.91 3.88 3.86 3.83 3.81 3.79 3.77 3.74 3.72 3.70
170 3.68 3.65 3.63 3.61 3.59 3.57 3.55 3.53 3.51 3.49
Figure 11Grain Size (Average Linear Intercept) in Microns for 50 cm Pattern at 800X
109-89
Rev F 11 of 17
5. DOCUMENTATION
5.1. Data sheet(s) shall contain the following:
! Title of test! Specimen description including part number, lot number, etc.! Test equipment used!. Test procedure! Values and observations
• 109-89-1 Grain size estimate Figures 12 and 13• 109-89-2 Heyn's Intercept Method
N Number of grains parallel to rolling directionN Number of grains perpendicular to rolling directionN Calculated average grain sizeN Photograph shall be included for material supplied to Material Specification 100-746
• 109-89-3 Abram's Intercept MethodN Number of intercepts per fieldN Average for 5 fieldsN Calculated average grain sizeN Photographs shall be included for material supplied to Material Specification 100-746
! Name of operator and date of test
5.2. The following shall be specified in the referencing document:
! Number of specimens to be tested shall be 1 specimen from each end of the coil received fromsupplier, except when material is supplied at die width; unless otherwise specified.
! Acceptance levels

109-89
Rev F 12 of 17
Figure 12 (continued)Nonferrous, 75X

109-89
Rev F 13 of 17
Figure 12 (continued)Nonferrous, 75X

109-89
Rev F 14 of 17
Figure 12 (end)Nonferrous, 75X

109-89
Rev F 15 of 17
Figure 13 (continued)Ferrous, 100X
109-89
Rev F 16 of 17
Figure 13 (continued)Ferrous, 100X

109-89
Rev F 17 of 17
Figure 13 (end)Ferrous, 100X


