STATUS OF THE ABSORPTION LENGTH MEASUREMENT ANTARES collaboration meeting Clermont-Ferrand (France),...
29
STATUS OF THE ABSORPTION STATUS OF THE ABSORPTION LENGTH MEASUREMENT LENGTH MEASUREMENT ANTARES collaboration ANTARES collaboration meeting meeting Clermont-Ferrand (France), Clermont-Ferrand (France), May 17th-20th May 17th-20th 1 H Yepes, JdD Zornoza, J Zuñiga, C Bigongiari, J Ruiz H Yepes, JdD Zornoza, J Zuñiga, C Bigongiari, J Ruiz IFIC (CSIC – Universidad de Valencia) IFIC (CSIC – Universidad de Valencia)
-
date post
22-Dec-2015 -
Category
Documents
-
view
228 -
download
1
Transcript of STATUS OF THE ABSORPTION LENGTH MEASUREMENT ANTARES collaboration meeting Clermont-Ferrand (France),...

STATUS OF THE STATUS OF THE ABSORPTION LENGTH ABSORPTION LENGTH
MEASUREMENT MEASUREMENT
STATUS OF THE STATUS OF THE ABSORPTION LENGTH ABSORPTION LENGTH
MEASUREMENT MEASUREMENT
ANTARES collaboration ANTARES collaboration meeting meeting
Clermont-Ferrand (France), Clermont-Ferrand (France), May 17th-20thMay 17th-20th
1H Yepes, JdD Zornoza, J Zuñiga, C Bigongiari, J Ruiz H Yepes, JdD Zornoza, J Zuñiga, C Bigongiari, J Ruiz IFIC (CSIC – Universidad de Valencia)IFIC (CSIC – Universidad de Valencia)

THE EXPERIMENTAL PROCEDURE (REMINDER)
NEW TREATMENT OF ERRORS: DATA FITTING
EXTRACTION OF ABSORPTION LENGTH
CONCLUSIONS AND OUTLOOK
OUTLINEOUTLINEOUTLINEOUTLINE
ANTARES collaboration meeting ANTARES collaboration meeting Clermont-Ferrand, May 17th-Clermont-Ferrand, May 17th-20th20th
2
EXPONENTIAL FIT L
Rhitshits
signal eNRN
02
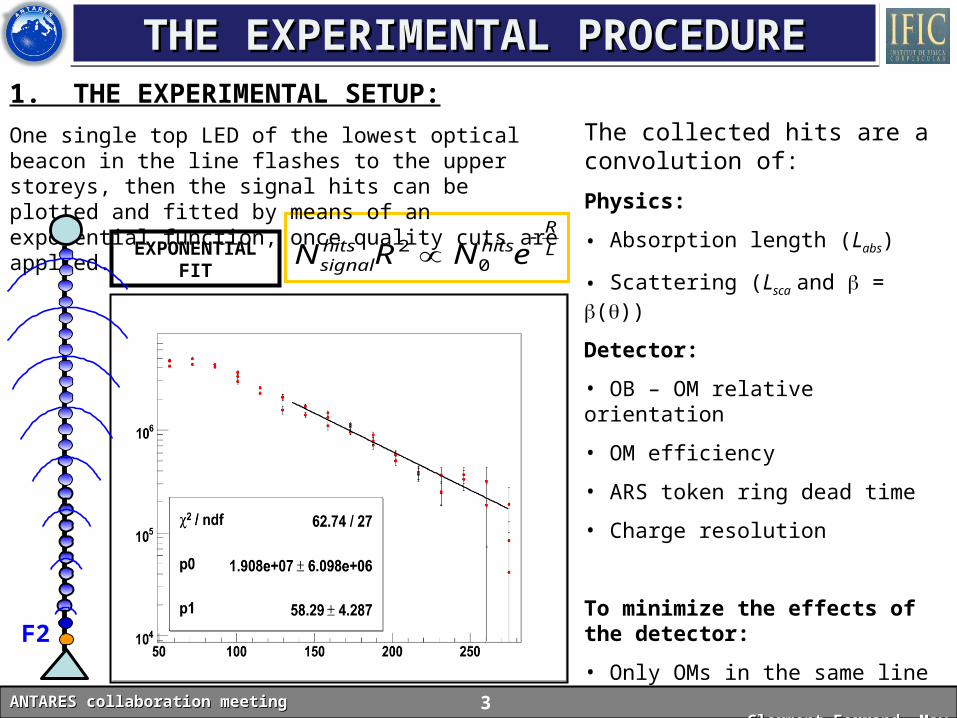
1. THE EXPERIMENTAL SETUP:
One single top LED of the lowest optical beacon in the line flashes to the upper storeys, then the signal hits can be plotted and fitted by means of an exponential function, once quality cuts are applied.
The collected hits are a convolution of:
Physics:
• Absorption length (Labs)
• Scattering (Lsca and = ())
Detector:
• OB – OM relative orientation
• OM efficiency
• ARS token ring dead time
• Charge resolution
To minimize the effects of the detector:
• Only OMs in the same line are considered.
• Consider only the region (Rmin, Rmax) where signal < spe but well above background
THE EXPERIMENTAL PROCEDURETHE EXPERIMENTAL PROCEDURETHE EXPERIMENTAL PROCEDURETHE EXPERIMENTAL PROCEDURE
ANTARES collaboration meeting ANTARES collaboration meeting Clermont-Ferrand, May 17th-Clermont-Ferrand, May 17th-20th20th
F2
3

Nnoise
Tmax
Tmin
Nsignal
2. TIME DISTRIBUTION:• Determine the peak Gaussian fit
• Choose a fixed time window [Tmin, Tmax] and select the hits:
Tmin = Tpeak – 3Tmax = Tpeak + 1000 ns
• Calculate their overall charge Qhits and Nhits.
3. NOISE CONTRIBUTION:
• Fit a constant in the [-1000, -50] ns range (B level) and substract the noise contribution (Qnoise, Nnoise):
Nsignal = Nhits(tot)– Nnoise = Ntot – Blevel (Tmin - Tmax)
NOISE LEVEL
THE EXPERIMENTAL PROCEDURETHE EXPERIMENTAL PROCEDURETHE EXPERIMENTAL PROCEDURETHE EXPERIMENTAL PROCEDURE
ANTARES collaboration meeting ANTARES collaboration meeting Clermont-Ferrand, May 17th-Clermont-Ferrand, May 17th-20th20th
4

4. CHARGE LOSSES:• Some hits are lost due to the electronic dead time from the readout of the ARSs. Effect related to Rmin.
• Consider only the region where the probability to get more than one photoelectron is negligible (i.e. < 1 %).
5. PMT EFFICIENCY CORRECTION BY NOISE:
• Assume that the Nnoise ~ PMT
• Normalize PMTs signal to their own noise (hits or charge):
THE EXPERIMENTAL PROCEDURETHE EXPERIMENTAL PROCEDURETHE EXPERIMENTAL PROCEDURETHE EXPERIMENTAL PROCEDURE
ANTARES collaboration meeting ANTARES collaboration meeting Clermont-Ferrand, May 17th-Clermont-Ferrand, May 17th-20th20th
PMTsignalnoise
referencenoise
signalsignal NN
NNN *
5

6. NOISE FLUCTUATIONS:
• To avoid noise fluctuations at large distances, signal greater than the noise is required Maximum distance to fit Rmax.
7. MEASUREMENT OF ERRORS:
• The estimation of statistical and dispersion errors are being carefully studied for the data:
Each storey provides 3 intensity measurements. These measurements are not treated independently, correlated errors can be obtained. 8. LOW EFFICIENCY OMs CLEANING:
• Low efficiency OMs are removed. Checked from noise plots Compute hits projections, fit a Gaussian and consider only OMs between (+3, -3).
9. THE BACKGROUND “FLATNESS”:
• Efficiency correction by noise is affected by noise fluctuations along the line A “flat” level noise along the line required.
THE EXPERIMENTAL PROCEDURETHE EXPERIMENTAL PROCEDURETHE EXPERIMENTAL PROCEDURETHE EXPERIMENTAL PROCEDURE
ANTARES collaboration meeting ANTARES collaboration meeting Clermont-Ferrand, May 17th-Clermont-Ferrand, May 17th-20th20th
6
22dispstatT

• Then the variable
follows Student’s t distribution:
with ν = n–1 degrees of freedom
• Therefore the error is taken to be: σ = t ∙ s/√n
• In order to have 68.27% errors, the one-side tail of the cumulative Student function must be 84.13% and thus t= 1.32 (for n=3) or t=1.83 (for n=2).
• If only one OM in the storey do not use that storey in the fit.
NEW TREATMENT OF ERRORS: DATA FITTING
NEW TREATMENT OF ERRORS: DATA FITTING
ANTARES collaboration meeting ANTARES collaboration meeting Clermont-Ferrand, May 17th-Clermont-Ferrand, May 17th-20th20th
7
• Each storey provides 3 intensity measurements (3 OMs).
• Assume these measurements are independent and gaussian distributed (check this hypothesis later with results).
• Assign one signal intensity per storey computed as the average of the 3 OMs
– OM signal extraction as before: subtract background, correct by efficiency, discard bad OMs
• Compute error by means of Student’s t (this is the usual treatment for the estimation of the mean and standard deviation of a gaussian distribution when none of the two parameters are known):
n
ii
n
ii
xxn
s
xn
x
1
22
1
)(1
1
1
s
xt
2/)1(2 )/1()2/(
)2/)1(()(
ttf
NEW TREATMENT OF ERRORS:

NEW TREATMENT OF ERRORS: DATA FITTING
NEW TREATMENT OF ERRORS: DATA FITTING
ANTARES collaboration meeting ANTARES collaboration meeting Clermont-Ferrand, May 17th-Clermont-Ferrand, May 17th-20th20th
8
SOME NEW FIT EXAMPLES (t-STUDENT TEST):
• Some errors give low - high values for .
• ↓, 2 ↑, forces to fit for this point, deforming the tendency.
L2 L2L2
L12

NEW TREATMENT OF ERRORS: DATA FITTING
NEW TREATMENT OF ERRORS: DATA FITTING
ANTARES collaboration meeting ANTARES collaboration meeting Clermont-Ferrand, May 17th-Clermont-Ferrand, May 17th-20th20th
9
TRANSMISSION LENGTH RESULTS:
Blue UV
Blue
UV

NEW TREATMENT OF ERRORS: DATA FITTING
NEW TREATMENT OF ERRORS: DATA FITTING
ANTARES collaboration meeting ANTARES collaboration meeting Clermont-Ferrand, May 17th-Clermont-Ferrand, May 17th-20th20th
10
TRANSMISSION LENGTH RESULTS:
Blue UV
Blue
UV

NEW TREATMENT OF ERRORS: DATA FITTING
NEW TREATMENT OF ERRORS: DATA FITTING
ANTARES collaboration meeting ANTARES collaboration meeting Clermont-Ferrand, May 17th-Clermont-Ferrand, May 17th-20th20th
11
• The mean value of the distribution of the L errors from the fits shows a good agreement with the RMS of the transmission length distribution (Blue: 3.0m vs 2.4m, UV: 2.1 vs. 1.1):
= 470 nm = 400 nm

NEW TREATMENT OF ERRORS: DATA FITTING
NEW TREATMENT OF ERRORS: DATA FITTING
ANTARES collaboration meeting ANTARES collaboration meeting Clermont-Ferrand, May 17th-Clermont-Ferrand, May 17th-20th20th
12
Blue = 470 nm) Student’s t error values
Entries 29
L ± RMS[m] 55.1±3.0
Average σfit (RMS) [m] 2.4 (0.9)
Mean Prob (2) (RMS) 0.66
RMS Prob (2) 0.36
Entries with Prob (2) < 1% 1
UV ( = 400 nm) Student’s t error values
Entries 13
L ± RMS[m] 38.1±2.1
Mean σfit (RMS) [m] 1.1 (0.6)
Mean Prob (2) 0.61
RMS Prob (2) 0.31
Entries with Prob (2) < 1% 0
• Reasonable fit probabilities
• Variability of L ~6% (RMS/L):
RMS of L in agreement with average σfit : 3.0 m vs 2.4 m
Change of L with time not much larger than statistical
• Somewhat high probabilities: cluster close to 1 and
• Mean Prob (2) = 0.66 (should be 0.5)
• RMS Prob (2)=0.36 (should be 1/√12=0.29)
• Good fit probabilities
• Variability of L around 6% (RMS/L):
RMS of L distribution in agreement with average σfit :2.1 m vs. 1.1 m
• Small cluster at high probabilities:
• Mean Prob (2) = 0.6 (should be 0.5)
• RMS Prob (2)=0.31 (should be 1/√12=0.29)
What errors would give a flat Prob (2) (assuming they are the same at all distances) for the blue runs?
Answer: 5% relative errors
FITTING TRANSMISSION LENGTH: RESULTS

NEW TREATMENT OF ERRORS: DATA FITTING
NEW TREATMENT OF ERRORS: DATA FITTING
ANTARES collaboration meeting ANTARES collaboration meeting Clermont-Ferrand, May 17th-Clermont-Ferrand, May 17th-20th20th
EQUAL ERROR ASSIGNMENT FOR ALL THE EXPERIMENTAL POINTS (σ/x = 0.05):
13
Blue UV
Blue
UV

NEW TREATMENT OF ERRORS: DATA FITTING
NEW TREATMENT OF ERRORS: DATA FITTING
ANTARES collaboration meeting ANTARES collaboration meeting Clermont-Ferrand, May 17th-Clermont-Ferrand, May 17th-20th20th
EQUAL ERROR ASSIGNMENT FOR ALL THE EXPERIMENTAL POINTS (σ/x = 0.05):
14
Blue UV
Blue
UV

NEW TREATMENT OF ERRORS: DATA FITTING
NEW TREATMENT OF ERRORS: DATA FITTING
ANTARES collaboration meeting ANTARES collaboration meeting Clermont-Ferrand, May 17th-Clermont-Ferrand, May 17th-20th20th
• For an equal error assignment (5 %), once again good agreement with the RMS of the transmission length distribution:
= 470 nm = 400 nm
15

NEW TREATMENT OF ERRORS: DATA FITTING
NEW TREATMENT OF ERRORS: DATA FITTING
ANTARES collaboration meeting ANTARES collaboration meeting Clermont-Ferrand, May 17th-Clermont-Ferrand, May 17th-20th20th
16
Blue = 470 nm) Fixed 5% relative errors
Entries 29
L ± RMS[m] 54.5±2.4
Average σfit (RMS) [m] 1.9 (0.3)
Mean Prob (2) (RMS) 0.46
RMS Prob (2) 0.33
Entries with Prob (2) < 1% 2
UV ( = 400 nm) Fixed 5% relative errors
Entries 14
L ± RMS[m] 37.1±1.2
Mean σfit (RMS) [m] 0.7 (0.1)
Mean Prob (2) 0.37
RMS Prob (2) 0.36
Entries with Prob (2) < 1% 3
• Not a significant change in L (55.1 vs 54.5)
• Average σfit is slightly lower than RMS of distribution
(1.9 vs 2.4), but not much room for non-statistical variability
• Not a significant change in L (38.1 vs 37.1)
• Average σfit is slightly lower that RMS of distribution
(0.7 vs 1.2), but not much room for non-statistical variability
L(t-5%) < 1m

ΔR can be extracted from time distributions !!!
t
EXTRACTION OF ABSORPTION LENGTHEXTRACTION OF ABSORPTION LENGTH
ANTARES collaboration meeting ANTARES collaboration meeting Clermont-Ferrand, May 17th-Clermont-Ferrand, May 17th-20th20th
SCATTERING CONTRIBUTION TO THE TRANSMISSION LENGTH (L) (“R technique”):• The effect of scattering is to increase the photon path length in ΔR on average.• Perform the exponential fit using (mean photon path), R + ΔR instead of R.
R
ΔR
R+ΔR
w direct wR c t t c t
• ΔR should be proportional to the scattering.• Exponential fit with R + ΔR will be more insensitive to scattering since the greater the scattering the greater the delay and viceversa, making the L parameter closer to the real absorption length.
L
RR
eIIR)(
02
17

EXTRACTION OF ABSORPTION LENGTHEXTRACTION OF ABSORPTION LENGTH
ANTARES collaboration meeting ANTARES collaboration meeting Clermont-Ferrand, May 17th-Clermont-Ferrand, May 17th-20th20th
Parameterization of R for MC:
Extracting R from the time distributions gives a linear dependence of R+R on R, both for MC and data.
The values of the above slopes are then related to the Rayleigh scattering ().
MC simulations can give an idea about the scattering contribution, from the relationship between R + R and R: R + R = p0+p1*R (p depends on scattering)
Correlation between R and R+R
18
Parameterization factor distributions

EXTRACTION OF ABSORPTION LENGTHEXTRACTION OF ABSORPTION LENGTH
ANTARES collaboration meeting ANTARES collaboration meeting Clermont-Ferrand, May 17th-Clermont-Ferrand, May 17th-20th20th
19
Transmission length (L) dependence on scattering parameters, and scat (no corrected by R):
• L depends on scat,eff . Almost constant if scat,eff ↑ (parameterization is needed).
cos1scateff
scat
L-scat,eff (by

EXTRACTION OF ABSORPTION LENGTHEXTRACTION OF ABSORPTION LENGTH
ANTARES collaboration meeting ANTARES collaboration meeting Clermont-Ferrand, May 17th-Clermont-Ferrand, May 17th-20th20th
20
• L is strongly correlated to scat . Low values of scat , gives low values for L. (same color->same ).
• L shows an anti-correlation with . High values of give low values of L (same color -> same scat).
SCATTERING EFFECTS ARE MOST REMARKABLE AND EVIDENT
L-scat (by ) L-(by scat)
Transmission length (L) dependence on scattering parameters, and scat (no corrected by R):

EXTRACTION OF ABSORPTION LENGTHEXTRACTION OF ABSORPTION LENGTH
ANTARES collaboration meeting ANTARES collaboration meeting Clermont-Ferrand, May 17th-Clermont-Ferrand, May 17th-20th20th
21
L → constant if scat,eff ↑ (scat,eff > 150 m)
L-scat,eff (by L-scat,eff (by sca
cos1scateff
scat
cos1scateff
scat
Transmission length (L) dependence on scattering parameters, and scat (corrected by R):

EXTRACTION OF ABSORPTION LENGTHEXTRACTION OF ABSORPTION LENGTH
ANTARES collaboration meeting ANTARES collaboration meeting Clermont-Ferrand, May 17th-Clermont-Ferrand, May 17th-20th20th
22
MC transmission length (L) plots for dependence on and scat (corrected by R):
• When L is corrected by R, there is not much dependence on the tested water parameters, except for extreme models.
• Intermediate values for scat (~50 m) and low values for (0.14), gives the nearest value for L to abs.
L-scat (by ) L-(by scat)

EXTRACTION OF ABSORPTION LENGTHEXTRACTION OF ABSORPTION LENGTH
ANTARES collaboration meeting ANTARES collaboration meeting Clermont-Ferrand, May 17th-Clermont-Ferrand, May 17th-20th20th
Parameterization constant (p1) as a function of scattering length and effective scattering length ( - scattering length):
• A dedicated study of the correct parameterization of R, is actually ongoing in order to reach the best estimation in MC and then to be implemented the technique for data .
• Parameterization constant “p1” is correlated to scat and then to scat,eff for different considered.
• For different scat, p1 has also a strong dependence to scat,eff .23
p1-scatp1-scat,eff (by scat)

EXTRACTION OF ABSORPTION LENGTHEXTRACTION OF ABSORPTION LENGTH
ANTARES collaboration meeting ANTARES collaboration meeting Clermont-Ferrand, May 17th-Clermont-Ferrand, May 17th-20th20th
L with R parameterization MCL without R correction MC
24
New results of R technique for MC simulations:
• Fitting L to <R+R> seems to “recover” abs, with some small constant shift
• Some cross-overs in the p1 dependence on the input parameters seems to point out the need of more statistics (ongoing !).
• Results for data soon !!!
L(R-R+R) ~ 4 – 5 m

CONCLUSIONS AND OUTLOOKCONCLUSIONS AND OUTLOOKCONCLUSIONS AND OUTLOOKCONCLUSIONS AND OUTLOOK
ANTARES collaboration meeting ANTARES collaboration meeting Clermont-Ferrand, May 17th-Clermont-Ferrand, May 17th-20th20th
DATA FITTING:
• New method based on averaging the OM signals of each storey and computing the error using the Student t distribution gives reasonable χ2 values both for blue and UV light.
• The “transmission length” is rather stable in time for both wavelengths and the RMS of its distribution is close to the average σfit , therefore there is not much room for the variation of L due to changes in the medium (at least for the type of runs we use, i.e. low background periods).
• There are a few cases of bad fits (due mostly to one single point with very small error) and a tendency towards too high probabilities (overestimate of errors). If the errors in all the storeys are fixed by hand to 5% we get a flatter Prob(χ2). In any case, the change in the computed transmission length is small (ΔL ≤ 1m).
• The stability in time and reproducibility of the transmission length (with different errors, for different lines, with different LEDs) gives confidence in the analysis. However, we will continue investigating possible systematic effects.
25
CONCLUSIONS AND OUTLOOKCONCLUSIONS AND OUTLOOKCONCLUSIONS AND OUTLOOKCONCLUSIONS AND OUTLOOK
ANTARES collaboration meeting ANTARES collaboration meeting Clermont-Ferrand, May 17th-Clermont-Ferrand, May 17th-20th20th
EXTRACTION OF ABSORPTION LENGTH:
• Assuming that most of the effect of the scattering length in the transmission length comes from the increased path length (“ΔR”) of photons, this additional path length can be extracted from the time distribution as a function of distance. A corrected transmission length can be computed inputting R+ ΔR in the fits (instead of R).
• The corrected value of scat does not depend strongly on the input water parameters, except for extreme models.
• New runs with other values of the input abs and more statistics are underway to check the stability of the method.
26

27
BACKUP BACKUP SLIDESSLIDESBACKUP BACKUP SLIDESSLIDES

BACKUP SLIDESBACKUP SLIDESBACKUP SLIDESBACKUP SLIDES
ANTARES collaboration meeting ANTARES collaboration meeting Clermont-Ferrand, May 17th-Clermont-Ferrand, May 17th-20th20th
28
STUDENTS t DISTRIBUTION:
A

BACKUP SLIDESBACKUP SLIDESBACKUP SLIDESBACKUP SLIDES
ANTARES collaboration meeting ANTARES collaboration meeting Clermont-Ferrand, May 17th-Clermont-Ferrand, May 17th-20th20th
29
2 DISTRIBUTION:
A