STATISTICAL HANDBOOK 2021
54
Trade, Investment & Tourism between Japan and Forum Island Countries 統計ハンドブック 2021 日本と太平洋島嶼国との間の貿易・投資・観光 国際機関 太平洋諸島センター STATISTICAL HANDBOOK 2021
Transcript of STATISTICAL HANDBOOK 2021
Trade, Investment & Tourism betweenJapan and Forum Island Countries
統計ハンドブック 2021日本と太平洋島嶼国との間の貿易・投資・観光
国際機関 太平洋諸島センター
STATISTICAL HANDBOOK 2021


ForewordPacific Islands Centre (PIC) is pleased to present the STATISTICAL HANDBOOK 2020, detailing comprehensive statistical data on trade, investment and tourism between Japan and Forum Island Countries (FICs). The statistical period covers the five years from 2016 to 2020 (as to Tourism, from 2009 to 2018). The purpose of this handbook is to provide background information on Japan’s imports from, exports to, investments in and visitors arrivals from Japan to the FICs. We hope that the STATISTICAL HANDBOOK 2021 will be useful for those involved in planning and developing trade and business between the FICs and Japan. At the completion of this handbook, we received full cooperation from Dr. Takehiro KUROSAKI, Junior Associate Professor of Tokai University and appreciated his effort.
Pacific Islands CentreTokyo, Japan
はじめにこのハンドブックは、日本と太平洋島嶼国との貿易と投資関係を紹介するため、過去5年間(2016年~2020年)の統計データをとりまとめたものです(観光データに関しては、2009年~2018年)。本書は、財務省貿易統計等をもとに、関連統計を取り出してとり纏める形で製作しております。このための統計データの通貨単位は、日本円となっております。このハンドブックが、太平洋島嶼国の国々とのビジネスや貿易・投資・観光にご関心のある方々のお役に立ちましたならば幸いです。なお、ハンドブックの作成にあたっては、東海大学講師の黒崎岳大氏の協力を得ました。改めて感謝いたします。
国際機関 太平洋諸島センター
Copyright©2021 by Pacific Islands Centre (PIC)

1. Overview of Japan's Trade with FICs (日本と対太平洋島嶼国との間の貿易) …………………………………………… 4 ①Japan's Export to FICs by Commodities and Countries (2020) (日本の商品別国別輸出状況、2020年) ………………………………………… 4 ②Japan's Import from FICs by Commodities and Countries (2020) (日本の商品別国別輸入状況、2020年) ………………………………………… 6 ③Japan's Trade with FICs from 2011~2020 (日本と太平洋島嶼国との間の貿易の推移、2011年~2020年) ………………… 8 ④Composition of Japan's Imports from FICs (2016~2020) (日本の輸入品目、2016年~2020年) …………………………………………… 9 ⑤Ranking of FIC Importers of Japanese Goods (2016~2020) (日本の国別輸出額と順位、2016年~2020年) ………………………………… 10 ⑥Ranking of FIC Exporters to Japan (2016~2020) (日本の国別輸入額と順位、2016年~2020年) ………………………………… 11 ⑦Tuna: Japan’s Amount of Import (2016~2020) (日本のまぐろ輸入量の推移:2016年~2020年) ……………………………… 12 ⑧Bigeye Tunas (Fresh or Chilled): Top Six Exporters to Japan(2018~2020) (日本のめばちまぐろ(生鮮のもの)輸入先上位国、2018年~2020年) ……… 13 ⑨Yellowfin Tunas (Fresh or Chilled): Top Seven Exporters to Japan (2018~2020) (日本のきはだまぐろ(生鮮のもの)輸入先上位国、2018年~2020年) ……… 13 ⑩Stripbellied Bonito (Frozen): Top Five Exporters to Japan (2018~2020) (日本のかつお(冷凍のもの)輸入先上位国、2018年~2020年) ……………… 14 ⑪Vanilla Beans: Top Six Exporters to Japan (2017~2020) (日本のバニラビーンズ輸入先上位国:2017年~2020年) ……………………… 14 ⑫Coffee: Top Seven Exporters to Japan(2017~2020) (日本のコーヒー輸入先上位国:2017年~2020年) …………………………… 15 ⑬Squash: Top Seven Exporters to Japan (2017~2020) (日本のかぼちゃ輸入先上位国:2017年~2020年) …………………………… 15 ⑭Liquefied Natural Gas(LNG):Top Nine Exporters of to Japan (2017~2020) (日本の液化天然ガス(LNG)輸入先上位国:2017年~2020年) ………………… 16 ⑮Phosphate Rock : Top Six Exporters to Japan (2017~2020) (日本のリン鉱石輸入先上位国:2017年~2020年) …………………………… 16 ⑯Mineral Water : Top Seven Exporters to Japan (2017~2020) (日本の鉱水輸入先上位国:2017年~2020年) ………………………………… 17 ⑰Live Fish: Top Nine Exporters to Japan (2017~2020) (日本の生きた魚(観賞用)輸入先上位国:2017年~2020年) ………………… 17
2. Japan’s Trade with FIC Individual Country (2016~2020) (日本と太平洋島嶼国との国別貿易額:2016年~2020年) …………………… 18 ①Cook Islands (クック諸島) ………………………………………………………………………… 18 ⃝Japan’s Export (クック諸島への輸出) ……………………………………………………………… 18 ⃝Japan’s Import (クック諸島からの輸入) …………………………………………………………… 19 ②Federated States of Micronesia (ミクロネシア連邦) …………………………………………………………………20 ⃝Japan’s Export (ミクロネシア連邦への輸出) ………………………………………………………20 ⃝Japan’s Import (ミクロネシア連邦からの輸入) …………………………………………………… 21 ③Republic of Fiji (フィジー共和国) ……………………………………………………………………22 ⃝Japan’s Export (フィジーへの輸出) …………………………………………………………………22 ⃝Japan’s Import (フィジーからの輸入) ………………………………………………………………23 ④Republic of Kiribati (キリバス共和国) ……………………………………………………………………25 ⃝Japan’s Export (キリバスへの輸出) …………………………………………………………………25 ⃝Japan’s Import (キリバスからの輸入) ………………………………………………………………26
Contents(目次)

⑤Republic of the Marshall Islands (マーシャル諸島共和国) ……………………………………………………………27 ⃝Japan’s Export (マーシャル諸島への輸出) …………………………………………………………27 ⃝Japan’s Import (マーシャル諸島からの輸入) ………………………………………………………28 ⑥Republic of Nauru (ナウル共和国) ………………………………………………………………………29 ⃝Japan’s Export (ナウルへの輸出) ……………………………………………………………………29 ⃝Japan’s Import (ナウルからの輸入) …………………………………………………………………30 ⑦Niue (ニウエ) ……………………………………………………………………………… 31 ⃝Japan’s Export (ニウエへの輸出) …………………………………………………………………… 31 ⃝Japan’s Import (ニウエからの輸入) …………………………………………………………………32 ⑧Republic of Palau (パラオ共和国) ………………………………………………………………………33 ⃝Japan’s Export (パラオへの輸出) ……………………………………………………………………33 ⃝Japan’s Import (パラオからの輸入) …………………………………………………………………34 ⑨Independent State of Papua New Guinea (パプアニューギニア独立国) ………………………………………………………35 ⃝Japan’s Export (パプアニューギニアへの輸出) ……………………………………………………35 ⃝Japan’s Import (パプアニューギニアからの輸入) …………………………………………………36 ⑩Independent State of Samoa (サモア独立国) ………………………………………………………………………38 ⃝Japan’s Export (サモアへの輸出) ……………………………………………………………………38 ⃝Japan’s Import (サモアからの輸入) …………………………………………………………………39 ⑪Solomon Islands (ソロモン諸島) ………………………………………………………………………40 ⃝Japan’s Export (ソロモン諸島への輸出) ……………………………………………………………40 ⃝Japan’s Import (ソロモン諸島からの輸入) ………………………………………………………… 41 ⑫Kingdom of Tonga (トンガ王国) …………………………………………………………………………42 ⃝Japan’s Export (トンガへの輸出) ……………………………………………………………………42 ⃝Japan’s Import (トンガからの輸入) …………………………………………………………………43 ⑬Tuvalu (ツバル) ………………………………………………………………………………44 ⃝Japan’s Export (ツバルへの輸出) ……………………………………………………………………44 ⃝Japan’s Import (ツバルからの輸入) …………………………………………………………………45 ⑭Republic of Vanuatu (バヌアツ共和国) ……………………………………………………………………46 ⃝Japan’s Export (バヌアツへの輸出) …………………………………………………………………46 ⃝Japan’s Import (バヌアツからの輸入) ………………………………………………………………47
3. Japan’s Foreign Direct Investment to FICs(2016~2020) (日本の対太平洋島嶼各国への直接投資の推移:2016年~2020年) …………484. Visitors Arrivals from Japan to FICs (2009~2018) (国別日本人訪問客数:2009年~2018年) ………………………………………49

1. Overview of Japan's Trade with FICs (日本と対太平洋島嶼国との間の貿易)① Japan's Export to FICs by Commodities and Countries (2020) (日本の商品別国別輸出状況、2020 年)
(単位:千円)(Unit:1,000JPY)
Japan's Export to FICs (2020) 日本の FICs への輸出(2020) クック諸島 ミクロネシア
連邦 フィジー キリバス マーシャル諸島 ナウル ニウエ
Items 品目 Cook Is. FSM Fiji Kiribati Marshall Is. Nauru NiueFood and Live Animals 食料品及び動物 15,208 250,595 143,982 0 48,333 0 0Beverages and Tabacco 飲料及びたばこ 0 2,695 0 0 294 0 0Crude Materials 原材料 0 882 9,985 0 0 0 0Mineral Fuels 鉱物性燃料 0 6,775 432,970 0 17,766 0 0Animal & Vegetable Oil, Fat 動植物性油脂 0 1,151 0 0 0 0 0Chemicals 化学製品 0 21,183 233,477 429 67,240 0 0Manufactured Goods 原料別製品 0 152,364 398,456 34,271 383,104 2,001 3,443
Rubber Manufactured ゴム製品 29,327 26,624 3,170 129,110 2,180Wood & Cork Manufactured 木製品及びコルク製品 313Paper & Paper Manufactures 紙類及び同製品 7,298 219 441Textile Yarn, Fabrics 織物用糸及び繊維製品 40,125 23,820 2,653 15,080Non-Metallic Mineral Ware 非金属鉱物製品 357 343,437 249 7,357Iron and Steel Products 鉄鋼 4,345 12,447 293Nonferrous Metals 非鉄金属 278 1,120Manufactures of Metals 金属製品 70,321 4,356 28,199 217,549 1,708 1,263
Machinery, Transport Equipment 機械類及び輸送用機器 225,246 1,288,674 3,136,705 751,336 136,768,712 328,024 1,197,772Machinery 一般機械 28,461 559,348 380,192 57,956 2,783,435 17,580 5,359Electrical Machinery 電気機器 750 84,314 61,938 5,006 386,339 848 0Transport Equipment 輸送用機器 196,035 645,012 2,694,575 688,374 133,598,938 309,596 1,192,413・Railways Vehicles ・鉄道用車両 311・Motor Vehicles ・自動車 178,601 533,534 2,454,105 299,815 16,907 76,690 5,991・Parts of Motor Vehicles ・自動車の部分品 3,802 2,736 122,977 251・Cycles with Engines ・二輪自動車類 232 2,266 2,906・Bicycles and Parts Thereof ・自転車及び同部分品 554・Other Vehicles ・その他の車両 13,632 13,451 800 10,737・Aircraft ・航空機類 438 308・Ships and Boats ・船舶類 94,194 113,989 388,000 133,571,294 230,000 1,186,422
Miscellaneos Articles 雑製品 0 27,335 48,280 4,731 148,031 227 0Special Commodities (Re-Export Goods) 特殊取扱品 5,765 85,892 63,760 15,742 245,279 376 275Total(JPY) 合計(千円) 246,219 1,837,546 4,467,615 806,509 137,678,759 330,628 1,201,490
4

(単位:千円)(Unit:1,000JPY)
Japan's Export to FICs (2020) パラオ パプアニューギニア サモア ソロモン諸島 トンガ ツバル バヌアツ 合計 全体に占める
割合(%)Items Palau PNG Samoa Solomon Is. Tonga Tuvalu Vanuatu Total Share by Items (%)
Food and Live Animals 119,656 0 27,758 0 12,278 0 0 617,810 0.36%Beverages and Tabacco 5,178 0 0 0 0 0 0 8,167 0.00%Crude Materials 0 83,362 737 216 0 0 676 95,858 0.06%Mineral Fuels 199,404 0 0 297,643 0 12,003 408,742 1,375,303 0.80%Animal & Vegetable Oil, Fat 1,039 0 0 0 0 0 0 2,190 0.00%Chemicals 37,255 132,925 3,758 204 1,333 0 924 498,728 0.29%Manufactured Goods 141,540 2,587,154 34,619 139,106 4,267 607 5,463 3,886,395 2.26%
Rubber Manufactured 1,793 2,111,509 15,529 4,056 226 1,838 2,325,362 1.35%Wood & Cork Manufactured 1,313 4,015 427 6,068 0.00%Paper & Paper Manufactures 1,517 12,472 733 22,680 0.01%Textile Yarn, Fabrics 12,890 14,420 302 98,034 1,235 364 208,923 0.12%Non-Metallic Mineral Ware 19,272 309,463 416 420 341 681,312 0.40%Iron and Steel Products 4,496 12,021 27,744 1,286 62,632 0.04%Nonferrous Metals 945 2,343 0.00%Manufactures of Metals 99,314 123,254 18,372 8,119 3,032 381 1,207 577,075 0.34%
Machinery, Transport Equipment 756,999 13,341,402 1,270,070 931,421 666,625 2,743,563 522,986 163,929,535 95.200%Machinery 237,392 1,582,367 372,369 250,059 68,854 19,369 151,309 6,514,050 3.78%Electrical Machinery 62,955 252,214 76,217 22,322 263,248 8,954 75,772 1,300,877 0.76%Transport Equipment 456,652 11,506,821 821,484 659,040 334,523 2,715,240 295,905 156,114,608 90.66%・Railways Vehicles 311 0.00%・Motor Vehicles 424,461 11,163,947 804,896 657,779 334,523 9,108 294,097 17,254,454 10.02%・Parts of Motor Vehicles 1,334 311,557 5,179 1,808 449,644 0.26%・Cycles with Engines 17,768 1,261 24,433 0.01%・Bicycles and Parts Thereof 554 0.00%・Other Vehicles 1,633 1,708 11,409 53,370 0.03%・Aircraft 201 8,247 284 9,478 0.01%・Ships and Boats 29,023 4,224 2,705,848 138,322,994 80.33%
Miscellaneos Articles 61,509 352,673 89,154 24,648 19,706 444 104,035 880,773 0.51%Special Commodities (Re-Export Goods) 52,134 315,420 12,136 19,092 73,091 800 11,083 900,845 0.52%Total(JPY) 1,374,714 16,812,936 1,438,232 1,412,330 777,300 2,757,517 1,053,909 172,195,704 100%
(注) 「輸送機械」の輸出が最も多いが、主に中古車(建機含む)である。 マーシャル諸島への輸出が突出して多い理由としては「便宜置籍船」の輸出が挙げられる。「便宜置籍船」とは、税金対策や船員費コストの削減などの対策のため、便宜置籍船に対してさまざまな優遇税制を実施している国に便宜的に船籍を移すことである。
5

② Japan's Import from FICs by Commodities and Countries (2020) (日本の商品別国別輸入状況、2020 年)
(単位:千円)(Unit:1,000JPY)
Japan's Import from FICs (2020) 日本の FICs からの輸入統計 (2020) クック諸島 ミクロネシア
連邦 フィジー キリバス マーシャル諸島 ナウル ニウエ
Items 品目 Cook Is. FSM Fiji Kiribati Marshall Is. Nauru NiueFood and Live Animals 食料品及び動物 1,469,447 553,294 853,138 475,511 169,645 172,804 2,068
Live animals 生きた動物Meat and Maet Preparation 肉類及び同調製品Fish and Fish Preperation 魚介類及び同調製品 1,460,260 553,294 838,553 475,511 159,838 172,804Fruits and Vegetables 果実及び野菜 9,187 2,068Coffee, Tea, Cocoa & Spices コーヒー、茶、ココア、香辛料類 4,702Feeding-Stuff for Animals 飼料 9,883 9,807
Beverages and Tabacco 飲料およびたばこ 0 0 172,058 0 0 0 0Crude Materials 原材料 0 0 30,606 0 1,047 0 0
Hide, Skins and Fur Skins 原皮及び毛皮(未仕上)Wood, Lumber and Cork 木材及びコルク 24,397Crude Minerals 粗鉱物Metalliferous and Scrap 金属鉱及びくず 1,047Crude Animals & Vegetable その他の動植物性原材料 6,209
Mineral Fuels 鉱物性燃料 0 0 0 0 0 0 0Oil & Related Products 石油、同製品Gas, Natural & Manufactured 天然ガス及び製造ガス
Animal & Vegetable Oil, Fat 動植物性油脂 0 0 18,148 0 0 0 0Chemicals 化学製品 759 0 0 0 0 0 0Manufactured Goods 原料別製品 0 0 2,216,376 0 0 0 1,316
Wood & Cork Manufactured 木製品及びコルク製品(除家具) 2,212,070Textile Yarn, Fabrics 織物用糸及び繊維製品 4,306Non-Metallic Mineral Ware 非金属鉱物製品Manufactures of Metals 金属製品 1,316
Machinery, Transport Equipment 機械類及び輸送用機器 649 0 0 0 528,048 0 378Miscellaneous Articles 雑製品 0 0 420 0 0 0 0Special Commodities (Re-Import Goods etc) 特殊取扱品 0 0 4,336 0 0 0 0Total 総額 1,470,855 553,294 3,295,082 475,511 698,740 172,804 3,762
6

(単位:千円)(Unit:1,000JPY)
Japan's Import from FICs (2020) パラオ パプアニューギニア サモア ソロモン諸島 トンガ ツバル バヌアツ 合計 全体に占める
割合(%)
Items Palau PNG Samoa Solomon Is. Tonga Tuvalu Vanuatu Total Share by Items (%)Food and Live Animals 0 814,480 19,007 61,458 59,715 60,788 4,482,844 9,194,199 3.90%
Live animals 2,675 2,675 0.00%Meat and Maet Preparation 6,172 50,090 56,262 0.02%Fish and Fish Preperation 275,815 58,783 34,521 60,788 4,431,908 8,522,075 3.62%Fruits and Vegetables 19,007 25,194 55,456 0.02%Coffee, Tea, Cocoa & Spices 398,953 846 404,501 0.17%Feeding-Stuff for Animals 133,540 153,230 0.07%
Beverages and Tabacco 0 0 0 0 0 0 0 172,058 0.07%Crude Materials 1,077 58,154,285 0 0 0 0 211 58,187,226 24.70%
Hide, Skins and Fur Skins 147,912 147,912 0.06%Wood, Lumber and Cork 1,498,627 1,523,024 0.65%Crude Minerals 1,077 1,077 0.000%Metalliferous and Scrap 56,480,487 56,481,534 23.98%Crude Animals & Vegetable 27,259 211 33,679 0.01%
Mineral Fuels 0 164,712,700 0 0 0 0 0 164,712,700 69.92%Oil & Related Products 13,344,453 13,344,453 5.66%Gas, Natural & Manufactured 151,368,247 151,368,247 64.25%
Animal & Vegetable Oil, Fat 0 0 0 0 0 0 18,148 0.01%Chemicals 0 0 0 0 0 0 0 759 0.00%Manufactured Goods 348 0 0 0 0 0 0 2,218,040 0.94%
Leather, Dressed Fur Skins 2,212,070 0.94%Textile Yarn, Fabrics 4,306 0.00%Non-Metallic Mineral Ware 348 348 0.00%Manufactures of Metals 1,316 0.00%
Machinery, Transport Equipment 398,391 0 222 0 0 0 0 927,688 0.39%Miscellaneous Articles 1,385 19,885 0 971 0 0 0 22,661 0.01%Special Commodities (Re-Import Goods etc) 91,877 2,042 25,872 0 0 0 0 124,127 0.05%Total 493,078 223,703,392 45,101 62,429 59,715 60,788 4,483,055 235,577,606 100%
(注)パプアニューギニアからの鉱物性燃料(石油・天然ガス)および金属資源(銅・銀・アルミニウム)の輸入が突出して多く、太平洋島嶼国全体からの輸入の 90%以上を占めている。
7

③ Japan's Trade with FICs from 2011 ~ 2020 (日本と太平洋島嶼国との間の貿易の推移、2011 年~ 2020 年)
(JPY1,000)
Year年
Export 日本からの輸出 Import 日本への輸入 Balance 収支
Total 総額World 全世界
To FICs 対 FICs(Share シェア)
Total 総額World 全世界
To FICs 対 FICs(Share シェア)
Total 総額World 全世界 To FICs 対 FICs
2011 65,546,474,948 189,661,690 0.289% 68,111,187,178 91,878,325 0.135% -2,564,712,230 97,783,365 2012 63,747,572,215 192,565,874 0.302% 70,688,631,840 124,210,923 0.176% -6,941,059,625 68,354,951 2013 69,774,192,950 143,576,292 0.206% 81,242,545,171 99,532,025 0.123% -11,468,352,221 44,044,267 2014 73,093,028,311 166,908,141 0.228% 85,909,112,733 282,560,293 0.329% -12,816,084,422 -115,652,152 2015 75,613,928,862 246,112,995 0.325% 78,405,535,793 348,564,316 0.445% -2,791,606,931 -102,451,321 2016 70,035,770,383 206,068,795 0.294% 66,041,973,885 238,029,758 0.360% 3,993,796,498 -31,960,963 2017 78,286,457,048 194,712,794 0.249% 75,379,231,107 296,060,551 0.393% 2,907,225,941 -101,347,757 2018 81,478,752,674 188,516,863 0.231% 82,703,304,395 277,741,256 0.336% -1,224,551,721 -89,224,393 2019 76,931,664,915 180,781,493 0.235% 78,599,509,951 304,993,086 0.388% -1,667,845,036 -124,211,593 2020 68,400,482,577 172,195,604 0.252% 67,837,102,063 235,577,606 0.347% 563,380,514 -63,382,002
Total 総額 722,908,324,883 1,881,100,541 0.260% 754,918,134,116 2,299,148,139 0.305% -32,009,809,233 -418,047,598
日本のFICsからの輸入(Japan's Import from FICs)
日本のFICsへの輸出(Japan's Export to FICs)
0
50,000,000
100,000,000
150,000,000
200,000,000
250,000,000
300,000,000
350,000,000
400,000,000
20202011 2012 2013 2014 2015 2016 2017 2018 2019
(JPY1000)
8
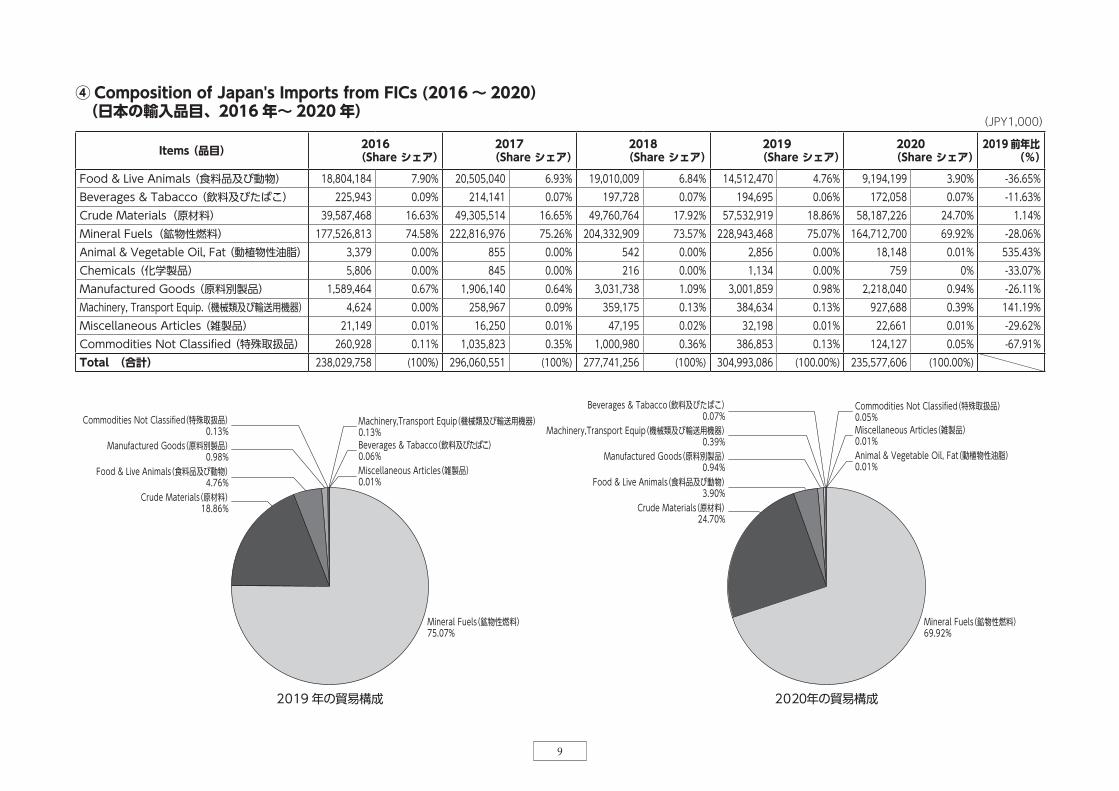
④ Composition of Japan's Imports from FICs (2016 ~ 2020) (日本の輸入品目、2016 年~ 2020 年)
(JPY1,000)
Items (品目) 2016(Share シェア)
2017(Share シェア)
2018(Share シェア)
2019(Share シェア)
2020(Share シェア)
2019 前年比(%)
Food & Live Animals (食料品及び動物) 18,804,184 7.90% 20,505,040 6.93% 19,010,009 6.84% 14,512,470 4.76% 9,194,199 3.90% -36.65%Beverages & Tabacco (飲料及びたばこ) 225,943 0.09% 214,141 0.07% 197,728 0.07% 194,695 0.06% 172,058 0.07% -11.63%Crude Materials(原材料) 39,587,468 16.63% 49,305,514 16.65% 49,760,764 17.92% 57,532,919 18.86% 58,187,226 24.70% 1.14%Mineral Fuels(鉱物性燃料) 177,526,813 74.58% 222,816,976 75.26% 204,332,909 73.57% 228,943,468 75.07% 164,712,700 69.92% -28.06%Animal & Vegetable Oil, Fat (動植物性油脂) 3,379 0.00% 855 0.00% 542 0.00% 2,856 0.00% 18,148 0.01% 535.43%Chemicals (化学製品) 5,806 0.00% 845 0.00% 216 0.00% 1,134 0.00% 759 0% -33.07%Manufactured Goods (原料別製品) 1,589,464 0.67% 1,906,140 0.64% 3,031,738 1.09% 3,001,859 0.98% 2,218,040 0.94% -26.11%Machinery, Transport Equip. (機械類及び輸送用機器) 4,624 0.00% 258,967 0.09% 359,175 0.13% 384,634 0.13% 927,688 0.39% 141.19%Miscellaneous Articles (雑製品) 21,149 0.01% 16,250 0.01% 47,195 0.02% 32,198 0.01% 22,661 0.01% -29.62%Commodities Not Classified (特殊取扱品) 260,928 0.11% 1,035,823 0.35% 1,000,980 0.36% 386,853 0.13% 124,127 0.05% -67.91%Total (合計) 238,029,758 (100%) 296,060,551 (100%) 277,741,256 (100%) 304,993,086 (100.00%) 235,577,606 (100.00%)
2020年の貿易構成
Miscellaneous Articles(雑製品)0.01%
Commodities Not Classified(特殊取扱品)0.05%
Mineral Fuels(鉱物性燃料)69.92%
Animal & Vegetable Oil, Fat(動植物性油脂)0.01%
Beverages & Tabacco(飲料及びたばこ)0.07%
Crude Materials(原材料)24.70%
Manufactured Goods(原料別製品)0.94%
Food & Live Animals(食料品及び動物)3.90%
Machinery,Transport Equip(機械類及び輸送用機器)0.39%
2019年の貿易構成
Crude Materials(原材料)18.86%
Manufactured Goods(原料別製品)0.98%
Food & Live Animals(食料品及び動物)4.76%
Beverages & Tabacco(飲料及びたばこ)0.06%
Machinery,Transport Equip(機械類及び輸送用機器)0.13%
Mineral Fuels(鉱物性燃料)75.07%
Miscellaneous Articles(雑製品)0.01%
Commodities Not Classified(特殊取扱品)0.13%
9

2016 2017 2018 2019 2020EX 輸出額 Rank 順位 EX 輸出額 Rank 順位 EX 輸出額 Rank 順位 EX 輸出額 Rank 順位 EX 輸出額 Rank 順位
Cook Is. クック諸島 625,566 11 399,933 13 340,911 12 284,860 13 246,219 14 FSM ミクロネシア連邦 1,332,958 10 3,045,840 6 2,094,659 5 1,957,978 6 1,837,546 5 Fiji フィジー 12,398,155 3 8,143,077 3 10,603,427 3 8,349,698 3 4,467,615 3 Kiribati キリバス 1,972,879 7 1,334,040 10 688,382 11 538,590 12 806,509 11 Marshall Is. マーシャル諸島 158,501,523 1 148,639,432 1 147,967,402 1 143,390,789 1 137,678,759 1 Nauru ナウル 222,872 14 35,727 14 220,630 14 284,469 14 330,628 13 Niue ニウエ 600,015 12 876,117 11 276,042 13 640,310 11 1,201,490 9 Palau パラオ 3,031,076 5 3,239,082 5 1,664,912 7 2,010,416 5 1,374,714 8 PNG パプアニューギニア 17,422,048 2 19,358,892 2 16,334,307 2 15,892,648 2 16,812,936 2 Samoa サモア 1,613,611 9 1,469,055 9 1,507,645 8 1,374,840 9 1,438,232 6 Solomon Is. ソロモン諸島 2,291,528 6 1,768,614 8 1,881,445 6 1,520,725 7 1,412,330 7 Tonga トンガ 561,824 13 707,828 12 1,500,794 9 1,388,596 8 777,300 12 Tuvalu ツバル 1,713,187 8 2,119,615 7 2,227,425 4 2,183,690 4 2,757,417 4 Vanuatu バヌアツ 3,781,553 4 3,575,542 4 1,208,882 10 963,884 10 1,053,909 10
Total 合計 206,068,795 194,712,794 188,516,863 180,781,493 172,195,604
(注)1,000 円以下の数字は四捨五入にて計上した。(注)マーシャル諸島の数値には、「便宜置籍船」のため輸出された船舶が大半を占めることに注意する。
⑤ Ranking of FIC Importers of Japanese Goods (2016 ~ 2020) (日本の国別輸出額と順位、2016 年~ 2020 年)
(JPY1,000)
10

⑥ Ranking of FIC Exporters to Japan (2016 ~ 2020) (日本の国別輸入額と順位、2016 年~ 2020 年)
2016 2017 2018 2019 2020IM 輸入額 Rank 順位 IM 輸入額 Rank 順位 IM 輸入額 Rank 順位 IM 輸入額 Rank 順位 IM 輸入額 Rank 順位
Cook Is. クック諸島 1,484,509 5 1,951,621 5 1,638,058 6 1,280,894 6 1,470,855 4FSM ミクロネシア連邦 659,164 8 798,890 8 2,024,039 5 1,505,495 5 553,294 6Fiji フィジー 4,098,142 3 4,788,685 3 4,496,606 3 4,614,628 3 3,295,082 3Kiribati キリバス 794,861 7 1,091,911 7 928,745 7 873,732 7 475,511 8Marshall Is. マーシャル諸島 1,030,361 6 1,450,777 6 457,357 10 467,087 8 698,740 5Nauru ナウル 500,553 10 719,339 9 278,211 11 268,841 10 172,804 9Niue ニウエ 1,970 14 6,117 14 837,636 8 4,878 14 3,762 14Palau パラオ 1,722,834 4 2,412,525 4 2,504,617 4 1,837,138 4 493,078 7PNG パプアニューギニア 218,771,863 1 273,937,226 1 255,980,732 1 287,266,608 1 223,703,392 1Samoa サモア 94,896 13 58,983 13 66,787 14 228,483 11 45,101 13Solomon Is. ソロモン諸島 562,236 9 592,925 10 676,586 9 338,584 9 62,429 10Tonga トンガ 308,888 11 277,016 11 172,770 13 157,869 12 59,715 12Tuvalu ツバル 222,831 12 231,762 12 247,115 12 114,779 13 60,788 11Vanuatu バヌアツ 7,776,650 2 7,742,774 2 7,431,997 2 6,034,070 2 4,483,055 2
Total 合計 238,029,758 296,060,551 277,741,256 304,993,086 235,577,606
(注)1,000 円以下の数字は四捨五入にて計上した。
(JPY1,000)
11

クック諸島 ミクロネシア連邦 フィジー キリバス マーシャル諸島 ナウル ニウエ パラオ パプアニューギニア サモア ソロモン諸島 トンガ ツバル バヌアツ 合計Cook Is. FSM Fiji Kiribati Marshall Is. Nauru Niue Palau PNG Samoa Solomon Is. Tonga Tuvalu Vanuatu Total
びんながまぐろ(生鮮・冷蔵)
Albacore or Longfinned Tunas, Fresh or Chilled
2016 4,222 4,222 2017 427 427 2018 485 485 2019 1,917 1,917 2020 2,295 2,295
きはだまぐろ(生鮮・冷蔵)
Yellowfin Tunas, Fresh or Chilled
2016 9,442 52,684 68,872 908,559 127,103 29,180 153 110,187 1,306,180 2017 23,742 9,468 88,505 1,086,335 402,506 14,586 121,877 1,747,019 2018 3,759 2,994 1,910 42,261 1,169,954 5,265 5,444 61,934 1,293,521 2019 109,556 9,788 79,398 909,686 4,223 48,706 1,161,357 2020 28,084 8,600 15,608 24,896 77,188
めばちまぐろ(生鮮・冷蔵)Bigeye Tunas,
Fresh or Chilled
2016 6,513 18,374 181,923 773,758 14,569 49,478 195 9,822 1,054,632 2017 13,813 1,846 5,233 98,310 918,342 10,327 15,551 6,133 1,069,555 2018 3,284 7,826 1,009 64,359 668,495 398 2,526 7,279 755,176 2019 149,425 2,686 144,740 484,960 3,576 785,387 2020 61,490 2,739 51,233 473 115,935
くろまぐろ(生鮮・冷蔵)Bluefin Tunas,
Fresh or chilled
2016 744 744 2017 181 181 2018 413 222 222 857 2019 0 2020 0
びんながまぐろ(冷凍)
Albacore or Longfinned Tunas, Frozen
2016 84,583 83,378 3,899,879 4,067,840 2017 262,124 156,319 4,846,449 5,264,892 2018 2,163 117,608 131,997 3,537,338 3,789,106 2019 100,309 2,663 56,187 2,304,775 2,463,934 2020 127,986 58,790 1,695,802 1,882,578
きはだまぐろ(冷凍)
Yellowfin Tunas, Frozen
2016 37,381 910,318 1,657,734 1,683,595 945,200 1,794,381 1,265,971 155,136 1,967,092 10,416,808 2017 116,153 1,055,879 1,861,865 913,607 634,130 4,991 1,192,459 1,029,987 152,894 1,189,811 8,151,776 2018 111,201 1,984,077 832,132 1,558,289 480,685 1,368,039 887,471 345,474 1,963,496 9,530,864 2019 162,934 1,061,483 956,257 1,007,083 584,440 826,650 569,923 160,890 1,659,713 6,989,373 2020 144,537 505,608 717,147 871,112 384,338 815,666 61,364 123,231 58,179 1,833,942 5,515,124
めばちまぐろ(冷凍)
Bigeye Tunas, Frozen
2016 3,837 68,154 650,102 131,808 24,900 188,817 6,406,251 6,686,151 2017 44,150 238,975 519,920 304,681 54,920 94,280 4,916,768 7,473,869 2018 26,247 430,192 344,496 8,439 172,213 75,317 4,761,991 6,173,694 2019 42,696 212,395 252,454 18,300 128,023 50,399 4,283,613 5,818,895 2020 47,050 157,101 246,415 14,642 29,546 3,895,163 4,389,917
合計 Total 798,077 6,985,720 8,849,582 6,483,847 3,962,344 815,666 0 6,925,080 5,809,947 116,765 4,191,809 395,105 1,797,603 49,162,083
(注)①当該データ(輸入実績)がない年度は空白で表示している。(When there is no import, indicated as blank.)② 減少傾向にあるもの( shows decreasing trend.) ③ 増加傾向にあるもの( shows increasing trend.)
⑦ Tuna: Amount of Japan's Import (2016 ~ 2020) (日本のまぐろ輸入量の推移、2016 ~ 2020)
(単位 Unit:KG)
12

世界World
インドネシアIndonesia
オーストラリアAustralia
南アフリカSouth Africa
ニュージーランドNZ
ミクロネシア連邦FSM
マーシャル諸島Marshall Is
パラオPalau
2018 年
順位(Ranking) 1 4 3 5 15 6 21000 円 3,748,363 2,032,973 238,185 266,803 152,280 8,835 65,418 763,799 KG 3,259,762 1,966,507 144,925 136,448 79,202 7,826 64,359 668,495 単価(Unit Price/KG) ¥1,150 ¥1,034 ¥1,574 ¥1,906 ¥1,923 ¥1,129 ¥1,016 ¥1,143
2019 年
順位(Ranking) 1 4 3 7 6 5 21000 円 3,119,441 1,588,700 162,800 288,365 80,228 133,960 145,325 512,381 KG 2,854,275 1,573,685 115,732 157,654 36,150 149,425 144,740 484,960 単価(Unit Price/KG) ¥1,093 ¥1,010 ¥1,407 ¥1,829 ¥2,219 ¥897 ¥1,004 ¥1,057
2020 年
順位(Ranking) 1 2 3 4 5 6なし
None1000 円 2,261,801 1,771,357 123,466 102,696 68,640 58,754 54,630 KG 2,314,740 1,933,448 91,234 62,082 39,353 61,490 51,233 単価(Unit Price/KG) ¥977 ¥916 ¥1,353 ¥1,654 ¥1,744 ¥956 ¥1,066
世界World
インドネシアIndonesia
台湾Taiwan
オーストラリアAustralia
ニューカレドニア(仏)New Caledonia
スリランカSri Lanka
トンガTonga
ミクロネシア連邦FSM
マーシャル諸島Marshall Is.
パラオPalau
2018 年
順位(Ranking) 2 3 4 6 5 8 18 9 11000 円 3,600,055 1,016,112 454,752 163,158 145,031 157,273 74,247 3,315 44,884 1,349,463KG 3,322,843 1,015,298 414,989 111,968 143,409 172,976 61,934 2,994 42,261 1,169,954 単価(Unit Price/KG) ¥1,083 ¥1,001 ¥1,096 ¥1,457 ¥1,011 ¥909 ¥1,199 ¥1,107 ¥1,062 ¥1,153
2019 年
順位(Ranking) 2 3 4 5 6 10 7 9 11000 円 2,990,299 735,509 349,444 289,978 184,353 109,771 50,669 93,139 70,741 941,553KG 3,008,727 740,982 352,166 252,939 213,713 128,836 48,706 109,556 79,398 909,686 単価(Unit Price/KG) ¥994 ¥993 ¥992 ¥1,146 ¥863 ¥852 ¥1,040 ¥850 ¥891 ¥1,035
2020 年
順位(Ranking) 1 2 3 4 5 6 7 10なし
None1000 円 1,778,488 825,408 338,237 233,296 128,433 118,820 27,026 25,039 14,680KG 1,880,180 889,392 378,668 199,431 133,078 138,958 24,896 28,084 15,608単価(Unit Price/KG) ¥946 ¥928 ¥893 ¥1,170 ¥965 ¥855 ¥1,086 ¥892 ¥941
⑧ Bigeye Tunas (Fresh or Chilled) : Top Six Exporters to Japan (2018 ~ 2020) (日本のめばちまぐろ(生鮮のもの)輸入先上位国、2018 年~ 2020 年)
⑨ Yellowfin Tunas (Fresh or Chilled) : Top Seven Exporters to Japan (2018 ~ 2020) (日本のきはだまぐろ(生鮮のもの)輸入先上位国、2018 年~ 2020 年)
13

世界World
インドネシアIndonesia
ミクロネシア連邦FSM
ベリーズBelize
中国China
韓国South Korea
ソロモン諸島Solomon Is.
マーシャル諸島Marshall Is.
2018 年
順位(Ranking) 1 2 3 11 7 16 61000 円 5,161,039 3,727,147 364,000 324,672 27,876 62,657 4,671 79,659KG 32,169,298 21,621,056 2,522,730 2,487,000 167,895 344,164 38,930 628,370単価(Unit Price/KG) ¥160 ¥172 ¥144 ¥131 ¥166 ¥182 ¥120 ¥127
2019 年
順位(Ranking) 1 2 3 6 5 7 161000 円 5,354,727 4,701,275 252,458 143,931 27,587 30,658 23,259 3,282KG 36,341,380 31,751,563 1,674,570 1,055,120 174,105 247,038 143,699 23,640単価(Unit Price/KG) ¥147 ¥148 ¥151 ¥136 ¥158 ¥124 ¥162 ¥139
2020 年
順位(Ranking) 1 2 3 4 5 12なし
None1000 円 4,254,854 3,462,872 185,891 182,960 126,711 62,982 8,472KG 29,882,467 24,168,571 1,280,450 1,370,200 907,917 319,616 72,210単価(Unit Price/KG) ¥142 ¥143 ¥145 ¥134 ¥140 ¥197 ¥117
世界World
マダガスカルMadagascar
パプアニューギニアPNG
米国USA
仏領ポリネシアFrench Polynesia
インドネシアIndonesia
フランスFrance
ウガンダUganda
2017 年
順位(Ranking) 1 7 2 4 3 6 51000 円 3,869,567 3,565,546 13,143 168,344 26,712 48,301 13,693 14,626KG 64,419 59,509 600 1,725 339 810 368 320単価(Unit Price/KG) ¥60,069 ¥59,916 ¥21,905 ¥97,591 ¥78,796 ¥59,631 ¥37,209 ¥45,706
2018 年
順位(Ranking) 1 6 13 4 7 5 31000 円 4115364 3,890,610 11,251 2,157 30,179 5,991 15,231 44,110KG 64266 60,593 599 88 371 116 220 765単価(Unit Price/KG) ¥64,036 ¥64,209 ¥18,783 ¥24,511 ¥81,345 ¥51,647 ¥69,232 ¥57,660
2019 年
順位(Ranking) 1 2なし
None
4 6 5 31000 円 2816771 2,704,583 33,566 20,105 9,617 10,554 30,102KG 53532 51,209 983 302 152 122 626単価(Unit Price/KG) ¥52,618 ¥52,815 ¥34,146 ¥66,573 ¥63,270 ¥86,508 ¥48,086
2020 年
順位(Ranking) 1 2 3 4 5 6なし
None1000 円 1,556,123 1,461,288 22,186 20,825 15,137 14,245 5,167KG 36,884 34,198 925 525 222 531 105単価(Unit Price/KG) ¥42,190 ¥42,730 ¥23,985 ¥39,667 ¥68,185 ¥26,827 ¥49,210
⑩ Stripbellied Bonito (Frozen) : Top Five Exporters to Japan (2018 ~ 2020) (日本のかつお(冷凍のもの)輸入先上位国、2018 年~ 2020 年)
⑪ Vanilla Beans: Top Six Exporters to Japan (2017 ~ 2020) (日本のバニラビーンズ輸入先上位国、2017 年~ 2020 年)
14

世界World
ブラジルBrazil
コロンビアColombia
ベトナムVietnam
グアテマラGuatemala
エチオピアEthiopia
インドネシアIndonesia
タンザニアTanzania
パプアニューギニアPNG
2017 年
順位(Ranking) 1 2 3 4 5 6 7 181000 円 147,837,385 42,479,184 29,921,299 22,213,471 13,805,068 10,428,639 10,256,400 3,370,099 653,383KG 403,954,472 117,236,733 71,338,838 88,081,201 29,994,701 27481511 31,654,878 8,326,398 1,521,501単価(Unit Price/KG) ¥366 ¥362 ¥419 ¥252 ¥460 ¥379 ¥324 ¥405 ¥429
2018 年
順位(Ranking) 1 2 3 5 6 4 7 191000 円 126,569,824 35,479,175 22,854,130 20,552,045 9,524,671 9,000,917 9,696,931 5,371,704 213,105KG 399,041,742 111,452,987 63,269,734 98,188,365 24,072,385 26573940 30,344,490 15,475,132 486,133単価(Unit Price/KG) ¥317 ¥318 ¥361 ¥209 ¥396 ¥339 ¥320 ¥347 ¥438
2019 年
順位(Ranking) 1 2 3 5 4 6 7 191000 円 124,215,366 42,916,500 20,568,491 15,390,488 10,321,981 10,657,721 7,952,312 4,691,705 314,546KG 434,379,138 154,944,677 61,742,307 86,706,828 29,154,796 34423301 25,321,658 15,552,143 922,326単価(Unit Price/KG) ¥286 ¥277 ¥333 ¥178 ¥354 ¥310 ¥314 ¥302 ¥341
2020 年
順位(Ranking) 1 2 3 4 5 6 7 181000 円 112,296,888 32,179,914 22,173,787 17,514,568 10,461,929 7,936,188 6,257,848 3,439,609 371,686KG 389,582,519 116,209,811 59,622,846 100,157,156 26,683,101 24,796,671 23,416,922 11,231,491 1,015,384単価(Unit Price/KG) ¥288 ¥277 ¥372 ¥175 ¥392 ¥320 ¥267 ¥306 ¥366
世界World
ニュージーランドNew Zealand
メキシコMexico
韓国South Korea
ニューカレドニア(仏)New Caledonia
米国USA
オーストラリアAustralia
トンガTonga
2017 年
順位(Ranking) 2 1 4 3 5 7 61000 円 9,217,387 4,037,476 4,768,300 157,113 210,689 27,209 2,372 14,228KG 96,057,952 47,283,655 43,967,569 1,470,402 3,054,600 127,778 10,368 143,580単価(Unit Price/KG) ¥95.96 ¥85.39 ¥108.45 ¥106.85 ¥68.97 ¥212.94 ¥228.78 ¥99.09
2018 年
順位(Ranking) 2 1 3 4 6 7 51000 円 8,700,386 3,726,994 4,442,606 265,483 158,770 31,587 6,805 66,419KG 103,170,356 54,081,860 43,363,301 2,471,820 2,315,830 115,225 58,200 747,520単価(Unit Price/KG) ¥84.33 ¥68.91 ¥102.45 ¥107.40 ¥68.56 ¥274.13 ¥116.92 ¥88.85
2019 年
順位(Ranking) 2 1 3 4 7 5 61000 円 8,247,660 3,827,710 4,038,376 150,201 149,964 18,407 34,630 27,873KG 96,030,072 53,097,500 38,446,131 1,727,070 2,064,040 77,353 293,150 324,000単価(Unit Price/KG) ¥85.89 ¥72.09 ¥105.04 ¥86.97 ¥72.66 ¥237.96 ¥118.13 ¥86.03
2020 年
順位(Ranking) 1 2 3 4 5 6 71000 円 7,904,831 4,354,874 3,133,446 216,287 152,422 21,583 21,435 4,784KG 91,410,236 58,549,235 29,134,549 2,076,483 1,367,000 63,309 171,860 47,800単価(Unit Price/KG) ¥86.48 ¥74.38 ¥107.55 ¥104.16 ¥111.50 ¥340.92 ¥124.72 ¥100.08
⑫ Coffee: Top Seven Exporters to Japan (2017 ~ 2020) (日本のコーヒー輸入先上位国、2017 年~ 2020 年)
⑬ Squash : Top Seven Exporters to Japan (2017 ~ 2020) (日本のかぼちゃ輸入先上位国、2017 年~ 2020 年)
15

世界World
オーストラリアAustralia
マレーシアMalaysia
カタールQatar
ロシアRussia
米国USA
ブルネイBrunei
パプアニューギニアPNG
オマーンOman
インドネシアIndonesia
2017 年
順位(Ranking) 1 2 3 5 11 8 7 9 41000 円 3,917,267,800 1,218,825,803 680,714,866 447,659,007 311,546,460 63,828,555 185,628,251 206,612,194 132,713,985 317,849,1671000KG 83,631,844 25,674,726 14,805,583 10,134,237 7,261,885 954,438 3,732,556 4,233,824 2,774,579 6,514,550単価(Unit Price/KG) ¥46.84 ¥47.47 ¥45.98 ¥44.17 ¥42.90 ¥66.88 ¥49.73 ¥48.80 ¥47.83 ¥48.79
2018 年
順位(Ranking) 1 2 3 4 10 7 8 9 61000 円 4,738,938,853 1,677,796,188 610,577,314 569,627,123 358,032,241 151,661,374 249,838,668 190,203,941 160,140,938 294,873,4191000KG 82,852,169 28,702,344 11,265,533 9,922,935 6,673,244 2,494,095 4,182,266 3,143,896 3,075,790 5,132,676単価(Unit Price/KG) ¥57.20 ¥58.46 ¥54.20 ¥57.41 ¥53.65 ¥60.81 ¥59.74 ¥60.50 ¥52.06 ¥57.45
2019 年
順位(Ranking) 1 3 2 4 8 5 7 9 61000 円 4,349,779,154 1,756,177,031 492,022,088 510,420,743 337,528,306 196,835,711 248,174,455 216,672,924 144,333,845 243,067,4151000KG 77,327,079 30,116,008 9,330,527 8,734,971 6,398,638 3,695,647 4,320,630 3,741,745 2,894,035 4,153,037単価(Unit Price/KG) ¥56.25 ¥58.31 ¥52.73 ¥58.43 ¥52.75 ¥53.26 ¥57.44 ¥57.91 ¥49.87 ¥58.53
2020 年
順位(Ranking) 1 2 3 4 5 6 7 8 91000 円 3,208,948,326 1,290,253,011 421,454,451 361,369,268 251,263,426 223,909,044 169,765,854 151,368,247 113,544,658 97,523,0641000KG 74,463,881 29,102,733 10,594,480 8,734,427 6,140,408 4,721,717 3,961,673 3,419,367 2,449,706 2,226,411単価(Unit Price/KG) ¥43.09 ¥44.33 ¥39.78 ¥41.37 ¥40.92 ¥47.42 ¥42.85 ¥44.27 ¥46.35 ¥43.80
世界World
中国China
南アフリカSouth Africa
ヨルダンJordan
モロッコMorocco
ベトナムVietnam
イスラエルIsrael
ナウルNauru
西サハラWestern Sahara
2017 年
順位(Ranking) 1 2 5 4 6 7 3なし
None1000 円 5,285,857 1,463,637 1,448,540 591,733 688,564 231,697 140,290 718,8391000KG 253,029 66,593 63,006 38,550 36,293 10,500 8,600 29,427単価(Unit Price/KG) ¥20.89 ¥21.98 ¥22.99 ¥15.35 ¥18.97 ¥22.07 ¥16.31 ¥24.43
2018 年
順位(Ranking) 2 1 3 4 6 7 5なし
None1000 円 4,472,248 1,459,716 1,508,121 612,902 336,830 199,137 79,062 276,4801000KG 209,201 63,822 68,499 35,000 17,000 10,075 4,805 10,000単価(Unit Price/KG) ¥21.38 ¥22.87 ¥22.02 ¥17.51 ¥19.81 ¥19.77 ¥16.45 ¥27.65
2019 年
順位(Ranking) 2 1 4 3 7 8 5 61000 円 4,280,815 1,058,077 1,580,428 394,626 400,579 205,579 147,690 263,565 230,2711000KG 194,144 48,005 65,349 21,200 20,300 10,500 8,490 10,000 10,300単価(Unit Price/KG) ¥22.05 ¥22.04 ¥24.18 ¥18.61 ¥19.73 ¥19.58 ¥17.40 ¥26.36 ¥22.36
2020 年
順位(Ranking) 1 2 3 4 5 6なし
Noneなし
None1000 円 3,145,403 837,658 777,026 491,938 489,864 331,485 217,4321000KG 151,477 38,624 31,500 24,400 26,192 17,480 13,281単価(Unit Price/KG) ¥20.76 ¥21.69 ¥24.67 ¥20.16 ¥18.70 ¥18.96 ¥16.37
⑭ Liquefied Natural Gas (LNG): Top Nine Exporters to Japan (2017 ~ 2020) (液化天然ガス(LNG)輸入先上位国、2017 年~ 2020 年)
⑮ Phosphate Rock: Top Six Exporters to Japan (2017 ~ 2020) (日本のリン鉱石輸入先上位国、2017 年~ 2020 年)
16

世界World
インドネシアIndonesia
米国USA
フィリピンPhilipine
スリランカSri Lanka
台湾Taiwan
オーストラリアAustralia
ケニアKenya
ハイチHaiti
マーシャル諸島Marshall Is.
キリバスKiribati
2017 年
順位(Ranking) 2 3 1 8 12 4 7 13 5 91000 円 293,002 59,279 55,252 59,382 6,764 3,315 42,341 8,524 3,232 11,013 6,591KG 34,599 7,262 3,233 14,848 928 360 3,893 709 164 338 602単価(Unit Price/KG) ¥8,469 ¥8,163 ¥17,090 ¥3,999 ¥7,289 ¥9,208 ¥10,876 ¥12,023 ¥19,707 ¥32,583 ¥10,949
2018 年
順位(Ranking) 1 3 2 6 15 4 13 11 5 71000 円 269,346 68,925 44,768 47,511 11,798 1,588 43,414 3,021 3,191 12,049 6,278KG 32,272 8,962 2,995 15,187 1,270 46 876 177 166 521 440単価(Unit Price/KG) ¥8,346 ¥7,691 ¥14,948 ¥3,128 ¥9,290 ¥34,522 ¥49,559 ¥17,068 ¥19,223 ¥23,127 ¥14,268
2019 年
順位(Ranking) 1 2 3 7 6 4 16 11 5 81000 円 241,421 68,035 60,231 36,934 6,027 6,337 17,176 2,055 3,461 7,317 5,713KG 25,321 8,434 5,112 6,681 613 761 257 124 222 308 644単価(Unit Price/KG) ¥9,534 ¥8,067 ¥11,782 ¥5,528 ¥9,832 ¥8,327 ¥66,833 ¥16,573 ¥15,590 ¥23,756 ¥8,871
2020 年
順位(Ranking) 1 2 3 4 5 6 7 8 9 111000 円 258,421 108,127 44,320 43,656 9,544 8,459 8,099 7,425 3,947 3,528 2,283KG 38,996 24,280 2,942 7,120 1,430 878 185 596 209 145 261単価(Unit Price/KG) ¥6,627 ¥4,453 ¥13,493 ¥6,131 ¥6,674 ¥9,634 ¥43,778 ¥12,458 ¥18,885 ¥24,331 ¥8,747
⑰ Live Fish: Top Nine Exporters to Japan (2017 ~ 2020) (日本の生きた魚(観賞用)輸入先上位国、2017 年~ 2020 年)
世界World
フランスFrance
米国USA
イタリアItaly
英国UK
ドイツGermany
フィジーFiji
カナダCanada
2017 年
順位(Ranking) 1 2 3 11 4 5 71000 円 17,847,132 10,049,088 5,476,345 1,206,476 23,144 489,097 201,387 115,415リットル(L) 339,516,536 143,367,044 160,461,038 17,777,586 315,826 5,814,763 1,725,332 4,864,734単価(Unit Price/L) ¥53 ¥70 ¥34 ¥68 ¥73 ¥84 ¥117 ¥24
2018 年
順位(Ranking) 1 2 3 8 4 5 71000 円 18,170,093 10,377,092 5,690,707 1,167,209 34,940 418,232 192,083 51,781リットル(L) 351,986,097 143,908,578 178,909,788 16,702,400 466,419 4,924,499 1,633,389 1,436,910単価(Unit Price/L) ¥52 ¥72 ¥32 ¥70 ¥75 ¥85 ¥118 ¥36
2019 年
順位(Ranking) 1 2 3 4 5 6 101000 円 18,341,538 10,111,825 5,895,738 1,161,739 359,968 331,909 176,195 30,239リットル(L) 361,218,031 134,376,813 188,165,655 16,804,229 10,643,320 4,159,424 1,529,960 641,766単価(Unit Price/L) ¥51 ¥75 ¥31 ¥69 ¥34 ¥80 ¥115 ¥47
2020 年
順位(Ranking) 1 2 3 4 5 6 71000 円 17,023,445 8,821,115 5,536,340 1,341,757 441,250 332,539 171,214 89,157リットル(L) 339,318,908 111,936,237 179,325,186 21,186,263 12,509,216 4,059,813 1,455,655 2,596,260単価(Unit Price/L) ¥50 ¥79 ¥31 ¥63 ¥35 ¥82 ¥118 ¥34
⑯ Mineral Water: Top Seven Exporters to Japan (2017 ~ 2020) (日本のミネラルウォーター(鉱水)輸入先上位国、2017 年~ 2020 年)
17

(JPY1,000)Items 品目 2016 2017 2018 2019 2020 Total
Food and Live Animals 食料品及び動物 22,742 15,324 14,892 23,453 15,208 91,619Chemicals 化学製品 0 0 0 304 0 304Manufactured Goods 原料別製品 551 2,741 0 1,088 0 4,380
Rubber Manufatured ゴム製品 0 455 0 1,088 0 1,543Manufactures of Metals 金属製品 551 2,286 0 0 0 2,837
Machinery, Transport Equip. 機械類及び輸送用機器 541,634 356,691 319,050 248,526 225,246 1,691,147Machinery 一般機械 21,098 9,936 19,230 61,890 28,461 140,615Electrical machinery 電気機器 363,796 0 0 520 750 365,066Transport Equipment 輸送用機器 156,740 346,755 299,820 186,116 196,035 1,185,466・Motor Vehicles ・自動車 144,880 265,875 299,370 174,986 178,601 1,063,712・Parts of Motor Vehicle ・自動車の部分品 0 0 450 210 3,802 4,462・Cycles with Engines ・二輪自動車類 2,280 380 0 920 0 3,580・Other Vehicles ・その他の車両 0 0 0 0 13,632 13,632・Aircraft ・航空機類 580 0 0 0 0 580・Ships & Boats ・船舶類 9,000 80,500 0 10,000 0 99,500
Miscellaneous Manufactured Articles 雑製品 2,042 691 470 266 0 3,469Special Commodities (Re-Export Goods) 特殊取扱品 58,597 24,486 6,499 11,223 5,765 106,570Total 総額 625,566 399,933 340,911 284,860 246,219 1,897,489
2. Japan's Trade with FIC Individual Country (2016 ~ 2020) (日本と太平洋島嶼国との国別貿易額:2016 年~ 2020 年)① Cook Islands (クック諸島) ● Japan's Export (クック諸島への輸出)
18
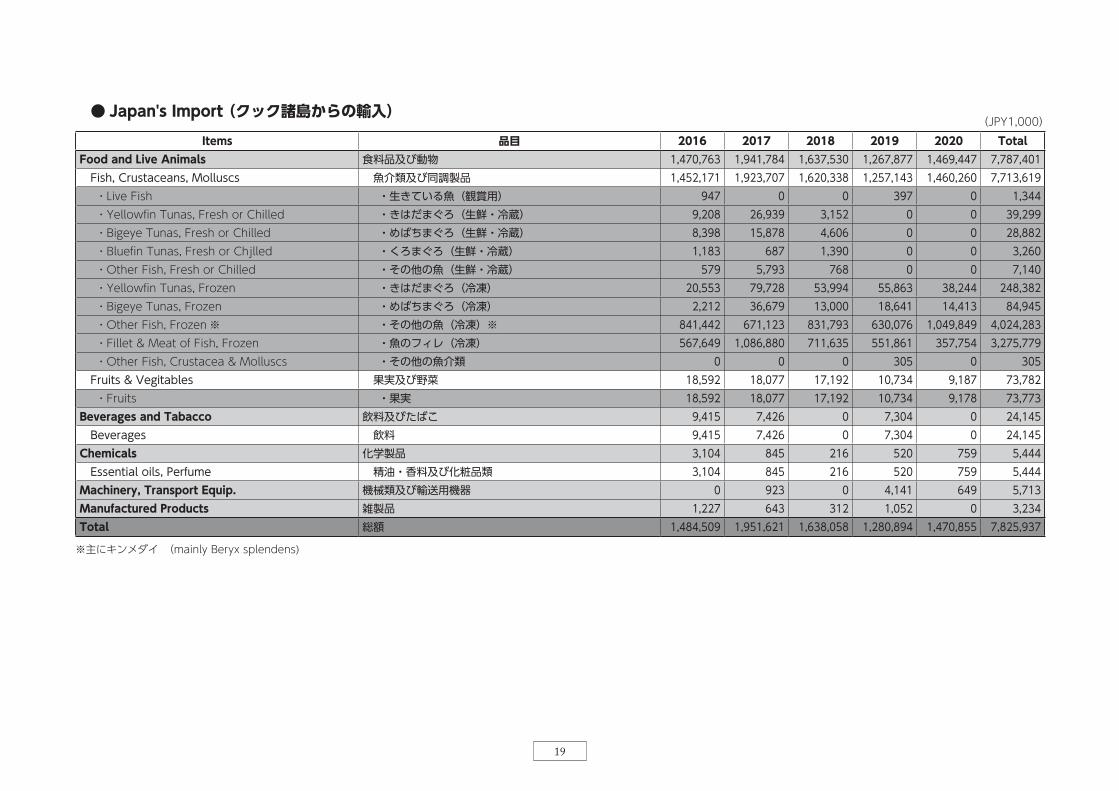
Items 品目 2016 2017 2018 2019 2020 TotalFood and Live Animals 食料品及び動物 1,470,763 1,941,784 1,637,530 1,267,877 1,469,447 7,787,401
Fish, Crustaceans, Molluscs 魚介類及び同調製品 1,452,171 1,923,707 1,620,338 1,257,143 1,460,260 7,713,619・Live Fish ・生きている魚(観賞用) 947 0 0 397 0 1,344・Yellowfin Tunas, Fresh or Chilled ・きはだまぐろ(生鮮・冷蔵) 9,208 26,939 3,152 0 0 39,299・Bigeye Tunas, Fresh or Chilled ・めばちまぐろ(生鮮・冷蔵) 8,398 15,878 4,606 0 0 28,882・Bluefin Tunas, Fresh or Chjlled ・くろまぐろ(生鮮・冷蔵) 1,183 687 1,390 0 0 3,260・Other Fish, Fresh or Chilled ・その他の魚(生鮮・冷蔵) 579 5,793 768 0 0 7,140・Yellowfin Tunas, Frozen ・きはだまぐろ(冷凍) 20,553 79,728 53,994 55,863 38,244 248,382・Bigeye Tunas, Frozen ・めばちまぐろ(冷凍) 2,212 36,679 13,000 18,641 14,413 84,945・Other Fish, Frozen ※ ・その他の魚(冷凍)※ 841,442 671,123 831,793 630,076 1,049,849 4,024,283・Fillet & Meat of Fish, Frozen ・魚のフィレ(冷凍) 567,649 1,086,880 711,635 551,861 357,754 3,275,779・Other Fish, Crustacea & Molluscs ・その他の魚介類 0 0 0 305 0 305
Fruits & Vegitables 果実及び野菜 18,592 18,077 17,192 10,734 9,187 73,782・Fruits ・果実 18,592 18,077 17,192 10,734 9,178 73,773
Beverages and Tabacco 飲料及びたばこ 9,415 7,426 0 7,304 0 24,145Beverages 飲料 9,415 7,426 0 7,304 0 24,145
Chemicals 化学製品 3,104 845 216 520 759 5,444Essential oils, Perfume 精油・香料及び化粧品類 3,104 845 216 520 759 5,444
Machinery, Transport Equip. 機械類及び輸送用機器 0 923 0 4,141 649 5,713Manufactured Products 雑製品 1,227 643 312 1,052 0 3,234Total 総額 1,484,509 1,951,621 1,638,058 1,280,894 1,470,855 7,825,937
※主にキンメダイ (mainly Beryx splendens)
(JPY1,000) ● Japan's Import (クック諸島からの輸入)
19

Items 品目 2016 2017 2018 2019 2020 TotalFood and Live Animals 食料品及び動物 157,976 202,354 202,704 232,137 250,595 1,045,766Beverages and Tabacco 飲料及びたばこ 3,725 2,863 3,033 1,845 2,695 14,161Crude Materials 原材料 223 13,400 2,200 3,988 882 20,693Mineral Fuels 鉱物性燃料 3,451 2,884 1,400 4,710 6,775 19,220Animals & Vegetable Oil, Fat 動植物性油脂 434 734 943 697 1,151 3,959Chemicals 化学製品 16,576 27,123 32,027 16,514 21,183 113,423Manufactured Goods 原料別製品 131,397 296,053 147,028 328,483 152,364 1,055,325
Rubber Manufatured ゴム製品 19,170 21,312 26,093 26,427 29,327 122,329Wood & Cork Manufactured 木製品及びコルク製品(除家具) 313 313Paper & Paper Manufactures 紙類及び同製品 0 467 246 0 7,298 8,011Textile Yarn, Fabrics 織物用糸及び繊維製品 65,415 80,210 42,419 154,896 40,125 383,065Non-Metallic Mineral Ware 非金属鉱物製品 351 333 654 1,502 357 3,197Iron and Steel Products 鉄鋼 0 9,906 559 0 4,345 14,810Nonferrous Metals 非鉄金属 0 0 664 0 278 942Manufactures of Metals 金属製品 46,461 183,825 76,393 145,658 70,321 522,658
Machinery, Transport Equip. 機械類及び輸送用機器 936,053 2,261,836 1,555,311 1,230,624 1,288,674 7,272,498Machinery 一般機械 310,321 661,312 664,008 286,521 559,348 2,481,510Electrical machinery 電気機器 50,131 327,323 353,207 346,664 84,314 1,161,639Transport Equipment 輸送用機器 575,601 1,273,201 538,096 597,439 645,012 3,629,349・Railway Vehicles ・鉄道用車両 380 0 0 0 311 691・Motor Vehicles ・自動車 322,299 531,734 455,766 485,535 533,534 2,328,868・Parts of Motor Vehicle ・自動車の部分品 397 5,057 2,988 1,755 2,736 12,933・Cycles with Engines ・二輪自動車類 0 393 1,048 514 232 2,187・Bicycles & Parts Thereof ・自転車及び同部分品 0 0 0 0 554 554・Other Vehicles ・その他の車両 0 1,010 0 0 13,451 14,461・Ships & Boats ・船舶類 250,991 735,007 78,294 109,635 94,194 1,268,121
Miscellaneous Manufactured Articles 雑製品 36,862 169,764 65,663 54,290 27,335 353,914Special Commodities (Re-Export Goods) 特殊取扱品 46,261 68,829 84,350 84,690 85,892 370,022Total 総額 1,332,958 3,045,840 2,094,659 1,957,978 1,837,546 10,268,981
② Federated States of Micronesia (ミクロネシア連邦) ● Japan's Export (ミクロネシア連邦への輸出)
(JPY1,000)
20

Items 品目 2016 2017 2018 2019 2020 TotalFood and Live Animals 食料品及び動物 650,106 770,614 2,016,085 1,460,295 553,294 5,450,394
Fish, Crustaceans, Molluscs 魚介類及び同調製品 650,106 770,614 2,016,085 1,460,295 553,294 5,450,394・Yellowfin Tunas, Fresh or Chilled ・きはだまぐろ(生鮮・冷蔵) 0 0 3,315 93,139 25,039 121,493・Bigeye Tunas, Freshed or Chilled ・めばちまぐろ(生鮮・冷蔵) 0 0 8,835 133,960 58,754 201,549・Albacore or Longfinned Tunas, Frozen ・びんながまぐろ(冷凍) 0 0 585 0 585・Yellowfin Tunas, Frozen ・きはだまぐろ(冷凍) 193,195 296,274 555,476 281,817 115,742 1,442,504・Stripbellied Bonito, Frozen ・かつお(冷凍) 248,778 138,171 364,000 252,458 185,891 1,189,298・Bigeye Tunas, Frozen ・めばちまぐろ(冷凍) 38,584 136,492 210,234 129,826 56,207 571,343・Other Fish, Frozen ・その他の魚(冷凍) 0 1,041 5,962 5,776 647 13,426・Fish Filet, Frozen ・魚のフィレ(冷凍) 169,549 198,636 852,569 545,690 104,627 1,871,071・Fish Preperation ・魚介類の調製品 0 0 15,109 0 6,387 21,496
Mineral Fuels 鉱物性燃料 4,980 10,677 0 0 0 15,657Manufactured Goods 原料別製品 1,666 0 0 277 0 1,943
Iron and Steel Products 鉄鋼 1,666 0 0 0 0 1,666Nonferrous Metals 非鉄金属 0 0 0 277 0 277
Machinery, Transport Equip. 機械類及び輸送用機器 0 2,207 1,671 0 0 3,878Manufactured Products 雑製品 2,412 0 0 0 0 2,412Special Commodities (Re-Import Goods etc) 特殊取扱品 0 15,392 6,283 44,923 0 66,598Total 総額 659,164 798,890 2,024,039 1,505,495 553,294 5,540,882
● Japan's Import (ミクロネシア連邦からの輸入)(JPY1,000)
21

Items 品目 2016 2017 2018 2019 2020 TotalFood and Live Animals 食料品及び動物 63,240 282,005 173,111 231,872 143,982 894,210Beverages and Tabacco 飲料及びたばこ 0 0 1,495 0 0 1,495Crude Materials 原材料 11,797 9,487 6,279 5,814 9,985 43,362Mineral Fuels 鉱物性燃料 2,087 0 921 1,080,747 432,970 1,516,725Chemicals 化学製品 66,086 262,338 333,873 163,551 233,477 1,059,325Manufactured Goods 原料別製品 525,095 357,571 432,528 529,034 398,456 2,242,684
Rubber Manufatured ゴム製品 86,663 67,638 76,375 65,821 26,624 323,121Paper & Paper Manufactures 紙類及び同製品 460 670 592 259 219 2,200Textile Yarn, Fabrics 織物用糸及び繊維製品 26,842 21,824 13,041 32,405 23,820 117,932Non-Metallic Mineral Ware 非金属鉱物製品 370,361 257,466 320,921 394,231 343,437 1,686,416Iron and Steel Products 鉄鋼 489 0 1,980 5,665 0 8,134Manufactures of Metals 金属製品 40,280 9,973 19,619 30,653 4,356 104,881
Machinery, Transport Equip. 機械類及び輸送用機器 11,509,608 6,926,659 9,506,636 6,251,697 3,136,705 37,331,305Machinery 一般機械 723,243 768,785 782,780 779,357 380,192 3,434,357Electrical machinery 電気機器 73,522 480,450 45,438 64,201 61,938 725,549Transport Equipment 輸送用機器 10,712,843 5,677,424 8,678,418 5,408,139 2,694,575 33,171,399・Railway Vehicles ・鉄道用車両 0 1,496 0 0 0 1,496・Motor Vehicles ・自動車 10,567,661 5,526,058 8,408,477 4,840,186 2,454,105 31,796,487・Parts of Motor Vehicle ・自動車の部分品 96,355 127,216 129,170 134,851 122,977 610,569・Cycles with Engines ・二輪自動車類 3,709 8,229 118,435 1,944 2,266 134,583・Other Vehicles ・その他の車両 0 259 0 0 800 1,059・Aircraft ・航空機類 438 438 438 438 438 2,190・Ships & Boats ・船舶類 44,680 13,728 21,898 430,720 113,989 625,015
Miscellaneous Manufactured Articles 雑製品 99,219 94,719 72,346 27,803 48,280 342,367Special Commodities (Re-Export Goods) 特殊取扱品 121,023 210,298 76,238 59,180 63,760 530,499Total 総額 12,398,155 8,143,077 10,603,427 8,349,698 4,467,615 43,961,972
③ Repbulic of Fiji (フィジー共和国) ● Japan's Export (フィジーへの輸出)
(JPY1,000)
22

Items 品目 2016 2017 2018 2019 2020 TotalFood and Live Animals 食料品及び動物 2,264,844 2,651,651 1,242,849 1,397,060 853,138 8,409,542
Fish, Crustaceans, Molluscs 魚介類 2,260,469 2,642,471 1,236,310 1,370,049 838,553 8,347,852・Live Fish ・生きている魚(観賞用) 597 450 219 0 0 1,266・Albacore or Longfinnes Tuna, Fresh or Chilled ・びんながまぐろ(生鮮・冷蔵) 3,235 342 287 1,286 1,544 6,694・Yellowfin Tunas, Fresh or Chilled ・きはだまぐろ(生鮮・冷蔵) 62,062 10,652 2,809 10,104 10,198 95,825・Bigeye Tunas, Freshed or Chilled ・めばちまぐろ(生鮮・冷蔵) 23,530 2,370 1,443 2,402 3,404 33,149・Swordfish, Fresh or Chilled ・めかじき(生鮮・冷蔵) 0 0 0 0 0 0・Other Fish, Fresh or Chilled ・その他の魚(生鮮・冷蔵) 0 0 0 0 0 0・Albacore or Longfinnes Tuna, Frozen ・びんながまぐろ(冷凍) 29,197 95,887 46,830 43,535 49,758 265,207・Yellowfin Tunas, Frozen ・きはだまぐろ(冷凍) 751,986 1,160,592 527,827 475,562 263,177 3,179,144・Stripbellied Bonito, Frozen ・かつお(冷凍) 0 5,275 0 0 0 5,275・Bigeye Tunas, Frozen ・めばちまぐろ(冷凍) 376,953 369,015 243,933 161,274 123,778 1,274,953・Swordfish, Frozen ・めかじき(冷凍) 4,923 2,846 1,300 1,292 203 10,564・Other Fish, Frozen ・その他の魚(冷凍) 1,756 262 0 0 0 2,018・Fillet & Meat of Fish, Frozen ・魚のフィレ(冷凍) 1,004,101 992,934 411,662 674,594 386,491 3,469,782・Other Fish, Crustacea & Molluscs ・その他の魚介類 2,129 2,746 0 0 0 4,875
Fruits & Vegetables 果実及び野菜 1,256 223 0 0 0 1,479Cereals, Cereal Preparation 穀物及び同調製品 0 0 0 303 0 303Sugar,Sugar Preparation & Honey 糖類及び同調製品・はちみつ 0 543 686 607 0 1,836Coffee, Tea, Cocoa & Spices コーヒー、茶、ココア、香辛料 2,740 8,414 5,853 6,258 4,702 27,967・Coffee, not Roasted, not Decaffeinated ・コーヒー(除く煎ったもの・カフェインを除いていないもの) 0 0 0 0 648 648・Chocolate Confectionery ・チョコレート菓子(ホワイトチョコレート) 2,371 2,779 959 1,280 1,662 9,051・Spices ・香辛料(ターメリック類等) 369 5,635 4,894 4,978 2,392 18,268
Feeding-Stuff for Animals 飼料 0 0 0 19,843 9,883 29,726Other Food Preparation その他の調整食料品 286 0 0 0 0 286
Beverages and Tabacco 飲料及びたばこ 212,145 205,314 195,970 184,407 172,058 969,894Beverages 飲料 212,145 205,314 195,970 184,407 172,058 969,894・Mineral Water ・鉱水・炭酸水 208,068 201,387 192,540 176,195 171,214 949,404・Rum ・ラム酒 0 0 395 505 844 1,744・Beer ・ビール 4,077 3,927 3,035 7,707 0 18,746
Crude Materials 原材料 64,602 68,251 58,952 53,605 30,606 276,016Woods, Lumber & Cork Products 木材、コルク 56,302 61,243 44,906 47,370 21,447 231,268Crude Animal & Vegetable その他の動食物性原材料 8,300 7,008 14,046 6,235 6,209 41,798
Animals & Vegetable Oil, Fat 動植物性油脂 400 0 0 0 18,148 18,548Chemicals 化学製品 0 0 0 0 0 0
(Continue to the next page)(次ページへ続く)
● Japan's Import (フィジーからの輸入)(JPY1,000)
23

(JPY1,000)Items 品目 2016 2017 2018 2019 2020 Total
Manufactured Goods 原料別製品 1,537,370 1,852,699 2,986,388 2,969,224 2,216,376 11,562,057Wood & Cork Manufactured 木製品及びコルク製品(除家具) 1,534,397 1,852,699 2,986,388 2,964,698 2,212,070 11,550,252Textile Yarn, Fabrics 織物用糸及び繊維製品 0 0 0 3,607 4,306 7,913Non-Metallic Mineral Ware 非金属鉱物製品 2,973 0 0 919 0 3,892
Machinery, Transport Equip. 機械類及び輸送用機器 0 254 1,026 977 0 2,257Manufactured Products 雑製品 5,154 4,031 9,996 8,672 420 28,273Special Commodities (Re-Import Goods etc) 特殊取扱品 13,627 6,485 1,425 683 4,336 26,556Total 総額 4,098,142 4,788,685 4,496,606 4,614,628 3,295,082 13,383,433
24

Items 品目 2016 2017 2018 2019 2020 TotalFood and Live Animals 食料品及び動物 16,193 18,936 88,239 6,296 0 129,664Crude Materials 原材料 6,913 0 4,480 0 0 11,393Mineral Fuels 鉱物性燃料 1,543 0 5,460 429 0 7,432Chemicals 化学製品 0 17,594 1,587 3,229 429 22,839Manufactured Goods 原料別製品 9,126 219,467 36,264 69,219 34,271 368,347
Rubber Manufatured ゴム製品 7,186 7,642 1,674 7,333 3,170 27,005Wood & Cork Manufactured 木製品及びコルク製品 0 2,719 1,309 0 0 4,028Textile Yarn, Fabrics 織物用糸及び繊維製品 0 99,843 6,771 18,544 2,653 127,811Non-Metallic Mineral Ware 非金属鉱物製品 210 334 19,086 0 249 19,879Iron and Steel Products 鉄鋼 290 34,803 0 0 0 35,093Manufactures of Metals 金属製品 1,440 74,126 7,424 43,342 28,199 154,531
Machinery, Transport Equip. 機械類及び輸送用機器 1,917,392 1,044,661 421,909 444,516 751,336 4,579,814Machinery 一般機械 105,977 224,526 88,011 60,346 57,956 536,816Electrical machinery 電気機器 11,567 22,535 13,364 5,500 5,006 57,972Transport Equipment 輸送用機器 1,799,848 797,600 320,534 378,670 688,374 3,985,026・Motor Vehicles ・自動車 362,145 460,356 298,283 287,104 299,815 1,707,703・Parts of Motor Vehicle ・自動車の部分品 204 830 428 2,164 251 3,877・Cycles with Engines ・二輪自動車類 3,654 207 0 649 0 4,510・Bicycles & Parts Thereof ・自転車及び同部分品 590 964 434 0 0 1,988・Other Vehicles ・その他の車両 0 4,000 0 0 0 4,000・Aircraft ・航空機類 608 0 0 753 308 1,669・Ships & Boats ・船舶類 1,430,547 331,243 21,389 88,000 388,000 2,259,179
Miscellaneous Manufactured Articles 雑製品 5,549 22,062 101,114 5,329 4,731 138,785Special Commodities (Re-Export Goods) 特殊取扱品 16,163 11,320 29,329 9,572 15,742 82,126Total 総額 1,972,879 1,334,040 688,382 538,590 806,509 5,340,400
(JPY1,000)
④ Repbulic of Kiribati (キリバス共和国) ● Japan's Export (キリバスへの輸出)
25

Items 品目 2016 2017 2018 2019 2020 TotalFood and Live Animals 食料品及び動物 794,559 1,091,060 925,424 845,771 475,511 4,132,325
Fish, Crustaceans, Molluscs 魚介類及び同調製品 794,559 1,091,060 925,424 845,771 475,511 4,132,325・Live Fish ・生きている魚(観賞用) 5,919 6,591 6,278 5,713 2,283 26,784・Bigeye Tunas, Freshed or Chilled ・めばちまぐろ(生鮮・冷蔵) 0 8,339 0 0 0 8,339・Yellowfin Tunas, Frozen ・きはだまぐろ(冷凍) 360,726 273,710 419,172 255,825 205,303 1,514,736・Bigeye Tunas, Frozen ・めばちまぐろ(冷凍) 77,203 246,905 3,688 0 0 327,796・Swordfish, Frozen ・めかじき(冷凍) 1,684 7,822 0 0 0 9,506・Fillet & Meat of Fish, Frozen ・魚のフィレ(冷凍) 349,027 547,693 496,286 584,233 267,925 2,245,164
Crude Materials 原材料 0 0 2,405 0 0 2,405Manufactured Goods 原料別製品 0 0 460 7,000 0 7,460
Textile Yarn, Fabrics 織物用糸及び繊維製品 0 0 0 7,000 0 7,000Manufactures of Metals 金属製品 0 0 460 0 0 460
Machinery, Transport Equip. 機械類及び輸送用機器 302 851 0 2,820 0 3,973Manufactured Products 雑製品 0 0 0 262 0 262Special Commodities (Re-Import Goods etc) 特殊取扱品 0 0 456 17,879 0 18,335Total 総額 794,861 1,091,911 928,745 873,732 475,511 4,164,760
● Japan's Import (キリバスからの輸入)(JPY1,000)
26

Items 品目 2016 2017 2018 2019 2020 TotalFood and Live Animals 食料品及び動物 52,941 55,075 55,786 50,748 48,333 262,883Beverages and Tabacco 飲料及びたばこ 5,974 221 775 1,493 294 8,757Crude Materials 原材料 0 0 0 3,798 0 3,798Mineral Fuels 鉱物性燃料 1,094,561 1,977,915 2,024,212 2,630,089 17,766 7,744,543Chemicals 化学製品 1,958 4,573 5,704 63,131 67,240 142,606Manufactured Goods 原料別製品 201,661 187,219 222,051 381,356 383,104 1,375,391
Rubber Manufatured ゴム製品 36,397 38,260 60,879 164,104 129,110 428,750Wood & Cork Manufactured 木製品及びコルク製品 0 0 0 386 0 386Paper & Paper Manufactures 紙類及び同製品 0 230 1,972 1,020 441 3,663Textile Yarn, Fabrics 織物用糸及び繊維製品 23,816 11,438 25,273 49,721 15,080 125,328Non-Metallic Mineral Ware 非金属鉱物製品 358 332 1,545 4,644 7,357 14,236Iron and Steel Products 鉄鋼 2,005 7,075 4,358 8,289 12,447 34,174Nonferrous Metals 非鉄金属 0 254 10,719 663 1,120 12,756Manufactures of Metals 金属製品 139,085 129,630 117,305 152,529 217,549 756,098
Machinery, Transport Equip. 機械類及び輸送用機器 157,068,471 146,303,339 145,576,018 140,061,183 136,768,712 725,777,723Machinery 一般機械 807,435 846,989 1,448,811 2,465,853 2,783,435 8,352,523Electrical machinery 電気機器 153,985 129,847 183,346 324,878 386,339 1,178,395Transport Equipment 輸送用機器 156,107,051 145,326,503 143,943,861 137,270,452 133,598,938 716,246,805・Motor Vehicles ・自動車 685,930 34,548 38,482 0 16,907 775,867・Cycles with Engines ・二輪自動車類 609 373 738 650 0 2,370・Other Vehicles ・その他の車両 0 36,337 0 0 10,487 46,824・Parts of Other Vehicles ・その他の車両の部品 0 0 0 5,103 250 5,353・Ships & Boats ・船舶類 * 155,419,258 145,255,245 143,904,641 137,264,699 133,571,294 715,415,137
Miscellaneous Manufactured Articles 雑製品 52,835 71,511 55,347 116,615 148,031 444,339Special Commodities (Re-Export Goods) 特殊取扱品 23,122 39,579 27,509 82,376 245,279 417,865Total 総額 158,501,523 148,639,432 147,967,402 143,390,789 137,678,759 736,177,905
* Mainly tankers and other vessels exported only for ship registration in the Marshall Islands* 主として、マーシャル諸島での船籍登録のためにのみ輸出されたタンカーおよび他の船舶
⑤ Republic of the Marshall Is. (マーシャル諸島共和国) ● Japan's Export (マーシャル諸島への輸出)
(JPY1,000)
27

Items 品目 2016 2017 2018 2019 2020 TotalFood and Live Animals 食料品及び動物 993,869 694,497 316,667 386,299 169,645 2,560,977
Fish, Crustaceans, Molluscs 魚介類及び同調製品 993,869 694,497 316,667 379,098 159,838 2,543,969・Live Fish ・生きている魚(観賞用) 5,028 11,013 12,049 7,317 3,528 38,935・Yellowfin Tunas, Fresh or Chilled ・きはだまぐろ(生鮮・冷蔵) 74,728 85,941 44,884 70,741 14,680 290,974・Bigeye Tunas, Fresh or Chilled ・めばちまぐろ(生鮮・冷蔵) 187,002 98,215 65,418 145,325 54,630 550,590・Bluefin Tunas, Fresh or Chjlled ・くろまぐろ(生鮮・冷蔵) 0 0 263 0 0 263・Yellowfin Tunas, Frozen ・きはだまぐろ(冷凍) 163,070 136,643 114,394 150,014 87,000 651,121・Stripbellied Bonito, Frozen ・かつお(冷凍) 560,738 324,497 79,659 3,282 0 968,176・Bigeye Tunas, Frozen ・めばちまぐろ(冷凍) 3,303 7,700 0 2,419 0 13,422・Fillet & Meat of Fish, Frozen ・魚のフィレ(冷凍) 0 30,488 0 0 0 30,488
Feeding-Stuff for Animals 飼料 0 0 0 7,201 9,807 17,008Crude Materials 原材料 31,657 121,378 140,438 40,335 1,047 334,855
Metalliferous & Scrap 金属鉱及びくず 0 2,024 0 0 1,047 3,071Crude Animal & Vegetable その他の動植物性原材料 31,657 119,354 140,438 40,335 0 331,784
Mineral Fuels 鉱物性燃料 0 0 252 0 0 252Chemicals 化学製品 0 0 0 387 0 387Manufactured Goods 原料別製品 0 0 0 1,354 0 1,354
Manufactures of Metals 金属製品 0 0 0 1,354 0 1,354Machinery, Transport Equip. 機械類及び輸送用機器 585 69,578 0 0 528,048 598,211Manufactured Products 雑製品 1,655 232 0 0 0 1,887Special Commodities (Re-Import Goods etc) 特殊取扱品 2,595 565,092 0 38,712 0 606,399Total 総額 1,030,361 1,450,777 457,357 467,087 698,740 4,104,322
● Japan's Import (マーシャル諸島からの輸入)(JPY1,000)
28

Items 品目 2016 2017 2018 2019 2020 TotalCrude Materials 原材料 0 0 6,496 0 0 6,496Chemicals 化学製品 8,740 6,216 0 580 0 15,536Manufactured Goods 原料別製品 2,379 898 0 1,773 2,001 7,051
Rubber Manufatured ゴム製品 0 0 0 652 0 652Iron and Steel Products 鉄鋼 0 0 0 0 293 293Manufactures of Metals 金属製品 2,379 898 0 1,121 1,708 6,106
Machinery, Transport Equip. 機械類及び輸送用機器 198,144 26,770 188,816 277,806 328,024 1,019,560Machinery 一般機械 38,491 3,327 42,784 17,760 17,580 119,942Electrical machinery 電気機器 10,720 6,077 127,505 1,776 848 146,926Transport Equipment 輸送用機器 148,933 17,366 18,527 258,270 309,596 752,692・Motor Vehicles ・自動車 27,492 10,626 17,721 45,585 76,690 178,114・Parts of Motor Vehicle ・自動車の部分品 0 761 219 0 0 980・Cycles with Engines ・二輪自動車類 1,111 0 587 1,900 2,906 6,504・Other Vehicles ・その他の車両 0 5,979 0 2,785 0 8,764・Ships & Boats ・船舶類 120,330 0 0 208,000 230,000 558,330
Miscellaneous Manufactured Articles 雑製品 10,243 1,236 25,023 758 227 37,487Special Commodities (Re-Export Goods) 特殊取扱品 3,366 607 295 3,552 376 8,196Total 総額 222,872 35,727 220,630 284,469 330,628 1,094,326
⑥ Republic of Nauru (ナウル共和国) ● Japan's Export (ナウルへの輸出)
(JPY1,000)
29
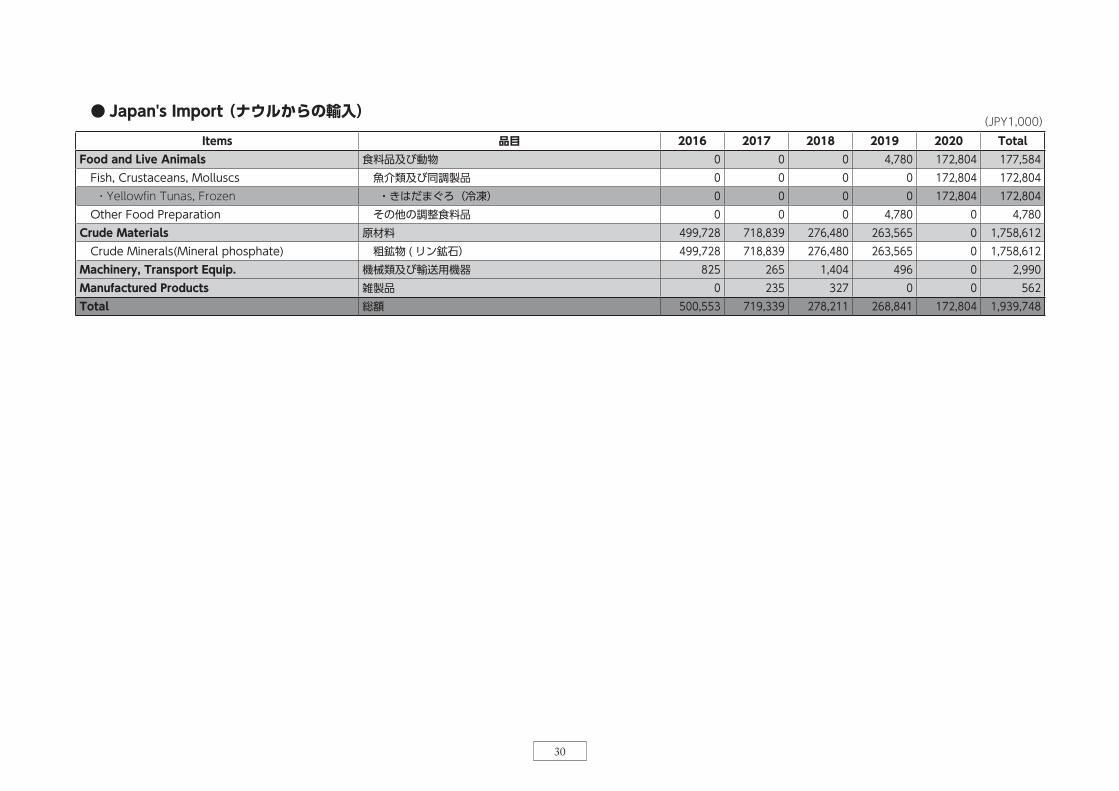
Items 品目 2016 2017 2018 2019 2020 TotalFood and Live Animals 食料品及び動物 0 0 0 4,780 172,804 177,584
Fish, Crustaceans, Molluscs 魚介類及び同調製品 0 0 0 0 172,804 172,804・Yellowfin Tunas, Frozen ・きはだまぐろ(冷凍) 0 0 0 0 172,804 172,804
Other Food Preparation その他の調整食料品 0 0 0 4,780 0 4,780Crude Materials 原材料 499,728 718,839 276,480 263,565 0 1,758,612
Crude Minerals(Mineral phosphate) 粗鉱物 ( リン鉱石) 499,728 718,839 276,480 263,565 0 1,758,612Machinery, Transport Equip. 機械類及び輸送用機器 825 265 1,404 496 0 2,990Manufactured Products 雑製品 0 235 327 0 0 562Total 総額 500,553 719,339 278,211 268,841 172,804 1,939,748
● Japan's Import (ナウルからの輸入)(JPY1,000)
30

Items 品目 2016 2017 2018 2019 2020 TotalManufactured Goods 原料別製品 0 0 0 0 3443 3,443
Rubber Manufatured ゴム製品 0 0 0 0 2180 2,180Manufactures of Metals 金属製品 0 0 0 0 1263 1,263
Machinery, Transport Equip. 機械類及び輸送用機器 599,702 873,998 275,675 640,310 1,197,772 3,587,457Machinery 一般機械 0 0 0 257 5,359 5,616Transport Equipment 輸送用機器 588,702 873,998 275,675 640,053 1,192,413 3,570,841・Motor Vehicles ・自動車 8,578 15,498 12,807 9,640 5,991 52,514・Ships & Boats ・船舶類 591,124 858,500 262,868 630,413 1,186,422 3,529,327
Special Commodities (Re-Export Goods) 特殊取扱品 313 2,119 367 0 275 3,074Total 総額 600,015 876,117 276,042 640,310 1,201,490 3,593,974
⑦ Niue (ニウエ) ● Japan's Export (ニウエへの輸出)
(JPY1,000)
31

Items 品目 2016 2017 2018 2019 2020 TotalFood and Live Animals 食料品及び動物 1,437 6,117 794 4,878 2,068 15,294
Fruits & Vegitables 果実及び野菜 1,437 6,117 794 4,878 2,068 15,294・Fruits ・果実 1,437 6,117 794 4,878 2,068 15,294
Manufactured Goods 原料別製品 0 0 817 0 1,316 2,133Rubber Manufatured ゴム製品 0 0 817 0 0 817Manufactures of Metals 金属製品 0 0 0 0 1,316 1,316
Machinery, Transport Equip. 機械類及び輸送用機器 0 0 760 0 378 1,138Special Commodities (Re-Import Goods etc) 特殊取扱品 533 0 835,265 0 0 835,798Total 総額 1,970 6,117 837,636 4,878 3,762 854,363
● Japan's Import (ニウエからの輸入)(JPY1,000)
32

Items 品目 2016 2017 2018 2019 2020 TotalFood and Live Animals 食料品及び動物 123,885 93,788 122,086 129,252 119,656 588,667Beverages and Tabacco 飲料及びたばこ 7,086 2,621 5,312 4,279 5,178 24,476Crude Materials 原材料 415 0 0 0 0 415Mineral Fuels 鉱物性燃料 211 362 0 0 199,404 199,977Animals & Vegetable Oil, Fat 動植物性油脂 764 416 445 586 1,039 3,250Chemicals 化学製品 23,931 35,745 73,866 25,909 37,255 196,706Manufactured Goods 原料別製品 218,766 311,704 249,863 299,778 141,540 1,221,651
Leather,Dressed FurSkins 革及び同製品・毛皮 0 0 0 211 0 211Rubber Manufatured ゴム製品 7,986 11,891 15,207 5,216 1,793 42,093Wood & Cork Manufactured 木製品及びコルク製品 3,231 6,397 39,640 13,078 1,313 63,659Paper & Paper Manufactures 紙類及び同製品 1,584 1,931 2,746 931 1,517 8,709Textile Yarn, Fabrics 織物用糸及び繊維製品 11,062 8,258 9,501 29,755 12,890 71,466Non-Metallic Mineral Ware 非金属鉱物製品 21,045 37,084 30,712 58,056 19,272 166,169Iron and Steel Products 鉄鋼 113,272 53,637 22,159 54,986 4,496 248,550Nonferrous Metals 非鉄金属 0 719 0 1,007 945 2,671Manufactures of Metals 金属製品 60,586 191,787 129,898 136,538 99,314 618,123
Machinery, Transport Equip. 機械類及び輸送用機器 2,525,553 2,624,914 960,507 1,103,866 756,999 7,971,839Machinery 一般機械 289,240 445,972 326,068 319,762 237,392 1,618,434Electrical machinery 電気機器 30,296 286,725 90,512 160,605 62,955 631,093Transport Equipment 輸送用機器 2,206,017 1,892,217 543,927 623,499 456,652 5,722,312・Railway Vehicles ・鉄道用車両 224 446 0 0 0 670・Motor Vehicles ・自動車 506,365 392,985 388,972 515,797 424,461 2,228,580・Parts of Motor Vehicle ・自動車の部分品 1,636 1,200 260 1,186 1,334 5,616・Cycles with Engines ・二輪自動車類 3,313 0 239 453 0 4,005・Other Vehicles ・その他の車両 0 1,171 0 1,567 1,633 4,371・Aircraft ・航空機類 657 0 221 213 201 1,292・Ships & Boats ・船舶類 1,681,819 1,496,415 148,085 104,283 29,023 3,459,625
Miscellaneous Manufactured Articles 雑製品 45,892 108,379 94,160 216,830 61,509 526,770Special Commodities (Re-Export Goods) 特殊取扱品 84,573 61,153 158,673 229,916 52,134 586,449Total 総額 3,031,076 3,239,082 1,664,912 2,010,416 1,374,714 11,320,200
(JPY1,000)
⑧ Republic of Palau (パラオ共和国) ● Japan's Export (パラオへの輸出)
33

Items 品目 2016 2017 2018 2019 2020 TotalFood and Live Animals 食料品及び動物 1,679,965 2,175,699 2,114,551 1,455,186 0 7,425,401
Fish, Crustaceans, Molluscs 魚介類及び同調製品 1,677,815 2,174,367 2,113,262 1,454,410 0 7,419,854・Live Fish ・生きている魚(観賞用) 0 0 0 232 0 232・Yellowfin Tunas, Fresh or Chilled ・きはだまぐろ(生鮮・冷蔵) 898,061 1,182,710 1,349,463 941,553 0 4,371,787・Bigeye Tunas, Freshed or Chilled ・めばちまぐろ(生鮮・冷蔵) 779,754 989,208 763,799 512,381 0 3,045,142・Yellowfin Tunas, Frozen ・きはだまぐろ(冷凍) 0 2,449 0 0 0 2,449・Crustacea & Molluscs ・その他の魚介類 0 0 0 244 0 244
Cereals, Cereal Preparation 穀物及び同調製品 2,150 1,332 1,289 776 0 5,547Beverages and Tabacco 飲料及びたばこ 2,681 1,401 1,383 2,984 0 8,449
Beverages 飲料 2,681 1,401 1,383 2,984 0 8,449Crude Materials 原材料 0 0 0 755 1,077 1,832
Crude Minerals 粗鉱物 0 0 0 755 1,077 1,832Manufactured Goods 原料別製品 0 0 26,248 0 348 26,596Machinery, Transport Equip. 機械類及び輸送用機器 909 183,914 351,829 371,763 398,391 1,306,806Manufactured Products 雑製品 1,055 272 3,879 6,000 1,385 12,591Special Commodities (Re-Import Goods etc) 特殊取扱品 38,224 51,239 6,727 450 91,877 188,517Total 総額 1,722,834 2,412,525 2,504,617 1,837,138 493,078 8,970,192
● Japan's Import (パラオからの輸入)(JPY1,000)
34

Items 品目 2016 2017 2018 2019 2020 TotalFood and Live Animals 食料品及び動物 591 745 3,537 875 0 5,748Beverages and Tabacco 飲料及びたばこ 0 0 207 0 0 207Crude Materials 原材料 33,206 40,678 31,274 45,349 83,362 233,869Mineral Fuels 鉱物性燃料 14,897 1,633 0 0 0 16,530Chemicals 化学製品 116,657 181,134 89,895 129,596 132,925 650,207Manufactured Goods 原料別製品 2,924,675 4,519,937 2,921,793 3,358,955 2,587,154 16,312,514
Rubber Manufatured ゴム製品 2,084,226 2,738,857 2,463,326 2,311,319 2,111,509 11,709,237Wood & Cork Manufactured 木製品及びコルク製品 24,048 32,683 1,156 4,203 4,015 66,105Paper & Paper Manufactures 紙類及び同製品 5,356 8,493 7,875 0 12,472 34,196Textile Yarn, Fabrics 織物用糸及び繊維製品 21,718 4,573 12,548 1,655 14,420 54,914Non-Metallic Mineral Ware 非金属鉱物製品 541,856 478,636 297,156 354,865 309,463 1,981,976Iron and Steel Products 鉄鋼 26,133 540,561 38,908 99,329 12,021 716,952Nonferrous Metals 非鉄金属 1,912 3,595 1,705 0 0 7,212Manufactures of Metals 金属製品 219,426 712,539 99,119 587,584 123,254 1,741,922
Machinery, Transport Equip. 機械類及び輸送用機器 11,551,084 14,092,469 12,641,994 11,790,013 13,341,402 63,416,962Machinery 一般機械 2,060,321 1,878,481 1,974,899 1,776,974 1,582,367 9,273,042Electrical Machinery 電気機器 146,763 558,783 333,079 214,662 252,214 1,505,501Transport Equipment 輸送用機器 9,344,000 11,655,205 10,334,016 9,798,377 11,506,821 52,638,419・Railway Vehicles ・鉄道用車両 0 0 334 0 0 334・Motor Vehicles ・自動車 9,141,650 11,436,991 9,954,030 9,448,691 11,163,947 51,145,309・Parts of Motor Vehicle ・自動車の部分品 112,677 128,610 281,076 326,019 311,557 1,159,939・Cycles with Engines ・二輪自動車類 27,448 78,289 31,232 17,365 17,768 172,102・Bicycles and Parts Thereof ・自転車及び同部分品 0 0 0 269 0 269・Other Vehicles ・その他の車両 0 3,567 0 0 1,708 5,275・Airchaft ・航空機類 588 1,053 65,574 2,843 8,247 78,305・Ships & Boats ・船舶類 61,140 6,695 461 3,190 4,224 75,710
Miscellaneous Manufactured Articles 雑製品 99,121 222,089 273,648 270,404 352,673 1,217,935Special Commodities (Re-Export Goods) 特殊取扱品 2,681,817 300,207 371,959 297,456 315,420 3,966,859Total 総額 17,422,048 19,358,892 16,334,307 15,892,648 16,812,936 85,820,831
⑨ Independent State of Papua New Guinea (パプアニューギニア独立国) ● Japan's Export (パプアニューギニアへの輸出)
(JPY1,000)
35

Items 品目 2016 2017 2018 2019 2020 TotalFood and Live Animals 食料品及び動物 2,389,743 2,869,028 2,321,902 1,106,836 814,480 9,501,989
Meat & Meat Preparation 肉類及び同調製品 45,019 40,041 48,103 21,407 6,172 160,742Fish, Crustaceans, Molluscs 魚介類及び同調製品 1,353,792 2,160,988 1,902,787 677,823 275,815 6,371,205・Yellowfin Tunas, Fresh or Chilled ・きはだまぐろ(生鮮・冷蔵) 107,855 372,040 3,870 4,194 0 487,959・Bigeye Tunas, Freshed or Chilled ・めばちまぐろ(生鮮・冷蔵) 13,270 10,202 442 0 0 23,914・Albacore or Longfinnes Tuna, Frozen ・びんながまぐろ(冷凍) 0 0 0 958 0 958・Yellowfin Tunas, Frozen ・きはだまぐろ(冷凍) 401,975 289,025 435,396 239,325 18,108 1,383,829・Stripbellied Bonito, Frozen ・かつお(冷凍) 0 23,261 0 0 0 23,261・Fillet & Meat of Fish, Frozen ・魚のフィレ(冷凍) 271,931 1,075,508 1,088,465 12,586 0 2,448,490・Crustacea & Molluscs ・その他の魚介類 558,761 390,952 374,614 420,760 257,192 2,002,279
Coffee, Tea, Cocoa & Spices コーヒー、茶、ココア、香辛料 979,156 667,999 284,103 353,021 398,953 2,683,232・Coffee, not Roasted, not Decaffeinated ・コーヒー(除く煎ったもの・カフェインを除いていないもの) 948,130 653,383 213,105 314,546 371,686 2,500,850・Coffee, Roasted, not Decaffeinated ・コーヒー(煎ったもの・カフェインを除いていないもの) 3,449 1,473 50,886 2,142 3,085 61,035・Tea ・茶 924 0 0 438 1,443 2,805・Vanilla ・バニラ豆 26,653 13,143 11,251 33,566 22,186 106,799・Cacao beans ・カカオ豆 0 0 0 2,329 0 2,329
Feeding-Stuff for Animals 飼料 11,776 0 86,909 54,585 133,540 286,810Beverages and Tabacco 飲料及びたばこ 0 0 375 0 0 375Crude Materials 原材料 38,827,573 48,204,569 49,275,772 57,151,779 58,154,285 251,613,978
Hide, Skins and Fur Skins 原皮及び毛皮(未仕上) 268,220 271,850 223,330 204,993 147,912 1,116,305Woods, Lumber & Cork Products 木材、コルク 1,053,529 771,581 2,698,729 3,248,764 1,498,627 9,271,230・Tropical Rough Woods ・熱帯産木材の粗木材 472,360 646,602 2,529,010 3,221,331 1,462,068 8,331,371・Other Rough Woods ・その他の粗木材 570,498 120,777 162,979 25,279 31,492 911,025・Other Tropical Woods Sawn, Chipped ・その他の熱帯産の木材 1,325 4,202 6,740 2,154 5,067 19,488・Other Wood Sawn, Chipped ・その他の木材 9,346 0 0 0 0 9,346
Metalliferous & Scrap 金属鉱及びくず 37,480,186 47,143,401 46,329,524 53,664,164 56,480,487 241,097,762Crude Animal & Vegetable その他の動植物性原材料 25,638 17,737 24,189 33,858 27,259 128,681
(Continue to the next page)(次ページへ続く)
● Japan's Import (パプアニューギニアからの輸入)(JPY1,000)
36

(JPY1,000)Items 品目 2016 2017 2018 2019 2020 Total
Mineral Fuels 鉱物性燃料 177,521,833 222,806,299 204,332,657 228,943,468 164,712,700 998,316,957Petroleum, Their Products 石油、同製品 8,805,686 16,194,105 14,128,716 12,270,544 13,344,453 64,743,504・Petroleum Oils, Bituminous Minerals & Crude ・石油・歴青油(原油) 359,504 0 0 0 0 359,504・Light Oils & Preparations ・石油・歴青油(揮発油) 8,446,182 13,894,269 9,719,435 7,565,659 11,570,061 51,195,606・Petroleum Oils, Not Light Oils & Preparations ・石油・歴青油(除く軽質油) 0 2,299,836 4,408,741 4,704,885 1,774,392 13,187,854・Waste Oils ・廃油 0 0 540 0 0 540
Gas, Natural & Manufactured 天然ガス及び製造ガス 168,716,147 206,612,194 190,203,941 216,672,924 151,368,247 933,573,453・Natural Gas ・天然ガス 168,716,147 206,612,194 190,203,941 216,672,924 151,368,247 933,573,453
Animals & Vegetable Oil, Fat 動植物性油脂 650 0 0 2,856 0 3,506Manufactured Goods 原料別製品 19,544 51,338 17,825 24,004 0 112,711
Leather,Dressed FurSkins 革及び同製品・毛皮 19,544 51,338 17,072 24,004 0 111,958Wood & Cork Manufactured 木製品及びコルク製品(除家具) 0 0 282 0 0 282Manufactures of Metals 金属製品 0 0 471 0 0 471
Machinery, Transport Equip. 機械類及び輸送用機器 1,787 0 526 3,799 0 6,112Manufactured Products 雑製品 7,818 5,992 3,818 4,885 19,885 42,398Special Commodities (Re-Import Goods etc) 特殊取扱品 2,915 0 27,857 28,981 2,042 61,795Total 総額 218,771,863 273,937,226 255,980,732 287,266,608 223,703,392 1,259,659,821
37

Items 品目 2016 2017 2018 2019 2020 TotalFood and Live Animals 食料品及び動物 28,784 2,649 7,191 19,400 27,758 85,782Crude Materials 原材料 780 802 0 520 737 2,839Mineral Fuels 鉱物性燃料 0 480 0 344 0 824Chemicals 化学製品 35,159 85,529 12,083 17,718 3,758 154,247Manufactured Goods 原料別製品 30,769 158,038 185,148 144,130 34,619 552,704
Rubber Manufatured ゴム製品 4,694 25,648 7,224 7,037 15,529 60,132Wood & Cork Manufactured 木製品及びコルク製品 0 2,621 0 385 0 3,006Paper & Paper Manufactures 紙類及び同製品 0 0 214 0 0 214Textile Yarn, Fabrics 織物用糸及び繊維製品 252 2,413 13,666 223 302 16,856Non-Metallic Mineral Ware 非金属鉱物製品 432 1,504 280 11,624 416 14,256Iron and Steel Products 鉄鋼 0 28,850 1,156 917 0 30,923Nonferrous Metals 非鉄金属 223 374 0 265 0 862Manufactures of Metals 金属製品 25,168 96,628 162,608 123,679 18,372 426,455
Machinery, Transport Equip. 機械類及び輸送用機器 1,338,660 1,136,199 1,283,584 1,167,743 1,270,070 6,196,256Machinery 一般機械 134,679 178,734 187,664 33,101 372,369 906,547Electrical machinery 電気機器 318,475 175,306 18,527 11,697 76,217 600,222Transport Equipment 輸送用機器 885,506 782,159 1,077,393 1,122,945 821,484 4,689,487・Railway Vehicles ・鉄道用車両 0 0 1,067 0 0 1,067・Motor Vehicles ・自動車 874,372 778,502 1,072,512 1,113,680 804,896 4,643,962・Parts of Motor Vehicle ・自動車の部分品 10,012 3,657 3,814 4,451 5,179 27,113・Cycles with Engines ・二輪自動車類 10,012 0 0 2,514 0 12,526・Other Vehicles ・その他の車両 0 0 0 2,300 11,409 13,709・Ships & Boats ・船舶類 1,122 0 0 0 0 1,122
Miscellaneous Manufactured Articles 雑製品 50,728 44,714 13,872 14,549 89,154 213,017Special Commodities (Re-Export Goods) 特殊取扱品 128,731 40,644 5,767 10,436 12,136 197,714Total 総額 1,613,611 1,469,055 1,507,645 1,374,840 1,438,232 7,403,383
⑩ Independent State of Samoa (サモア独立国) ● Japan's Export (サモアへの輸出)
(JPY1,000)
38

Items 品目 2016 2017 2018 2019 2020 TotalFood and Live Animals 食料品及び動物 90,516 48,089 42,633 18,531 19,007 218,776
Fish, Crustaceans, Molluscs 魚介類及び同調製品 64,386 25,742 6,833 0 0 96,961・Yellowfin Tunas, Fresh or Chilled ・きはだまぐろ(生鮮・冷蔵) 23,895 12,394 4,667 0 0 40,956・Bigeye Tunas, Fresh or Chilled ・めばちまぐろ(生鮮・冷蔵) 40,491 13,348 2,166 0 0 56,005
Fruits & Vegitables 果実及び野菜 21,534 11,069 25,486 14,856 19,007 91,952・Fruits ・果実 21,242 11,069 25,486 14,856 19,007 91,660・Other Fruits & Vegitables (Flour of Breadfruit) ・その他(パンノ実粉) 292 0 0 0 0 292
Coffee, Tea, Cocoa & Spices コーヒー、茶、ココア、香辛料 4,596 11,278 10,314 3,675 0 29,863・Cacao beans ・カカオ豆 4,596 11,278 10,314 3,675 0 29,863
Beverages and Tabacco 飲料及びたばこ 1,702 0 0 0 0 1,702Beverages 飲料 1,702 0 0 0 0 1,702
Animals & Vegetable Oil, Fat 動植物性油脂 0 0 542 0 0 542Machinery, Transport Equip. 機械類及び輸送用機器 0 0 247 638 222 1,107Manufactured Products 雑製品 1,828 2,859 10,840 5,416 0 20,943Special Commodities (Re-Import Goods etc) 特殊取扱品 850 8,035 12,525 203,898 25,872 251,180Total 総額 94,896 58,983 66,787 228,483 45,101 494,250
● Japan's Import (サモアからの輸入)(JPY1,000)
39

Items 品目 2016 2017 2018 2019 2020 TotalFood and Live Animals 食料品及び動物 458 238 37,491 39,718 0 77,905Crude Materials 原材料 972 6,110 220 0 216 7,518Mineral Fuels 鉱物性燃料 1,320 0 0 261,955 297,643 560,918Chemicals 化学製品 3,949 2,725 5,675 217 204 12,770Manufactured Goods 原料別製品 311,262 231,011 130,363 60,448 139,106 872,190
Rubber Manufatured ゴム製品 4,248 17,226 4,338 2,819 4,056 32,687Wood & Cork Manufactured 木製品及びコルク製品 0 3,045 927 0 0 3,972Paper & Paper Manufactures 紙類及び同製品 0 288 0 0 733 1,021Textile Yarn, Fabrics 織物用糸及び繊維製品 213,963 89,307 4,456 47,226 98,034 452,986Non-Metallic Mineral Ware 非金属鉱物製品 2,239 5,303 780 0 420 8,742Iron and Steel Products 鉄鋼 30,088 8,436 3,548 226 27,744 70,042Nonferrous Metals 非鉄金属 435 230 0 738 0 1,403Manufactures of Metals 金属製品 60,289 107,176 116,314 9,439 8,119 301,337
Machinery, Transport Equip. 機械類及び輸送用機器 1,883,221 1,435,643 1,646,191 1,109,394 931,421 7,005,870Machinery 一般機械 631,535 348,917 348,408 296,254 250,059 1,875,173Electrical machinery 電気機器 45,342 29,763 33,633 25,376 22,322 156,436Transport Equipment 輸送用機器 1,206,344 1,056,963 1,264,150 787,764 659,040 4,974,261・Railway Vehicles ・鉄道用車両 1,900 480 210 0 0 2,590・Motor Vehicles ・自動車 1,060,427 1,041,498 1,197,512 782,916 657,779 4,740,132・Parts of Motor Vehicle ・自動車の部分品 1,435 2,940 3,825 0 0 8,200・Cycles with Engines ・二輪自動車類 0 2,745 6,353 4,848 1,261 15,207・Bicycles & Parts Thereof ・自転車及び同部分品 940 0 0 0 0 940・Ships & Boats ・船舶類 141,642 9,300 56,250 0 0 207,192
Miscellaneous Manufactured Articles 雑製品 49,244 26,835 37,863 24,088 24,648 162,678Special Commodities (Re-Export Goods) 特殊取扱品 41,102 66,052 23,642 24,905 19,092 174,793Total 総額 2,291,528 1,768,614 1,881,445 1,520,725 1,412,330 8,874,642
⑪ Solomon Islands (ソロモン諸島) ● Japan's Export (ソロモン諸島への輸出)
(JPY1,000)
40

Items 品目 2016 2017 2018 2019 2020 TotalFood and Live Animals 食料品及び動物 247,834 274,171 555,313 338,282 61,458 1,477,058
Live Animals 生きた動物 1,918 1,648 1,591 3,006 2,675 10,838Fish, Crustaceans, Molluscs 魚介類及び同調製品 240,419 272,523 553,722 335,276 58,783 1,460,723
・Yellowfin Tunas, Fresh or Chilled ・きはだまぐろ(生鮮・冷蔵) 215 0 0 0 0 215・Bigeye Tunas, Fresh or Chilled ・めばちまぐろ(生鮮・冷蔵) 273 0 0 0 0 273・Yellowfin Tunas, Frozen ・きはだまぐろ(冷凍) 239,931 266,485 434,065 227,245 33,802 1,201,528・Stripbellied Bonito, Frozen ・かつお(冷凍) 0 0 4,671 23,259 8,472 36,402・Bigeye Tunas, Frozen ・めばちまぐろ(冷凍) 0 0 114,986 69,586 8,057 192,629・Swordfish, Frozen ・めかじき(冷凍) 0 0 0 4,418 0 4,418・Other Fish, Frozen ・その他の魚(冷凍) 0 0 0 903 0 903・Fillet & Meat of Fish, Frozen ・魚のフィレ(冷凍) 0 6,038 0 9,865 8,452 24,355
Feeding-Stuff for Animals 飼料 5,497 0 0 0 0 5,497Crude Materials 原材料 134,261 176,602 0 0 0 310,863
Woods, Lumber & Cork Products 木材、コルク 134,261 174,026 0 0 0 308,287Other Animal Raw Materials その他の動物性原材料 0 2,576 0 0 0 2,576
Animals & Vegetable Oil, Fat 動植物性油脂 2,329 855 0 0 0 3,184Manufactured Goods 原料別製品 264 0 0 0 0 264
Rubber Manufactured ゴム製品 264 0 0 0 0 264Machinery, Transport Equip. 機械類及び輸送用機器 0 0 424 0 0 424Manufactured Products 雑製品 0 439 17,678 302 971 19,390Special Commodities (Re-Import Goods etc) 特殊取扱品 177,548 140,858 103,171 0 0 421,577Total 総額 562,236 592,925 676,586 338,584 62,429 2,232,760
● Japan's Import (ソロモン諸島からの輸入)(JPY1,000)
41

Items 品目 2016 2017 2018 2019 2020 TotalFood and Live Animals 食料品及び動物 0 0 2,969 24,850 12,278 40,097Crude Materials 原材料 0 0 0 371 0 371Chemicals 化学製品 0 4,057 3,616 1,604 1,333 10,610Manufactured Goods 原料別製品 103,366 48,955 239,570 86,002 4,267 482,160
Rubber Manufatured ゴム製品 0 1,791 201 0 0 1,992Wood & Cork Manufactured 木製品及びコルク製品 0 549 1,210 376 0 2,135Paper & Paper Manufactures 紙類及び同製品 0 540 360 0 0 900Textile Yarn, Fabrics 織物用糸及び繊維製品 0 2,940 4,030 49,335 1,235 57,540Non-Metallic Mineral Ware 非金属鉱物製品 0 9,100 813 678 0 10,591Iron and Steel Products 鉄鋼 102,415 0 873 1,047 0 104,335Nonferrous Metals 非鉄金属 0 0 0 5,735 0 5,735Manufactures of Metals 金属製品 951 34,035 232,083 28,831 3,032 298,932
Machinery, Transport Equip. 機械類及び輸送用機器 431,275 610,735 1,190,214 1,257,867 666,625 4,156,716Machinery 一般機械 19,405 63,885 67,534 37,128 68,854 256,806Electrical machinery 電気機器 3,279 41,179 665,763 876,057 263,248 1,849,526Transport Equipment 輸送用機器 408,591 505,671 456,917 344,682 334,523 2,050,384・Railway Vehicles ・鉄道用車両 0 0 600 0 0 600・Motor Vehicles ・自動車 408,591 501,843 455,817 344,682 334,523 2,045,456・Parts of Motor Vehicle ・自動車の部分品 0 775 0 0 0 775・Cycles with Engines ・二輪自動車類 0 976 0 0 0 976・Bicycles & Parts Thereof ・自転車及び同部分品 0 547 0 0 0 547・Other Vehicles ・その他の車両 0 1,530 500 0 0 2,030
Miscellaneous Manufactured Articles 雑製品 5,633 30,710 46,491 4,383 19,706 106,923Special Commodities (Re-Export Goods) 特殊取扱品 21,550 13,371 17,934 13,519 73,091 139,465Total 総額 561,824 707,828 1,500,794 1,388,596 777,300 4,936,342
⑫ Kingdom of Tonga (トンガ王国) ● Japan's Export (トンガへの輸出)
(JPY1,000)
42

Items 品目 2016 2017 2018 2019 2020 TotalFood and Live Animals 食料品及び動物 308,888 179,521 164,079 106,577 59,715 818,780
Fish, Crustaceans, Molluscs 魚介類及び同調製品 118,564 145,495 87,921 63,354 34,521 449,855・Live Fish ・生きている魚(観賞用) 0 0 220 0 0 220・Yellowfin Tunas, Fresh or Chilled ・きはだまぐろ(生鮮・冷蔵) 103,000 136,805 74,247 50,669 27,026 391,747・Bigeye Tunas, Fresh or Chilled ・めばちまぐろ(生鮮・冷蔵) 10,290 6,831 9,383 4,514 593 31,611・Bluefin Tunas, Fresh or Chjlled ・くろまぐろ(生鮮・冷蔵) 0 0 741 0 0 741・Swordfish, Fresh or Chilled ・めかじき(生鮮・冷蔵) 584 0 0 0 0 584・Other Fish, Fresh or Chilled ・その他の魚(生鮮・冷蔵) 3,079 0 0 0 0 3,079・Other Fish, Crustaceans, Molluscs ・その他の魚介類 1,611 1,859 3,330 8,171 6,902 21,873
Fruits & Vegitables 果実及び野菜 190,324 33,815 76,158 43,223 25,194 368,714・Squash ・かぼちゃ 188,339 14,228 66,419 27,873 4,784 301,643・Other Fruits ・その他の果実 1,985 1,002 0 0 1,161 4,148・Sea weed (mozuku) ・海藻(もずく) 0 18,585 8,520 15,350 19,249 61,704
Coffee, Tea, Cocoa & Spices コーヒー、茶、ココア、香辛料 0 211 0 0 0 211・Cacao beans ・カカオ豆 0 211 0 0 0 211
Manufactured Goods 原料別製品 0 2,103 0 0 0 2,103Non-Metallic Mineral Ware 非金属鉱物製品 0 2,103 0 0 0 2,103
Machinery, Transport Equip. 機械類及び輸送用機器 0 293 1,075 0 0 1,368Manufactured Products 雑製品 0 0 345 1,005 0 1,350Special Commodities (Re-Import Goods etc) 特殊取扱品 0 95,099 7,271 50,287 0 152,657Total 総額 308,888 277,016 172,770 157,869 59,715 976,258
● Japan's Import (トンガからの輸入)(JPY1,000)
43

Items 品目 2016 2017 2018 2019 2020 TotalMineral Fuels 鉱物性燃料 0 0 0 0 12,003 12,003Chemicals 化学製品 1,041 0 0 262 0 1,303Manufactured Goods 原料別製品 4,562 250 1,043 242 607 6,704
Rubber Manufatured ゴム製品 2,598 0 703 242 226 3,769Iron and Steel Products 鉄鋼 386 0 0 0 0 386Nonferrous Metals 非鉄金属 468 0 0 0 0 468Manufactures of Metals 金属製品 1,110 250 340 0 381 2,081
Machinery, Transport Equip. 機械類及び輸送用機器 1,707,340 2,013,293 2,224,772 2,175,705 2,743,563 10,864,673Machinery 一般機械 28,026 21,447 13,429 23,125 19,369 105,396Electrical machinery 電気機器 5,518 797 1,094 9,498 8,954 25,861Transport Equipment 輸送用機器 1,673,796 1,991,049 2,210,249 2,143,082 2,715,240 10,733,416・Motor Vehicles ・自動車 10,961 8,364 12,378 11,061 9,108 51,872・Aircraft ・航空機類 573 0 0 990 284 1,847・Ships & Boats * ・船舶類 * 1,662,262 1,982,685 2,197,871 2,131,031 2,705,848 10,679,697
Miscellaneous Manufactured Articles 雑製品 244 750 1,610 6,871 444 9,919Special Commodities (Re-Export Goods) 特殊取扱品 0 105,322 0 610 800 106,732Total 総額 1,713,187 2,119,615 2,227,425 2,183,690 2,757,417 11,001,334
* Mainly cargo ships and passenger boats * 主に貨物船、客船
⑬ Tuvalu (ツバル) ● Japan's Export (ツバルへの輸出)
(JPY1,000)
44

Items 品目 2016 2017 2018 2019 2020 TotalFood and Live Animals 食料品及び動物 222,081 229,864 247,115 114,427 60,788 874,275
Fish, Crustaceans, Molluscs 魚介類及び同調製品 222,081 229,864 247,115 114,427 60,788 874,275・Albacore or Longfinnes Tuna, Frozen ・びんながまぐろ(冷凍) 30,444 60,584 52,257 25,350 24,413 193,048・Yellowfin Tunas, Frozen ・きはだまぐろ(冷凍) 72,170 98,021 136,940 54,642 18,738 380,511・Bigeye Tunas, Frozen ・めばちまぐろ(冷凍) 116,088 68,857 56,777 32,995 16,835 291,552・Swordfish, Frozen ・めかじき(冷凍) 3,379 2,402 1,141 704 802 8,428・Other Fish, Frozen ・その他の魚(冷凍) 0 0 0 736 0 736
Machinery, Transport Equip. 機械類及び輸送用機器 0 1,898 0 0 0 1,898Manufactured Products 雑製品 0 0 0 352 0 352Special Commodities (Re-Import Goods etc) 特殊取扱品 750 0 0 0 0 750Total 総額 222,831 231,762 247,115 114,779 60,788 877,275
● Japan's Import (ツバルからの輸入)(JPY1,000)
45

Items 品目 2016 2017 2018 2019 2020 TotalFood and Live Animals 食料品及び動物 476 5,329 0 287 0 6,092Beverages and Tabacco 飲料及びたばこ 0 7,563 0 0 0 7,563Crude Materials 原材料 0 0 0 0 676 676Mineral Fuels 鉱物性燃料 0 0 0 291,778 408,742 700,520Chemicals 化学製品 8,348 3,200 1,269 0 924 13,741Manufactured Goods 原料別製品 353,688 16,182 21,830 2,608 5,463 399,771
Rubber Manufatured ゴム製品 5,701 6,286 5,419 233 1,838 19,477Wood & Cork Manufactured 木製品及びコルク製品 0 0 0 0 427 427Paper & Paper Manufactures 紙類及び同製品 0 1,621 237 0 0 1,858Textile Yarn, Fabrics 織物用糸及び繊維製品 2,682 1,004 660 750 364 5,460Non-Metallic Mineral Ware 非金属鉱物製品 722 466 0 0 341 1,529Iron and Steel Products 鉄鋼 123,072 0 6,169 0 1,286 130,527Nonferrous Metals 非鉄金属 1,424 0 0 0 0 1,424Manufactures of Metals 金属製品 220,087 6,805 9,345 1,625 1,207 239,069
Machinery, Transport Equip. 機械類及び輸送用機器 3,385,316 3,500,880 1,137,981 632,644 522,986 9,179,807Machinery 一般機械 181,734 74,573 170,419 76,111 151,309 654,146Electrical machinery 電気機器 18,417 5,634 1,253 495 75,772 101,571Transport Equipment 輸送用機器 3,185,165 3,420,673 966,309 556,038 295,905 8,424,090・Motor Vehicles ・自動車 542,874 786,455 964,402 554,846 294,097 3,142,674・Parts of Motor Vehicle ・自動車の部分品 85,783 733 679 1,192 1,808 90,195・Cycles with Engines ・二輪自動車類 1,508 2,556 1,228 0 0 5,292・Ships & Boats * ・船舶類 * 2,555,000 2,630,929 0 0 0 5,185,929
Miscellaneous Manufactured Articles 雑製品 13,574 11,825 17,627 8,858 104,035 155,919Special Commodities (Re-Export Goods) 特殊取扱品 20,151 30,563 30,175 27,709 11,083 119,681Total 総額 3,781,553 3,575,542 1,208,882 963,884 1,053,909 10,583,770
* Mainly cargo ships and passenger boats * 主に貨物船、客船
⑭ Republic of Vanuatu (バヌアツ共和国) ● Japan's Export (バヌアツへの輸出)
(JPY1,000)
46

Items 品目 2016 2017 2018 2019 2020 TotalFood and Live Animals 食料品及び動物 7,689,579 7,572,945 7,425,067 6,005,671 4,482,844 33,176,106
Meat & Meat Preparation 肉類及び同調製品 103,257 92,014 36,529 40,351 50,090 322,241・Boneless Meat of Bovine Animals, Frozen ・牛の骨つきでない肉(冷凍) 103,008 91,759 36,529 40,351 50,090 321,737・Edible Offal of Bovine Animals, Frozen ・食用の牛の舌・肝臓以外のくず(冷凍) 249 255 0 0 0 504
Fish, Crustaceans, Molluscs 魚介類及び同調製品 7,586,322 7,480,931 7,386,329 5,961,026 4,431,908 32,846,516・Live Fish ・生きている魚(観賞用) 2,194 1,389 636 0 0 4,219・Albacore or Longfinnes Tuna, Frozen ・びんながまぐろ(冷凍) 1,295,607 1,590,438 1,329,230 953,116 608,142 5,776,533・Yellowfin Tunas, Frozen ・きはだまぐろ(冷凍) 981,091 739,596 1,069,050 766,730 643,110 4,199,577・Stripbellied Bonito, Frozen ・かつお(冷凍) 1,150 1,956 0 0 0 3,106・Bigeye Tunas, Frozen ・めばちまぐろ(冷凍) 4,721,300 4,493,224 4,080,970 3,325,264 2,395,070 19,015,828・Swordfish, Frozen ・めかじき(冷凍) 296,624 227,656 278,657 490,978 408,996 1,702,911・Other Fish, Frozen ・その他の魚(冷凍) 58,587 20,365 47,172 37,952 38,916 202,992・Fillet & Meat of Fish, Frozen ・魚のフィレ(冷凍) 229,769 346,005 580,614 386,986 337,674 1,881,048
Coffee, Tea, Cocoa & Spices コーヒー、茶、ココア、香辛料 0 0 2,209 4,294 846 7,349・Cacao Beans ・カカオ豆 0 0 2,209 3,233 0 5,442・Chocolate confectionery ・チョコレート菓子 0 0 0 861 846 1,707
Crude Materials 原材料 29,647 15,875 6,717 22,880 211 75,330Woods, Lumber & Cork Products 木材、コルク 0 8,718 6,717 0 0 15,435Other Animal Raw Materials その他の動物性原料(動物の内臓) 0 2,585 0 0 0 2,585Other Vegetable Raw Materials その他の植物性原料 29,647 4,572 0 22,880 211 57,310
Chemicals 化学製品 2,702 0 0 227 0 2,929Essential oils, Perfume 精油・香料及び化粧品類 2,702 0 0 227 0 2,929
Manufactured Goods 原料別製品 30,620 0 0 0 0 30,620Nonferrous Metals 非鉄金属 30,620 0 0 0 0 30,620
Machinery, Transport Equip. 機械類及び輸送用機器 216 0 213 0 0 429Manufactured Products 雑製品 0 974 0 4,252 0 5,226Special Commodities (Re-Import Goods etc) 特殊取扱品 23,886 152,980 0 1,040 0 177,906Total 総額 7,776,650 7,742,774 7,431,997 6,034,070 4,483,055 33,468,546
● Japan's Import (バヌアツからの輸入)(JPY1,000)
47

2016平成 28 年
2017平成 29 年
2018平成 30 年
2019平成 31 年 / 令和元年
2020令和 2 年
Value金額
Value金額
Value金額
Value金額
Value金額
Cook Is. クック諸島FSM ミクロネシア連邦 743 489 -2327 -1325 65Fiji フィジー -23 -8Kiribati キリバスMarshall is. マーシャル諸島 429 57 117 253 156Nauru ナウルNiue ニウエPalau パラオ 7 8 4 3 6PNG パプアニューギニア 2 1 3Samoa サモア 1 2 38 1 1Solomon Is. ソロモン諸島 1Tonga トンガ 4Tuvalu ツバルVanuatu バヌアツ -4Total 合計 1178 557 -2191 -1072 232
(出典)「国際収支状況」(財務省)(Source) the Balance of Payments Statistics (Ministry of Finance)
(注) 本統計は、「外国為替及び外国貿易法」に基づく、対外直接投資及び対内直接投資の届出書及び報告書をもとに作成したものです。なお、1 億円相当額以下の対外直接投資については、当該報告の対象外であるため、本統計には反映されていません。 また、「国際収支統計」において、財務省の「海外投資直接統計」では、国別かつ業種別に係る直接投資の件数を、平成 17 年第 1 四半期(1 月~ 3 月期)分から公表しないことになり、これにより、投資金額のみの統計となります。
(Note) These statistics were compiled based on figures notified and reported under the Foreign Exchange and Foreign Trade Law. It should be noted, that foreign direct investment below the minimum reporting threshold (i.e., 100 million yen or its equivalent) is not reflected in the statistics. Starting from the first quarter of CY 2005 (i.e., January-March 2005), figures on foreign direct investment by region and industry are included in the Balance of Payments Statistics. After the FDI statistics for FY2004,number of cases will be discontinued and reflects only value.
3. Japan's Foreign Direct Investment to FICs (2016 ~ 2020) (Source:MOF) (日本の対太平洋島嶼国への直接投資の推移、2016 年~ 2020 年)(出所:財務省)
(Unit : 100 Million Yen)(単位:億円)
48

2009 2010 2011 2012 2013 2014 2015 2016 2017 2018Cook Islands クック諸島 N/A N/A N/A 239 374 413 286 502 559 400FSM ミクロネシア連邦 4,198 4,387 4,125 4,939 4,570 4,126 3,604 2,797 N/A N/AFiji フィジー 14,745 12,600 9,616 7,069 7,314 5,888 6,092 6,274 6,350 11,903Kiribati キリバス 234 244 236 200 216 187 143 205 179 196Marshall Islands マーシャル諸島 1,349 557 435 448 358 372 401 424 420 N/ANauru ナウル N/A N/A N/A N/A N/A N/A N/A N/A N/A N/ANiue ニウエ 14 13 24 11 30 49 36 100 160 N/APalau パラオ 26,688 29,318 37,800 39,353 35,642 37,427 31,026 29,237 26,031 22,416PNG パプアニューギニア 3,051 3,504 3,500 3,492 3,167 3,117 3,038 3,001 2,969 3,994Samoa サモア 600 510 532 688 452 632 607 724 733 745Solomon islands ソロモン諸島 873 792 641 614 601 505 581 552 715 805Tonga トンガ 664 500 541 687 600 644 826 802 819 733Tuvalu ツバル 397 377 150 107 153 84 169 148 134 N/AVanuatu バヌアツ 643 517 630 705 659 763 633 903 1,076 963Total (FICs) FICs 総計 53,007 53,319 58,248 58,552 54,136 54,207 47,442 45,669 40,145 42,155French Polynesia 仏領ポリネシア 16,353 13,761 12,990 12,989 13,175 12,527 11,447 12,174 12,808 9,912New Caledonia ニューカレドニア 18,926 18,534 18,455 17,430 15,674 19,087 20,056 21,151 21,839 21,472Guam グアム 825,129 893,667 824,005 923,124 893,118 810,856 773,019 745,680 620,376 566,588Northern Mariana 北マリアナ 191,111 185,032 142,926 153,259 141,747 110,234 80,832 61,026 50,944 27,291Australia 豪州 348,460 390,550 325,740 348,050 324,320 326,430 337,210 417,880 434,500 469,230New Zealand ニュージーランド 78,426 87,735 68,963 72,080 74,560 81,136 87,328 100,736 102,048 99,784
(出典:国連世界観光機関(UNWTO)、ただしミクロネシア連邦のみ政府観光局)(Source: World Tourism Organization, except FSM after 2008 (from FSM National Tourism Office)
4. Visitors Arrivals from Japan to Forum Island Countries (2009-2018) (国別日本人訪問客数、2009 年~ 2018 年)
49

(人/person)
0
10,000
20,000
30,000
40,000
50,000
60,000
70,000
20182009 2010 2011 2012 2013 2014 2015 20172016
ニューカレドニア(New Caledonia)
フィジー(Fiji)仏領ポリネシア(French Polynesia)
パラオ(Palau)FICs総計(Total number of FICs)
クック諸島 / Cook Is.
ミクロネシア連邦 / FSM
フィジー / Fiji
キリバス / Kiribati
マーシャル諸島 / M
arshall Is.
ナウル / N
auru
ニウエ / N
iue
パラオ / Palau
パプアニューギニア / PN
G
サモア / Sam
oa
ソロモン諸島 / Solom
on Is.
トンガ / Tonga
ツバル / Tuvalu
バヌアツ / Vanuatu
0
(人/person)
1,000
2,000
3,000
5,000
4,000
15,000
10,000
20,000
25,000
400N/A
11,903
196 N/A N/A N/A
22,416
3,994
745 805 733
N/A
963
Japanese Overseas Travelers by Destination (2018)
国別日本人訪問客数(2018)
Visitors Arrivals from Japan To FICs, French Polynesia and New Caledonia (2009-2018)
日本人訪問客数増減動向(2009-2018)
仏領ポリネシア
パラオ
ニューカレドニア
フィジー
総計
50

(人/person)
0
10,000
20,000
30,000
40,000
50,000
60,000
70,000
20182009 2010 2011 2012 2013 2014 2015 20172016
ニューカレドニア(New Caledonia)
フィジー(Fiji)仏領ポリネシア(French Polynesia)
パラオ(Palau)FICs総計(Total number of FICs)
クック諸島 / Cook Is.
ミクロネシア連邦 / FSM
フィジー / Fiji
キリバス / Kiribati
マーシャル諸島 / M
arshall Is.
ナウル / N
auru
ニウエ / N
iue
パラオ / Palau
パプアニューギニア / PN
G
サモア / Sam
oa
ソロモン諸島 / Solom
on Is.
トンガ / Tonga
ツバル / Tuvalu
バヌアツ / Vanuatu
0
(人/person)
1,000
2,000
3,000
5,000
4,000
15,000
10,000
20,000
25,000
400N/A
11,903
196 N/A N/A N/A
22,416
3,994
745 805 733
N/A
963
Japanese Overseas Travelers by Destination (2018)
国別日本人訪問客数(2018)
Visitors Arrivals from Japan To FICs, French Polynesia and New Caledonia (2009-2018)
日本人訪問客数増減動向(2009-2018)
仏領ポリネシア
パラオ
ニューカレドニア
フィジー
総計
Pacific Trade Invest(PTI)
PTIは太平洋島嶼地域の貿易や投資、観光分野における活動を促進するための機関で、世界6都市-シドニー(オーストラリア)、オークランド(ニュージーランド)、北京(中国)、ジュネーブ(スイス)、スバ(フィジー)にオフィスがあります。当センターもPTIネットワークの一つとして参加しています。各オフィスのコンタクト先は以下の通りです。
URL TEL
PTI Sydney (Australia) https://pacifictradeinvest.com/contact-us +61 2 9290 2133
PTI Aucland (New Zealand) https://www.pacifictradeinvest.co.nz/ +64 9 529 5165
PTI Beijing (China) http://www.pacifictradeinvest.org.cn/contact/ +86 10 6532 6622
PTI Europe (Geneva, CHE) https://global.pacifictradeinvest.com/contact/ +41 2 2730 1722
PTI Suva (Fiji) https://global.pacifictradeinvest.com/contact/ +679 331 2600
PTI Tokyo (Japan)(PIC) https://pic.or.jp/ +81 3 5259 8419
PTI Global Network Offices
URL: https://pacifictradeinvest.com/Email:[email protected]

太平洋諸島センター国際機関International Organization
Pacific Islands CentreShikonkan 1st Floor of Meiji University, 3-22-14, Kandaogawamachi,
Chiyoda-ku, Tokyo 101-0052Phone: (+81) 3-5259-8419 Fax: (+81) 3-5259-8429
URL: https://www.pic.or.jp/en/Email: [email protected]
〒101-0052 東京都千代田区神田小川町3-22-14 明治大学紫紺館1階Tel: 03-5259-8419 Fax: 03-5259-8429
URL: https://www.pic.or.jp/Email: [email protected]