STATISTICAL HANDBOOK FOR THE YEAR 2008megplanning.gov.in/handbook/jaintia_2008.pdfPREFACE The...
48
PREFACE The publication of District Statistical Handbook 2008 is the tenth in its series brought out by the office of the District Statistical Officer, Jowai under the Guidance of the Directorate of Economics and Statistics, Meghalaya Shillong. The Handbook seeks to provide statistical information on socio-economic aspect of the District based on currently available data for the interested individuals, policy makers, planners, research scholars and other users. The co-operation extended by various Government Departments in providing the required information for this Publication is gratefully acknowledged. It has always been our endeavour to improve the publication. Hence, suggestions / comments regarding the contents as well as presentation of the data in this publication are most welcome. Dated: ( K. Nongkynrih ) District Statistical Officer, Jaintia Hills District, Jowai.
Transcript of STATISTICAL HANDBOOK FOR THE YEAR 2008megplanning.gov.in/handbook/jaintia_2008.pdfPREFACE The...
PREFACE The publication of District Statistical Handbook 2008 is the tenth in its series
brought out by the office of the District Statistical Officer, Jowai under the Guidance of the
Directorate of Economics and Statistics, Meghalaya Shillong. The Handbook seeks to
provide statistical information on socio-economic aspect of the District based on currently
available data for the interested individuals, policy makers, planners, research scholars and
other users.
The co-operation extended by various Government Departments in
providing the required information for this Publication is gratefully acknowledged. It has
always been our endeavour to improve the publication. Hence, suggestions / comments
regarding the contents as well as presentation of the data in this publication are most
welcome.
Dated: ( K. Nongkynrih ) District Statistical Officer, Jaintia Hills District,
Jowai.

Jaintia Hills
BANGLADESH
EAST KHASI HILLS
ASSAM

CONVERSION TABLE
WEIGHTS
1 Grain = 0.065 Grams 1 Gram = 0.03570 Ounces = 0.085735 Tolas 1 Ounce = 28.350 Grams 1 Pound = 0.4536 Kilograms 1 Kilogram = 2.20462 Pounds 1Quintal = 100 Kilograms 1 Tonne = 10 Quintals = 0.98420 Tons 1 Ton = 1.01605 Tonnes = 0.508024 Quintals 1 Cwt = 50.802 Kilograms
LENGTH 1 Centimetre = 0.393701 Inches 1 Inch = 25.4 Millimetres = 0.0254 Metres 1 Foot = 0.3048 Metres = 3048 Centimetres 1 Metre = 1.09361 Yards 1Yard = 0.0144 Metres 1 Mile = 1.609344 Kilometres 1 Kilometre = 0.62137 Miles

CAPACITY AND VOLUME
1 Gallon (Imperial) = 4.54596 Litres 1 Gallon (U.S.) = 3.78533 Litres = 0.83268 Gallons (Imperial) 1 Litre = 0.219967 Gallons (Imperial) 1 Cubic Foot = 28.3168 Cubic Decimetres = 0.028 Cubic Metres 1 Cubic Metre = 1.30795 Cubic Yards 1 Cubic Yard = 0.76455 Cubic Metres
AREA 1 Square Inch = 6.4516 Square Centimetres 1 Square Foot = 0.092903 Square Metres 1 Square Yard = 0.836131 Square Metres 1 Square Metre = 1.19599 Square Yards 1 Acre = 0.404686 Hectares = 3.025 Bighas = 4.840 Square Yards 1 Square Mile = 2.58999 Square Kilometres = 640 Acres 1 Square Kilometre = 100 Hectares = 247 Acres = 0.386101 Square Miles 1 Hectare = 10000 Square Metres = 7.46993 Bighas = 2.47105 Acres 1 Bigha = 0.13387 Hectares = 0.33058 Acres

ALTITUDE OF DIFFERENT PLACES IN JAINTIA HILLS
Places Altitude in Metres
1. Jowai 1365
2. Dawki 150
3. Khliehriat 1200
4. Alarem 1080
5. Thadlaskein 1350
6. Laskein 1280
7. Nartiang 1215
8. Sutnga 1125
9. Bapung 1290
10. Shangpung 1275
11. Raliang 1315
12. Umkiang 175
13. Sonapur 225
14. Lumshnong 650
15. Khanduli 890
16. Wahiajer 1350
17. Muktapur 150
18. Nongtalang 690
19. Sokha 575
20. Jarain 1190
21. Pdengshakap 825
22. Mynso 1255
23. Namdong 1060
24. Sohkynphor 1260

ROAD DISTANCES FROM JOWAI TO OTHER DISTRICT HEAD QUARTERS IN
MEGHALAYA AND ALL AOMMUNITY DEVELOPMENT BLOCK HEAD QUARTERS OF JAINTIA HILLS
District Head Quarters
Distances (in Kms)
Shillong
65
Nongpoh
119
Nongstoin
162
Tura
389
Williamnagar
377
Jowai
To
Babhmara via
Tura
510
C&RD Block Headquarters
Distances (in Kms)
Thadlaskein
10
Laskein
35
Khliehriat
34
Amlarem
27
Jowai
To
Saipung
74

DISTANCE FROM JOWAI TO IMPORTANT PLACES ( Kms )
Jowai to:
Mukhla : 10 Namdong : 46 Thadlaskein : 10 Sahaniang : 48 Ummulong : 13 Iooksi : 50 Jarain : 21 Muktapur : 52 Shanpung : 21 Saphai : 55 Mynso : 25 Dawki : 59 Nartiang : 27 Shillong : 65 Amlarem : 27 New Garampani : 65 Raliang : 29 Lumshnong : 66 Rymbai : 34 Khanduli : 67 Khliehriat : 34 Umkiang : 94 Laskein : 35 Rata Chera : 112 Sutnga : 45 Silchar : 174
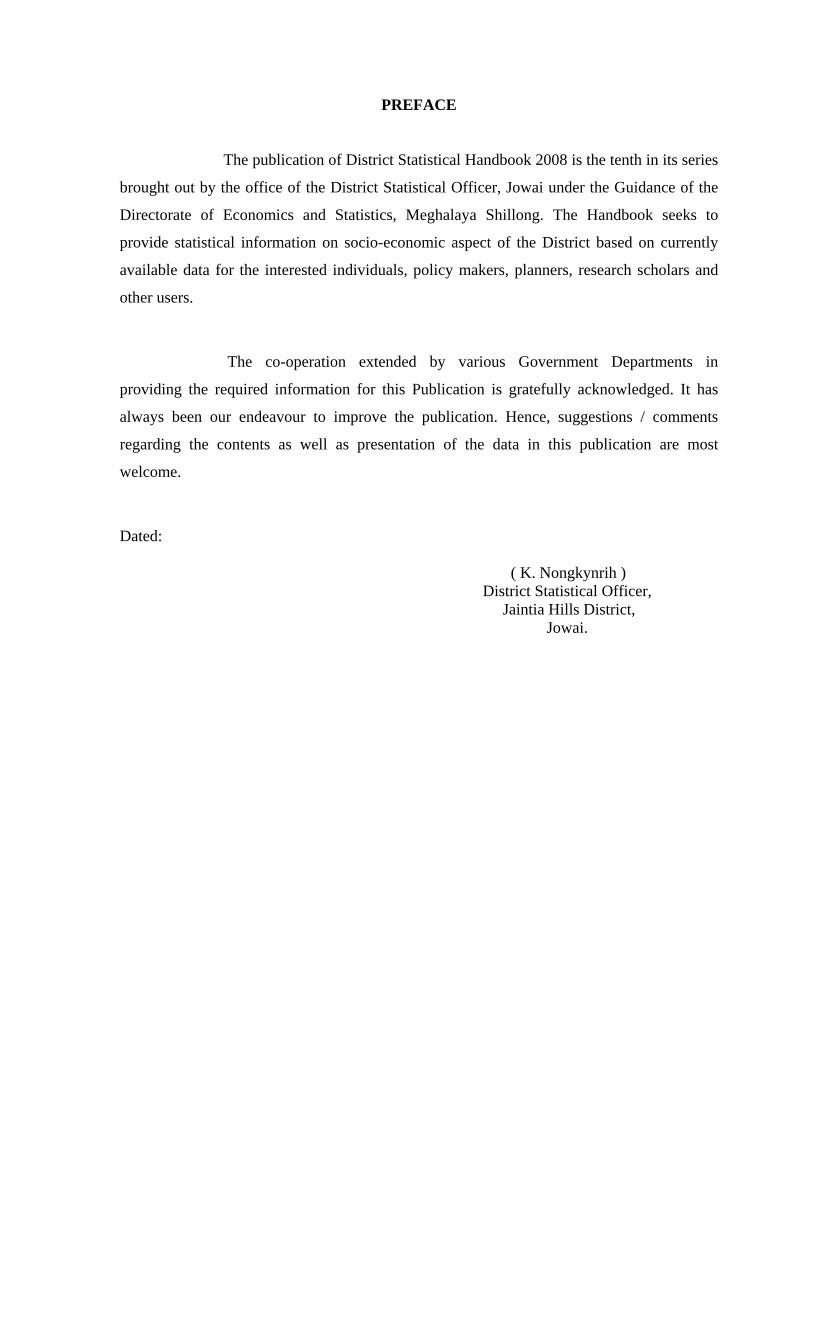
IMPORTANT MARKET IN THE DISTRICT:BLOCKWISE
Sl. No.
Name of Markets Distance from Block HQ (in
Kms)
Distance from District HQ.
1 2 3 4 1
Thadlaskein C&RD Block a) Ummulong b) Nartiang c) Khanduli
3
17
60
13
27
70
2
Laskein C&RD Block a) Mookaiaw b) Raliang c) Shangpung
3 6
14
38
29
21
3
Khliehriat C&RD Block a) Khliehriat b) Lad-Rymbai c) Rymbai d) Sutnga
0 5
10
10
34
30
40
45
4
Amlarem C&RD Block a) Jarain b) Muktapur c) Dawki
10
23
27
17
52
56
5
Saipung C&RD Block a) Semasi
15
96
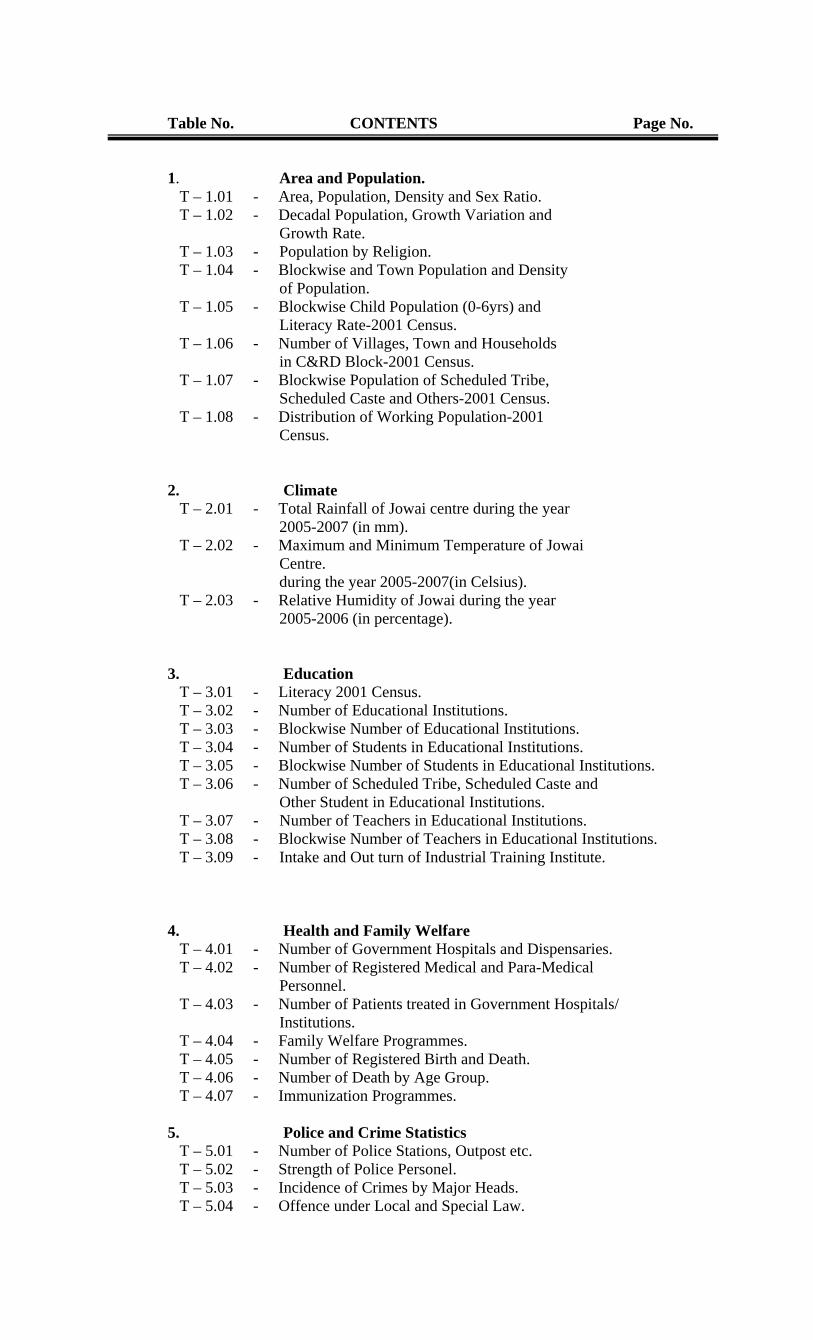
Table No. CONTENTS Page No. 1. Area and Population. T – 1.01 - Area, Population, Density and Sex Ratio. T – 1.02 - Decadal Population, Growth Variation and Growth Rate. T – 1.03 - Population by Religion. T – 1.04 - Blockwise and Town Population and Density of Population. T – 1.05 - Blockwise Child Population (0-6yrs) and Literacy Rate-2001 Census. T – 1.06 - Number of Villages, Town and Households in C&RD Block-2001 Census. T – 1.07 - Blockwise Population of Scheduled Tribe, Scheduled Caste and Others-2001 Census. T – 1.08 - Distribution of Working Population-2001 Census. 2. Climate T – 2.01 - Total Rainfall of Jowai centre during the year 2005-2007 (in mm). T – 2.02 - Maximum and Minimum Temperature of Jowai Centre. during the year 2005-2007(in Celsius). T – 2.03 - Relative Humidity of Jowai during the year 2005-2006 (in percentage). 3. Education T – 3.01 - Literacy 2001 Census. T – 3.02 - Number of Educational Institutions. T – 3.03 - Blockwise Number of Educational Institutions. T – 3.04 - Number of Students in Educational Institutions. T – 3.05 - Blockwise Number of Students in Educational Institutions. T – 3.06 - Number of Scheduled Tribe, Scheduled Caste and
Other Student in Educational Institutions. T – 3.07 - Number of Teachers in Educational Institutions. T – 3.08 - Blockwise Number of Teachers in Educational Institutions. T – 3.09 - Intake and Out turn of Industrial Training Institute. 4. Health and Family Welfare T – 4.01 - Number of Government Hospitals and Dispensaries. T – 4.02 - Number of Registered Medical and Para-Medical Personnel. T – 4.03 - Number of Patients treated in Government Hospitals/ Institutions. T – 4.04 - Family Welfare Programmes. T – 4.05 - Number of Registered Birth and Death. T – 4.06 - Number of Death by Age Group. T – 4.07 - Immunization Programmes. 5. Police and Crime Statistics T – 5.01 - Number of Police Stations, Outpost etc. T – 5.02 - Strength of Police Personel. T – 5.03 - Incidence of Crimes by Major Heads. T – 5.04 - Offence under Local and Special Law.

6. Social Welfare T – 6.01 - Number of Voluntary Organisation, Handicapped Person and Old Age-Pensioners receiving Grand-in-Aid. 7. Agriculture T – 7.01 - Land Utilisation Statistics. T – 7.02 - Area and Production of Important Crops. T – 7.03 - Yield Rates of Important Crops. T – 7.04 - Distribution of Fertilizers. 8. Animal Husbandry and Veterinary T – 8.01 - Livestock Census. T – 8.02 - Number of Veterinary Institution and Services. T – 8.03 - Production of Milk, Egg and Meat. 9. Sericulture T – 9.01 - Area under Plantation of Mulberry, Eri, Muga and Production of Cocoons. 10. Forest T – 10.01 - Geographical Area, Recorded Forest and Actual Forest Cover. T – 10.02 - Distribution (Classification ) of Recorded Forest Area T – 10.03 - Out turn and Value of Major Forest Production in the District. 11. Fisheries T – 11.01 - Production and Price of Inland Fish. T – 11.02 - Fish Seed Distribution. T – 11.03 - Fish Seed Farm Production of Spawn and Fry Fingerlings. 12. Minning T – 12.01 - Production and Value of important Minerals. 13. Co-operative T – 13.01 - Number of Co-operative Societies. 14. Industries T – 14.01 - Number of Small Scale Industries, Plant Machinery and Persons Employed. 15. Labour and Employment T – 15.01 - Registration of Employment through Divisional Employment Exchange. T – 15.02 - Number of Employment in Public Sector. T – 15.03 - Number of Employment in Private Sector. 16. Roads and Transport T – 16.01 - Road Length maintained by the P.W.D (Roads). T – 16.02 - Registration of Vehicles by Class of Ownership. T – 16.03 - Number of Road Accidents, Number of Person Killed and Injured. 17. Communication T – 17.01 - Number of Telegraphs and Post Office. T – 17.02 - Number of Telephone Exchange and Telephone Subscribers.

18. Tourism T – 18.01 - Number of Tourist Spots and Tourist Visiting. 19. Election T – 19.01 - Election to the Meghalaya Legislative Assembly, Jaintia Hills District. T – 19.02 - Total Number of Votes Polled during the last Legislative Assembly Election 2008. T – 19.03 - Number of Candidates in the Election to the Meghalaya Legislative Assembly, Jaintia Hills District. T – 19.04 - Number of Candidates who contested to Meghalaya Legislative Assembly. T – 19.05 - Election to the Jaintia Hills Autonomous District Council 2004. 20. Electricity T – 20.01 - Number of Villages Electrified. 21. Excise T – 21.01 - Consumption of Indian made Foreign Liquor and Local Liquor. 22. Supply T – 22.01 - Number of Fair Price Shops. 23. Finance T – 23.01 - Collection of Excise, Revenue, Sales Tax, Taxes on Petroleum, Motor Spirit etc.
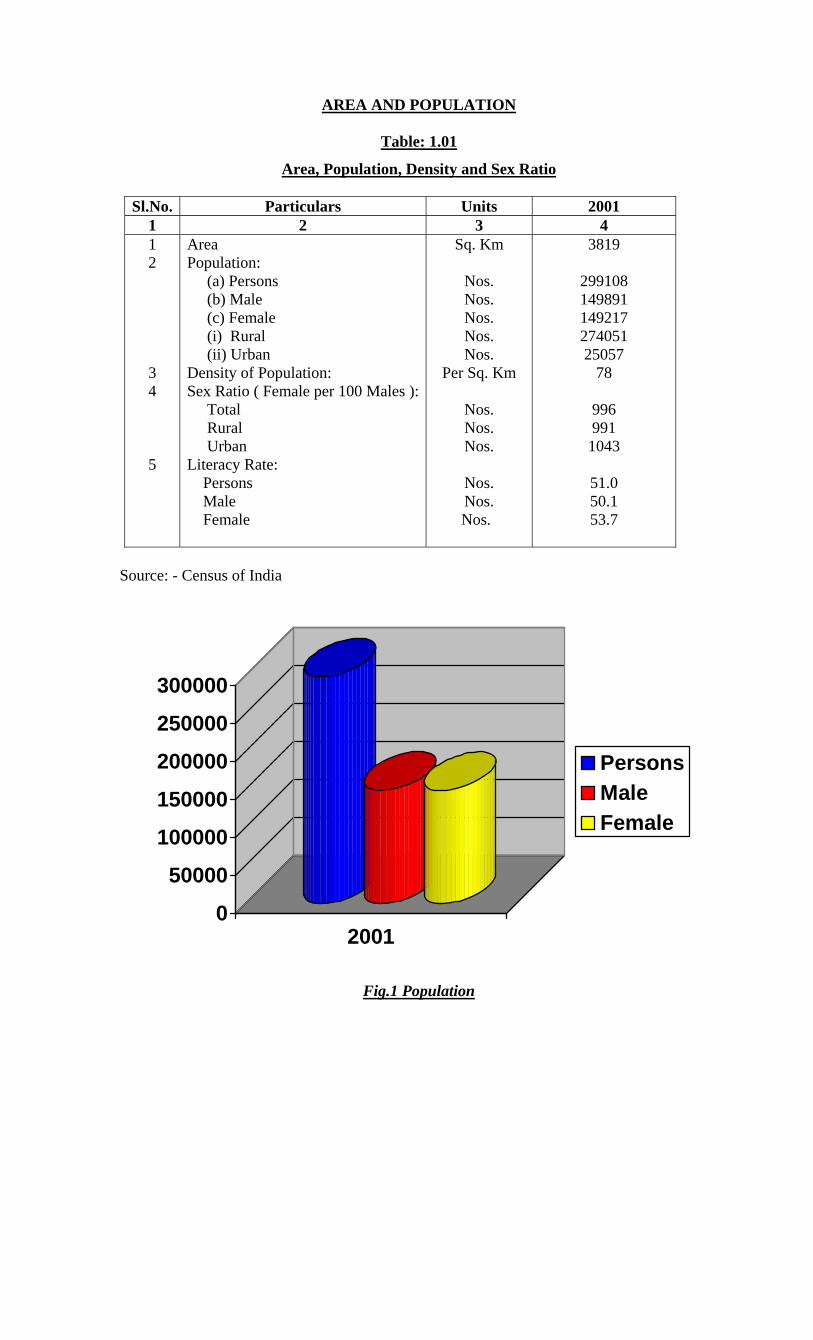
AREA AND POPULATION
Table: 1.01
Area, Population, Density and Sex Ratio
Sl.No. Particulars Units 2001 1 2 3 4 1 2 3 4 5
Area Population: (a) Persons (b) Male (c) Female (i) Rural (ii) Urban Density of Population: Sex Ratio ( Female per 100 Males ): Total Rural Urban Literacy Rate: Persons Male Female
Sq. Km
Nos. Nos. Nos. Nos. Nos.
Per Sq. Km
Nos. Nos. Nos.
Nos. Nos.
Nos.
3819
299108 149891 149217 274051 25057
78
996 991 1043
51.0 50.1 53.7
Source: - Census of India
0
50000
100000
150000
200000
250000
300000
2001
PersonsMaleFemale
Fig.1 Population

Table: 1.02
Decadal Population Growth Variation and Growth Rate
Sl.No. Particulars Units 1991 2001 1 2 3 4 5 1
Population: Total Rural Urban
Nos.
Nos.
Nos.
220473
199872
20601
299108
274051
25057 2
Variation: Total Rural Urban
P. c
P. c
P. c
40.97
39.3
59.4
35.67
37.1
21.6
3
Growth Rate: Total Rural Urban
Nos.
Nos.
Nos.
0.41
0.39
0.59
0.36
0.37
0.22 Source: - Census of India.
Table: 1.03
Population by Religion
2001-Census Sl. No.
Religion Total Male Female
1 2 3 4 5 6 Total 299108 149891 149217 Rural 274051 137629 136422
1
All religions
Urban 25057 12262 12795 Total 195196 96906 98290 Rural 179788 89540 90248
2
Christians
Urban 15408 7366 8042 Total 13150 7927 5223 Rural 11860 7135 4725
3
Hindus
Urban 1290 792 498 Total 2236 1394 842 Rural 1933 1215 718
4
Muslims
Urban 303 179 124 Total 42 33 9 Rural 42 33 9
5
Sikhs
Urban - - - Total 213 124 89 Rural 177 105 72
6
Buddhists
Urban 36 19 17 Total 28 16 12 Rural 11 5 6
7
Jains
Urban 17 11 6 Total 87827 43299 44537 Roral 79832 39399 40433
8
Others
Urban 7995 3891 4104

Total 416 201 215 Rural 408 197 211
9
Religion not stated
Urban 8 4 4 Source: - Census of India.
Table: 1.04
Blockwise and Town Population and Density of Population
Population Sl. No.
Names Block / Town Area Sq. Km Persons Male Female
Density of Population
1 2 3 4 5 6 7 1 Thadlaskein 896.60 79563 39303 40260 89 2 Laskein 390.40 65726 32886 32840 168 3 Khliehriat 1280 64898 33287 31611 51 4 Amlarem 398 35970 18158 17812 90 5 Saipung 846 27894 13995 13899 33 6 Jowai 8 25057 12262 12795 3132
Source: - Census of India.
01000020000300004000050000600007000080000
Block/Town
ThadlaskeinLaskeinKhliehriatAmlaremSaipungJowai
Fig.2 Blockwise and Town Population
Table: 1.05
Blockwise Child Population (0-6yrs) and Literacy Rate - 2001
Population (0-6yrs) Literacy Rate Sl.
No. Names of the
Blocks Person Male FemaleSex Ratio
Person Male Female1 2 3 4 5 6 7 8 9
1 2 3 4 5
Jaintia Hills Thadlaskein Laskein Khliehriat Amlarem Saipung
67409
22864
16036
20978
7531
-
33795
11439
8068
10531
3757
-
33614
11425
7968
10447
3774
-
995
999
988
992
1005
-
51.9
56.2
41.9
48.1
66.1
-
50.1
53.1
36.7
49.7
65.8
-
55.7
59.3
47.2
46.5
66.5
-
Source: - Census of India.

Table: 1.06
Number of Villages, Town and Households in each C&RD Block-2001
Sl. No.
Name of C&RD Blocks
Number of Villages
Number of
Town
Number of Households
1 2 3 4 5 1 Thadlaskein 121 1 17885 2 Laskein 86 - 10560 3 Khliehriat 100 - 10792 4 Amlarem 86 - 5956 5 Saipung 82 - 4725
Source: - Census of India.
Table: 1.07
Blockwise Population of Scheduled Tribe, Scheduled Caste and Others:2001
Population Sl. No.
C&RD Block / Town S.T S.C Others Total
1 2 3 4 5 6 1 Thalaskein 100413 35 4172 104620 2 Laskein 64307 43 1376 65726 3 Khliehriat 88126 96 4570 92792 4 Amlarem 3402 282 1485 35970 5 Total 287049 456 11603 229108
Source: - Census of India.
Table: 1.08
Distribution of Working Population :2001 Census Sl. No.
Category of Workers Male Female Total
1 2 3 4 5 1 Cultivators 35849 23932 59781 2 Agricultural Workers 17535 18760 36295 3 Workers in Households Industry 1292 1366 2658 4 Other workers 17193 10950 28143 5 Total Workers 71869 55008 126877 6 Marginal Workers 12452 18790 31242 7 Non-Workers 78022 94209 172231
Source: - Census of India.

CLIMATE
Table: 2.01
Total Rainfall of Jowai Centre during the year 2005-2007( In mm)
Source: - Research Officer, District and Local Research Station and Laboratories, Jaintia Hills, Jowai.
Table: 2.02
Maximum and Minimum Temperature of Jowai Centre during the year 2005-2007 (In Celcius)
2005 2006 2007 2008 Sl.
No.
Name of Centre Max. Min. Max. Min. Max. Min. Max. Min.
1 2 3 4 5 6 7 8 9 10 1 Jowai 23.68 14.93 24.00 14.92 22.06 15.70 24.07 14.44
Source: -Research Officer, District and Local Research Station and Laboratories, Jaintia Hills, Jowai.
0
5
10
15
20
25
2005 2006 2007
MaximumMinimum
Fig. 3 Maximum and Minimum Temperatures of Jowai (in Celsius).
Table: 2.03
Total Relative Humidity of Jowai during the year 2005-2007( In percentage) Sl. No.
Name of Centre 2005 2006 2007 2008
1 2 3 4 5 6 1 Jowai 1045.69 1061.97 1090.89 1089.50
Source: - Research Officer, District and Local Research Station and Laboratories, Jaintia Hills, Jowai.
Sl. No.
Name of Centre 2006 2007 2008
1 2 3 4 5 1 Jowai 2897.7 3041.8 5379.44
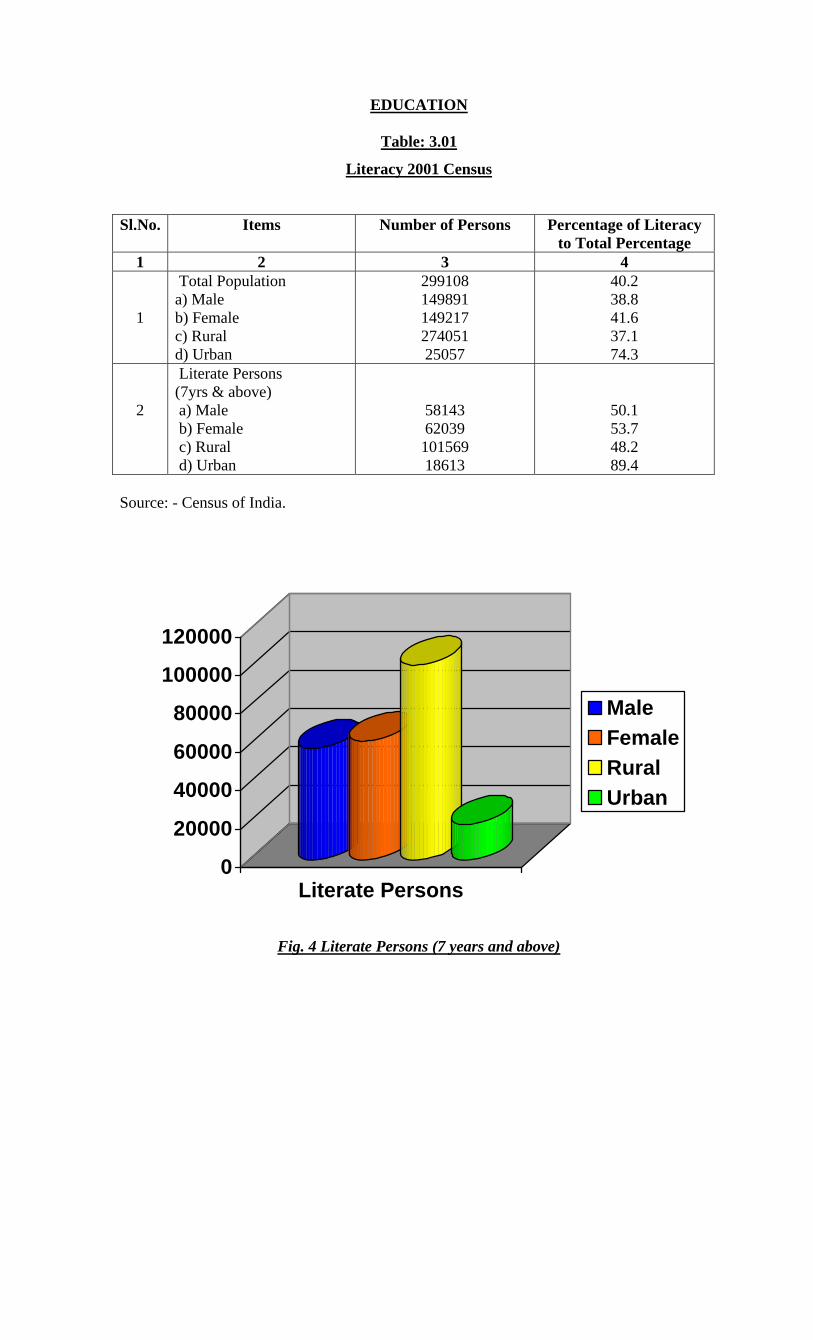
EDUCATION
Table: 3.01
Literacy 2001 Census
Sl.No. Items Number of Persons Percentage of Literacy
to Total Percentage 1 2 3 4 1
Total Population a) Male b) Female c) Rural d) Urban
299108 149891 149217 274051 25057
40.2 38.8 41.6 37.1 74.3
2
Literate Persons (7yrs & above) a) Male b) Female c) Rural d) Urban
58143 62039 101569 18613
50.1 53.7 48.2 89.4
Source: - Census of India.
0
20000
40000
60000
80000
100000
120000
Literate Persons
MaleFemaleRuralUrban
Fig. 4 Literate Persons (7 years and above)

Table: 3.02
Number of Educational Institutions
2007 2008 Type of Institution Type of Institution
Sl.No.
Particulars Private
Govt. including
Govt. aided
Total
Private
Govt. including
Govt. aided
Total
1 2 3 4 5 6 7 8 1. Primary 38 1304 1342 59 1455 1514 2. Upper Primary 14 444 458 21 491 512 3. Secondary Schools 62 3 65 62 3 65 4. Higher Secondary Schools 11 3 14 11 3 14 5. College 5 1 6 5 1 6 6. University - - - - - - 7. Teacher Training/Basic and
Non-Basic - 2 2 - 2 2
8.
Schools for Vocational/Professional/Special and other Educational including Adult Education (I.T.I).
-
1
1
-
1
1
9. Adult Education Centres - - - - - - Source: - 1) Inspector of Schools, Jowai. 2) D.I.of Schools, Jowai., D.I.of Schools Khliehriat, D.I. of Schools, Amlarem. 3) Principal of Kiang Nongbah College, Thomas Jones College, Jaintia Eastern College, Nongtalang College, DIET and Adventist College, Jowai. 4) District Mission Co-ordinator, SSASMAM, Jowai. 5) Vice Principal, ITI, Jowai.
Table: 3.03
Blockwise Number of Educational Institutions
Sl. No.
Particulars
Year
Thadlaskein C & RD
Block
Laskein C & RD
Block
Khliehriat C & RD
Block
Amlarem C & RD
Block
Saipung C & RD
Block 1 2 3 4 5 6 7 8 1 Primary 2008 527 300 454 233 N.A. 2 Upper Primary 2008 197 93 156 66 N.A. 3 Secondary
Schools 2008 24 13 19 9 N.A.
4 Higher Secondary Schools
2008 6 3 4 2 N.A.
5 Colleges 2008 3 - 1 1 -
Source: - 1) Inspector of Schools, Jowai. 2) D.I.of Schools, Jowai., D.I.of Schools Khliehriat, D.I. of Schools, Amlarem. 3) Principal of Kiang Nongbah College, Thomas Jones College, Jaintia Eastern College, Nongtalang College, and Adventist College, Jowai. 4) District Mission Co-ordinator, SSASMAM, Jowai.

Table: 3.03
Number of Students in Educational Institutions
Source: - 1) Inspector of Schools, Jowai. 2) D.I.of Schools, Jowai., D.I.of Schools Khliehriat, D.I. of Schools, Amlarem. 3) Principal of Kiang Nongbah College, Thomas Jones College, Jaintia Eastern College, Nongtalang College, and Adventist College, Jowai. 4) District Mission Co-ordinator, SSASMAM, Jowai.
Table: 3.04
Blockwise Number of Students in Educational Institutions
Sl. No.
Particulars
Year
Students
Thadlaskein C & RD
Block
Laskein C & RD
Block
Khliehriat C & RD
Block
Amlarem C & RD
Block
Saipung C & RD
Block
1 2 3 4 5 6 7 8 9 Boys 9834 5063 11033 3628 N.A. Girls 11534 6452 11398 4117 N.A.
1
Primary
2008
Total 21368 11515 22431 7745 N.A. Boys 5122 2262 5201 1278 N.A. Girls 6033 3248 5477 1570 N.A.
2
Upper Primary
2008
Total 11155 5510 10678 2848 N.A. Boys 3441 909 1809 375 N.A. Girls 4041 1062 1826 490 N.A.
3
Secondary Schools
2008
Total 7482 1971 3635 865 N.A. Boys 106 45 76 34 N.A. Girls 114 64 78 48 N.A.
4
Higher Secondary Schools
2008
Total 220 109 154 82 N.A. Boys 1682 NIL 189 250 N.A. Girls 2423 NIL 340 200 N.A.
5
Colleges
2008
Total 4105 NIL 529 450 N.A. Source: - 1) Inspector of Schools, Jowai. 2) D.I.of Schools, Jowai., D.I.of Schools Khliehriat, D.I. of Schools, Amlarem. 3) Principal of Kiang Nongbah College, Thomas Jones College, Jaintia Eastern College, Nongtalang College, and Adventist College, Jowai. 4) District Mission Co-ordinator, SSASMAM, Jowai.
2007 2008
Sl. No.
Type of Institution
Students
Private Govt.
including Govt. Aided
Total
Private
Govt. including
Govt. Aided
Total
1 2 3 4 5 6 7 8 9 Boys 2722 22226 24948 2627 26931 29558 Girls 3061 26198 29259 2910 30591 33501
1
Primary
Total 5783 48424 54207 5537 57522 63059 Boys 1631 11248 12879 2155 11708 13863 Girls 1845 14909 16754 1917 14411 16328
2
Upper Primary
Total 3476 26157 29633 4072 26119 30191 Boys 5385 1091 6476 5395 1139 6534 Girls 5987 1392 7379 5985 1434 7419
3
Secondary Schools
Total 11372 2483 13855 11380 2573 13953 Boys 139 120 259 148 113 261 Girls 228 185 413 222 195 417
4
Higher Secondary Schools
Total 367 105 672 370 308 678 Boys 655 1234 1889 809 1312 2121 Girls 1013 1364 2377 1363 1600 2963
5
College
Total 1668 2598 4266 2172 2912 5084

Table: 3.05
Number of Scheduled Tribe & Scheduled Caste in Educational Institutions
2007 2008 Sl.
No. Type of
Institutions Students
S.T. S.C. Others Total S.T. S.C. Others Total 1 2 3 4 5 6 7 8 9 10 11
Boys 24542 169 237 24948 28993 277 288 29558Girls 28947 128 184 13476 33045 198 258 33501
1
Primary
Total 53489 297 421 25128 62038 475 546 63059Boys 12329 206 344 12879 13008 246 609 13863Girls 16227 199 328 16754 15812 189 327 16328
2
Upper Primary
Total 28556 405 672 29633 28820 435 936 30191Boys 6300 78 78 6476 6357 80 97 6534 Girls 7302 40 37 7379 7347 42 30 7419
3
Secondary Schools
Total 13602 118 115 13855 13704 122 127 13953Boys 245 6 8 259 245 7 9 261 Girls 387 9 17 413 390 4 18 417
4
Higher Secondary Schools Total 632 15 25 672 635 16 27 678
Boys 1860 2 27 1889 2064 2 55 2121 Girls 2354 - 23 2377 2908 - 55 2963
5
Colleges
Total 4212 2 50 4266 4972 2 110 5084 Source: - 1) Inspector of Schools, Jowai. 2) D.I.of Schools, Jowai., D.I.of Schools Khliehriat, D.I. of Schools, Amlarem. 3) Principal of Kiang Nongbah College, Thomas Jones College, Jaintia Eastern College, Nongtalang College, and Adventist College, Jowai. 4) District Mission Co-ordinator, SSASMAM, Jowai.
Table: 3.06
Number of Teachers in Educational Institutions
2007 2008
Sl. No.
Particulars
Students
Private
Govt.
including Govt. aided
Total
Private
Govt.
including Govt. aided
Total
1 2 3 4 5 6 7 8 9 Male 30 1359 1389 48 1022 1070
Female 31 2178 2209 34 2781 2815 1
Primary
Total 61 3537 3598 82 3803 3885 Male 15 952 967 16 817 833
Female 18 1021 1039 15 1509 1522 2
Upper Primary
Total 33 1973 2006 31 2326 2355 Male 253 11 264 252 11 263
Female 314 12 326 313 13 326 3
Secondary Schools
Total 567 23 590 565 24 589 Male 42 14 56 42 14 56
Female 43 21 64 43 21 64 4
Higher Secondary Schools Total 85 35 120 85 35 120
Male 40 38 78 41 40 81 Female 58 55 113 62 51 113
5
College
Total 98 93 191 103 91 194

Male - 7 7 - 8 8 Female - 11 11 - 11 11
6
Teacher Training/ Basic and Non-Basic
Total - 18 18 - 19 19 Male - 6 6 - 6 6
Female - 2 2 - 2 2 7
Schools for Vocational Training/Professional/ Special and other Education including Adult Education
Total
-
8
8
-
8
8
Source: - 1) Inspector of Schools, D.I. of Schools, Jowai, D.I. of Schools, Khliehriat. D.I. of Schools, Amlarem. 2) Principal of Kiang Nongbah College, Principal of Nongtalang College, 3) Principal of Thomas Jones Synod College, Principal of Jaintia Eastern College, 4) Principal of Northeast Adventist College, Principal of D.I.E.T, 5) Principal of I.T.I.
Table: 3.07
Blockwise Number of Teachers in Educational Institutions
Sl. No.
Particulars
Year
Teachers
Thadlaskein C & RD
Block
Laskein C & RD
Block
Khliehriat C & RD
Block
Amlarem C & RD
Block
Saipung C & RD
Block
1 2 3 4 5 6 7 8 9 Male 273 186 380 231 N.A.
Female 993 603 817 402 N.A. 1
Primary
2008
Total 1266 789 1197 633 N.A. Male 207 150 356 120 N.A.
Female 577 286 487 172 N.A. 2
Upper Primary
2008
Total 784 436 843 292 N.A. Male 138 30 70 25 N.A.
Female 152 68 79 27 N.A. 3
Secondary Schools
2008
Total 290 98 149 52 N.A. Male 25 9 14 8 N.A.
Female 27 11 17 9 N.A. 4
Higher Secondary Schools
2008
Total 52 20 31 17 N.A. Male 58 NIL 9 13 N.A.
Female 90 NIL 10 11 N.A. 5
Colleges
2008
Total 148 NIL 19 24 N.A. Source: - 1) Inspector of Schools, Jowai. 2) D.I.of Schools, Jowai., D.I.of Schools Khliehriat, D.I. of Schools, Amlarem. 3) Principal of Kiang Nongbah College, Thomas Jones College, Jaintia Eastern College, Nongtalang College, and Adventist College, Jowai. 4) District Mission Co-ordinator, SSASMAM, Jowai.

Table: 3.08
Intake and Out turn of Industrial Training Institute
2005 2006 2007 2008 Sl.
No. Particulars
Intake Out turn Intake Out turn Intake Out turn Intake Out turn 1 2 3 4 5 6 7 8 9 10 1 Electrician 5 Nil Nil 5 15 Nil Nil 15 2 Wireman Nil Nil Nil Nil Nil Nil Nil Nil 3 Fitter Nil Nil Nil Nil Nil Nil Nil Nil 4 Mechanic
(Composite) Nil Nil Nil Nil Nil Nil Nil NIL
5 Turner Nil Nil Nil Nil Nil Nil Nil Nil 6 Welder (Gas &
Electric) 1 1 6 2 3 3 2 Nil
7 Stenography 3 3 7 3 14 12 11 Nil 8 Mechanic (M.V) 5 Nil Nil 5 7 Nil Nil 7 9 Carpentry Nil Nil Nil Nil Nil Nil Nil Nil 10 Draftsman Nil Nil Nil Nil Nil Nil Nil Nil
Source: - Principal, Industrial Training Institute, Khliehtyrshi, Jowai.

HEALTH AND FAMILY WELFARE
Table: 4.01
Number of Government Hospitals and Dispensaries
Sl. No.
Particulars 2006 2007 2008
1 2 3 4 5 1 Hospitals 1 1 1 2 Dispensaries 1 1 1 3 P.H.C’S 16 17 17 4 C.H.C’S 5 5 5 5 Family Welfare Centres 3 3 3 6 Maternity and Child Welfare 2 2 2 7 Any Other Sub-Centres 72 72 72
Source: - District Medical and Health Officer, Jowai
Table: 4.02
Number of Registered Medical and Para-medical Personel.
Sl. No.
Particulars 2006 2007 As on July 2008
1 2 3 4 5 1
Doctors- a) Graduates b) Licentiates
56 1
56 1
47 1
2 Nurses (General) 27 27 37 3 Midwives - - - 4 Health Visitor 9 12 18 5 Auxiliary Nurses 129 129 123 6 Pharmacist 25 25 25 7 Other Para-medical Personel
Registered during the year 36 36 36
Source: - District Medical and Health Officer, Jowai.
Table: 4.03
Patients treated in Government Hospitals/Institutions
2006 2007 As on July 2008 Sl.
No. Particulars
Indoor Outdoor Indoor Outdoor Indoor Outdoor1 2 3 4 5 6 7 8 1 No. of Patients in
Hospitals (C.H.C) 2571 48,336 2354 69,491 1313 35,403
2 P.H.C 244 1,34,399 440 1,04,078 14 56,576 3 Dispensaries - 7419 - 5455 - 3440 4 Family Welfare
Clinics - - - - - -
5 Maternity Health Care
- - - - -
Source: - District Medical and Health Officer, Jowai.
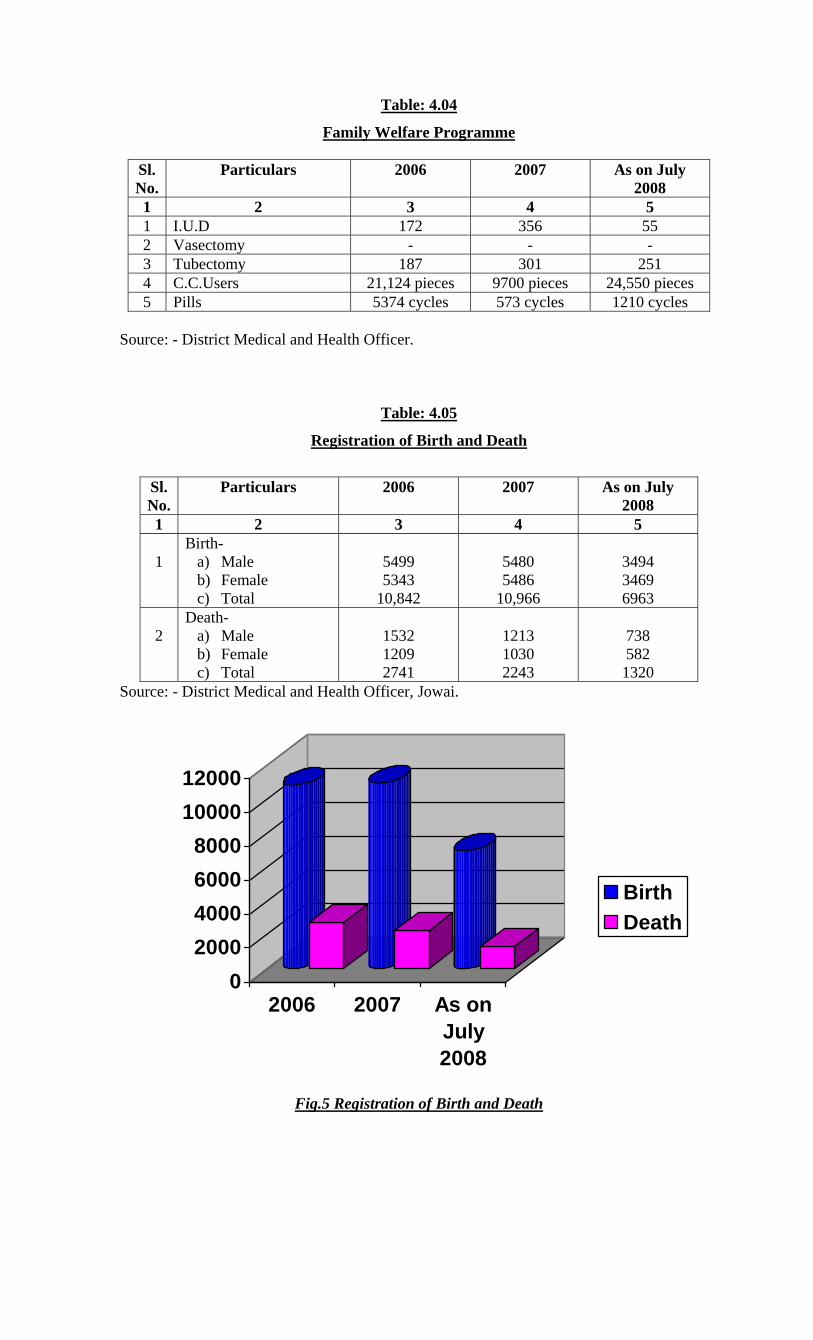
Table: 4.04
Family Welfare Programme
Sl. No.
Particulars 2006 2007 As on July 2008
1 2 3 4 5 1 I.U.D 172 356 55 2 Vasectomy - - - 3 Tubectomy 187 301 251 4 C.C.Users 21,124 pieces 9700 pieces 24,550 pieces 5 Pills 5374 cycles 573 cycles 1210 cycles
Source: - District Medical and Health Officer.
Table: 4.05
Registration of Birth and Death
Sl. No.
Particulars 2006 2007 As on July 2008
1 2 3 4 5 1
Birth- a) Male b) Female c) Total
5499 5343
10,842
5480 5486
10,966
3494 3469 6963
2
Death- a) Male b) Female c) Total
1532 1209 2741
1213 1030 2243
738 582 1320
Source: - District Medical and Health Officer, Jowai.
02000400060008000
1000012000
2006 2007 As onJuly2008
BirthDeath
Fig.5 Registration of Birth and Death

Table: 4.06
Number of Death by Age Group
2006 2007 As on July 2008Sl.
No. Particulars
Male Female Male Female Male Female1 2 3 4 5 6 7 8 1 Below 1 year 326 286 276 247 143 132 2 1 – 4 years 280 285 158 175 83 63 3 5 – 14 years 195 123 84 71 60 44 4 15 – 24 years 128 71 99 72 49 52 5 25 – 34 years 102 69 99 73 80 45 6 35 – 44 years 114 72 107 62 95 55 7 45 – 64 years 128 99 204 117 120 72 8 65 – 74 years 98 67 99 101 54 36 9 75 and above 161 137 87 112 54 83 10 Total 1532 1209 1213 1030 738 582
Source: - District Medical and Health Officer, Jowai.
Table: 4.07
Number and Types of Beds
Sl. No.
Years GeneralBeds
MaternityBeds
Paediatric Beds
T.B Beds
Others Total
1 2 3 4 5 6 7 1 2005 342 21 27 - 4 394 2 2006 342 21 27 - 4 394 3 2007 348 21 27 - 4 400 4 As on July
2008 348 21 27 - 4 400
Source: - District Medical and Health Officer, Jowai.
Table: 4.08
Immunization Programme
Sl. No.
Particulars 2005 2006 2007 As on July 2008
1 2 3 4 5 6 1 O.P.V 8515 7489 9633 8201 2 Measles 6873 7460 8291 8308 3 B.C.G 10509 10355 12707 11154 4 D.T. (5 Years) 9264 9186 10875 8027 5 T.T. ( Pregnant Women ) 6251 6453 7204 6313 6 T.T. ( 10 years ) 7315 5483 6931 4549 7 T.T. ( 16 years ) 2137 2214 2171 737 8 Fully Immunization 5350 6873 7113 8592
Source: - District Medical and Health Officer, Jowai.

POLICE AND CRIME STATISTICS
Table: 5.01
Number of Police Stations, Outposts, etc.
Sl.No Particulars 2006 2007 2008 1 2 3 4 5 1 No. of Police Station 3 4 4 2 No. of Beat House 2 2 2 3 No. of Out Post 4 3 3 4 No. of Investigation Centres 1 1 1 5 No. of Check Post 2 2 2 6 No. of Patrol Post 2 2 2 7 No. of Additional Camp - 1 1
Source: - Superintendent of Police, Jowai
Table: 5.02
Strength of Police Personnel
Source: - Superintendent of Police, Jowai.
Table: 5.03
Incidence of Crimes by Major Head
Sl.No. Types of Crimes 2006 2007 2008
1 2 3 4 5 1 Murder 50 19 28 2 Rape 19 13 10 3 Kidnapped and Abduction 3 1 4 4 Dacoity 7 6 2 5 Robbery 5 2 5 6 Theft 41 20 48 7 Riots - - - 8 Criminal Breach of Trust 4 1 5 9 Cheating 1 3 9 10 Other IPC 156 76 71
Source: - Superintendent of Police, Jowai.
Sl.No. Particulars 2006 2007 2008 1 2 3 4 5 1 No. of Superintendent of Police 1 1 1 2 No. of Deputy Superintendent of Police 1 2 3 3 No. of Inspector of Police 5 5 4 4 No. of Sub- Inspector of Police 34 36 37 5 No. of Assistant Inspector of Police - - - 6 No. of Head Constable ( AB and UB ) 9 8 7 7 No. of Havilder (AB and UB ) 9 8 11 8 No. of Constables 260 219 233 9 No. of Cooks and Sweepers 6 6 6

Table: 5.04
Offence under Local and Special Law
Sl.No. Particulars 2006 2007 2008
1 2 3 4 5 1 Arms Act 2 - - 2 Gambling Act 2 17 12 3 Explosive and Explosive Substances Act - 4 - 4 Prohibition Act - - - 5 Other Local and Special Law 13 3 15
Source: - Superintendent of Police, Jowai.
32%
45%
23%
200620072008
Fig. 6 Offences under Local and Special Laws.

SOCIAL WELFARE
Table: 6.01
Number of Voluntary Organisation, Handicapped Persons and Old Age Pensionery Receiving Grant-in –Aid.
Sl.No. Particulars 2006 2007 2008
1 2 3 4 5 1 Voluntary Organisations 15 11 15 2
Handicapped persons (a) Token Relief Grant to passed out vocational Training (b) Scholarship to Physically Handicapped students (c) Prosthetic Aids
20
118 -
12
16 -
8
45 -
3 Financial Assistant for Medical Treatment for Aged 15 22 34 Source: - District Social Welfare Officer, Jowai.
AGRICULTURE
Table: 7.01
Land Utilisation Statistics (in Hectare)
Sl. No.
Particulars 2005 2006 2007
1 2 3 4 5 1 Reporting Area for Land Utilisation
Statistics 3,81,100 3,81,100 3,81,100
2 Forest 1,54,094 1,54,121 1,54,125 3 Not available for cultivation 30,886 30,893 30,905 4 Other un-cultivation land excluding
fallow land 1,36,922 1,37,106 1,37,082
5 Fallow Land 26,706 26,934 26,064 6 Net Area Sown 32,422 32,046 32,064 7 Area sown more than once 360 366 366 8 Total cropped Area 32,782 32,412 32,430
Source: - District Agricultural Officer, Jowai.
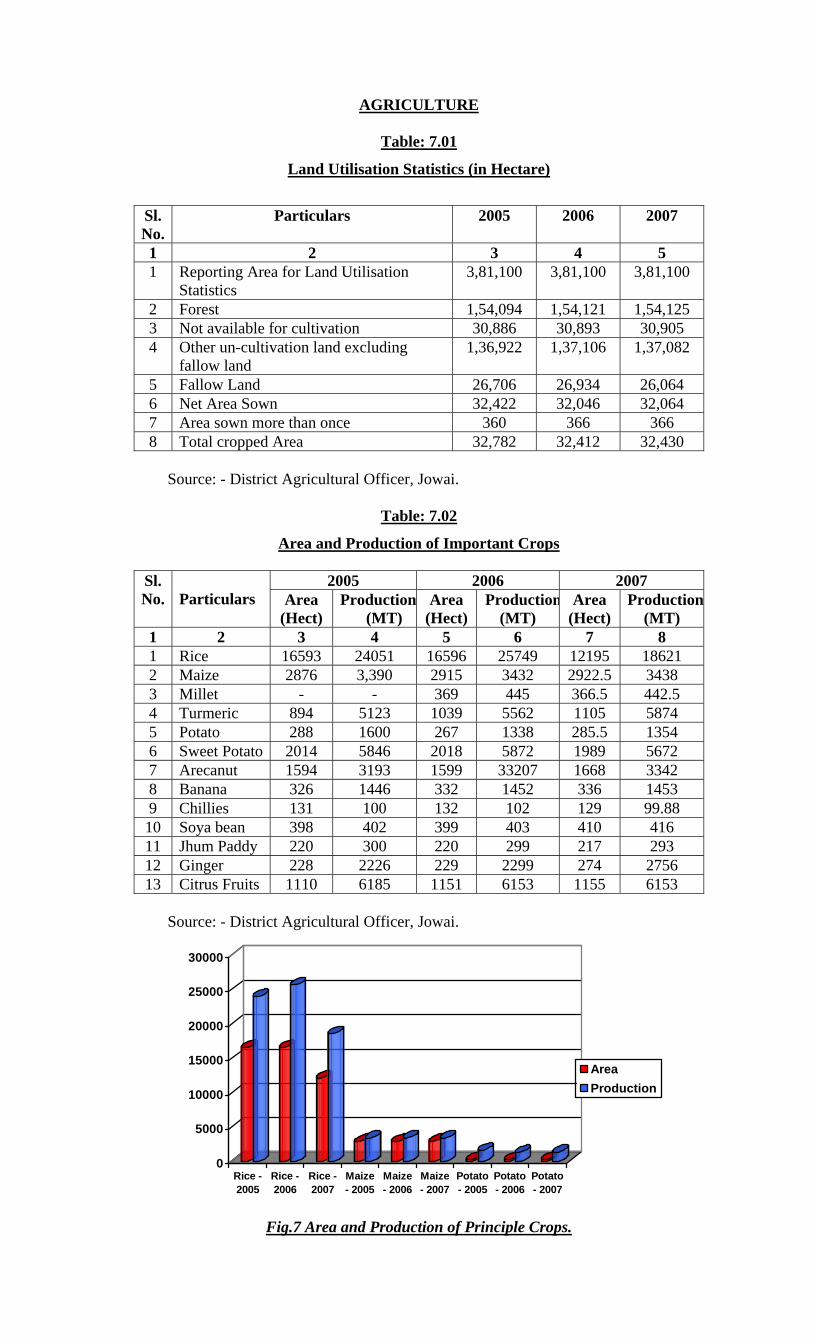
Table: 7.02
Area and Production of Important Crops
2005 2006 2007 Sl. No.
Particulars Area
(Hect) Production
(MT) Area
(Hect) Production
(MT) Area
(Hect) Production
(MT) 1 2 3 4 5 6 7 8 1 Rice 16593 24051 16596 25749 12195 18621 2 Maize 2876 3,390 2915 3432 2922.5 3438 3 Millet - - 369 445 366.5 442.5 4 Turmeric 894 5123 1039 5562 1105 5874 5 Potato 288 1600 267 1338 285.5 1354 6 Sweet Potato 2014 5846 2018 5872 1989 5672 7 Arecanut 1594 3193 1599 33207 1668 3342 8 Banana 326 1446 332 1452 336 1453 9 Chillies 131 100 132 102 129 99.88 10 Soya bean 398 402 399 403 410 416 11 Jhum Paddy 220 300 220 299 217 293 12 Ginger 228 2226 229 2299 274 2756 13 Citrus Fruits 1110 6185 1151 6153 1155 6153
Source: - District Agricultural Officer, Jowai.
0
5000
10000
15000
20000
25000
30000
Rice -2005
Rice -2006
Rice -2007
Maize- 2005
Maize- 2006
Maize- 2007
Potato- 2005
Potato- 2006
Potato- 2007
AreaProduction
Fig.7 Area and Production of Principle Crops.

Table: 7.03
Yield Rates of the Important (Kgs per Hectare)
Sl. No.
Crops 2004-2005 2005-2006 2006-2007
1 2 3 4 5 1 Rice 1,449 1413 1194 2 Maize 1,179 N.A. 1280 3 Ginger N.A. 10074 14559 4 Potato 5,558 7413 7413
Source: - District Agricultural Officer, Jowai.
Table: 7.04
Distribution of Fertilizers (M.T)
Sl. No.
Particulars Name of Fertilizers
2004-2005
2005-2006
2006-2007
1 2 3 4 5 6 a) Single Super Phosphate
402 342 301
b) Urea 192 275 261 c) D.A.P 309 319 367 d) M.O.P 18 30 28 e) Amrit 8.8.8 - - -
1
Meghalaya State Co-operative Marketing Consumers Federation Ltd. Jowai.
f) Bone meal 159 168 74 Source: - 1) IFFCO, Gauhati. 2) Indian Potash Ltd. Gauhati. 3) Teesta Agro. Industries, Siliguri.

ANIMAL HUSBANDARY AND VETERINARY
Table: 8.01
Animal Husbandry Veterinary Livestock Census 2003 -2004
Sl.No. Name of Livestock Unit (Nos.) 1 2 3 1 Cattle 1,91,914 2 Buffaloes 2,201 3 Sheep 309 4 Goats 24,015 5 Horses and ponies 317 6 Pigs 47,427 7 Other Livestock (Dogs) 18,844 8 Total Livestock 1,86,183 9 Total 2,05,027 10 Poultry 2,36,091 11 Grand Total 4,41,118
Source: District A.H.& Vety. Officer, Jowai. Table: 8.02
Number of Veterinary Institution and Services.
Sl.No. Items 2006 2007 2008 1 2 3 4 5 1 Veterinary Hospital 1 1 1 2 Dispensaries 6 6 6 3 Veterinary Aid Centre 13 13 13 4 Stockman Centres - - - 5 Key Village Centres 8 8 8 6 Veterinary Block Centres 4 4 4 7 Milk Plants & Milk chilling Plants 1 1 1 8 Veterinary Doctors/ Surgeons 27 28 27 9 Livestock cases treated in veterinary hospital and
Dispensaries. 1.86,696 1,97,496 79,564
10
Livestock cases vaccinated and Poultry. (a) Livestock (b) Poultry
32,434
2,24,852
35,534
2,24,953
29,455
1,41,938
Note :-Cases treated & vaccinated upto June 2008 Source: District A.H.& Vety. Officer, Jowai.
Table: 8.03
Production of Milk, Eggs and Meat.
Sl.No. Particulars Unit 2006 2007 2008 1 2 3 4 5 6 1 Milk 000’ltrs 6480 6630 - 2 Eggs 000’Nos 15010 151091 - 3 Beef 000’kgs 18780 1581 - 4 Pork 000’kgs 12660 976 - 5 Poultry Product 000’kgs - - -
Source: - District A.H. & Vety. Officer, Jowai.

SERICULTURE
Table: 9.01
Area under Plantation of Mulberry, Eri, Muga and Production
2005-2006 2006-2007 2007-2008 Sl. No.
Particulars
Area Under
Plantation (Hect)
Production
(Kgs)
Area Under
Plantation (Hect)
Production
(Kgs)
Area Under
Plantation (Hect)
Production
(Kgs)
1 2 3 4 5 6 7 8 1 Mulberry 25 6760 25 5200 50 5500 2 Eri 17 56800 17 60000 100 54000 3 Muga 1 100000 1 12000 20 15000 4 Tassar - - - - - -
Source:-District Sericulture Officer, Jowai.

FOREST
Table: 10.01
Geographical Area, Recorded Forest and Actual Forest 2006-2007 & 2007-2008
Recorded Forest Forest Cover Sl. No.
Year Unit Geographic Area(G.A) Area Percent Area Percent
1 2 3 4 5 6 7 8 1 2006-2007 Sq.Kms 3819 2145.33 56.17 2457 64.34 2 2007-2008 Sq.Kms 3819 2145.33 56.17 2457 64.34
Source: - (1) Divisional Forest Officer (T), Jowai. (2) Chief Forest Officer, Jaintia Hills Autonomous District, Jowai. Table: 10.02
Distribution (Classification) of Recorded Forest Area 2006-2007 & 2007-2008
Sl. No.
Year Unit ReservedForest
ProtectedForest
UnclassedForest
Total ForestArea
1 2 3 4 5 6 7 1 2006-2007 Hect. 311.67 2191.81 - 2503.48 2 2007-2008 Hect. 311.67 2191.81 - 2503.48
Source: - (1) Divisional Forest Officer (T) Jowai. (2) Chief Forest Officer, Jaintia Hills Autonomous District, Jowai. Table: 10.03
Out Turn and Value of Major Forest Production in District, Out Turn In Cubic Metre (Value in Rs.)
Sl.No. Particulars Units 2005-2006 2006-2007 1 2 3 4 5
1
Timber (a) Out turn (b) Value
M3 Rs.
N.A N.A
685.481
16,89,710
2 Firewood
(a) Out turn (b) Value
M.T Rs.
N.A N.A
N.A N.A
3
Minor Forest Product 1.Stone and sand (a) Out turn (b) Value 2.Limestone (a) Out turn (b) Value
M3 Rs.
M.T Rs.
N.A 1,76,302,50
N.A N.A
N.A 2,20,98,913
N.A N.A
Source: - Divisional Forest Officer (T) Jowai.

FISHERY
Table: 11.01
Production and Price of Inland Fish
Sl. No.
Year Production (MT)
Price Per MT.
Value Rs.In Lakhs.
1 2 3 4 5 1 2006 402 70,000 281.4 2 2007 278 70,000 194.6 3 2008 60.6 60,000 36.3
Source: Superintendent of Fisheries.
Table: 11.02
Fish Seed Distribution
Sl.No
Year Unit (Nos)
Fish seed Distribution
1 2 3 4 1 2006 20 40,000 2 2007 40 59,000
20 1,20,000(Departmental) 3 2008 91 2,25,000(Brought from Outside)
Source: - Superintendent of Fisheries.
Table: 11.03
Fish Seed Farm Production of Spawn and Fry Fingerlings
Sl.No. Particulars Unit 2006 2007 2008 1 2 3 4 5 6 1 Fish seed farm Nos 2 2 2 2 Nurseries areas Hect. 0.5 0.5 0.5 3 Bheels and lake Hect. - - - 4 Total water area for composite fish farming Hect. 7 7 7 5 Fry fingerlings Million 0.040 0.059 0.0126 Inland fish production both capture and culture
fisheries 1000
tonnes 278 278 60.6
Source: - Superintendent of Fisheries.

MINING
Table: 12.01
Production and Value of Important Minerals
2005 – 2006 2006 – 2007 2007 – 2008
Sl.No.
Items Production (M.T.)
Value (Rs.)
Production (M.T.)
Value (Rs.)
Production (M.T.)
Value (Rs.)
1 2 3 4 5 6 7 8 1 Coal 3889798 N.A. 4045710 N.A. 4359878 N.A. 2 Limestone 510432 N.A. 1332009 N.A. 1253947 N.A. 3 Sellimanite - - - - - -
Source: - Divisional Mining Officer, Jowai.
CO-OPERATIVE
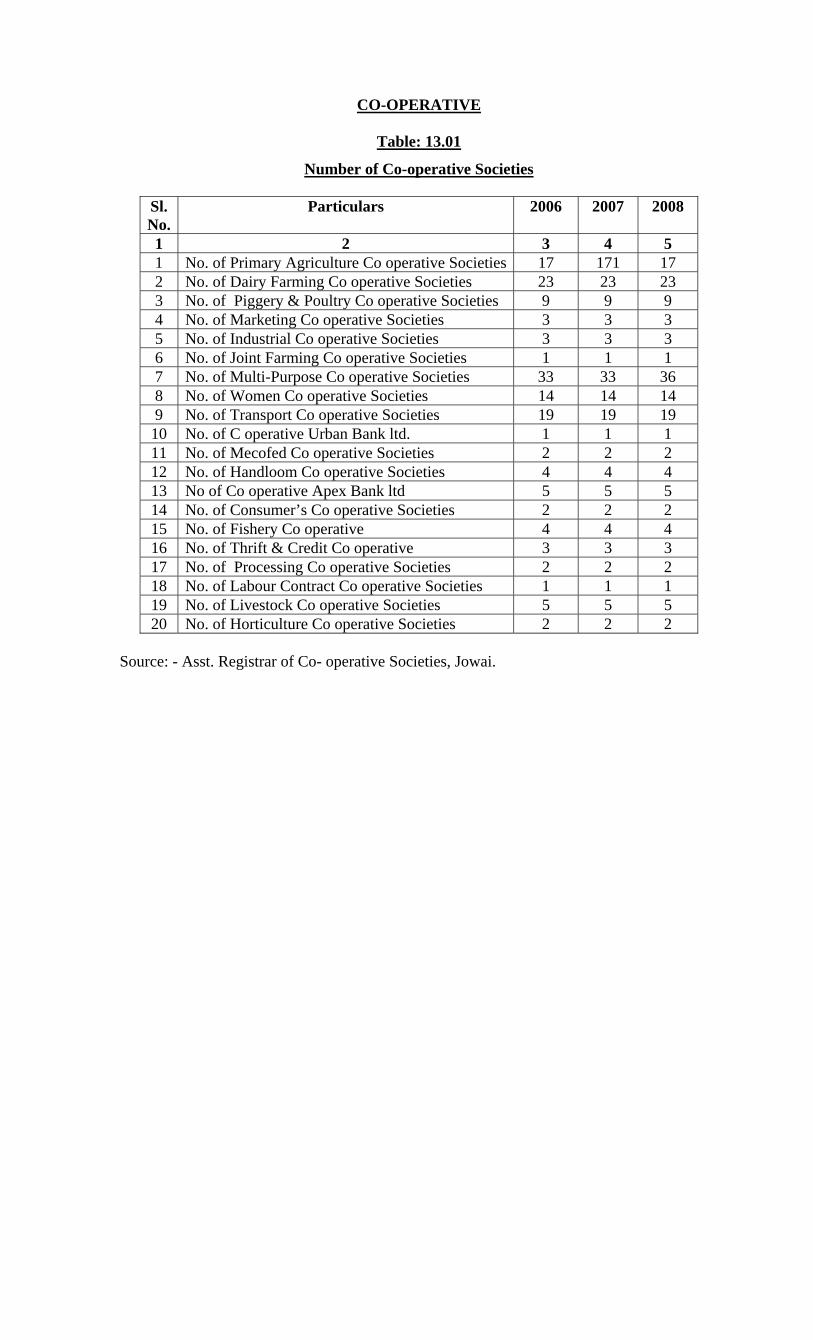
Table: 13.01
Number of Co-operative Societies
Sl. No.
Particulars 2006 2007 2008
1 2 3 4 5 1 No. of Primary Agriculture Co operative Societies 17 171 17 2 No. of Dairy Farming Co operative Societies 23 23 23 3 No. of Piggery & Poultry Co operative Societies 9 9 9 4 No. of Marketing Co operative Societies 3 3 3 5 No. of Industrial Co operative Societies 3 3 3 6 No. of Joint Farming Co operative Societies 1 1 1 7 No. of Multi-Purpose Co operative Societies 33 33 36 8 No. of Women Co operative Societies 14 14 14 9 No. of Transport Co operative Societies 19 19 19 10 No. of C operative Urban Bank ltd. 1 1 1 11 No. of Mecofed Co operative Societies 2 2 2 12 No. of Handloom Co operative Societies 4 4 4 13 No of Co operative Apex Bank ltd 5 5 5 14 No. of Consumer’s Co operative Societies 2 2 2 15 No. of Fishery Co operative 4 4 4 16 No. of Thrift & Credit Co operative 3 3 3 17 No. of Processing Co operative Societies 2 2 2 18 No. of Labour Contract Co operative Societies 1 1 1 19 No. of Livestock Co operative Societies 5 5 5 20 No. of Horticulture Co operative Societies 2 2 2
Source: - Asst. Registrar of Co- operative Societies, Jowai.

INDUSTRIES
Table: 14.01
Number of Small Scale Industries Registered, Number of Persons Employed and Plant and Machinery (in Lakhs)
2006 2007
Sl. No.
Particulars No. of Small Scale
Industries
No. of Persons
Employed
Plant& Machinery (in Lakhs)
No. of Small Scale
Industries
No. of Persons
Employed
Plants & Machinery (in Lakhs)
1 2 3 4 5 6 7 8 1 Betel nut
Preservation 16 30 34.36 14 34 27.48
2 Automobile 2 13 2.04 6 52 15.31 3 Dry fish 2 5 3.06 1 3 1.50 4 Steel
Fabrication 2 7 0.68 1 4 0.29
5 Bakery 4 21 5.51 3 13 3.03 6 Cane &
Bamboo 6 8 0.63 1 1 0.15
7 Modern Tiles
1 15 6.67 - - -
8 Furniture 1 9 0.50 - - - 9 Tailoring 3 8 0.43 4 9 0.40 10 Weaving 1 4 0.05 - - - 11 Cable
Network 1 5 1.91 1 6 12.00
12 Candle Work
1 3 0.12 - - -
13 Ice Cream 2 6 3.49 - - -
14 Photo Stat & Lamination
1 3 2.00 - - -
15 Weigh Bridge
1 4 11.79 - - -
16 Blacksmith - - - 6 25 0.98 17 P.C.O. cum-
Xerox - - - 1 2 1.68
18 Minerals - - - 1 12 20.00 19 Vermi
Compost - - - 2 9 1.45
20 Beauty Parlour
- - - 3 9 0.85
21 Footwear - - - 1 3 0.50 22 Spices - - - 1 5 2.02 23 Printing
Press - - - 1 9 11.41
24 Rice Dehusting-
- - - 1 2 0.71
25
Book binding cum-Printing
- - - 1 4 1.51
Source: - General Manager, District Industries Centre, Jowai.

LABOUR AND EMPLOYMENT
Table: 15.01
Registration and Employment through Divisional Employment Exchange
Sl.No Particulars 2006 2007 20081 2 3 4 5 1 Number of application on live register as on 31st March 4957 4210 33982 Number of applicant registered 1983 956 11413 Number of Scheduled Tribes 1983 954 11364 Number of Scheduled Castes - 2 55 Number of Vacancies Notified 14 19 136 Number of Placements - 10 37 Total 8937 6151 5696
Source: - Employment Officer, Jowai.
Table: 15.02
Number of Employment in Public Sector
Sl.No. Particulars 2006 2007 20081 2 3 4 5 1 Agriculture, Hunting Forestry and Fishing 145 145 1462 Minning and Quarry - - - 3 Manufacturing - - - 4 Electricity, Gas and Water 309 309 3115 Construction 392 399 3946 Wholesale and Retail Traded Restaurants and Hotels 34 34 367 Transport Storage and Communications 20 20 228 Financing Insurance, Real Estate and Business Services 78 78 159 Community, Social and Personal Services 432 432 42410 Total 1410 1417 1348
Source: - Employment Officer, Jowai.
Table: 15.03
Number of Employment in Private Sector
Sl.No. Particulars 2006 2007 20081 2 3 4 5 1 Mining and Quarrying - - - 2 Manufacturing 227 148 1493 Construction - - - 4 Transport Storage and Communications - - - 5 Financing Insurance, Real Estate and Business Services 9 9 - 6 Wholesale and Retail traded Restaurants and Hotels - - - 7 Community, Social and Personal Services - - - 8 Total 236 157 149
Source: - Employment Officer, Jowai.
ROAD AND TRANSPORT
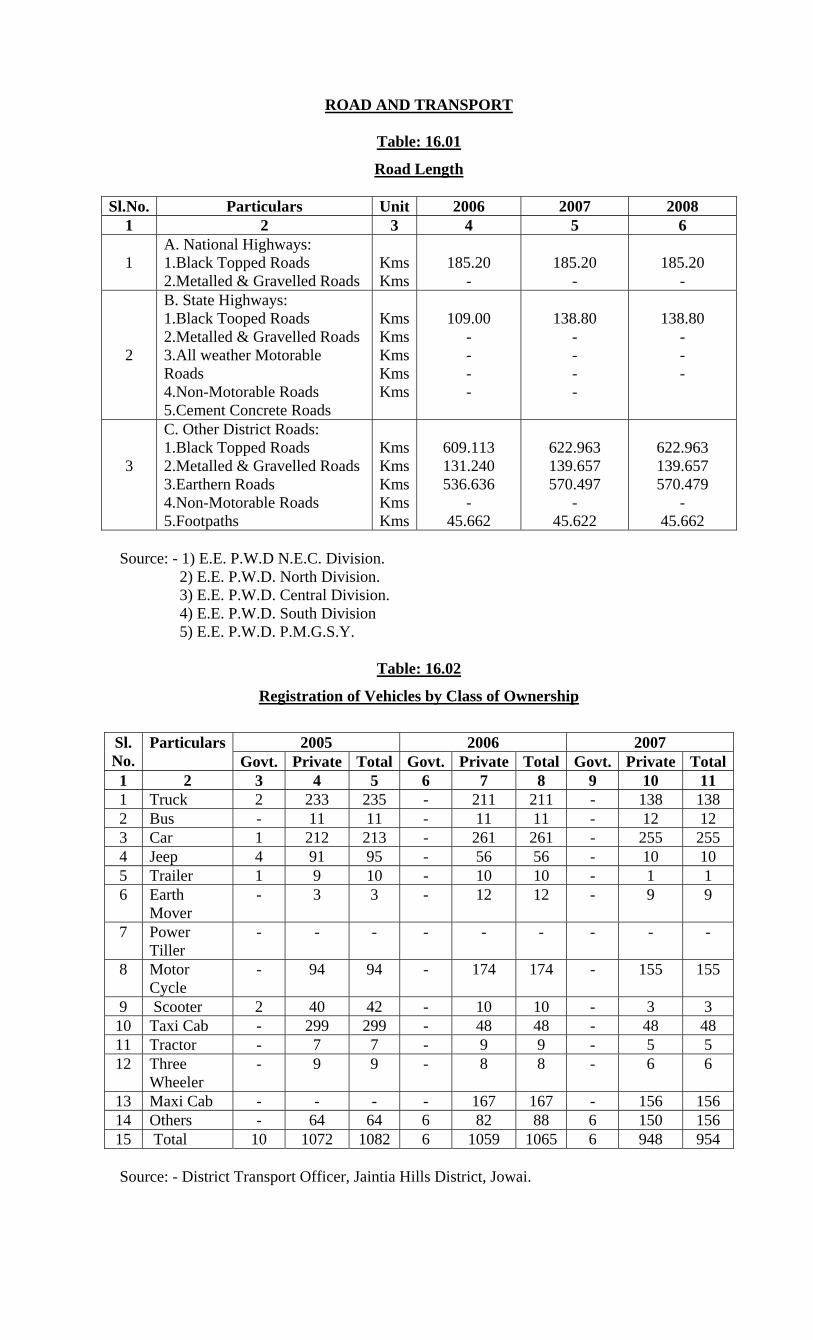
Table: 16.01
Road Length
Sl.No. Particulars Unit 2006 2007 2008 1 2 3 4 5 6 1
A. National Highways: 1.Black Topped Roads 2.Metalled & Gravelled Roads
KmsKms
185.20
-
185.20
-
185.20
- 2
B. State Highways: 1.Black Tooped Roads 2.Metalled & Gravelled Roads 3.All weather Motorable Roads 4.Non-Motorable Roads 5.Cement Concrete Roads
KmsKmsKmsKmsKms
109.00
- - - -
138.80
- - - -
138.80
- - -
3
C. Other District Roads: 1.Black Topped Roads 2.Metalled & Gravelled Roads 3.Earthern Roads 4.Non-Motorable Roads 5.Footpaths
KmsKmsKmsKmsKms
609.113 131.240 536.636
- 45.662
622.963 139.657 570.497
- 45.622
622.963 139.657 570.479
- 45.662
Source: - 1) E.E. P.W.D N.E.C. Division. 2) E.E. P.W.D. North Division. 3) E.E. P.W.D. Central Division. 4) E.E. P.W.D. South Division 5) E.E. P.W.D. P.M.G.S.Y.
Table: 16.02
Registration of Vehicles by Class of Ownership
2005 2006 2007 Sl.
No. Particulars
Govt. Private Total Govt. Private Total Govt. Private Total1 2 3 4 5 6 7 8 9 10 11 1 Truck 2 233 235 - 211 211 - 138 138 2 Bus - 11 11 - 11 11 - 12 12 3 Car 1 212 213 - 261 261 - 255 255 4 Jeep 4 91 95 - 56 56 - 10 10 5 Trailer 1 9 10 - 10 10 - 1 1 6 Earth
Mover - 3 3 - 12 12 - 9 9
7 Power Tiller
- - - - - - - - -
8 Motor Cycle
- 94 94 - 174 174 - 155 155
9 Scooter 2 40 42 - 10 10 - 3 3 10 Taxi Cab - 299 299 - 48 48 - 48 48 11 Tractor - 7 7 - 9 9 - 5 5 12 Three
Wheeler - 9 9 - 8 8 - 6 6
13 Maxi Cab - - - - 167 167 - 156 156 14 Others - 64 64 6 82 88 6 150 156 15 Total 10 1072 1082 6 1059 1065 6 948 954 Source: - District Transport Officer, Jaintia Hills District, Jowai.

Table: 16.03
Number of Road Accident, Number of Person Killed and Injured
Sl. No.
Year Units Accidents Killed Injured
1 2 3 4 5 6 1 2006 Nos. 45 37 82 2 2007 Nos. 33 26 79 3 2008 Nos. 27 14 59
Source: - Superintendent of Police, Jowai.

COMMUNICATION
Table: 17.01
Number of Telegraph and Post Office Sl.No. Particulars 2006 2007 2008
1 2 3 4 5 1
Telegraph Office (a) Head Office (b) Branch Office
- -
- -
- -
2
Post Office (a) Head Office (b) Sub- Office (c) Branch Office (d) Office of Inspector
- 4 57 1
- 4 61 1
- 5 71 1
Source: - Inspector of Post Office, Jowai.
Table: 17.02
Number of Telephone Exchange and Telephone Subscribers
Sl.No.
Years
No. of Exchanges
No. of PCO
No. of Subscriber Land Line
No. of Subscriber
WLL
No. of Subscribers
Mobile Phone 1 2 3 4 5 6 7 1 2006 11 286 5993 1364 N.A 2 2007 18 200 5400 1225 4500 3 2008 18 269 5851 1770 8139
Source: - Sub-Divisional Engineer (P) Jowai.

TOURISM
Table: 18.01
Number of Tourist Spot and Tourist Visiting
Sl. No.
Particulars As on 31st December As on 31st September
2006 2007 2008 1 2 3 4 5 1 Number of Tourist Spot 6 10 10 2
Number of Tourist Visiting a) Indian b) Foreign c) Total
N.A N.A N.A
128 N.A 128
323 22 345
Source: - Tourism Officer, Jaintia Hills, Jowai.
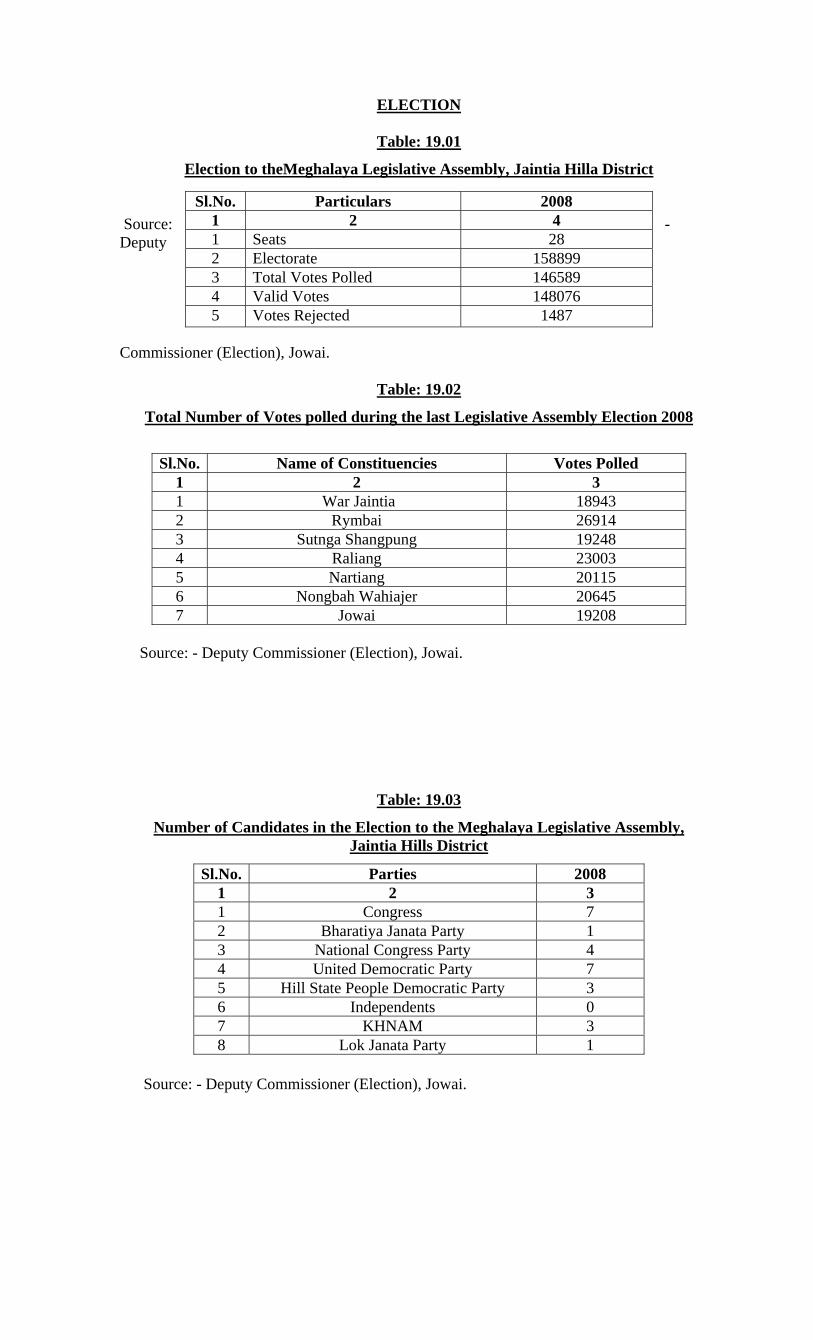
ELECTION
Table: 19.01
Election to theMeghalaya Legislative Assembly, Jaintia Hilla District Source: - Deputy
Commissioner (Election), Jowai.
Table: 19.02
Total Number of Votes polled during the last Legislative Assembly Election 2008
Sl.No. Name of Constituencies Votes Polled
1 2 3 1 War Jaintia 18943 2 Rymbai 26914 3 Sutnga Shangpung 19248 4 Raliang 23003 5 Nartiang 20115 6 Nongbah Wahiajer 20645 7 Jowai 19208
Source: - Deputy Commissioner (Election), Jowai.
Table: 19.03
Number of Candidates in the Election to the Meghalaya Legislative Assembly, Jaintia Hills District
Source: - Deputy Commissioner (Election), Jowai.
Sl.No. Particulars 2008 1 2 4 1 Seats 28 2 Electorate 158899 3 Total Votes Polled 146589 4 Valid Votes 148076 5 Votes Rejected 1487
Sl.No. Parties 2008 1 2 3 1 Congress 7 2 Bharatiya Janata Party 1 3 National Congress Party 4 4 United Democratic Party 7 5 Hill State People Democratic Party 3 6 Independents 0 7 KHNAM 3 8 Lok Janata Party 1

Table: 19.04
Number of Candidates who contested to the Meghalaya Legislative Assembly
Name of
Constituency Name of Candidates with their respective
political parties Votes polled in their
favour 1 2 3
Junior Lamin BJP 109 Lahkmen Rymbui (E) INC 6896 Paul Lamin NCP 3230 Riang Lenon Tariang UDP 5996 Camillus Albert Lamin KHNAM 2613
1. War Jaintia
Sevenson Dhar LJP 99 Balios Swer UDP 1980 Nehlang Lyngdoh (E) INC 12893 Simon Shiangshai NCP 5856 Obil Kyndait HSPDP 3853
2. Rymbai
Tariang Massar KHNAM 2332 Richard Sing Lyngdoh UDP 7938
Shitlang Pale (E) INC 9814
3.Sutnga Shanpung
Bison Paslein KHNAM 1496 Comingone Ymbon (E) INC 12756 Mihsalan Suchiang UDP 6913
4.Raliang
Smt. Rita M.V.Lyngdoh MDP 3334 E.C Boniface Bamon (E) NCP 7120 Draison Kharshiing INC 6669 Henry Lamin UDP 3799
5. Nartiang
H. Britainwar Dan HSPDP 2527 Edmund Speakerson Lyngdoh MDP 5119 Sniawbhalang Dhar (E) INC 8452 Thaw Ain Plain UDP 6973
6. Nongbah Wahiajer
Darling Wavel Lamare HSPDP 101 Moonlight Pariat NCP 4377 Roytre Christopher Laloo INC 7712
7. Jowai
Sing Mullieh UDP 7119 Source: - Deputy Commissioner (Election), Jowai.
Table: 19.05
Election to the Jaintia Hills Autonomous District Council 2004
Sl.No. Particulars 2004
1 2 3 1 Seats 29 2 Electorates 177967 3 Total Votes Polled 149309 4 Valid Votes 147409 5 Votes Rejected 1900
Source: - Deputy Commissioner (Election), Jowai.

ELECTRICITY
Table: 20.01
Number of Villages Electrified
Villages Electrified Sl. No.
Particulars 2006 2007
1 2 3 4 1 Thadlaskein 7 3 2 Laskein 6 2 3 Khliehriat 16 7 4 Amlarem 4 Nil 5 Total 33 12
Sl. No.
Particulars
2006
2007
1 2 3 4
1 Installed Capacity (KVA) 1426 266
2 Generating Capacity (MKWH) - -
3 Per Capita Consumption (KWH) - -
Source: - Executive Engineer, Me.S.E.B, Jowai.

EXCISE
Table: 21.01
Consumption of Indian made Liquor, Local Liquor
Sl. No.
Items Unit 2006 2007
1 2 3 4 5 1 a
Local Liquor (Patta only) Number of Patta Shops
Nos. 230 232
2 b
Indian made Foreign Liquor Number of Shops
Nos.
82 90
3 Indian made Foreign Liquor consumed Litres N.A N.A Source: - Superintendent of Excise, Jowai.

SUPPLY
Table: 22.01
Number of Fair Price Shops
Sl. No.
Particulars Units 2006 2007
1 2 3 4 5 1 Fair Price Shops Nos. 196 197 2
Commodities Distributeda) Rice 1) APL 2) BPL 3) AAY b) Sugar
M.T M.T M.T M.T
3100.20 2298.996 946.344 566.60
3206.40 2259.18 986.16 750.80
Source: - Deputy Commissioner (Supply) Jaintia Hills District, Jowai.

FINANCE
Table: 23.01
Collection of Excise, Revenue, Sales Tax, Taxes on Petroleum , Motor Spirit etc.
Sl. No.
Items 2005 2006 2007
1 2 3 4 5 1
Profession, Trades calling and Employment Tax Act.
Nil
Nil
Nil
2
Central Sales Tax Act.
3,98,94,726.00
1,31,96,669.00
1,21,15,134.00
3
Meghalaya Finance Sales Tax Act.
46,43,619.00
16,59,202.00
13,742.00
4
Meghalaya Sales Tax
96,43,720.00
2,99,102.00
104.00
5
Motor Spirit and Lubricants
3,05,315.00
4,74,885.00
50,500.00
6
Meghalaya Passenger and Goods Tax
21,05,286.00
20,96,728.00
21,50,007.00
7
Electricity Duty Act
Nil
Nil
Nil
8
Amusement and Betting Tax Act
5,33,882.00
3,85,151.00
3,63,025.00
9
Total
5,65,92,666.00
1,81,11.737.00
1,46,92,512.00
Source: - Superintendent of Taxes, Jowai.