static-content.springer.com10.1007/s40… · Web viewstatic-content.springer.com
ONLINE APPENDIX
ROBUSTNESS CHECK RESULTS
Lewbel 2SLS
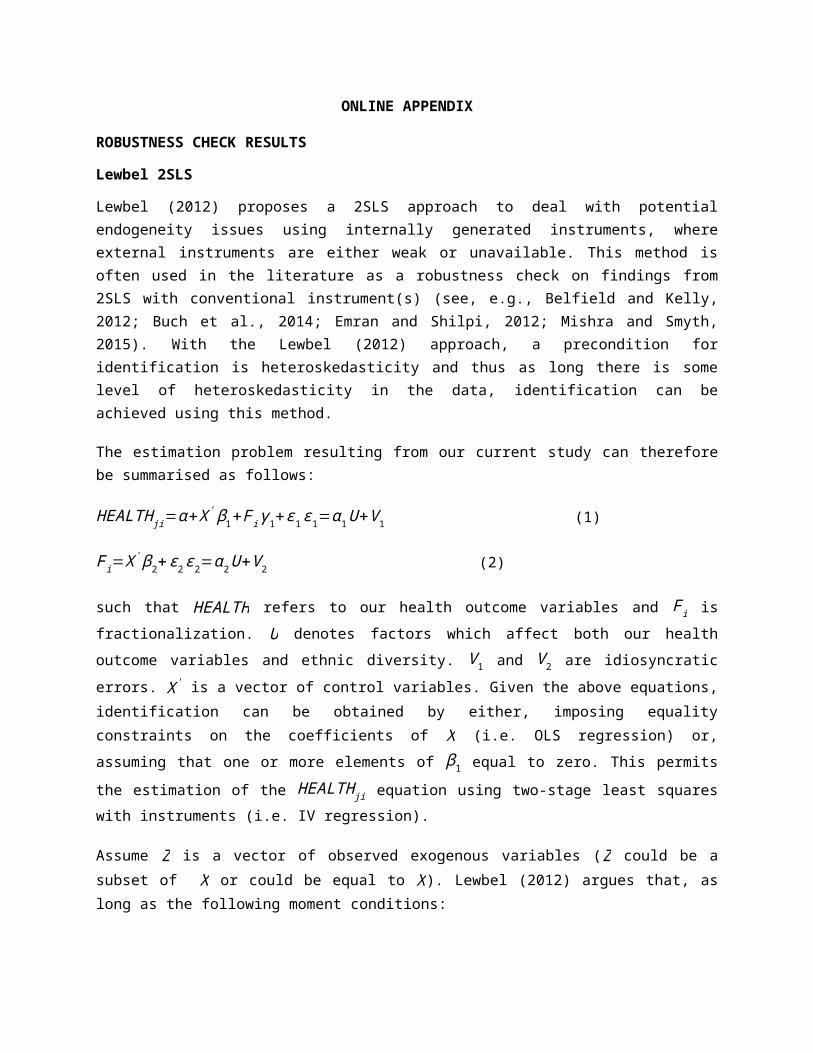
Lewbel (2012) proposes a 2SLS approach to deal with potential endogeneity issues using internally generated instruments, where external instruments are either weak or unavailable. This method is often used in the literature as a robustness check on findings from 2SLS with conventional instrument(s) (see, e.g., Belfield and Kelly, 2012; Buch et al., 2014; Emran and Shilpi, 2012; Mishra and Smyth, 2015) . With the Lewbel (2012) approach, a precondition for identification is heteroskedasticity and thus as long there is some level of heteroskedasticity in the data, identification can be achieved using this method.
The estimation problem resulting from our current study can therefore be summarised as follows:
HEALTH ji=α+X' β1+Fi γ 1+ϵ 1 ϵ1=α1U+V 1 (1)
F i=X' β2+ϵ 2 ϵ 2=α 2U+V 2 (2)
such that HEALTH refers to our health outcome variables and F i is fractionalization. U denotes factors which affect both our health outcome variables and ethnic diversity. V 1 and V 2 are idiosyncratic errors. X ' is a vector of control variables. Given the above equations, identification can be obtained by either, imposing equality constraints on the coefficients of X (i.e. OLS regression) or, assuming that one or more elements of β1 equal to zero. This permits the estimation of the HEALTH ji equation using two-stage least squares with instruments (i.e. IV regression).
Assume Z is a vector of observed exogenous variables (Z could be a subset of X or could be equal to X). Lewbel (2012) argues that, as long as the following moment conditions:
E (X ϵ 1 )=0 ,E ( X ϵ 2)=0 ,Cov (Z , ϵ 1 ϵ 2)=0
and some heteroskedasticity of ϵ j are met, one can estimate the above set of equations by using
[Z−E (Z ) ] ϵ2 as an instrument.
Lewbel (2012) also suggests that in case we have some additional ordinary (external) instruments (say P), we can estimate the HEALTH jiand F i equations by 2SLS or GMM estimation using P and an
estimate of [Z−E (Z ) ] ϵ2 as instruments. Proofs for the above methodology and steps to reaching these conclusions are presented in Lewbel (2012).

References
Belfield, C. R., & Kelly, I. R. (2012). The Benefits of Breast Feeding across the Early Years of Childhood. Journal of Human Capital, 6(3), 251-277. doi: 10.1086/667415
Buch, C., Kesternich, I., Lipponer, A., & Schnitzer, M. (2014). Financial constraints and foreign direct investment: firm-level evidence. Review of World Economics, 150(2), 393-420. doi: 10.1007/s10290-013-0184-z
Emran, M. S., & Shilpi, F. (2012). The extent of the market and stages of agricultural specialization. Canadian Journal of Economics/Revue canadienne d'économique, 45(3), 1125-1153.
Lewbel, A. (2012). Using heteroscedasticity to identify and estimate mismeasured and endogenous regressor models. Journal of Business & Economic Statistics, 30(1), 67-80.
Mishra, V., & Smyth, R. (2015). Estimating Returns to Schooling in Urban China Using Conventional and Heteroskedasticity-based Instruments. Economic Modelling, 47, 166-173

Table A1 – Effects of Ethnic diversity on Immunization and Disease Treatment (Lewbel 2SLS)(1) (2) (3) (4) (5) (6)
VARIABLES Immunization (BCG)
Immunization (DPT)
Immunization (HepB3)
Immunization (Hib3)
Immunization (Pol3)
Immunization (Measles)
Ethnic -0.07 -0.14* -0.29** -0.21 -0.15* -0.13(0.08) (0.08) (0.12) (0.19) (0.08) (0.08)
Regional Dummies Yes Yes Yes Yes Yes YesObservations 89 93 81 77 93 93R-squared 0.77 0.56 0.83 0.79 0.75 0.90
Robust standard errors in parentheses*** p<0.01, ** p<0.05, * p<0.1
Table A2 – Effects of Ethnic Diversity on Prevalence of Health Issues (Lewbel 2SLS)(1) (2) (3) (4) (5) (6) (7)
VARIABLES HIV Prevalence
Anaemia Prevalence (Children)
Anaemia Prevalence (Women)
Syphilis Prevalence
Malaria Prevalence
Tuberculosis Prevalence
Undernourishment Prevalence
Ethnic 9.04* 0.55** 0.53** 1.30** 3.62** 1.20 0.32(5.12) (0.26) (0.25) (0.60) (1.53) (0.86) (0.31)
Regional Dummies
Yes Yes Yes Yes Yes Yes Yes
Observations 60 93 93 48 52 93 55R-squared 0.33 0.84 0.71 0.49 0.38 0.78 0.50
Robust standard errors in parentheses*** p<0.01, ** p<0.05, * p<0.1
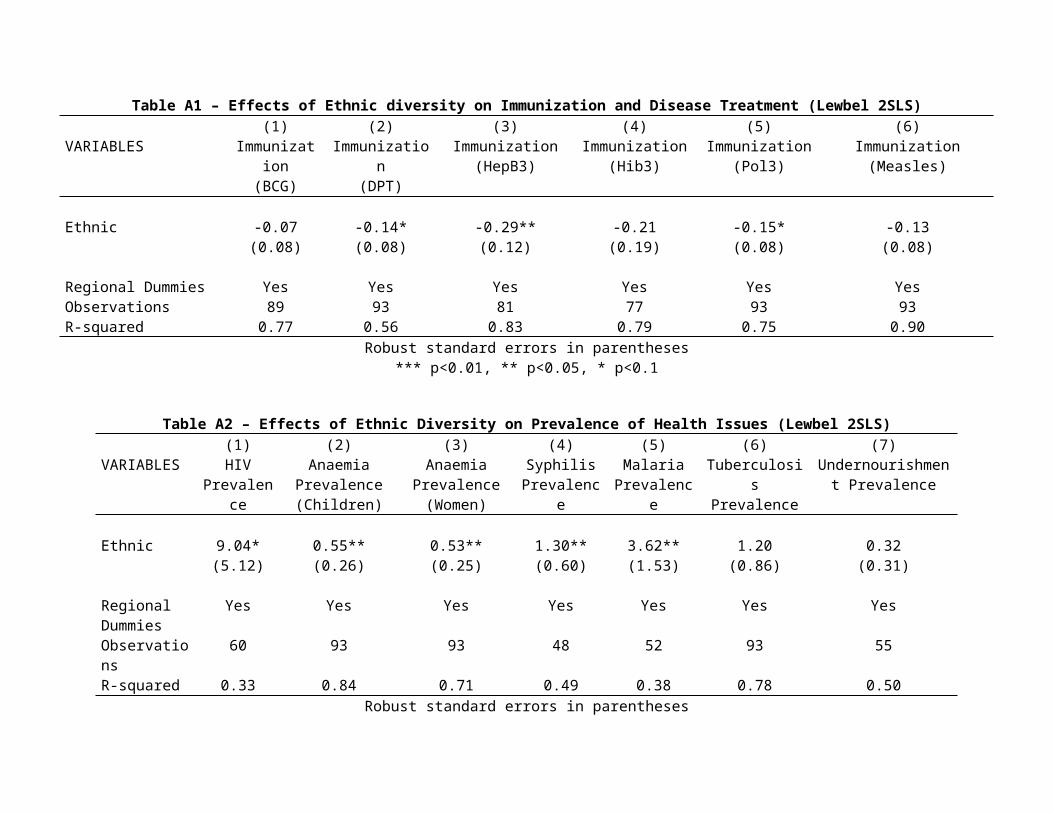
Table A3 – Effects of Ethnic Diversity on Life Expectancy and Mortality Rates (Lewbel 2SLS)(1) (2) (3) (4) (5) (6)
VARIABLES Life Expectanc
y
AIDs Deaths
Maternal Mortality
Mortality (Female)
Mortality (Male)
Mortality (Infant)
Ethnic -0.22** 4.01*** 0.99 1.02** 0.92*** 0.65*(0.10) (1.40) (0.75) (0.42) (0.29) (0.39)
Regional Dummies Yes Yes Yes Yes Yes YesObservations 93 61 88 93 93 93R-squared 0.76 0.56 0.83 0.79 0.76 0.89
Robust standard errors in parentheses*** p<0.01, ** p<0.05, * p<0.1
Table A4 – Effects of Ethnic Diversity on Infrastructure, Staff and Other Outcomes (Lewbel 2SLS)(1) (2) (3) (4) (5) (6) (7) (8)
VARIABLES Number of Beds
Improved Water Source
Improved Sanitation Facilities
CommunityHealth
Workers
Physician Iodized Salt Consumption
Contraceptive Prevalence
Fertility Rate
Ethnic 0.45 -0.06 -0.44 -1.11 -0.76 -0.36** -0.04 0.29*(0.41) (0.15) (0.42) (0.71) (0.87) (0.15) (0.31) (0.17)
Regional Dummies
Yes Yes Yes Yes Yes Yes Yes Yes
Observations 93 93 91 32 93 61 89 93R-squared 0.73 0.69 0.66 0.57 0.69 0.41 0.81 0.85
Robust standard errors in parentheses*** p<0.01, ** p<0.05, * p<0.1

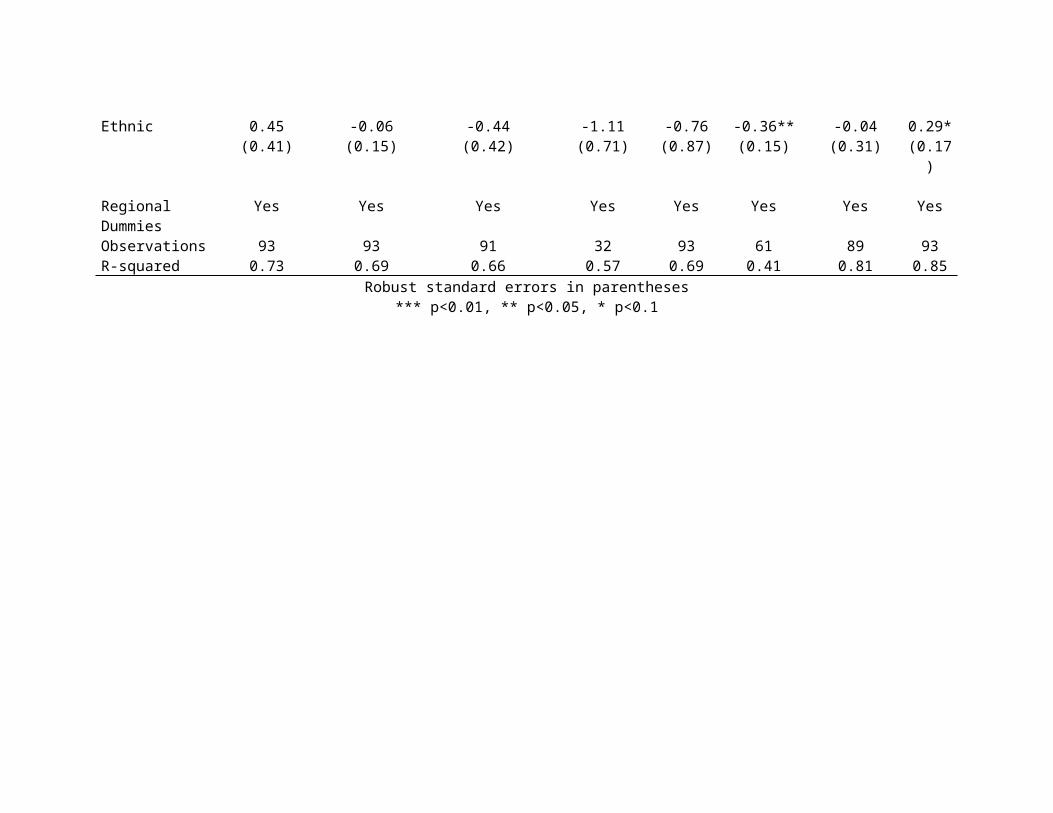
Table A5 – Effects of Linguistic diversity on Immunization and Disease Treatment (Lewbel 2SLS) (1) (2) (3) (4) (5) (6)
VARIABLES Immunization (BCG)
Immunization (DPT)
Immunization (HepB3)
Immunization (Hib3)
Immunization (Pol3)
Immunization (Measles)
Language -0.24* -0.23 -0.63** -0.07 -0.23 -0.22**(0.13) (0.18) (0.23) (0.27) (0.18) (0.06)
Regional Dummies Yes Yes Yes Yes Yes YesObservations 88 90 77 71 90 90R-squared 0.12 0.66 0.30 0.31 0.66 0.65
Robust standard errors in parentheses*** p<0.01, ** p<0.05, * p<0.1
Table A6 – Effects of Linguistic Diversity on Prevalence of Health Issues (Lewbel 2SLS)(1) (2) (3) (4) (5) (6) (7)
VARIABLES HIV Prevalence
Anaemia Prevalence (Children)
Anaemia Prevalence (Women)
Syphilis Prevalence
Malaria Prevalence
Tuberculosis Prevalence
Undernourishment Prevalence
Language 14.84*** 0.71*** 0.57** 1.62*** 3.11** 2.06** 0.06(4.55) (0.24) (0.23) (0.63) (1.39) (0.80) (0.31)
Regional Dummies
Yes Yes Yes Yes Yes Yes Yes
Observations 64 90 90 50 56 90 58R-squared 0.22 0.83 0.70 0.46 0.36 0.72 0.41
Robust standard errors in parentheses*** p<0.01, ** p<0.05, * p<0.1

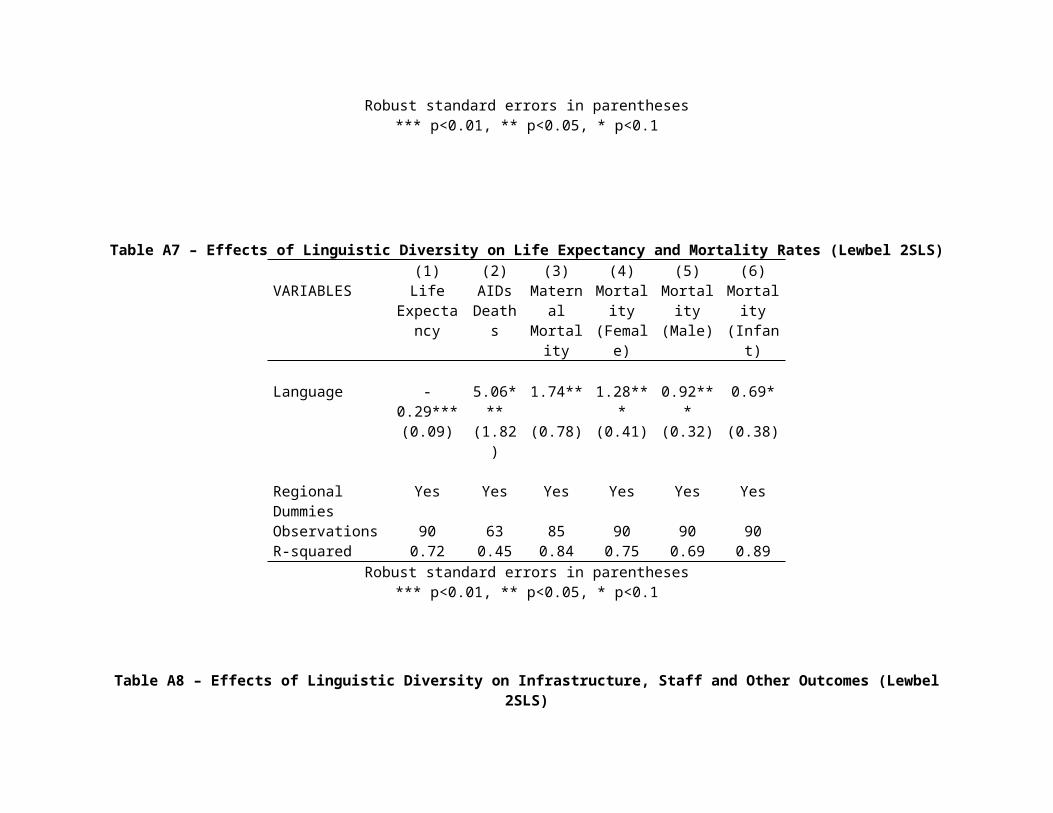
Table A7 – Effects of Linguistic Diversity on Life Expectancy and Mortality Rates (Lewbel 2SLS)(1) (2) (3) (4) (5) (6)
VARIABLES Life Expectanc
y
AIDs Deaths
Maternal Mortality
Mortality (Female)
Mortality (Male)
Mortality (Infant)
Language -0.29*** 5.06*** 1.74** 1.28*** 0.92*** 0.69*(0.09) (1.82) (0.78) (0.41) (0.32) (0.38)
Regional Dummies Yes Yes Yes Yes Yes YesObservations 90 63 85 90 90 90R-squared 0.72 0.45 0.84 0.75 0.69 0.89
Robust standard errors in parentheses*** p<0.01, ** p<0.05, * p<0.1
Table A8 – Effects of Linguistic Diversity on Infrastructure, Staff and Other Outcomes (Lewbel 2SLS)(1) (2) (3) (4) (5) (6) (7) (8)
VARIABLES Number of Beds
Improved Water Source
Improved Sanitation Facilities
CommunityHealth
Workers
Physician Iodized Salt Consumption
Contraceptive Prevalence
Fertility Rate
Language 0.14 -0.11 -0.82* -0.67 -1.74* 0.55 -0.06 0.50***(0.50) (0.14) (0.49) (1.74) (0.94) (1.04) (0.34) (0.19)
Regional Dummies
Yes Yes Yes Yes Yes Yes Yes Yes
Observations 90 90 88 33 90 64 87 90R-squared 0.73 0.69 0.65 0.56 0.67 0.23 0.78 0.83
Robust standard errors in parentheses*** p<0.01, ** p<0.05, * p<0.1
2SLS RESULTS WITH ALTERNATIVE INSTRUMENTS
Table A9 – Effects on Immunization and Disease Treatment (1) (2) (3) (4) (5) (6)
VARIABLES Immunization (BCG)
Immunization (DPT)
Immunization (HepB3)
Immunization (Hib3)
Immunization (Pol3)
Immunization (Measles)
Panel A : Ethnic FractionalizationEthnic -0.04 -0.11* -0.22* -0.39*** -0.13** -0.10
(0.07) (0.07) (0.13) (0.14) (0.06) (0.07)
Observations 83 87 75 72 87 87R-squared 0.18 0.75 0.25 0.38 0.76 0.71Panel B: Linguistic FractionalizationLinguistic -0.10* -0.08 -0.47*** -0.48*** -0.11 -0.09
(0.06) (0.07) (0.17) (0.12) (0.07) (0.07)[-0.19] [-0.10] [-0.38] [-0.41] [-0.13] [-0.11]
Observations 83 85 72 67 85 85R-squared 0.15 0.66 0.34 0.40 0.67 0.64
Robust standard errors adjusted for heteroskedasticity in parenthesesStandardized coefficients in brackets
*** p<0.01, ** p<0.05, * p<0.1
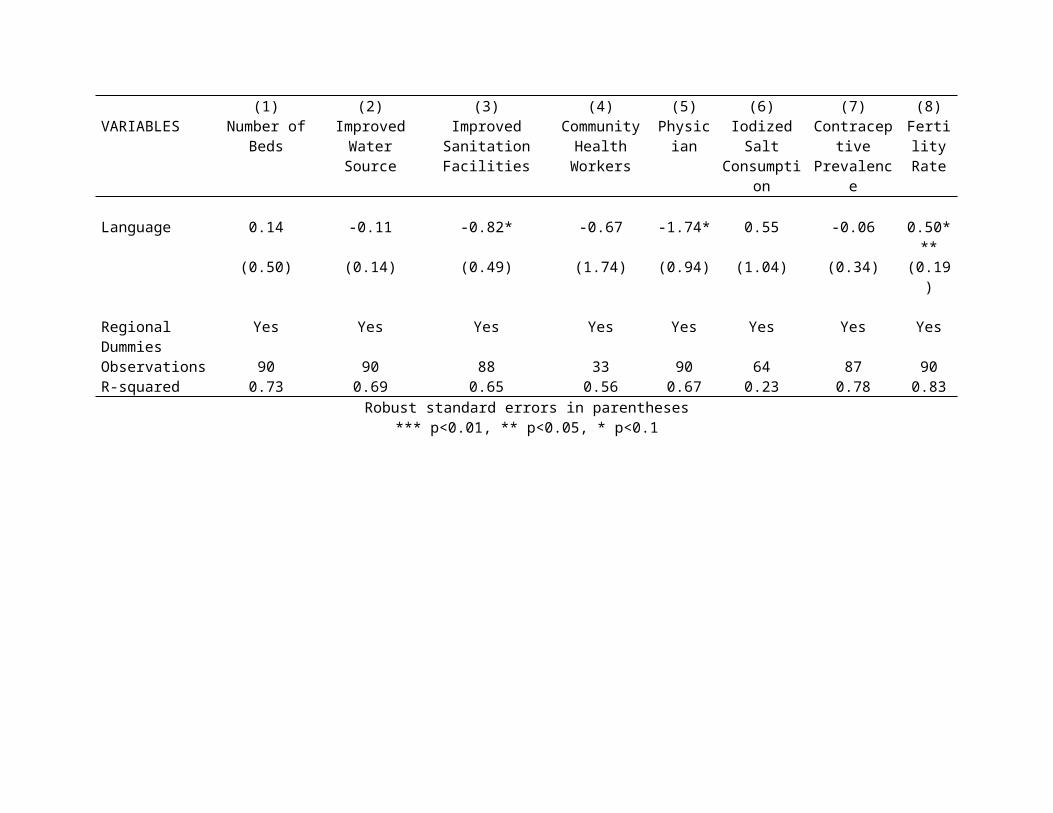
Table A10 – Effects on Prevalence of Health Issues(1) (2) (3) (4) (5) (6) (7)
VARIABLES HIV Prevalence
Anaemia Prevalence (Children)
Anaemia Prevalence (Women)
Syphilis Prevalence
Malaria Prevalence
Tuberculosis Prevalence
Undernourishment Prevalence
Panel A : Ethnic FractionalizationEthnic 6.64* 0.36** 0.29** 1.38** 4.02** 1.16*** 0.48
(3.53) (0.15) (0.14) (0.63) (1.66) (0.42) (0.35)
Observations 58 87 87 47 49 87 52R-squared 0.38 0.86 0.74 0.50 0.38 0.82 0.50Panel B: Linguistic FractionalizationLinguistic 7.47*** 0.38*** 0.32** 1.85*** 3.15** 1.28*** 0.17
(2.70) (0.12) (0.13) (0.53) (1.53) (0.37) (0.35)[0.43] [0.16] [0.19] [0.41] [0.30] [0.25] [0.08]
Observations 62 85 85 49 53 85 55R-squared 0.41 0.85 0.73 0.53 0.35 0.80 0.41
Robust standard errors adjusted for heteroskedasticity in parenthesesStandardized coefficients in brackets
*** p<0.01, ** p<0.05, * p<0.1

Table A11 – Effects on Life Expectancy and Mortality Rates(1) (2) (3) (4) (5) (6)
VARIABLES Life Expectanc
y
AIDs Deaths
Maternal Mortality
Mortality (Female)
Mortality (Male)
Mortality (Infant)
Panel A : Ethnic FractionalizationEthnic -0.21*** 3.93*** 0.94* 0.91*** 0.79*** 0.63***
(0.05) (0.89) (0.49) (0.22) (0.15) (0.22)
Observations 87 59 82 87 87 87R-squared 0.77 0.57 0.83 0.79 0.76 0.90Panel B: Linguistic FractionalizationLinguistic -0.19*** 3.31*** 1.15** 0.81*** 0.65*** 0.60***
(0.05) (0.86) (0.44) (0.19) (0.15) (0.20)
Observations 85 61 80 85 85 85R-squared 0.75 0.53 0.84 0.78 0.71 0.90
Robust standard errors adjusted for heteroskedasticity in parenthesesStandardized coefficients in brackets
*** p<0.01, ** p<0.05, * p<0.1

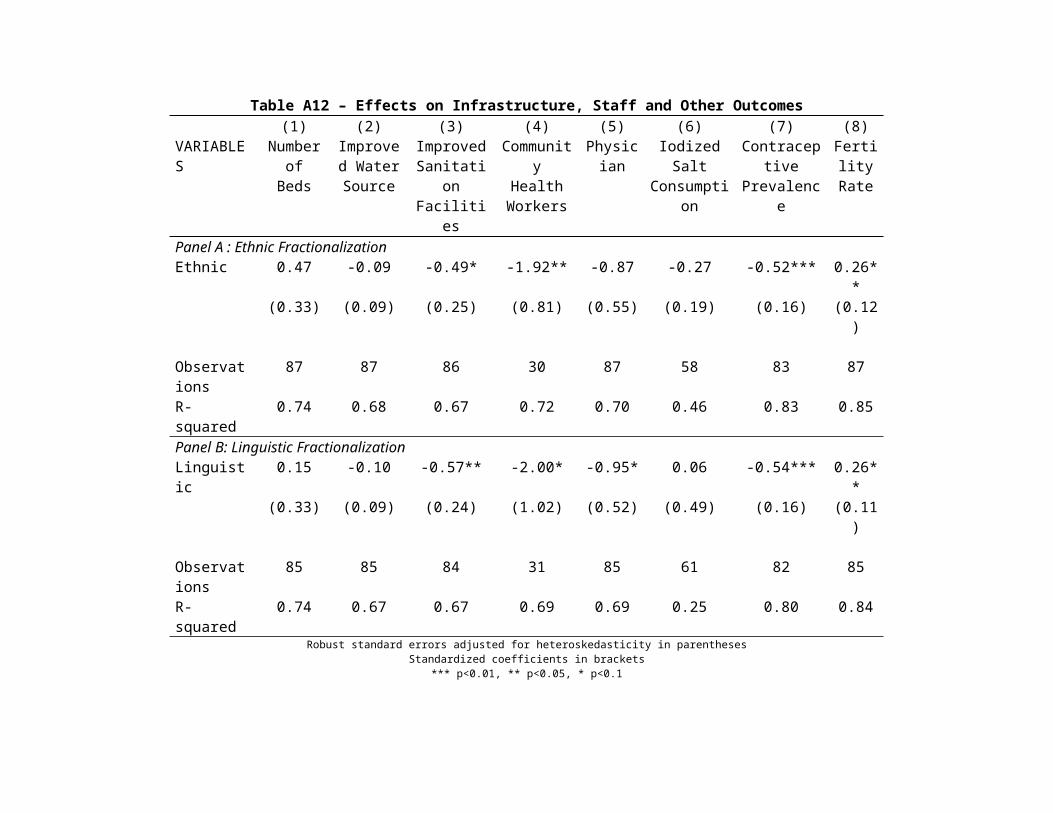
Table A12 – Effects on Infrastructure, Staff and Other Outcomes(1) (2) (3) (4) (5) (6) (7) (8)
VARIABLES Number of Beds
Improved Water Source
Improved Sanitation Facilities
CommunityHealth
Workers
Physician Iodized Salt Consumption
Contraceptive Prevalence
Fertility Rate
Panel A : Ethnic FractionalizationEthnic 0.47 -0.09 -0.49* -1.92** -0.87 -0.27 -0.52*** 0.26**
(0.33) (0.09) (0.25) (0.81) (0.55) (0.19) (0.16) (0.12)
Observations 87 87 86 30 87 58 83 87R-squared 0.74 0.68 0.67 0.72 0.70 0.46 0.83 0.85Panel B: Linguistic FractionalizationLinguistic 0.15 -0.10 -0.57** -2.00* -0.95* 0.06 -0.54*** 0.26**
(0.33) (0.09) (0.24) (1.02) (0.52) (0.49) (0.16) (0.11)
Observations 85 85 84 31 85 61 82 85R-squared 0.74 0.67 0.67 0.69 0.69 0.25 0.80 0.84
Robust standard errors adjusted for heteroskedasticity in parenthesesStandardized coefficients in brackets
*** p<0.01, ** p<0.05, * p<0.1

Propensity Score Matching (PSM)
PSM may be used to determine the average effect of the treatment (less fractionalized countries) on our
health outcome variables. PSM addresses potential endogeneity and allows us to draw a causal
inference about the effect of fractionalization on health-related variables with non-experimental data
(see, e.g., Belfield and Kelly, 2012; Cheng et al., 2015; Dehejia and Wahba, 2002). In our study, the
treatment is considered as less fractionalized countries given that OLS results indicate poorer health
outcomes for more fractionalized countries. We argue that more homogenous countries may have the
advantage in achieving better health outcomes. In our dataset, we consider countries with indices of
fractionalization below 0.5 as less fractionalized and those above 0.5 as highly fractionalized.
In order to draw causal inferences about the effect of ethnic diversity on health outcomes using PSM,
we ask the question: What is the outcome (in terms of health) for average individual j who is treated
(i.e., lives in a less fractionalized country) relative to the hypothetical outcome that would have
prevailed if the same individual lived in a heterogeneous country? We estimate the average treatment
effect as follows:
τ ≡E {O1−O0∨B=1 }
¿ E {E {O1−O0|B=1 , p (W ) }}
¿ E {E {O1∨B=1 , p(W )−E {O0|B=0 , p (W ) }∨B=1}
Where τ is the average effect of the treatment, B is a dichotomous variable equal to one if a less
fractionalized country and zero if otherwise. O represents health outcomes such as mortality rate, life
expectancy, immunization rates, etc. W is a vector of pre-treatment characteristics represented by the
covariates in our models. The propensity score, p (W ), is the probability of having poorer health
outcomes given pre-treatment characteristics (W ¿ (See Becker and Ichino (2002) and Rosenbaum and
Rubin (1983) for more details). Comparing two-staged least squares (2SLS) and PSM methods, while the
assumption of selection on observables using PSM is strong, Dehejia and Wahba (1999) find that PSM
gives estimates of the treatment effect that are closer to using experimental data than do traditional
econometric methods for non-experimental data.
References
Becker, S. O., & Ichino, A. (2002). Estimation of average treatment effects based on propensity scores. The stata journal, 2(4), 358-377.
Belfield, C. R., & Kelly, I. R. (2012). The Benefits of Breast Feeding across the Early Years of Childhood. Journal of Human Capital, 6(3), 251-277. doi: 10.1086/667415
Cheng, Z., Smyth, R., & Guo, F. (2015). The impact of China’s new Labour Contract Law on socioeconomic outcomes for migrant and urban workers. Human relations, 68(3), 329-352.
Dehejia, R. H., & Wahba, S. (2002). Propensity score-matching methods for nonexperimental causal studies. Review of Economics and Statistics, 84(1), 151-161.
Dehejia, R. H. and Wahba, S. 1999. Causal effects in non-experimental studies: Reevaluating the evaluation of training programs. Journal of the American Statistical Association, 94(448), pp. 1053-1062
DeLoach, S. B., & Lamanna, E. (2011). Measuring the Impact of Microfinance on Child Health Outcomes in Indonesia. World Development, 39(10), 1808-1819.
Rosenbaum, P. R., & Rubin, D. B. (1983). The central role of the propensity score in observational studies for causal effects. Biometrika, 70(1), 41-55.
Table A13 - Effects of Fractionalization on Immunization (PSM)(1) (2) (3) (4) (5) (6)
VARIABLES Immunization (BCG)
Immunization (DPT)
Immunization (HepB3)
Immunization (Hib3)
Immunization (Pol3)
Immunization (Measles)
Ethnic 0.06** 0.08** 0.12** 0.13** 0.07** 0.08***(0.03) (0.03) (0.05) (0.05) (0.03) (0.03)
Observations 83 87 75 72 87 87
Linguistic 0.09*** 0.01 0.24*** 0.13** 0.01 0.01(0.03) (0.05) (0.09) (0.05) (0.05) (0.05)
Observations 84 86 73 68 86 86Standard errors in parentheses*** p<0.01, ** p<0.05, * p<0.1
Table A14 - Effects of Fractionalization on Prevalence of Health Problems (PSM)(1) (2) (3) (4) (5) (6) (7)
VARIABLES HIV Prevalence
Anaemia Prevalence (Children)
Anaemia Prevalence (Women)
Syphilis Prevalence
Malaria Prevalence
Tuberculosis Prevalence
Undernourishment Prevalence
Ethnic -6.31*** -0.27** -0.17 -1.46*** -2.72*** -0.91*** -0.19(1.53) (0.11) (0.11) (0.32) (0.87) (0.30) (0.18)
Observations 58 87 87 47 49 87 52
Linguistic -2.04 -0.01 -0.01 -0.99*** -3.31*** -0.09 -0.07(3.14) (0.15) (0.05) (0.37) (0.56) (0.47) (0.12)
Observations 63 86 86 50 54 86 56Standard errors in parentheses*** p<0.01, ** p<0.05, * p<0.1
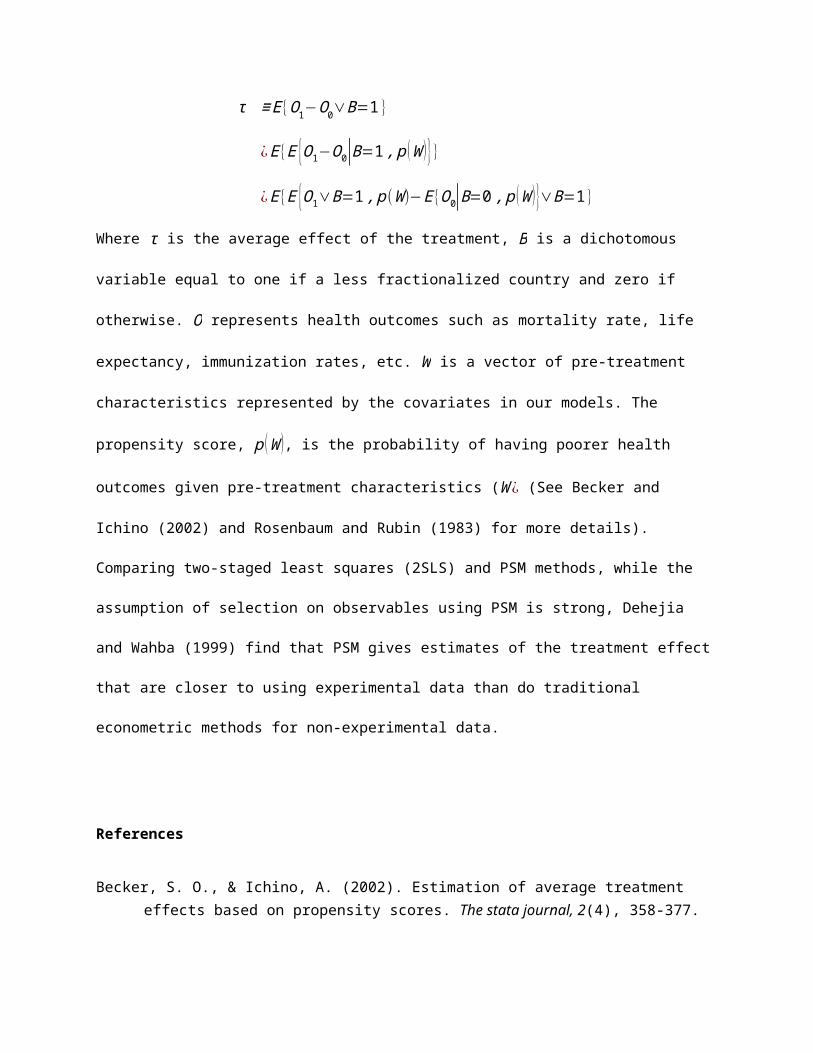
Table A15 - Effects of Fractionalization on Life Expectancy and Mortality Rates (PSM)(1) (2) (3) (4) (5) (6)
VARIABLES Life Expectancy
AIDs Deaths
Maternal Mortality
Mortality (Female)
Mortality (Male)
Mortality (Infant)
Ethnic 0.11*** -2.99** -0.50** -0.50*** -0.39*** -0.46**(0.03) (1.36) (0.25) (0.13) (0.11) (0.20)
Observations 87 59 82 87 87 87
Linguistic 0.03* -1.74*** -0.21 -0.11 -0.03 -0.01(0.02) (0.47) (0.53) (0.16) (0.15) (0.24)
Observations 86 62 81 86 86 86Standard errors in parentheses*** p<0.01, ** p<0.05, * p<0.1
Table A16 - Effects of Ethnic Fractionalization on Infrastructure, Staff and Other Outcomes (PSM)(1) (2) (3) (4) (5) (6) (7) (8)
VARIABLES Number of Beds Improved Water Source
Improved Sanitation Facilities
CommunityHealth Workers
Physician Iodized Salt Consumption
Contraceptive Prevalence
Fertility Rate
Ethnic 0.01 0.07 0.44*** 1.03* 0.65*** 0.11 0.30*** -0.05(0.15) (0.05) (0.11) (0.59) (0.23) (0.10) (0.11) (0.10)
Observations 87 87 86 30 87 58 83 87
Linguistic -0.03 -0.00 0.13 1.66* 0.15 -0.64** 0.21*** -0.06*(0.16) (0.04) (0.16) (0.99) (0.28) (0.25) (0.07) (0.03)
Observations 86 86 85 32 86 61 83 86Standard errors in parentheses*** p<0.01, ** p<0.05, * p<0.1

ALTERNATIVE MEASURES OF FRACTIONALIZATION
Table A17 – Effects of Ethnic diversity on Immunization and Disease Treatment(1) (2) (3) (4) (5) (6)
VARIABLES Immunization (BCG)
Immunization (DPT)
Immunization (HepB3)
Immunization (Hib3)
Immunization (Pol3)
Immunization (Measles)
Ethnic -0.39 -0.51*** -1.86 0.10 -1.85*** -1.03***(0.35) (0.18) (1.64) (0.77) (0.51) (0.19)
Regional Dummies Yes Yes Yes Yes Yes YesObservations 95 99 85 80 99 99R-squared 0.07 0.62 0.62 0.26 0.63 0.30
Robust standard errors in parentheses*** p<0.01, ** p<0.05, * p<0.1
Table A18 – Effects of Ethnic Diversity on Prevalence of Health Issues(1) (2) (3) (4) (5) (6) (7)
VARIABLES HIV Prevalence
Anaemia Prevalence (Children)
Anaemia Prevalence (Women)
Syphilis Prevalence
Malaria Prevalence
Tuberculosis Prevalence
Undernourishment Prevalence
Ethnic 43.95** 2.74** 2.24** 2.46 17.97*** 6.11* 0.81(19.45) (1.24) (1.10) (1.73) (5.87) (3.13) (1.05)
Regional Dummies
Yes Yes Yes Yes Yes Yes Yes
Observations 67 99 99 56 59 99 62R-squared 0.38 0.41 0.14 0.36 0.44 0.28 0.32
Robust standard errors in parentheses*** p<0.01, ** p<0.05, * p<0.1

Table A19 – Effects of Ethnic Diversity on Life Expectancy and Mortality Rates(1) (2) (3) (4) (5) (6)
VARIABLES Life Expectancy
AIDs Deaths
Maternal Mortality
Mortality (Female)
Mortality (Male)
Mortality (Infant)
Ethnic -1.49** 17.49** 7.04** 4.98** 2.99** 4.38**(0.73) (6.89) (3.32) (2.39) (1.41) (2.10)
Regional Dummies
Yes Yes Yes Yes Yes Yes
Observations 99 68 94 99 99 99R-squared 0.55 0.51 0.42 0.68 0.07 0.48
Robust standard errors in parentheses*** p<0.01, ** p<0.05, * p<0.1
Table A20 – Effects of Ethnic Diversity on Infrastructure, Staff and Other Outcomes(1) (2) (3) (4) (5) (6) (7) (8)
VARIABLES Number of Beds
Improved Water Source
Improved Sanitation Facilities
CommunityHealth
Workers
Physician Iodized Salt Consumption
Contraceptive Prevalence
Fertility Rate
Ethnic 0.10 -0.80 -4.79** -3.98 -13.81* 0.81 -3.78* 1.76**(1.10) (0.54) (2.44) (3.59) (7.22) (1.14) (1.97) (0.82)
Regional Dummies
Yes Yes Yes Yes Yes Yes Yes Yes
Observations 99 99 97 35 99 68 95 99R-squared 0.73 0.48 0.50 0.56 0.65 0.25 0.17 0.54
Robust standard errors in parentheses*** p<0.01, ** p<0.05, * p<0.1
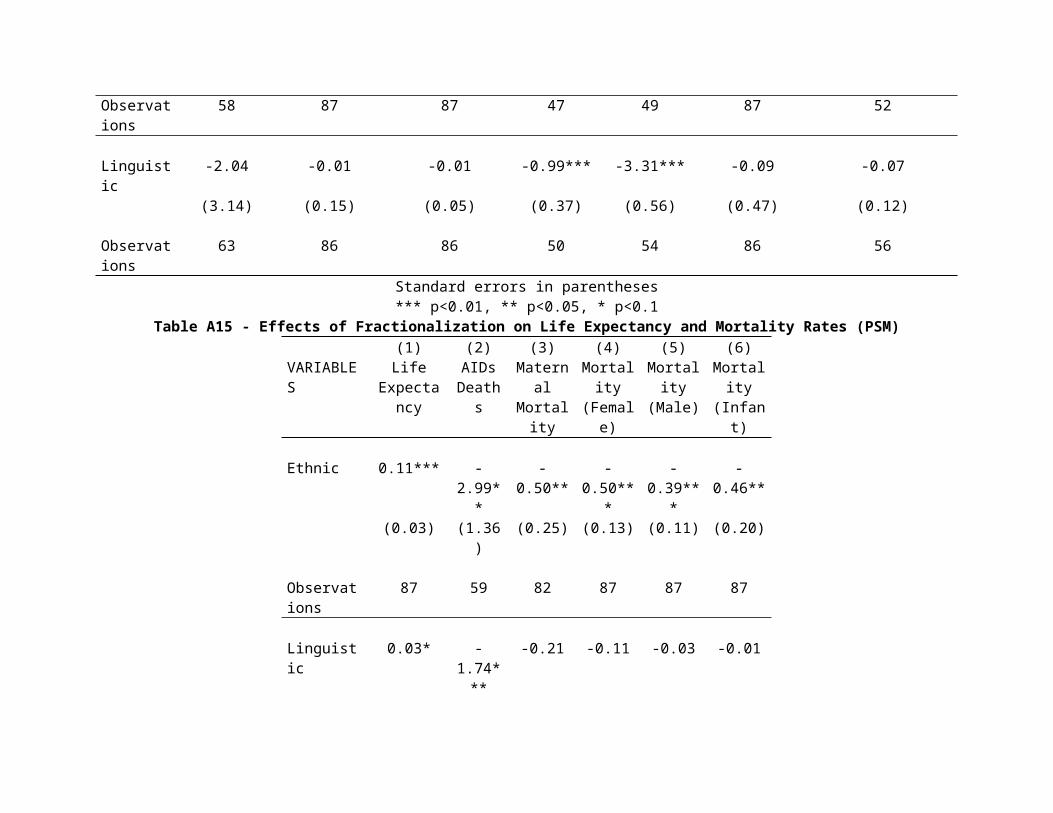
Table A21 – Effects of Linguistic diversity on Immunization and Disease Treatment (1) (2) (3) (4) (5) (6)
VARIABLES Immunization (BCG)
Immunization (DPT)
Immunization (HepB3)
Immunization (Hib3)
Immunization (Pol3)
Immunization (Measles)
Language -0.03 -0.22 -0.39** -0.03 -0.20 -0.34**(0.13) (0.14) (0.19) (0.17) (0.14) (0.14)
Regional Dummies Yes Yes Yes Yes Yes YesObservations 81 97 84 79 97 97R-squared 0.16 0.67 0.26 0.31 0.68 0.60
Robust standard errors in parentheses*** p<0.01, ** p<0.05, * p<0.1
Table A22 – Effects of Linguistic Diversity on Prevalence of Health Issues(1) (2) (3) (4) (5) (6) (7)
VARIABLES HIV Prevalence
Anaemia Prevalence (Children)
Anaemia Prevalence (Women)
Syphilis Prevalence
Malaria Prevalence
Tuberculosis Prevalence
Undernourishment Prevalence
Language 18.22*** 0.98*** 0.88*** 1.69* 7.42*** 2.32*** 0.45(3.94) (0.28) (0.25) (0.92) (2.02) (0.83) (0.45)
Regional Dummies
Yes Yes Yes Yes Yes Yes Yes
Observations 65 97 97 54 57 97 60R-squared 0.16 0.78 0.65 0.42 0.27 0.69 0.32
Robust standard errors in parentheses*** p<0.01, ** p<0.05, * p<0.1
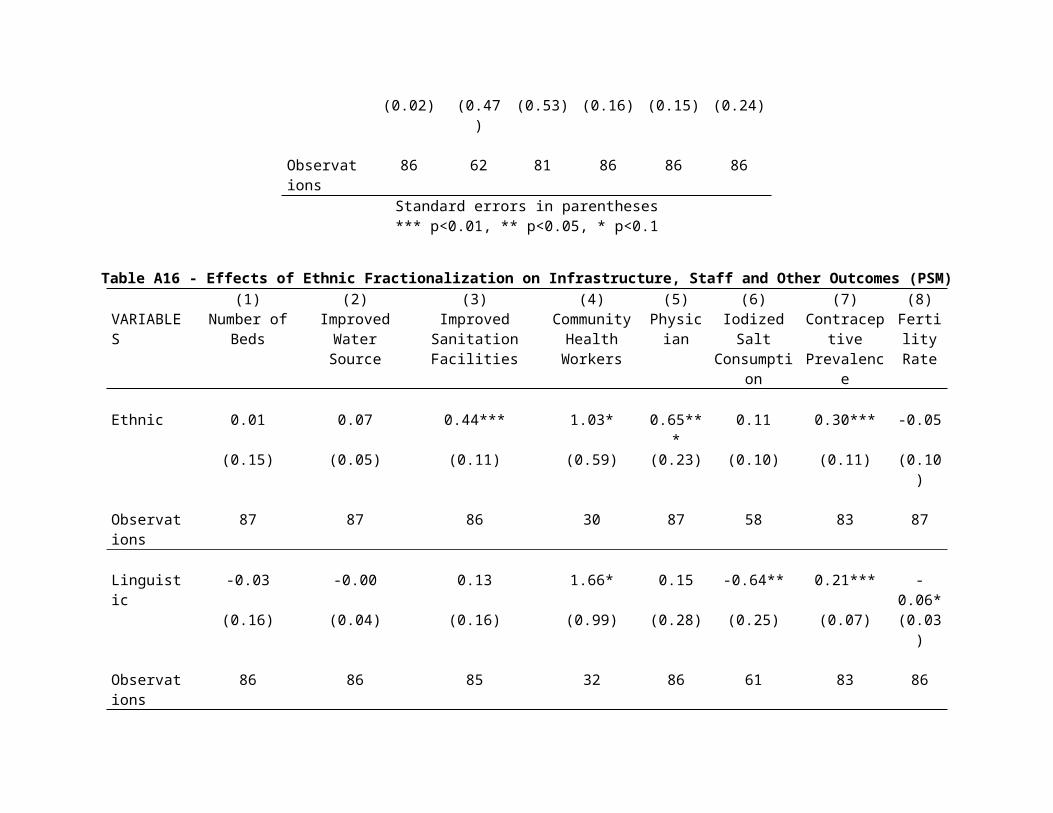
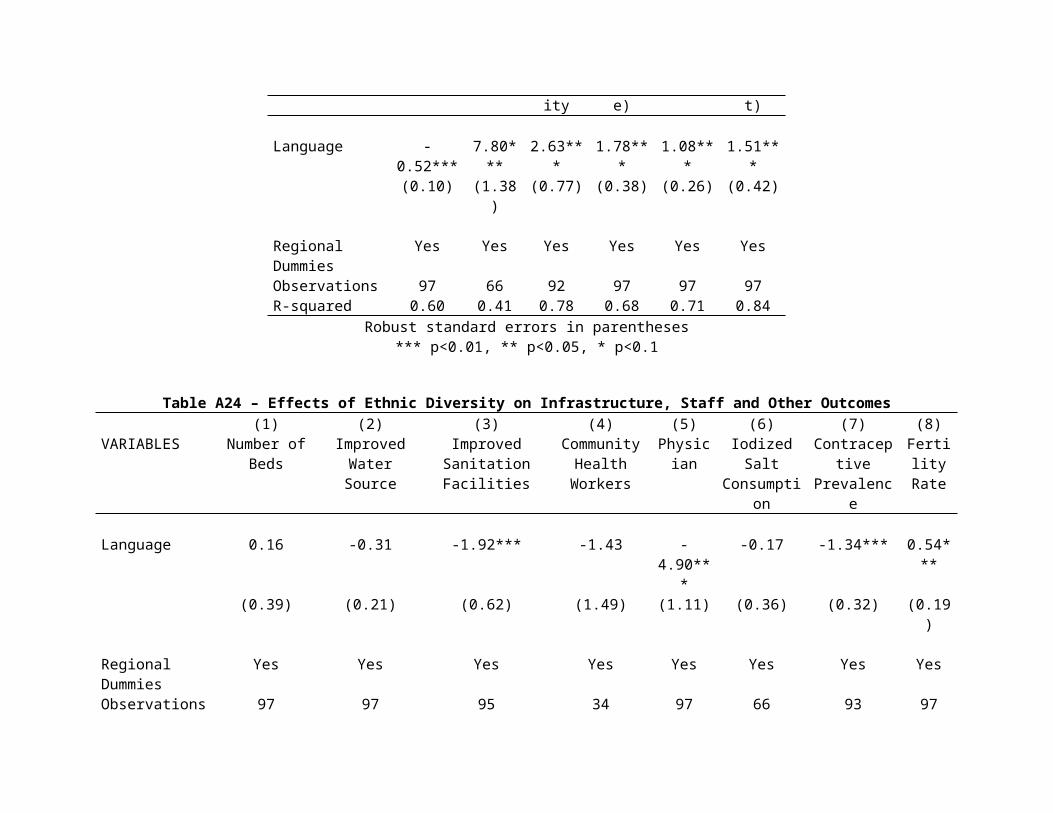
Table A23 – Effects of Linguistic Diversity on Life Expectancy and Mortality Rates(1) (2) (3) (4) (5) (6)
VARIABLES Life Expectanc
y
AIDs Deaths
Maternal Mortality
Mortality (Female)
Mortality (Male)
Mortality (Infant)
Language -0.52*** 7.80*** 2.63*** 1.78*** 1.08*** 1.51***(0.10) (1.38) (0.77) (0.38) (0.26) (0.42)
Regional Dummies Yes Yes Yes Yes Yes YesObservations 97 66 92 97 97 97R-squared 0.60 0.41 0.78 0.68 0.71 0.84
Robust standard errors in parentheses*** p<0.01, ** p<0.05, * p<0.1
Table A24 – Effects of Ethnic Diversity on Infrastructure, Staff and Other Outcomes(1) (2) (3) (4) (5) (6) (7) (8)
VARIABLES Number of Beds
Improved Water Source
Improved Sanitation Facilities
CommunityHealth
Workers
Physician Iodized Salt Consumption
Contraceptive Prevalence
Fertility Rate
Language 0.16 -0.31 -1.92*** -1.43 -4.90*** -0.17 -1.34*** 0.54***(0.39) (0.21) (0.62) (1.49) (1.11) (0.36) (0.32) (0.19)
Regional Dummies
Yes Yes Yes Yes Yes Yes Yes Yes
Observations 97 97 95 34 97 66 93 97R-squared 0.73 0.62 0.46 0.52 0.45 0.30 0.76 0.82
Robust standard errors in parentheses*** p<0.01, ** p<0.05, * p<0.1

MIXED EFFECTS RESULTS
FIXED EFFECT MODEL – FULL SAMPLE
Table A25 – Effects on Immunization and Disease Treatment (1) (2) (3) (4) (5) (6)
VARIABLES Immunization (BCG)
Immunization (DPT)
Immunization (HepB3)
Immunization (Hib3)
Immunization (Pol3)
Immunization (Measles)
Panel A : Ethnic FractionalizationEthnic -0.32*** -0.72*** -0.29*** -0.92*** -0.64*** -0.89***
(0.03) (0.03) (0.10) (0.12) (0.03) (0.03)
Regional Dummies Yes Yes Yes Yes Yes YesObservations 849 1,083 495 432 1,083 1,083Panel B: Linguistic FractionalizationLinguistic -0.38*** -0.65*** -0.62*** -0.66*** -0.67*** -0.35***
(0.03) (0.03) (0.12) (0.13) (0.03) (0.03)
Regional Dummies Yes Yes Yes Yes Yes YesObservations 802 980 428 367 980 980
Robust standard errors adjusted for heteroskedasticity in parenthesesStandardized coefficients in brackets
*** p<0.01, ** p<0.05, * p<0.1

Table A26 – Effects on Prevalence of Health Issues(1) (2) (3) (4) (5) (6) (7)
VARIABLES HIV Prevalence
Anaemia Prevalence (Children)
Anaemia Prevalence (Women)
Syphilis Prevalence
Malaria Prevalence
Tuberculosis Prevalence
Undernourishment Prevalence
Panel A : Ethnic FractionalizationEthnic 3.06*** 0.42*** 0.61*** 0.57 3.11*** 2.80*** 0.04
(0.87) (0.04) (0.04) (0.53) (0.42) (0.13) (0.08)
Regional Dummies
Yes Yes Yes Yes Yes Yes Yes
Observations 708 1,108 1,108 62 516 1,108 602Panel B: Linguistic FractionalizationLinguistic 2.24** 0.38*** 0.29*** 1.11** 2.16*** 0.68*** -0.15*
(0.88) (0.04) (0.05) (0.49) (0.39) (0.14) (0.08)
Regional Dummies
Yes Yes Yes Yes Yes Yes Yes
Observations 682 1,005 1,005 55 494 1,005 569Robust standard errors adjusted for heteroskedasticity in parentheses
Standardized coefficients in brackets*** p<0.01, ** p<0.05, * p<0.1

Table A27 – Effects on Life Expectancy and Mortality Rates(1) (2) (3) (4) (5) (6)
VARIABLES Life Expectanc
y
AIDs Deaths
Maternal Mortality
Mortality (Female)
Mortality (Male)
Mortality (Infant)
Panel A : Ethnic FractionalizationEthnic -0.47*** 2.22*** 2.01*** 1.81*** 1.55*** 0.76***
(0.02) (0.30) (0.26) (0.06) (0.05) (0.06)
Regional Dummies Yes Yes Yes Yes Yes YesObservations 1,108 722 171 1,102 1,102 1,108Panel B: Linguistic FractionalizationLinguistic -0.94*** 2.16*** 1.21*** 0.69*** 0.46*** 0.61***
(0.02) (0.31) (0.26) (0.06) (0.05) (0.07)
Regional Dummies Yes Yes Yes Yes Yes YesObservations 1,005 672 159 999 999 1,005
Robust standard errors adjusted for heteroskedasticity in parenthesesStandardized coefficients in brackets
*** p<0.01, ** p<0.05, * p<0.1
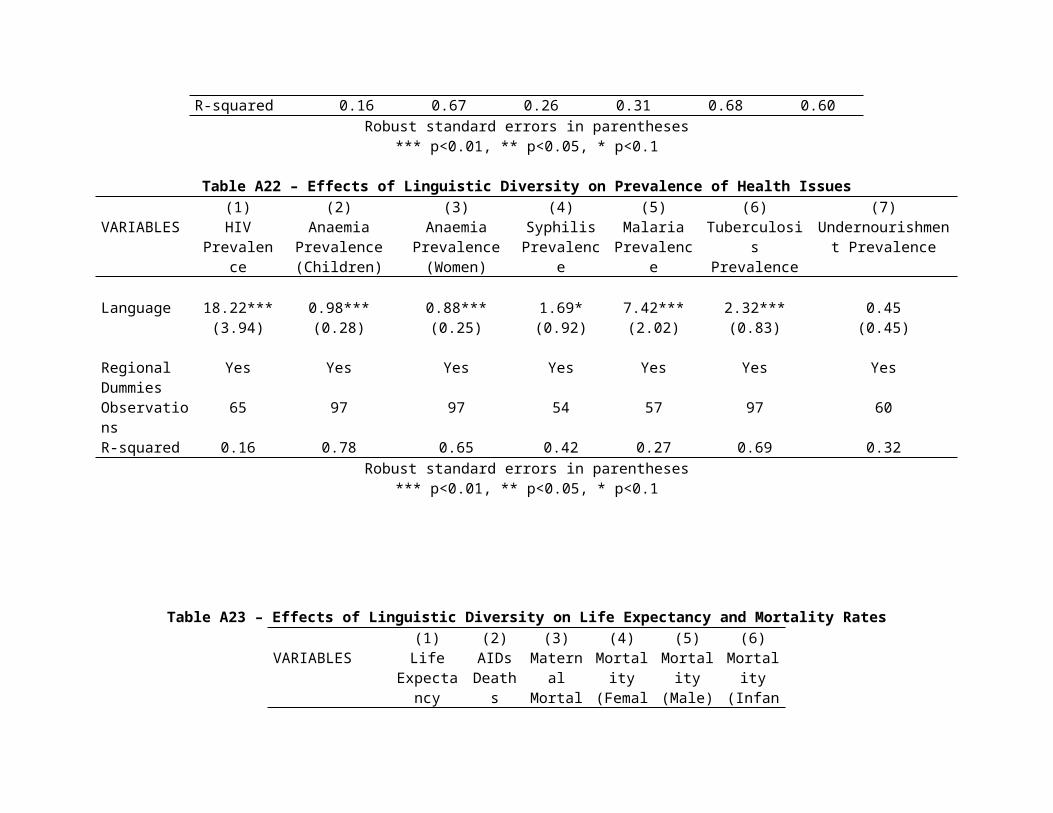
Table A28 – Effects on Infrastructure, Staff and Other Outcomes(1) (2) (3) (4) (5) (6) (7) (8)
VARIABLES Number of Beds
Improved Water Source
Improved Sanitation Facilities
CommunityHealth
Workers
Physician
Iodized Salt Consumption
Contraceptive Prevalence
Fertility Rate
Panel A : Ethnic FractionalizationEthnic -0.26 -0.14*** -0.39*** -2.63** -0.88*** -0.59*** -0.69*** 0.46***
(0.17) (0.03) (0.07) (1.04) (0.16) (0.19) (0.13) (0.03)
Regional Dummies
Yes Yes Yes Yes Yes Yes Yes Yes
Observations 646 1,094 1,053 31 639 51 228 1,108Panel B: Linguistic FractionalizationLinguistic -0.40** -0.13*** -0.45*** -4.39*** -0.91*** -0.61*** -0.70*** 0.36***
(0.18) (0.04) (0.08) (1.24) (0.16) (0.20) (0.15) (0.04)
Regional Dummies
Yes Yes Yes Yes Yes Yes Yes Yes
Observations 579 991 950 30 577 47 217 1,005Robust standard errors adjusted for heteroskedasticity in parentheses
Standardized coefficients in brackets*** p<0.01, ** p<0.05, * p<0.1
MIXED EFFECT MODEL – POOR COUNTRIES
Table A29 – Effects on Immunization and Disease Treatment (1) (2) (3) (4) (5) (6)
VARIABLES Immunization (BCG)
Immunization (DPT)
Immunization (HepB3)
Immunization (Hib3)
Immunization (Pol3)
Immunization (Measles)
Panel A : Ethnic FractionalizationEthnic -0.13*** -0.26*** -0.37*** -0.29*** -0.27*** -0.25***
(0.03) (0.04) (0.09) (0.08) (0.04) (0.04)
Regional Dummies Yes Yes Yes Yes Yes YesObservations 635 643 301 150 643 643Panel B: Linguistic FractionalizationLinguistic -0.19*** -0.32*** -0.42*** -0.55*** -0.33*** -0.31***
(0.03) (0.04) (0.09) (0.11) (0.04) (0.04)
Regional Dummies Yes Yes Yes Yes Yes YesObservations 618 618 286 144 618 618
Robust standard errors adjusted for heteroskedasticity in parenthesesStandardized coefficients in brackets
*** p<0.01, ** p<0.05, * p<0.1

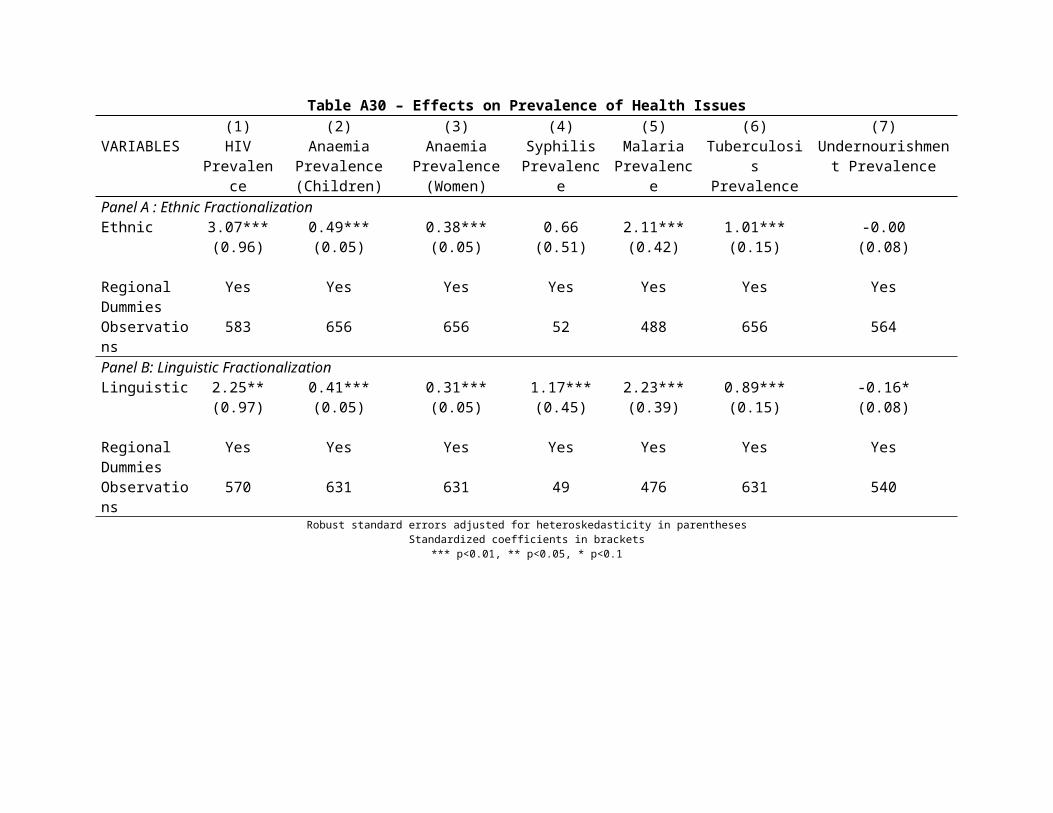
Table A30 – Effects on Prevalence of Health Issues(1) (2) (3) (4) (5) (6) (7)
VARIABLES HIV Prevalence
Anaemia Prevalence (Children)
Anaemia Prevalence (Women)
Syphilis Prevalence
Malaria Prevalence
Tuberculosis Prevalence
Undernourishment Prevalence
Panel A : Ethnic FractionalizationEthnic 3.07*** 0.49*** 0.38*** 0.66 2.11*** 1.01*** -0.00
(0.96) (0.05) (0.05) (0.51) (0.42) (0.15) (0.08)
Regional Dummies
Yes Yes Yes Yes Yes Yes Yes
Observations 583 656 656 52 488 656 564Panel B: Linguistic FractionalizationLinguistic 2.25** 0.41*** 0.31*** 1.17*** 2.23*** 0.89*** -0.16*
(0.97) (0.05) (0.05) (0.45) (0.39) (0.15) (0.08)
Regional Dummies
Yes Yes Yes Yes Yes Yes Yes
Observations 570 631 631 49 476 631 540Robust standard errors adjusted for heteroskedasticity in parentheses
Standardized coefficients in brackets*** p<0.01, ** p<0.05, * p<0.1
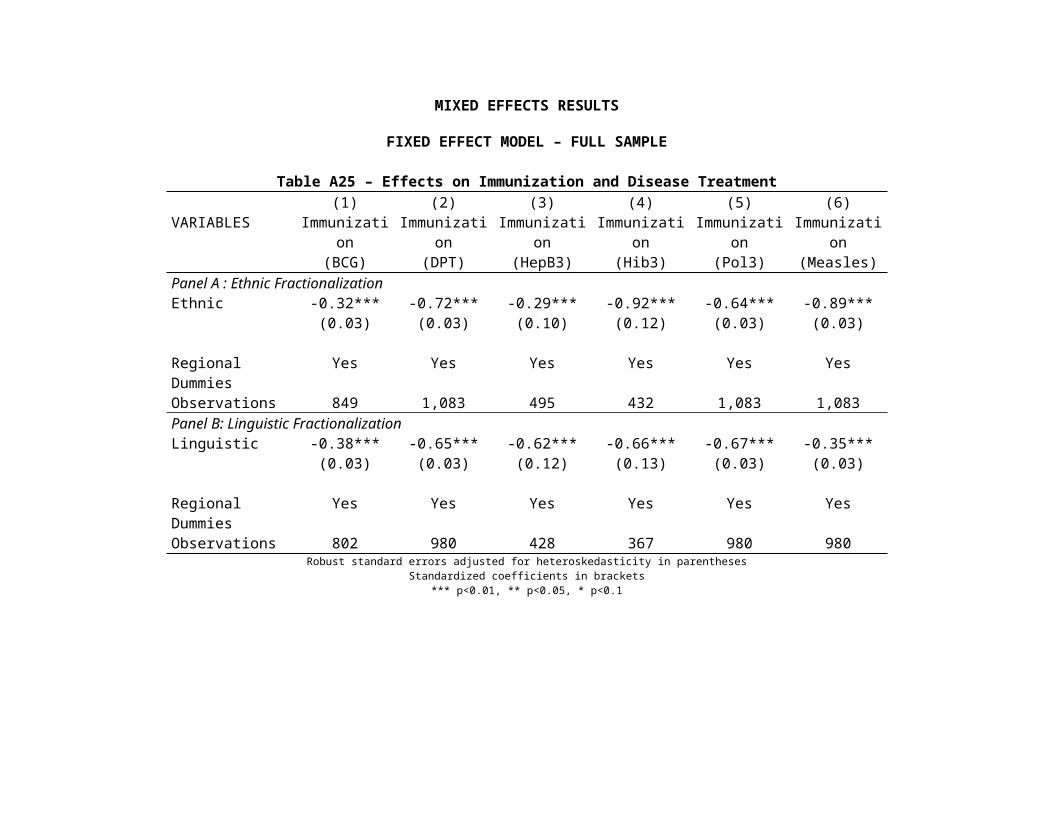
Table A31 – Effects on Life Expectancy and Mortality Rates(1) (2) (3) (4) (5) (6)
VARIABLES Life Expectanc
y
AIDs Deaths
Maternal Mortality
Mortality (Female)
Mortality (Male)
Mortality (Infant)
Panel A : Ethnic FractionalizationEthnic -0.19*** 2.32*** 0.83*** 0.81*** 0.56*** 0.65***
(0.02) (0.34) (0.30) (0.07) (0.05) (0.07)
Regional Dummies Yes Yes Yes Yes Yes YesObservations 656 572 110 656 656 656Panel B: Linguistic FractionalizationLinguistic -0.17*** 2.20*** 0.96*** 0.75*** 0.51*** 0.50***
(0.02) (0.35) (0.30) (0.07) (0.05) (0.07)
Regional Dummies Yes Yes Yes Yes Yes YesObservations 631 559 107 631 631 631
Robust standard errors adjusted for heteroskedasticity in parenthesesStandardized coefficients in brackets
*** p<0.01, ** p<0.05, * p<0.1

Table A32 – Effects on Infrastructure, Staff and Other Outcomes(1) (2) (3) (4) (5) (6) (7) (8)
VARIABLES Number of Beds
Improved Water Source
Improved Sanitation Facilities
CommunityHealth
Workers
Physician
Iodized Salt Consumption
Contraceptive Prevalence
Fertility Rate
Panel A : Ethnic FractionalizationEthnic -0.16 -0.15*** -0.37*** -1.98** -1.09*** -0.54*** -0.83*** 0.44***
(0.26) (0.04) (0.09) (0.98) (0.21) (0.20) (0.15) (0.04)
Regional Dummies
Yes Yes Yes Yes Yes Yes Yes Yes
Observations 291 643 632 26 308 45 170 656Panel B: Linguistic FractionalizationLinguistic -0.46 -0.15*** -0.48*** -3.86*** -1.38*** -0.65*** -0.86*** 0.39***
(0.28) (0.05) (0.11) (1.10) (0.22) (0.21) (0.18) (0.04)
Regional Dummies
Yes Yes Yes Yes Yes Yes Yes Yes
Observations 282 618 607 25 298 42 166 631Robust standard errors adjusted for heteroskedasticity in parentheses
Standardized coefficients in brackets*** p<0.01, ** p<0.05, * p<0.1

FIXED EFFECT MODEL – RICH COUNTRIES
Table A33 – Effects on Immunization and Disease Treatment (1) (2) (3) (4) (5) (6)
VARIABLES Immunization (BCG)
Immunization (DPT)
Immunization (HepB3)
Immunization (Hib3)
Immunization (Pol3)
Immunization (Measles)
Panel A : Ethnic FractionalizationEthnic 0.03 -0.03 0.63 -0.76*** -0.07*** -0.06**
(0.12) (0.02) (0.46) (0.28) (0.02) (0.03)
Regional Dummies Yes Yes Yes Yes Yes YesObservations 214 440 194 282 440 440Panel B: Linguistic FractionalizationLinguistic 0.30* -0.03 -1.64*** -0.85*** -0.05*** -0.01
(0.16) (0.02) (0.41) (0.24) (0.02) (0.04)
Regional Dummies Yes Yes Yes Yes Yes YesObservations 184 362 142 223 362 362
Robust standard errors adjusted for heteroskedasticity in parenthesesStandardized coefficients in brackets
*** p<0.01, ** p<0.05, * p<0.1
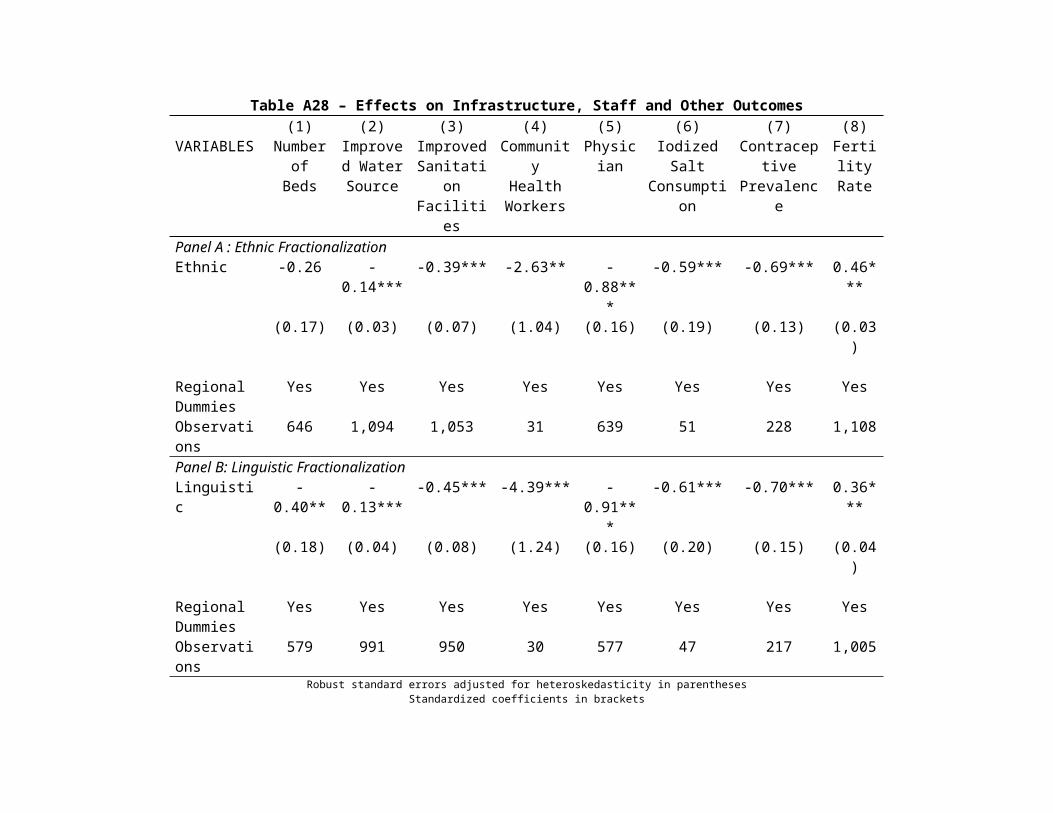
Table A34 – Effects on Prevalence of Health Issues(1) (2) (3) (4)
VARIABLES HIV Prevalence Anaemia Prevalence (Children) Anaemia Prevalence (Women) Tuberculosis PrevalencePanel A : Ethnic FractionalizationEthnic 0.86*** 0.20** -0.01 0.70***
(0.12) (0.08) (0.06) (0.21)
Regional Dummies Yes Yes Yes YesObservations 125 452 452 452Panel B: Linguistic FractionalizationLinguistic 0.73*** 0.36*** 0.30*** 0.44**
(0.15) (0.09) (0.06) (0.20)
Regional Dummies Yes Yes Yes YesObservations 112 374 374 374
Robust standard errors adjusted for heteroskedasticity in parenthesesStandardized coefficients in brackets
*** p<0.01, ** p<0.05, * p<0.1

Table A35 – Effects on Life Expectancy and Mortality Rates(1) (2) (3) (4) (5) (6)
VARIABLES Life Expectanc
y
AIDs Deaths
Maternal Mortality
Mortality (Female)
Mortality (Male)
Mortality (Infant)
Panel A : Ethnic FractionalizationEthnic -0.08*** 0.73 0.82* 0.67*** 0.81*** 1.05***
(0.01) (1.05) (0.49) (0.09) (0.10) (0.12)
Regional Dummies Yes Yes Yes Yes Yes YesObservations 452 150 61 446 446 452Panel B: Linguistic FractionalizationLinguistic -0.05*** 4.26*** 1.03 0.33*** 0.55*** 0.71***
(0.01) (0.80) (0.64) (0.09) (0.11) (0.13)
Regional Dummies Yes Yes Yes Yes Yes YesObservations 374 113 52 368 368 374
Robust standard errors adjusted for heteroskedasticity in parenthesesStandardized coefficients in brackets
*** p<0.01, ** p<0.05, * p<0.1
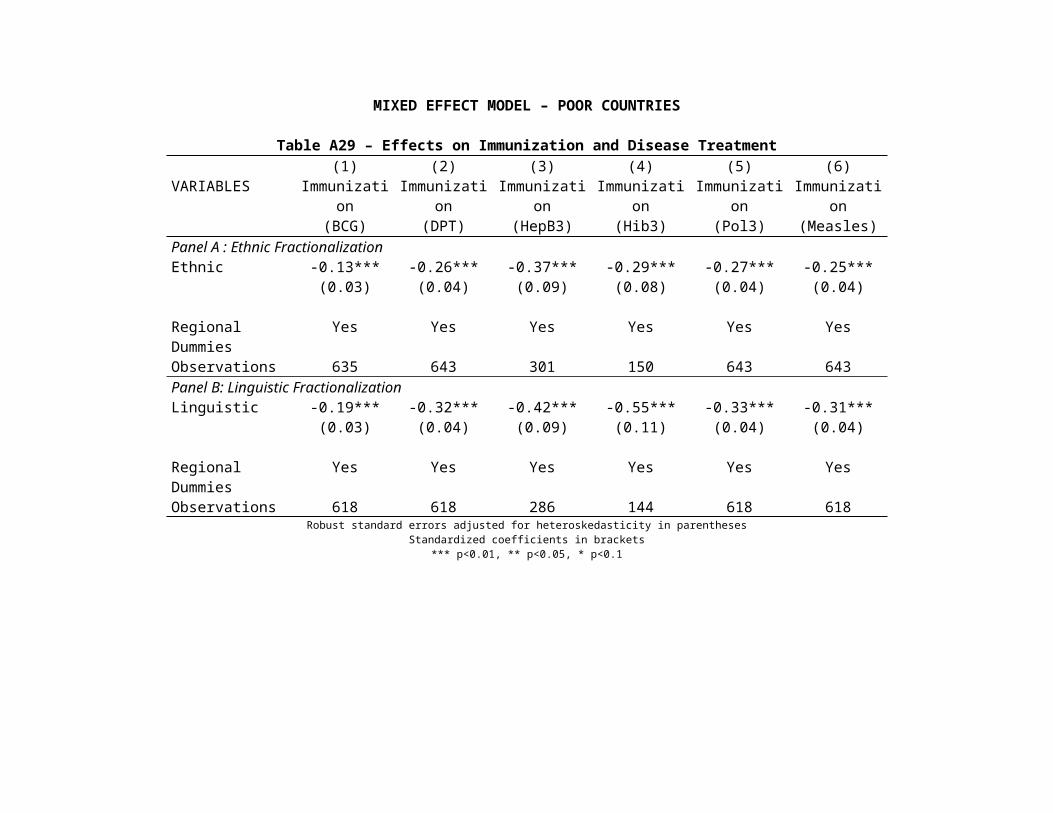
Table A36 – Effects on Infrastructure, Staff and Other Outcomes(1) (2) (3) (4) (5) (6)
VARIABLES Number of Beds Improved Water Source
Improved Sanitation Facilities
Physician Contraceptive Prevalence
Fertility Rate
Panel A : Ethnic FractionalizationEthnic 0.02 0.00 -0.14*** 0.35*** -0.05 -0.03
(0.15) (0.00) (0.02) (0.08) (0.18) (0.05)
Regional Dummies Yes Yes Yes Yes Yes YesObservations 355 451 421 331 58 452Panel B: Linguistic FractionalizationLinguistic 0.17 0.01** -0.09*** 0.55*** -0.12 -0.24***
(0.16) (0.01) (0.02) (0.09) (0.17) (0.04)
Regional Dummies Yes Yes Yes Yes Yes YesObservations 297 373 343 279 51 374
Robust standard errors adjusted for heteroskedasticity in parenthesesStandardized coefficients in brackets
*** p<0.01, ** p<0.05, * p<0.1