SSR in Double-Cage Induction Generator-Based Wind Farm Connected to Series-Compensated Transmission...
11
This article has been accepted for inclusion in a future issue of this journal. Content is final as presented, with the exception of pagination. IEEE TRANSACTIONS ON POWER SYSTEMS 1 SSR in Double-Cage Induction Generator-Based Wind Farm Connected to Series-Compensated Transmission Line Rajiv K. Varma, Senior Member, IEEE, and Akshaya Moharana, Student Member, IEEE Abstract—Series compensation of transmission networks is being increasingly considered for integration of large wind farms to transfer bulk power. This paper presents the potential of sub- synchronous resonance in large wind farms based on double-cage induction generators connected to a series-compensated line. A detailed linear state space model is presented for the wind plant and the transmission system. Eigenvalues are determined for a wide range of series compensation levels for various sizes of wind farms as well as a wind farm producing different power outputs. The potential of SSR involving both induction generator effect and torsional interaction is investigated in-depth. Eigen- value analysis results obtained through MATLAB simulations are validated by detailed electromagnetic transient simulation using PSCAD/EMTDC software. Studies are conducted for different commercially available double-cage induction generator-based wind turbines. SSR analysis in a realistic wind farm with identical wind turbine generators subjected to different wind speeds, and different sizes of wind turbine generators subjected to same wind speed are also carried out. It is shown that induction generator effect-based SSR can potentially occur for wind farms even at realistic levels of series compensation. Index Terms—Double-cage induction generator, series compen- sation, subsynchronous resonance (SSR), wind power. I. NOMENCLATURE Torsional angle between the wind turbine and generator. Angular speed of the wind turbine and generator rotor, respectively. Shaft stiffness between wind turbine and generator. Damping coefficient between wind turbine and generator. Inertia constant of wind turbine and generator, respectively. Manuscript received April 29, 2012; revised November 07, 2012; accepted January 20, 2013. This work was supported in part by NSERC and Hydro One Networks. Paper no. TPWRS-00431-2012. R. K. Varma is with Department of Electrical and Computer Engineering, The University of Western Ontario, London, ON, Canada N6A5B9 (e-mail: rk- [email protected]). A. Moharana is with Department of Electrical and Computer Engineering, The University of Western Ontario, London, ON, Canada N6G3A9 (e-mail: [email protected]). Digital Object Identifier 10.1109/TPWRS.2013.2246841 - axis voltage at induction generator terminal. - axis voltage at infinite bus. - axis stator current of induction generator. - axis current of first rotor cage. - axis current of second rotor cage. - axis voltage across series capacitor. - axis transmission line current. Stator winding resistance and unsaturated leakage inductance, respectively. First cage resistance and unsaturated leakage inductance, respectively. Second cage resistance and unsaturated leakage inductance, respectively. Unsaturated magnetizing inductance. Unsaturated mutual leakage inductance between two rotor cages. AC line resistance and inductance, respectively. Unsaturated leakage inductance of interface transformer. Source inductance of infinite bus or ac grid. Capacitance of series and shunt capacitor, respectively. Series compensation level (%). Synchronous frequency (rad/s). II. INTRODUCTION O VER the past few years, wind energy has shown the fastest growth amongst different sources of renewable power generation [1]–[3]. Most wind turbines in Europe and North America use doubly fed induction generators (DFIGs) or full converter-based wind turbine generators [1]–[5]. However, there are a large number of operational or under-construction wind farms across the United States, India, and Australia, for example, which utilize induction generator (IG)-based wind 0885-8950/$31.00 © 2013 IEEE
Transcript of SSR in Double-Cage Induction Generator-Based Wind Farm Connected to Series-Compensated Transmission...

This article has been accepted for inclusion in a future issue of this journal. Content is final as presented, with the exception of pagination.
IEEE TRANSACTIONS ON POWER SYSTEMS 1
SSR in Double-Cage Induction Generator-BasedWind Farm Connected to Series-Compensated
Transmission LineRajiv K. Varma, Senior Member, IEEE, and Akshaya Moharana, Student Member, IEEE
Abstract—Series compensation of transmission networks isbeing increasingly considered for integration of large wind farmsto transfer bulk power. This paper presents the potential of sub-synchronous resonance in large wind farms based on double-cageinduction generators connected to a series-compensated line. Adetailed linear state space model is presented for the wind plantand the transmission system. Eigenvalues are determined fora wide range of series compensation levels for various sizes ofwind farms as well as a wind farm producing different poweroutputs. The potential of SSR involving both induction generatoreffect and torsional interaction is investigated in-depth. Eigen-value analysis results obtained through MATLAB simulations arevalidated by detailed electromagnetic transient simulation usingPSCAD/EMTDC software. Studies are conducted for differentcommercially available double-cage induction generator-basedwind turbines. SSR analysis in a realistic wind farm with identicalwind turbine generators subjected to different wind speeds, anddifferent sizes of wind turbine generators subjected to same windspeed are also carried out. It is shown that induction generatoreffect-based SSR can potentially occur for wind farms even atrealistic levels of series compensation.
Index Terms—Double-cage induction generator, series compen-sation, subsynchronous resonance (SSR), wind power.
I. NOMENCLATURE
Torsional angle between the wind turbine andgenerator.
Angular speed of the wind turbine andgenerator rotor, respectively.
Shaft stiffness between wind turbine andgenerator.
Damping coefficient between wind turbine andgenerator.
Inertia constant of wind turbine and generator,respectively.
Manuscript received April 29, 2012; revised November 07, 2012; acceptedJanuary 20, 2013. This work was supported in part by NSERC and Hydro OneNetworks. Paper no. TPWRS-00431-2012.R. K. Varma is with Department of Electrical and Computer Engineering,
The University of Western Ontario, London, ON, Canada N6A5B9 (e-mail: [email protected]).A. Moharana is with Department of Electrical and Computer Engineering,
The University of Western Ontario, London, ON, Canada N6G3A9 (e-mail:[email protected]).Digital Object Identifier 10.1109/TPWRS.2013.2246841
- axis voltage at induction generatorterminal.
- axis voltage at infinite bus.
- axis stator current of induction generator.
- axis current of first rotor cage.
- axis current of second rotor cage.
- axis voltage across series capacitor.
- axis transmission line current.
Stator winding resistance and unsaturatedleakage inductance, respectively.
First cage resistance and unsaturated leakageinductance, respectively.
Second cage resistance and unsaturatedleakage inductance, respectively.
Unsaturated magnetizing inductance.
Unsaturated mutual leakage inductancebetween two rotor cages.
AC line resistance and inductance,respectively.
Unsaturated leakage inductance of interfacetransformer.
Source inductance of infinite bus or ac grid.
Capacitance of series and shunt capacitor,respectively.
Series compensation level (%).
Synchronous frequency (rad/s).
II. INTRODUCTION
O VER the past few years, wind energy has shown thefastest growth amongst different sources of renewable
power generation [1]–[3]. Most wind turbines in Europe andNorth America use doubly fed induction generators (DFIGs) orfull converter-based wind turbine generators [1]–[5]. However,there are a large number of operational or under-constructionwind farms across the United States, India, and Australia, forexample, which utilize induction generator (IG)-based wind
0885-8950/$31.00 © 2013 IEEE

This article has been accepted for inclusion in a future issue of this journal. Content is final as presented, with the exception of pagination.
2 IEEE TRANSACTIONS ON POWER SYSTEMS
turbines.1 2 3 4 5 For IG-based wind farms, the double-cage IGis preferred due to its mechanical simplicity, high efficiency,and low maintenance requirements [1], [2], [5].Large-scale integration of wind farms in the transmission
and distribution networks has led to several challenges [2]–[4],[6]. Substantial upgrades of grid transmission infrastructure in-cluding construction of new transmission lines may be neededto accommodate increased flow of wind power6 [7]–[10]. Seriescompensation is known to be an effective means of enhancingthe power transfer capability of existing transmission lines.Hence, series compensation is being increasingly consideredfor integrating large wind generation plants [7], [10]. Statelinewind farms in the United States are is connected to a series andshunt-compensated network in BPA transmission network . A50% series compensation of a particular line is being consid-ered in Alberta, Canada [7]. Large wind farms in Texas are alsoexpected to be connected to series-compensated lines [9], [10].Series-compensated transmission lines connected to steam
turbine driven synchronous generators may potentially causesubsynchronous resonance (SSR) which can lead to turbine-generator shaft failures [11]–[15]. There are two aspects of SSR:1) self-excitation involving both IG effect and torsional inter-action (TI) and 2) transient torque (also called transient SSR)[13]–[15]. Thus, if wind turbine generators are connected radi-ally to series-compensated transmission lines, there is a poten-tial for SSR due to self-excitation of the IG at a higher level ofseries compensation [4], [16]–[19]. The mechanical drive trainof wind turbine generator (WTG) system may also be suscep-tible to torsional vibrations which can be excited by both me-chanical and electrical disturbances [20], [21].Recently, NERC has issued a lesson learned document on the
SSR interaction between a Type-3 wind farm ( 485 MW) andnearby 345-kV series-compensated (50%) transmission line inTexas [22]. An overvoltage scenario due to SSR is also reportedin a 150-MW Type-3 wind farm connected to a 60% series-compensated line in the Buffalo Ridge area [23]. Both cases areexperienced at realistic levels for series compensation.Flexible ac transmission system (FACTS) controller-based
solutions have been proposed to mitigate SSR in wind plantsconnected to series-compensated lines [17], [18]. However, thishas been demonstrated only through electromagnetic transientsimulation studies and not by detailed eigenvalue analysis. Adetailed eigenvalue analysis only for single cage IG is reportedin [19].This paper presents a comprehensive analysis of SSR poten-
tial in a double-cage induction generator based wind farm con-nected to a series compensated line. An in-depth mathematicalmodel of the double-cage IG connected to series-compensatedline is developed along with a detailed model of the turbine tor-sional system [20], [21]. Extensive eigenvalue analysis is per-
1[Online]. Available: www.thewindpower.net2[Online]. Available: www.power-technology.com3[Online]. Available: www.horizonwind.com4[Online]. Available: www.powerauthority.on.ca5[Online]. Available: www.res-group.com6[Online]. Available: http://transmission.bpa.gov/business/generation_inter-
connection/documents/STD-N-000001-00-01_071509.pdf
Fig. 1. Study system.
Fig. 2. Steady-state equivalent circuit of a double-cage IG.
formed using MATLAB [24], which is validated with electro-magnetic transient simulation studies using PSCAD/EMTDC[25]. Fast Fourier transform (FFT) analysis is used to analyzethe frequency spectrum of the signals obtained from PSCAD/EMTDC simulations and correlated from eigenvalue analysisresults. These studies are performed for different commerciallyavailable induction generators.The remainder of this paper is organized as follows.
Section III describes the modeling of various subsystemsincluding double-cage induction generator, two-mass turbinedrive train, ac transmission line, and their overall interconnec-tion. Section IV presents a detailed eigenvalue analysis of thestudy system for different operating conditions. Validation ofthe eigenvalue results through time domain simulation is alsopresented in Section IV. Section V presents the SSR analysisin a realistic wind farm with identical wind turbine generatorsand different sizes of wind turbine generators. SSR studies ina wind farm with collector cables are presented in Section VI.Section VII concludes the paper.
III. SYSTEM DESCRIPTION
The study system shown in Fig. 1 consists of a wind farmsupplying bulk power to an infinite bus over a long distanceseries-compensated transmission line.
A. Double-Cage IG Model
In power system stability studies, induction generators arecommonly modeled as simple squirrel cage induction genera-tors. However, most of the commercially operated inductiongenerators above 5 kW have a double-cage rotor [26]. In com-parison to single-cage machines, these machines are widelyused in the wind farms where slip varies over a wide range[27]. As discussed in [28], the representation of the rotor withtwo rotor windings rather than with a single winding yields asignificant improvement in the accuracy of simulation resultsfor double-cage induction machines. Therefore, a double-cageIG-based wind farm is considered for the analysis.A detailed mathematical model of a double-cage IG is devel-
oped below. The wind farm comprises an aggregation of such

This article has been accepted for inclusion in a future issue of this journal. Content is final as presented, with the exception of pagination.
VARMA AND MOHARANA: SSR IN DOUBLE-CAGE INDUCTION GENERATOR-BASED WIND FARM 3
double-cage IGs. The positive sequence equivalent circuit of theinduction generator is shown in Fig. 2. A per-unit linear time-in-variant (LTI) model is developed in the synchronously rotating- reference frame [26], [28], [29]. Leakage flux saturation andmagnetizing flux saturation effects are neglected
(1)
(2)
(3)
(4)
(5)
(6)
where
The - reference frame voltages across the terminal capacitorand , respectively, are written as [14], [15]
(7)
(8)
B. WTG Torsional System Model
The drive train of a WTG in general consists of a bladepitching mechanism with a hub and blades, rotor shaft, gearbox, and electrical generator. The torsional system is typicallyinfluenced by three elasto-mechanical parameters: 1) polarmoment of inertia of the rotating masses; 2) torsional stiffnessof the elastic shafts and connecting elements; and 3) torsionaldamper constant [1], [2], [20], [21].A two-mass WTG rotor with drive train model and gear box
is shown in Fig. 3 and modeled as follows [2], [21]:
(9)
(10)
(11)
The electromagnetic torque is expressed as follows:
(12)
Fig. 3. Two-mass drive train model.
Natural frequency is the frequency of vibration of a systemand depends upon the degrees of freedom. For the drive trainsystem which is considered as a two-degree-of-freedom system,there are two natural frequencies [2]. In a practical system, somedamping is always present. However, in order to highlight thenegative damping offered by the series capacitor, the mechan-ical damping is not considered in this paper [13]. In the absenceof damping, the mechanical system executes a simple harmonicmotion at an angular natural frequency. This is also referredas “free-free frequency” resulting from only elastic and inertiaforce [1]. Hence, for a two-mass WTG described in (9)–(11),the natural frequencies can be expressed as [1], [20], [21]
and (13)
Equation (13) illustrates that the drive train system has twomodes out of which one mode is nonoscillating, known asMode-0, and the other mode depends upon the inertia constantand shaft stiffness, termed as torsional mode.
C. Network Model
The ac transmission line in this study system is adapted fromthe IEEE first SSR benchmark system [13]. The transmissionline and the series capacitor are modeled in the synchronouslyrotating - reference frame as follows [13]–[15]:
(14)
(15)
(16)
(17)
where and .
D. Aggregated Model of Induction Generators
The entire wind farm is represented by a single aggregatedequivalent model [30], [31] utilizing the weighted admittanceaveraging method [32], [33]. It is understood that modeling alarge number of IGs by a single equivalent IG may not be accu-rate under the following possible circumstances:1) if different wind turbines are subjected to different windspeeds due to being located over a wide geographical re-gion, or subjected to different types of disturbances.

This article has been accepted for inclusion in a future issue of this journal. Content is final as presented, with the exception of pagination.
4 IEEE TRANSACTIONS ON POWER SYSTEMS
2) if different sizes of the same type of IG-based wind tur-bines (e.g., having different drive trains or blades structure)are aggregated together by one IG-based wind turbine.
However, in this paper, it is assumed that all of the 217 genera-tors are of the same type (IG), of the same size (2.3 MW), andare subjected to the same wind speed. Under these assumptionsmodeling of 217 2.3-MW IGs by a single 499.1-MW IG by themethod suggested in [26], [27], [32], and [33] is considered rea-sonably accurate.In fact, the basis for aggregation of a large number of wind
turbines by a single equivalent model is provided by the fol-lowing studies reported in literature.1) Twenty-one IG-based wind turbines are grouped together,and their equivalent model is developed in [30]. From dy-namic simulation results, it is found that the equivalentmodel accurately represents the case with each machinemodeled individually.
2) Five wind farms of 100 MW are represented by an equiva-lent model in [4]. This paper discusses the potential inter-action of large wind farms with a series-compensated line.
3) The study results of a realistic offshore wind farm (150MW) with 80 IG-based wind turbines are reported in [1].Each cluster of same size generators such as 2, 1.9, 1.8, 1.7,1.6, and 1.5MW, etc. is modeled as a single equivalent gen-erator. It is shown that, for a specific cluster, the responseof the equivalent model to an external electrical fault is thesame as the response of all machines in the cluster modeledindividually.
4) The aggregation of induction machines for a fault studyis discussed in [32]. It is reported that identical machinescan be grouped together, and an equivalent model can bedeveloped to represent that group.
E. Aggregated Model of Turbine Torsional System
Since a large number of wind turbines are connected to acommon bus, it is assumed for simplicity that the disturbanceoriginating in the bus affects the performance of all of the indi-vidual machines identically, and the individual rotor oscillationslie in phase with each other. All wind turbines are connectedin parallel mechanically [30], [31]. The equivalent model of awind farm considering turbines is now derived. The variablesof the aggregated model are given as
(18)
F. Complete System State Space Model
The differential equations describing different subsystems arelinearized and linear state space model of each subsystem isstated as
(19)
(20)
(21)
where
(22)
(23)
(24)
(25)
The state space model of the complete interconnected systemis derived by combining the state space models of the three in-dividual subsystems. The study system is now expressed in thestate space form as
(26)
IV. SSR ANALYSIS
The study system wind farm employs double-cage IGs, eachrated 2.3 MW. The output of each generator depends upon thewind speed and the pitch angle. The wind speed is taken to be10 m/s. The pitch angle controller dynamics is neglected as itsresponse is slower than the SSR modes of oscillation [20]. Thesize of wind farm is varied between 100–500 MW and seriescompensation level is changed between 10%–100%. To simu-late different sizes of wind farm, appropriate numbers of windturbines are aggregated together.
A. Steady State SSR
System eigenvalues are first computed for different op-erating conditions and subsequently validated throughPSCAD/EMTDC based electromagnetic transient simula-tion. Table I illustrates the complete set of eigenvalues ofthe system for 50% series compensation level. A comparisonbetween a 200-MW wind farm and a 500-MW-producing200 MW is presented. There are seven complex conjugateeigenvalues and one real eigenvalue which are influenced bythe size (rating), power output of the wind farm, and the levelof series compensation. These modes are network modes 1 and

This article has been accepted for inclusion in a future issue of this journal. Content is final as presented, with the exception of pagination.
VARMA AND MOHARANA: SSR IN DOUBLE-CAGE INDUCTION GENERATOR-BASED WIND FARM 5
TABLE IVARIOUS MODES OF THE SYSTEM AT 50% SERIES COMPENSATION
2, super synchronous mode, electrical mode, electromechanicalmodes 1 and 2, torsional mode, and nonoscillatory mode.Table II presents the electrical and torsional mode eigen-
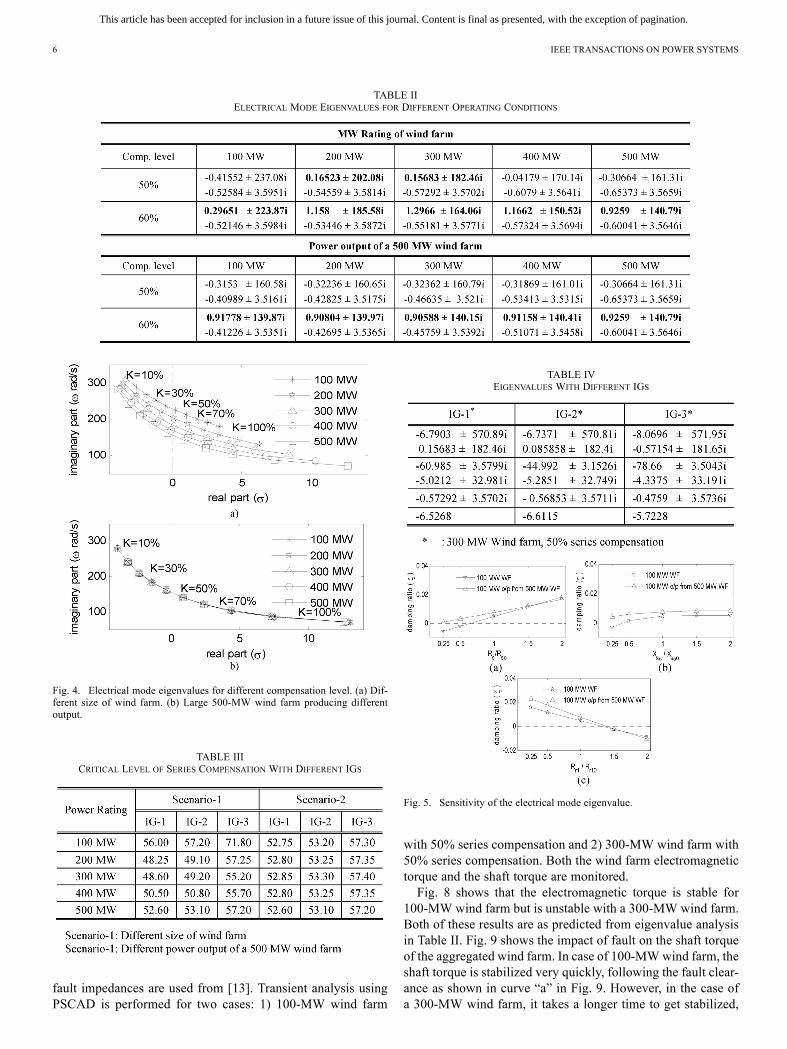
values for different size and output of wind farm for 50% and60% series compensation. The electrical mode is found to bethe most sensitive among all modes and tends to become lessstable (or unstable) with increase both in MW rating and seriescompensation. However, the torsional system does not getmuch affected by either the change in power rating or compen-sation level. The impact on the electrical mode with varyingMW rating of wind farm and varying series compensationbetween 10% and 100% is shown in Fig. 4. At a certain criticalcompensation level, the electrical mode becomes unstable, in-dicating the onset of IG-effect SSR. The critical compensationlevels for different MW ratings are summarized in Table III.It is observed that, for increasing size of wind farm, SSRoscillations due to IG effect can potentially arise with realisticlevel of series compensation such as 50%–60%.In case of a large 500-MW wind farm, the power output is
varied between 100 to 500MW, and the corresponding electricaland torsional mode eigenvalues are shown in Table II. The vari-ation in power output has minor impact on the IG-effect SSR.However, the potential of SSR rises with increasing series com-pensation levels. The electrical modes corresponding to a largewind farm producing a smaller power output, compared withthose of a smaller wind farm of same output power, are morestable. This is because the electrical mode depends upon theequivalent stator impedance of the aggregated induction gen-erator. As the number of aggregated generators increases, theequivalent impedance of the stator decreases [31], as the im-pedances of individual generators appear in parallel.Studies are now conducted for three different commercially
available wind turbine generators IG1, IG2, and IG3 [35]. Crit-ical compensation levels for different power outputs of a windfarm as well as different power-rated wind farms comprised ofeach of the above three WTGs are shown in Table III. A com-parison of the eigenvalues for a 300-MW wind farm with eachof the three WTGs for 50% compensation level is presented inTable IV.It is evident that wind farms even with different commercially
available double-cage WTGs are susceptible to SSR at realisticseries compensation levels of 50%.
1) Sensitivity Analysis: The variation of electrical modedamping ratio with respect to three sensitive parameters of theWTG system is presented in Fig. 5. These parameters are statorresistance , stator leakage reactance , and first rotor cageresistance . A 100-MW-rate wind farm is compared witha 500-MW wind farm producing only 100 MW at 50% seriescompensation. Each chosen parameter is varied as 0.25, 0.5, 1,1.5, and 2 times the rated parameter value that is consideredfor eigenvalue studies and nonlinear simulation (mentionedwith a zero in the subscript). Fig. 5(a) shows that, with a lowstator resistance, the electrical mode damping ratio becomesnegative which may potentially result in IG-effect SSR. This isas expected. Fig. 5(b) demonstrates that a low stator leakagereactance (especially for a 100-MW-rate wind farm) mayresult in IG-effect SSR. Fig. 5(c) illustrates that a high valueof first rotor cage resistance may lead to negative dampingratio. Overall, it is observed that a larger wind farm producingsmaller output is more stable than a smaller size of wind farm.As shown in Fig. 5(a), the electrical mode damping ratio in-
creases with increased stator resistance, whereas, in Fig. 5(c), itdecreases with increase in the first cage rotor resistance. Whenmultiple generators are aggregated, the equivalent stator androtor resistance decreases by a factor of (number of ma-chines). Since slopes of the curves shown in Fig. 5(a) and (c) areopposite, a combined effect is seen on the electrical mode sta-bility. Therefore, the electrical mode eigenvalues move towardsimaginary axis (becomes weak) till 300-MWwind farm size andthen shift towards the left (becomes stronger) with higher sizesof wind farm.Detailed PSCAD/EMTDC simulation studies are now carried
out to validate the eigenvalue analysis results. Fig. 6(a) and (b)shows the electromagnetic torque of the aggregated 100-MWIG-based wind farm for series compensation of 50% and 60%,respectively. The electromagnetic torque is found stable for50% compensation, whereas it becomes unstable with 60%compensation. This is just as predicted by the eigenvalueanalysis.To estimate the frequency of these oscillations, an FFT anal-
ysis of the electromagnetic torque signal is performed and es-timated frequencies are compared with the calculated eigen-frequencies shown in Table II. The frequency spectrum of theelectromagnetic torque signal shown in Fig. 6(a) and (b) areshown in Fig. 7(a) and (b). It is observed that, for 100-MWwind farm at 50% compensation level, the oscillation frequencyis around 236.1 rad/s (37.57 Hz) shown as a small amplitudepeak in Fig. 7(a). This result closely matches with the predictedeigenfrequency of 237.08 rad/s. Similarly, the peak in Fig. 7(b)demonstrates the oscillation frequency as 223.1 rad/s (35.5 Hz),which is very close to the calculated eigenfrequency (223.87rad/s) of the electrical mode shown in Table II. Similar simu-lations are carried out in PSCAD/EMTDC for other operatingconditions also, and results are found to match to the calcu-lated eigenvalues shown in Table II. This validates the analyticalmodel and the eigenvalue analysis.
B. Transient SSR
A three-phase-to-ground (LLLG) fault is initiated at shownin Fig. 1. The fault starts at 4 s and lasts for six cycles. The
This article has been accepted for inclusion in a future issue of this journal. Content is final as presented, with the exception of pagination.
6 IEEE TRANSACTIONS ON POWER SYSTEMS
TABLE IIELECTRICAL MODE EIGENVALUES FOR DIFFERENT OPERATING CONDITIONS
Fig. 4. Electrical mode eigenvalues for different compensation level. (a) Dif-ferent size of wind farm. (b) Large 500-MW wind farm producing differentoutput.
TABLE IIICRITICAL LEVEL OF SERIES COMPENSATION WITH DIFFERENT IGS
fault impedances are used from [13]. Transient analysis usingPSCAD is performed for two cases: 1) 100-MW wind farm
TABLE IVEIGENVALUES WITH DIFFERENT IGS
Fig. 5. Sensitivity of the electrical mode eigenvalue.
with 50% series compensation and 2) 300-MW wind farm with50% series compensation. Both the wind farm electromagnetictorque and the shaft torque are monitored.Fig. 8 shows that the electromagnetic torque is stable for
100-MW wind farm but is unstable with a 300-MW wind farm.Both of these results are as predicted from eigenvalue analysisin Table II. Fig. 9 shows the impact of fault on the shaft torqueof the aggregated wind farm. In case of 100-MWwind farm, theshaft torque is stabilized very quickly, following the fault clear-ance as shown in curve “a” in Fig. 9. However, in the case ofa 300-MW wind farm, it takes a longer time to get stabilized,
This article has been accepted for inclusion in a future issue of this journal. Content is final as presented, with the exception of pagination.
VARMA AND MOHARANA: SSR IN DOUBLE-CAGE INDUCTION GENERATOR-BASED WIND FARM 7
Fig. 6. Electromagnetic torque of a 100-MW wind farm with different com-pensation levels. (a) 50% series compensation. (b) 60% series compensation.
Fig. 7. FFT of the electromagnetic torque shown in Fig. 6.
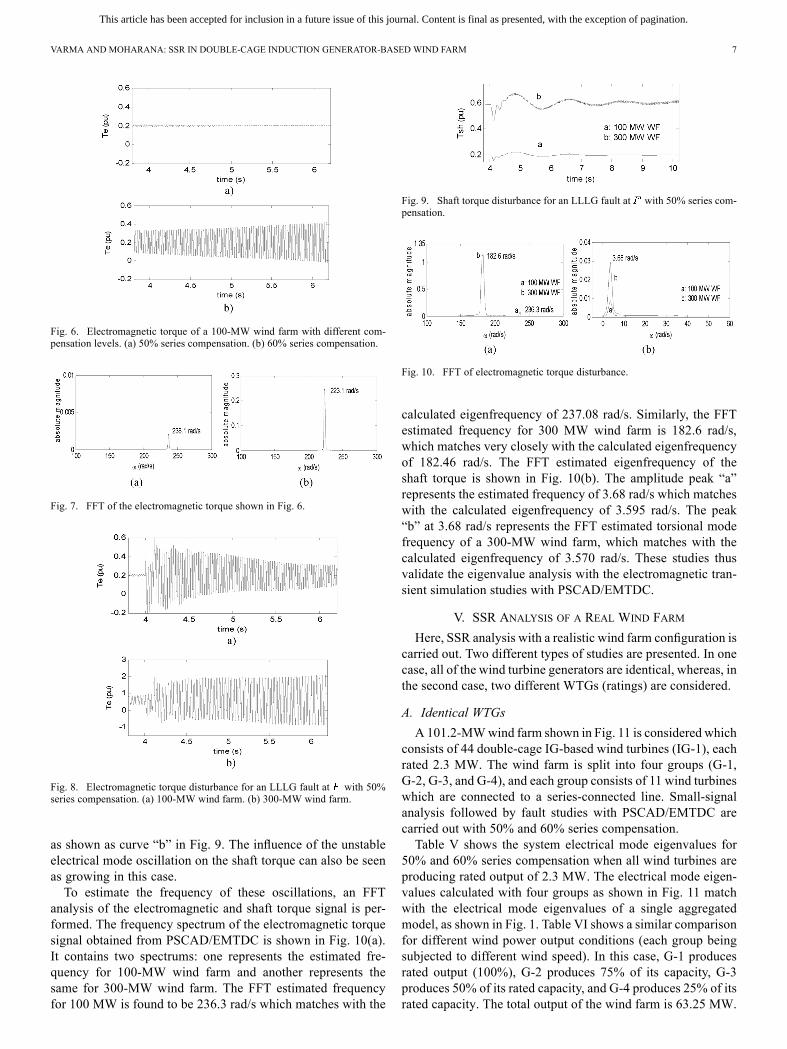
Fig. 8. Electromagnetic torque disturbance for an LLLG fault at with 50%series compensation. (a) 100-MW wind farm. (b) 300-MW wind farm.
as shown as curve “b” in Fig. 9. The influence of the unstableelectrical mode oscillation on the shaft torque can also be seenas growing in this case.To estimate the frequency of these oscillations, an FFT
analysis of the electromagnetic and shaft torque signal is per-formed. The frequency spectrum of the electromagnetic torquesignal obtained from PSCAD/EMTDC is shown in Fig. 10(a).It contains two spectrums: one represents the estimated fre-quency for 100-MW wind farm and another represents thesame for 300-MW wind farm. The FFT estimated frequencyfor 100 MW is found to be 236.3 rad/s which matches with the
Fig. 9. Shaft torque disturbance for an LLLG fault at with 50% series com-pensation.
Fig. 10. FFT of electromagnetic torque disturbance.
calculated eigenfrequency of 237.08 rad/s. Similarly, the FFTestimated frequency for 300 MW wind farm is 182.6 rad/s,which matches very closely with the calculated eigenfrequencyof 182.46 rad/s. The FFT estimated eigenfrequency of theshaft torque is shown in Fig. 10(b). The amplitude peak “a”represents the estimated frequency of 3.68 rad/s which matcheswith the calculated eigenfrequency of 3.595 rad/s. The peak“b” at 3.68 rad/s represents the FFT estimated torsional modefrequency of a 300-MW wind farm, which matches with thecalculated eigenfrequency of 3.570 rad/s. These studies thusvalidate the eigenvalue analysis with the electromagnetic tran-sient simulation studies with PSCAD/EMTDC.
V. SSR ANALYSIS OF A REAL WIND FARM
Here, SSR analysis with a realistic wind farm configuration iscarried out. Two different types of studies are presented. In onecase, all of the wind turbine generators are identical, whereas, inthe second case, two different WTGs (ratings) are considered.
A. Identical WTGs
A 101.2-MWwind farm shown in Fig. 11 is considered whichconsists of 44 double-cage IG-based wind turbines (IG-1), eachrated 2.3 MW. The wind farm is split into four groups (G-1,G-2, G-3, and G-4), and each group consists of 11 wind turbineswhich are connected to a series-connected line. Small-signalanalysis followed by fault studies with PSCAD/EMTDC arecarried out with 50% and 60% series compensation.Table V shows the system electrical mode eigenvalues for
50% and 60% series compensation when all wind turbines areproducing rated output of 2.3 MW. The electrical mode eigen-values calculated with four groups as shown in Fig. 11 matchwith the electrical mode eigenvalues of a single aggregatedmodel, as shown in Fig. 1. Table VI shows a similar comparisonfor different wind power output conditions (each group beingsubjected to different wind speed). In this case, G-1 producesrated output (100%), G-2 produces 75% of its capacity, G-3produces 50% of its rated capacity, and G-4 produces 25% of itsrated capacity. The total output of the wind farm is 63.25 MW.

This article has been accepted for inclusion in a future issue of this journal. Content is final as presented, with the exception of pagination.
8 IEEE TRANSACTIONS ON POWER SYSTEMS
Fig. 11. A 101.2-MW wind farm connected to series-compensated line.
TABLE VEIGENVALUES AT RATED WIND FARM OUTPUT
TABLE VIEIGENVALUES AT VARIABLE WIND FARM OUTPUT
It is found that the electrical mode eigenvalues of the systemwith four groups match with the eigenvalues obtained fromthe single aggregated model with same output condition. Theclose match of the electrical mode eigenvalues demonstratesthat under the considered assumptions, an aggregated model isadequate for the SSR analysis when all of the WTG systemsare identical.To validate the small-signal analysis, electromagnetic tran-
sient simulations with PSCAD/EMTDC are performed in whicha three-phase fault is simulated at the remote end bus (location) of the study system shown in Fig. 11. Fig. 12 shows the elec-
tromagnetic torques of each group following the fault clearancewith 50% series compensation. As expected from small-signalanalysis, the oscillations in the electromagnetic torques growand destabilize the system subsequently, though not shown here.From the FFT analysis shown in Fig. 13, the estimated fre-quency (222.4 rad/s) matches very closely with the predictedelectrical mode oscillatory frequency (222.6 rad/s). Since eachgroup consists of identical numbers of wind turbine units, themagnitude of the electromagnetic torque also remains equal inall groups.Fig. 14 shows a similar fault study result, when each group
produces different power output considered in Table VI. In thiscase, though a common oscillatory frequency is observed, themagnitude of the oscillations differs due to different outputconditions. The oscillatory frequencies estimated from the FFT
Fig. 12. Impact of three-phase fault on electromagnetic torque of groups (G-1to G-4) during rated power output condition.
Fig. 13. FFT of electromagnetic torques shown in Fig. 12.
Fig. 14. Impact of three-phase fault on electromagnetic torque of groups (G-1to G-4) during variable power output condition.
match very well with the calculated modal frequencies. Thesecase studies reasonably validate the small-signal analysis.
B. Different WTGs
In this case, a 201.3-MW wind farm is considered which issplit into two groups G-1(101.2 MW) and G-2 (100.1 MW). Ingroup G-1, there are 44 wind turbine generators (IG-1), eachrated 2.3 MW, and in group G-2 there are 77 wind turbine gen-erators (IG-3), each rated 1.3 MW. Fault studies with PSCAD/EMTDC are performed, and selected results are only shown inFig. 15. It is assumed that each wind turbine produces ratedoutput power. Fig. 15 shows the impact of a three-phase faultat the remote end on the electromagnetic torques of both thegroups. With 50% series compensation, both the electromag-netic torques oscillate with electrical mode frequency which isseen from Fig. 15(a). Being a stable operating condition, theoscillations are damped out subsequently after the fault clear-ance. However, with 65% series compensation, the wind farm

This article has been accepted for inclusion in a future issue of this journal. Content is final as presented, with the exception of pagination.
VARMA AND MOHARANA: SSR IN DOUBLE-CAGE INDUCTION GENERATOR-BASED WIND FARM 9
Fig. 15. Impact of three-phase fault on electromagnetic torque of groups (G-1and G-2). (a) 50% series compensation. (b) 65% series compensation.
Fig. 16. 304-MW wind farm with collector cable connected to series-compen-sated transmission line.
becomes unstable due to self-excitation and a three-phase faultin the network causes further instability.From this analysis, it can be concluded that SSR oscillations
in IG-based wind farms are largely influenced by the degreeof compensation. Different types of IGs may affect the criticalseries compensation level; however, this impact is quite small.
VI. SSR ANALYSIS OF A WIND FARM WITHCOLLECTOR CABLE
It was assumed in the above studies that all wind farms areconnected at the same collector bus. Here, however, we presentthe potential of SSR in a realistic wind farm of 304 MW sizesplit into different clusters connected by cables and connected toa series-compensated line, as shown in Fig. 16. The wind farmis split into six clusters (G-1 to G-6). Each cluster consists of22 wind turbines producing 50.6 MW at rated wind speed, andall clusters are connected to PCC through collector cables. Thecable length varies between 100 m to 2 km for different groups[36], [37]. The length of each collector cable is shown in Fig. 16.Detailed layout of a commercially operated wind farm can befound in [37]. Due to smaller length of the collector cables, theyare modeled as PI sections which are adequate for the studyconducted in this section [36]. The series compensation levelis chosen to be 57%.
Fig. 17. Electromagnetic torque of different groups in a 304-MW wind farm.
For the rated wind farm output, a three-phase fault is sim-ulated at the remote end of the transmission line. The electro-magnetic torque of different clusters, following the fault clear-ance, is shown in Fig. 17. The IG-effect SSR is clearly evidentfrom the growing electromagnetic torque. It is seen that, as thecable length decreases, the impact of the series compensationon the wind turbine becomes larger. For instance, G-1 is thefarthest cluster whose torque exhibits lower amplitude than thesame of cluster G-6, which is closest to the PCC. Thus, the SSRanalysis carried out in the previous sections considering a largewind farm as an aggregated wind turbine stands valid. However,the critical compensation level calculated from the aggregatedmodel may be different than the clustered wind farm segregatedwith collector cables.
VII. CONCLUSION
This paper presents a detailed analysis of the potential ofSSR with double-cage IG-based wind farm connected to se-ries-compensated transmission line. A comprehensive mathe-matical model is developed for the wind farm, including its var-ious subsystems—the aggregated induction generator, torsionalsystem, and ac transmission line which is similar to that of theIEEE First SSR benchmark system. Eigenvalues are computedfor a wide range of wind farm sizes and a broad range of se-ries compensation levels using MATLAB software. The resultsare validated from detailed electromagnetic transient simula-tion using PSCAD/EMTDC software. FFT analysis is used tofurther correlate the frequencies of the critical modes obtainedfrom small-signal studies. SSR analysis in a realistic wind farmwith identical WTGs subjected to different wind speeds, anddifferent sizes of WTGs subjected to same wind speed are alsocarried out.The following conclusions are made with respect to the po-
tential of SSR.

This article has been accepted for inclusion in a future issue of this journal. Content is final as presented, with the exception of pagination.
10 IEEE TRANSACTIONS ON POWER SYSTEMS
TABLE VIISYSTEM DATA
• IG effect (i.e., the electrical mode becoming unstable)may be experienced with large wind farms in the range of100–500 MW at realistic levels of series compensation of50%–60%.
• Torsional interaction does not seem to occur for the rangeof wind farm sizes and series-compensation levels consid-ered.
• Analysis with different commercially available IGs revealssimilar potential for SSR oscillation.
• PSCAD/EMTDC simulation of a realistic clustered windfarm with collector cables also shows the possibility ofSSR oscillation followed by a three-phase fault even at arealistic level of compensation.
From the studies conducted for the study system, it ap-pears that IG-based SSR may occur even for realistic levelsof series compensation (typically 50%) even for a 100-MWfarms. Hence, before connecting IG-based wind farms with se-ries-compensated transmission line, a comprehensive analysisis highly recommended. If a potential for the SSR oscillation isfound, suitable counter measures may be considered.
APPENDIXSYSTEM DATA
The system data are shown in Table VII.
REFERENCES
[1] T. Ackerman, Wind Power in Power Systems. New York, NY, USA:Wiley, 2005.
[2] A. Lara, Jenkins, Ekanayake, Cartwright, and Huges, Wind EnergyGeneration Modeling and Control. Chichester, U.K.: Wiley, 2009.
[3] “Global wind energy outlook,” 2010 [Online]. Available: www.gwec.net
[4] P. Pourbeik, R. J. Koessler, D. L. Dickmander, and W. Wong, “Inte-gration of large wind farms into utility grids (part 2—Performance is-sues),” in Proc. IEEE PES Gen. Meeting, Jul. 13–17, 2003, vol. 3, pp.1520–1525.
[5] V. Akhmatov, Induction Generators for Wind Power. Essex, U.K.:Multi-Science Publication, Jun. 2007.
[6] “Large-scale wind integration studies in the United States: Preliminaryresults,” NREL/CP-550-46527, Sep. 2009. [Online]. Available: www.nrel.gov
[7] “Southern Alberta transmission reinforcement needs identificationdocument.” [Online]. Available: http://www.aeso.ca
[8] M. Henderson, D. Bertagnolli, and D. Ramey, “Planning HVDC andFACTS in new England,” in Proc. IEEE PES Power Syst. Conf. Expo.,Mar. 2009, pp. 1–3.
[9] “Ercot CREZ transmission optimization study,” [Online]. Available:www.ercot.com
[10] N. Bacalao, A.W. Galli, M. Hutson, and R. Nadira, “Considerations onthe use of HVDC for CREZ transmission,” in proc. IEEE/PES PowerSyst. Conf. Expo., Mar. 15–18, 2009, pp. 1–7.
[11] J. W. Ballance and S. Goldberg, “Subsynchronous resonance in seriescompensated transmission lines,” IEEE Trans. Power App. Syst., vol.PAS-92, no. 5, pp. 1649–1658, Sep. 1973.
[12] G. Joos and B.-T. Ooi, “Torsional interactions between synchronousgenerators and long transmission lines,” IEEE Trans. Power Syst., vol.PS-2, no. 1, pp. 17–22, Feb. 1987.
[13] “First benchmark model for computer simulation of subsynchronousresonance,” IEEE Trans. Power App. Syst., vol. PAS-96, no. 5, pp.1565–1572, Sep. 1977, IEEE Committee Report.
[14] P. Kundur, Power System Stability and Control. New York, NY,USA: McGraw-Hill, 1994.
[15] K. R. Padiyar, Analysis of Subsynchronous Resonance in PowerSystem. Boston, MA, USA: Kluwer Academic, 1999.
[16] A. Tabesh and R. Iravani, “Small-signal dynamic model and analysisof a fixed-speed wind farm—A frequency response approach,” IEEETrans. Power Del., vol. 21, no. 2, pp. 778–787, Apr. 2006.
[17] R. K. Varma, S. Auddy, and Y. Semsedini, “Mitigation of subsyn-chronous resonance in a series-compensated wind farm using FACTScontrollers,” IEEE Trans. Power Del., vol. 23, no. 3, pp. 1645–1654,Jul. 2008.
[18] M. S. El-Moursi, B. Bak-Jensen, and M. H. Abdel-Rahman, “NovelSTATCOM controller for mitigating SSR and damping power systemoscillations in a series compensated wind park,” IEEE Trans. PowerElectron., vol. 25, no. 2, pp. 429–441, Feb. 2010.
[19] A. Moharana and R. K. Varma, “Subsynchronous resonance in single-cage self-excited-induction-generator-based wind farm connected toseries-compensated lines,” IET Gen., Transm. Distrib., vol. 5, no. 12,pp. 1221–1232, 2011.
[20] E. Hau, Wind Turbines Fundamentals, Technologies Application, Eco-nomics. Berlin, Germany: Springer, 2006.
[21] Z. Lubosny, Wind Turbine Operation in Electric Power System. NewYork, NY, USA: Springer, 2003.
[22] “Sub-synchronous interaction between series-compensated transmis-sion lines and generation,” [Online]. Available: http://www.nerc.com/files/LL_45_Sub-Synchronous Interaction.pdf
[23] K. Narendra, D. Fedirchuk, R. Midence, N. Zhang, A. Mulawarman,P. Mysore, and V. Sood, “New microprocessor based relay to monitorand protect power systems against sub-harmonics,” in Proc. 2011 IEEEEPEC, pp. 438–443.
[24] MATLAB, the language for technical computing. The Mathworks Inc.,2009.
[25] “Users guide: EMTDC,”Manitoba HVDC Res. Center, Apr. 2005.[26] E. Levi and D. Rauski, “Modeling of deep-bar and double cage self-
excited induction generators for wind-electricity generation studies,”Electr. Power Syst. Res., vol. 27, no. 1, pp. 73–81, May 1993.
[27] S. J. Chapman, Electric Machinery Fundamentals, 4th ed. Toronto,ON, Canada: McGraw-Hill, 2005.
[28] E. Levi, “General method of magnetizing flux saturation modeling ind-q axis models of double-cage inductionmachines,”Proc. Inst. Electr.Eng.—Electr. Power Applic., vol. 144, no. 2, pp. 101–109, Mar. 1997.
[29] P. C. Krause and C. H. Thomas, “Simulation of symmetrical inductionmachinery,” IEEE Trans. Power App. Syst., vol. PAS-84, no. 11, pp.1038–1053, Nov. 1965.
[30] D. J. Trudnowski, A. Gentile, J. M. Khan, and E. M. Petritz, “Fixed-speed wind-generator and wind-park modeling for transient stabilitystudies,” IEEE Trans. Power Syst., vol. 19, no. 4, pp. 1911–1917, Nov.2004.
[31] S. M. Chan, R. L. Cresap, and D. H. Curtice, “Wind turbine clustermodel,” IEEE Trans. Power App. Syst., vol. PAS-103, no. 7, pp.1692–1698, July 1984.
[32] M. Taleb, M. Akbaba, and E. A. Abdullah, “Aggregation of induc-tion machines for power system dynamic studies,” IEEE Trans. PowerSyst., vol. 9, no. 4, pp. 2042–2048, Nov. 1994.

This article has been accepted for inclusion in a future issue of this journal. Content is final as presented, with the exception of pagination.
VARMA AND MOHARANA: SSR IN DOUBLE-CAGE INDUCTION GENERATOR-BASED WIND FARM 11
[33] K. W. Louie, “Aggregating induction motors in a power system basedon their standard specifications,” in Proc. Int. Conf. Power Syst.Technol., Oct. 22–26, 2006, pp. 1–8.
[34] A. J. Germond and R. Podmore, “Dynamic aggregation of generatingunit models,” IEEE Trans. Power App. Syst., vol. PAS-97, no. 4, pp.1060–1069, Jul. 1978.
[35] J. Pedra, F. Corcoles, L. Monjo, S. Bogarra, and A. Rolan, “On fixed-speed WT generator modeling for rotor speed stability studies,” IEEETrans. Power Syst., vol. 27, no. 1, pp. 397–406, Feb. 2012.
[36] E. Muljadi, C. P. Butterfield, A. Ellis, J. Mechenbier, J. Hochheimer, R.Young, R. Miller, R. Delmerico, R. Zavadil, and J. C. Smith, “Equiv-alencing the collector system of a large wind power plant,” in Proc.IEEE Power Eng. Soc. General Meeting, 2006, pp. 1–9.
[37] S. Liang, Q. Hu, and W. Lee, “A survey of harmonic emissions of acommercial operated wind farm,” IEEE Trans. Ind. Applic., vol. 48,no. 3, pp. 1115–1123, Jun. 2012.
Rajiv K. Varma (SM’09) received the B.Tech. andPh.D. degrees in electrical engineering from IndianInstitute of Technology (IIT), Kanpur, India, in 1980and 1988, respectively.He is currently an Associate Professor and Hydro
One Chair in Power Systems Engineering with theUniversity of Western Ontario (UWO), London,ON, Canada. Prior to this position, he was a FacultyMember with the Electrical Engineering Depart-ment, Indian Institute of Technology, IIT Kanpur,India, from 1989 to 2001. He has coauthored a book,
Thyristor Based FACTS Controllers (IEEE Press, 2002) . His research interestsinclude FACTS, power systems stability, and grid integration of wind andphotovoltaic solar power systems.Prof. Varma is the Chair of IEEE Working Group on “HVDC and FACTS
Bibliography” and is active on a number of other IEEE working groups. He hascodelivered several Tutorials on SVC sponsored by IEEE Substations Com-mittee. He has received many Teaching Excellence awards both at the Facultyof Engineering and University level at the University of Western Ontario.
Akshaya Moharana (S’10) was born in India. Hereceived the B.E. degree in electrical and electronicsengineering from Biju Patnaik University of Tech-nology, Bhubaneswar, India, in 2005, and the Ph.D.degree in electrical engineering from the Universityof Western Ontario, London, ON, Canada, in 2012.He has worked as a Research Engineer in a
research project sponsored by the Government ofIndia. Currently, he is a Postdoctoral Fellow withthe Department of Electrical and Computer Engi-neering, University of Western Ontario, London,
ON, Canada. His area of interest includes HVDC, FACTS, distributed genera-tion interconnection, network resonance and power quality.