SSR Contamination Session_2015_MLG
9
2015 MassRecycle R3 Conference Michelle Lee Guiney, WM Total Recycle Program Manager What’s in Your Recycling: Single Stream Recycling Contamination March 30, 2015
-
Upload
michelle-lee-guiney-leed-ga -
Category
Documents
-
view
89 -
download
0
Transcript of SSR Contamination Session_2015_MLG

2015 MassRecycle R3 Conference
Michelle Lee Guiney, WM
Total Recycle Program Manager
What’s in Your Recycling: Single Stream Recycling Contamination
March 30, 2015

SSR/MRF Capability
- What is it
- What does it impact
- What is WM doing about it
Page 2 ©2015 Waste Management
Contamination

Contamination Defined Muni Loads - Common Contaminants
Page 3 ©2015 Waste Management
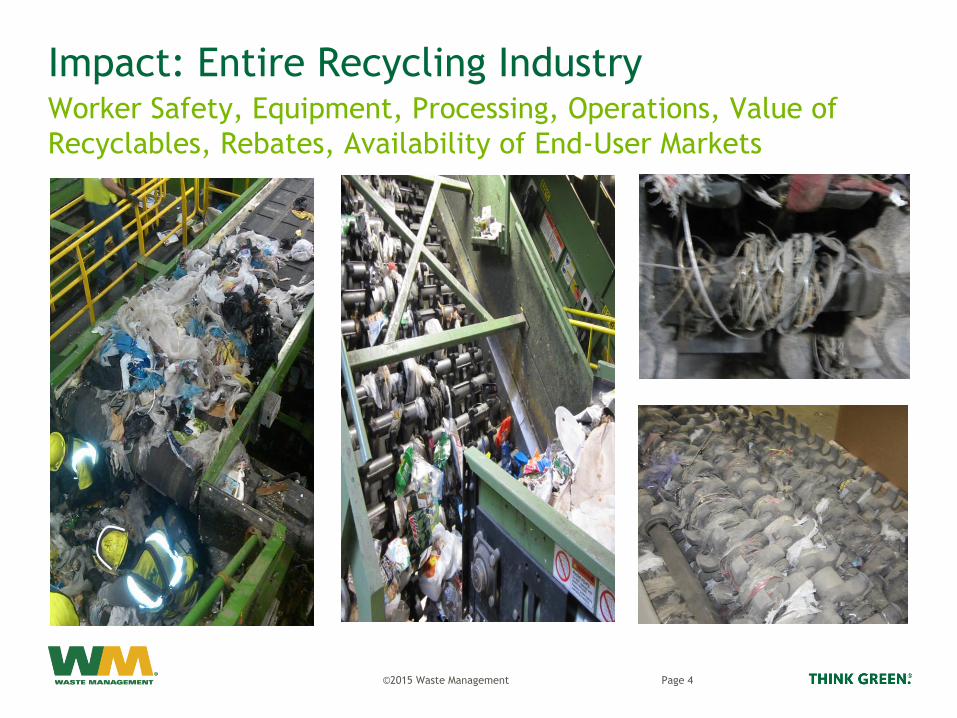
Impact: Entire Recycling Industry Worker Safety, Equipment, Processing, Operations, Value of
Recyclables, Rebates, Availability of End-User Markets
Page 4 ©2015 Waste Management

Contamination Costs OGF to West Coast Port Labor Dispute
• 5 Yr H/L Commodity Values
– OCC $180/$78 Per Ton
– MP $145/$45 Per Ton
– PET $760/$280 Per Ton
– Glass = Negative
• MRF Residue 41k Tons
– 41k x $80/Ton Disposal = $3.2M
– Residue + glass = 22.5% of material has
a negative value
• Volume: RORR
– 13% Recycled/Diverted from LF
– SSR Composition 70% fiber, 14% glass,
and 7% plastics (90% = PET + HDPE)
– Residential material = 2/3 of SSR tons
Page 5 ©2015 Waste Management

WM Solutions: LLA + Communication Protocol Visual Inspection, Tip, Separate, Sort, Weigh
Page 6 ©2015 Waste Management

WM Solutions: Education WM MRF Operations WM RORR
©2015 Waste Management Page 7

Placards, Notices, Signs, etc.
LFWD % =
©2015 Waste Management Page 8

Educational Tools
©2015 Waste Management Page 9