sports shoe booklet 2011 Sports Shoe Survey Question Always Usually Sometimes Never I choose a...
18
S.Lyon 2011
Transcript of sports shoe booklet 2011 Sports Shoe Survey Question Always Usually Sometimes Never I choose a...

S.Lyon 2011

S.Lyon 2011
Investigating design: Research (10%)
I am going to write a report looking at the design and popularity of sports
shoes. I will use the Internet to research the most popular designs and discuss their
properties and features. 6 SHOES TO BE DISCUSSED I will then design a survey that can be carries out with a selection of year 10
students
Research to be displayed as show below:
An example:
This shoe is made out of a polyurethane/ lycra upper with air holes. This is a flexible material. The holes allow the foot can breath and be worn in hot places or during exercise. The sole is flexible and made from rubber which is durable and easy cleaned and provides good grip. The colour is bright and not very stylish. They cost $150

S.Lyon 2011

S.Lyon 2011
Sports Shoe Survey
Question Always Usually Sometimes Never I choose a sports shoe bases upon its cost
I choose a sports shoe because of its colour
I choose the brand that is most comfortable for me
I choose the brand that is in style.
I choose a shoe based upon my sporting needs
Question 1 2-3 4-5 5+
The number of sports shoes I own
The number of brands of shoe I own (Nike, Adidas, Asics, New balance)
The number of styles of sports shoe I own (running, casual, basketball, football etc)
Question >$60 $60-80 $90-120 $120 +
The price usually paid form my sports shoes
The price I think is acceptable for a sports shoe
Question

S.Lyon 2011
Report 1: Researching sports shoe design (10%)
General findings from market research: Which type of sports shoe is the best seller in Australia? Which brand of shoe is the biggest seller in Australia? Which brand is generally the most expensive? Which country manufactures these shoes? How are the different types of shoes advertised? __________________________________________________________________________________________________________________________________________________________________________________________________________ __________________________________________________________________________________________________________________________________________________________________________________________________________________________________________________________________________________________________________________________________________________________________________________________________________________________________________________________________________________________________________________________________________________________________________________________________________________________________________________________________________________________________________________________________________________________________________________________________________________________________________________________________________________________________________________________________________________________________________________________________________________________________________________________________________________________________________________________________________________________________________________________________________________________________________________________________________________________________________________________________________________________________________________________________________________________________________________________________________________________________________________________________________________________________________________________________________________________________________________________________________________________________________________________________________________________________________________________________________________________________________________________________________________________________________________________________________________________________________________________________________________________________________________________________________________________
General findings from survey of students: __________________________________________________________________________________________________________________________________________________________________________________________________________ __________________________________________________________________________________________________________________________________________________________________________________________________________________________________________________________________________________________________________________________________________________________________________________________________________________________________________________________________________________________________________________________________________________________________________________________________________________________________________________________________________________________________________________________________________________________________________________________________________________________________________________________________________________________________________________________________________________________________________________________________________________________________________________________________________________________________________________________________________________________________________________________________________________________________________________________________________________________________________________________________________________________________________________________________________________________________________________________________________________________________________________________________________________________________________________________________________________________________________________________________________________________________________________

S.Lyon 2011
Practical test 1: Investigating strength (10%) Aim _________________________________________________________________________________________________________________________________________________________________________________________________________ Prediction: I think that the _______ will be the stirongest because ___________________ ______________________________________________________________________________________________________________________________________ Equipment: Clamp stand Masses Bosses and clamps Strip of material Scissors Bucket of sand. Method:
o Collect equipment o Connect clamp to clamp stand o Attach piece of material to the clamp o Place bucket of sand in drop zone underneath stand o Attach 100g mass to piece of material o Keep adding 100g masses until material breaks o Record mass needed for material to break o Repeat test 3 times o Repeat for other materials
Results: Material
Mass needed to break material
2 3 Average

S.Lyon 2011
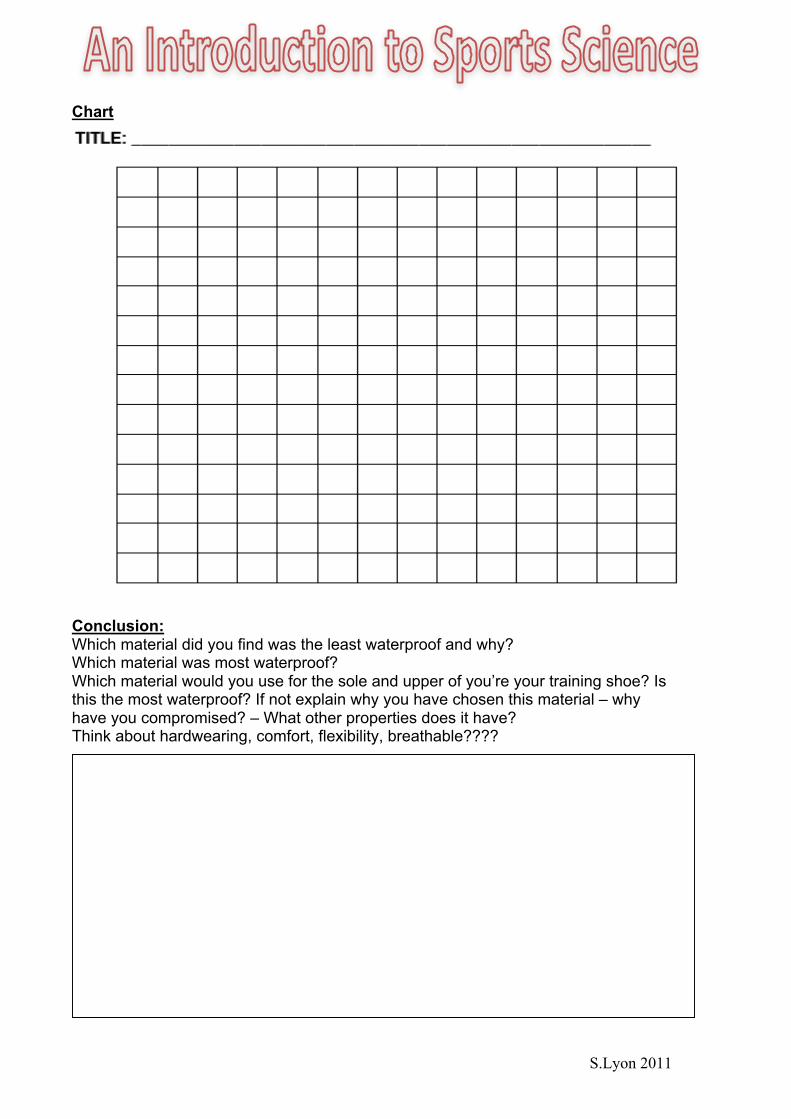
Chart
Analysis: Which material was the strongest? Was this what you expected? Why? /why not? Which was the weakest? What material would you chose for the upper of your shoe and why?

S.Lyon 2011
Evaluation: Was the experiment successful, what problems did you encounter? How could you improve the accuracy of the experiment? What could you do to make the experiment more reliable?

S.Lyon 2011
Practical test 2: Investigating waterproof properties (10%)
Aim _________________________________________________________________________________________________________________________________________________________________________________________________________ Prediction: I think that the _______ will be the most waterproof because ___________________ ______________________________________________________________________________________________________________________________________ Equipment list
o Beaker o Measuring cylinder o Materials o Stop clock o Elastic band o Tray o Pipette
Method:
o Collect equipment o Attach material over the top of the beaker using an elastic band o Place beaker into a tray o Measure 100mls of water using a measuring cylinder o Drip 100mls of water onto material using a pipette o Leave for 1 minute o Measure amount of water that has passed through the material into the
beaker using a measuring cylinder o Collect data from 2 other groups o Repeat test for other materials
Variables The independent variable is the __________________ The dependant variable is the amount __________________________ My controls are:___________________________________________________ ________________________________________________________________ Results:
Material
Amount of water passed through 1
2
3
Average
S.Lyon 2011
Chart
Conclusion: Which material did you find was the least waterproof and why? Which material was most waterproof? Which material would you use for the sole and upper of you’re your training shoe? Is this the most waterproof? If not explain why you have chosen this material – why have you compromised? – What other properties does it have? Think about hardwearing, comfort, flexibility, breathable????

S.Lyon 2011
Evaluation: Was your experiment successful? How could you improve the accuracy of the experiment? How could you make it more reliable? What could you have done if you had more time and money?

S.Lyon 2011
Practical test 3: Investigating grip / friction (10%)
Aim _________________________________________________________________________________________________________________________________________________________________________________________________________ Prediction: I think that the ______ will provide the most grip because ____________________ ______________________________________________________________________________________________________________________________________ Equipment list:
• Materials to test • 2 posts (chair legs) • Newton meter • Petri dish • 200g mass • Meter ruler • Sticky tape • Grass and tiled floor
Method
1. Collect equipment 2. Attach piece of cotton to base of dish 3. Attach elastic band to 2 posts and place dish in front of band 4. Attach Newton meter to band and pull back with a force of 7 Newton’s 5. Release dish in catapult style across the floor 6. Record distance dish travelled 7. Repeat test 3 times and calculate and average 8. Repeat test for all other materials 9. Test materials on grass surface.
Variables: The independent variable is_________________ The dependant variable is __________________ Control variables ____________________________________________________ ______________________________________________________________________________________________________________________________________ Results table: Tiled floor

S.Lyon 2011
Results table: Grass Chart of findings:

S.Lyon 2011
Analysis: Which was the best material for grip on each individual surface? Which other materials had good grip but might not be suitable – give a reason. Which material was the worst on each surface? What material would you choose to make a sole of a shoe and why? Describe why a piece of footwear requires the property of grip.
Evaluation Describe how useful each experiment was in making comparisons? Consider any improvements that could be made How could you improve the accuracy or reliability of the testing? What else could you investigate if you had appropriate time and money?

S.Lyon 2011
Practical test 4: Investigating Density
Aim _________________________________________________________________________________________________________________________________________________________________________________________________________ Prediction: I think that the ______ will be the least dense because ____________________ ______________________________________________________________________________________________________________________________________ Equipment list: Eureka can Large measuring cylinder Materials Electronic balance Calculator Method:
1. Collect equipment 2. Fill Eureka can to the brim with water 3. Record the mass of the material using an electronic balance 4. Place measuring cylinder next to spout of can 5. Drop material into can of water 6. Collect the water that overflows from can into measuring cylinder 7. Record the amount of water that was displaced from can 8. Repeat 3 times 9. Repeat for other materials
Variables: The independent variable is_________________ The dependant variable is __________________ Control variables ____________________________________________________ ______________________________________________________________________________________________________________________________________

S.Lyon 2011
Results:
Material
Mass (g) Volume in cm3
Density (g/cm3)
Chart

S.Lyon 2011
Analysis:
• Draw a bar chart to display these results. Material (x axis) density (y axis) • Which material was the densest? Why would this not be suitable for the shoe? • Which material was the least dense? Would this be suitable for the shoe? • Which material would you choose to make your shoe from and why? What
other factors affected your decision?
Evaluation:
• Did your findings match your prediction? • Was your experiment successful? • How could you improve the accuracy of the experiment? • How could you improve the reliability?

S.Lyon 2011
Explanation 2: Design of sports shoe (10%)
1. On A3 paper draw a design of your ideal shoe using the best materials from your practical tests
2. Think about design, which brands were most popular in the survey? Was the colour important? What type of shoe is it going to be?
3. Annotate around your design labelling the parts of the shoe, materials chosen and reasons for choice.
Example
Upper made from …… because…….
Heel made from ……….. because …
Laces made from …… because …..
Sole made from ……… because ………