Spectrum Analyzer...Spectrum analyzer Spans from 1 kHz to 6.2 GHz Three traces plus math and...
20
Spectrum Analyzer RSA306 USB Real Time Spectrum Analyzer Datasheet The RSA306 uses your PC and Tektronix SignalVu-PC ™ RF Signal Analysis Software to provide real time spectrum analysis, streaming capture and deep signal analysis capabilities for signals from 9 kHz to 6.2 GHz, all in a low-cost, highly portable package that is ideal for field, factory, or academic use. Key performance specifications 9 kHz to 6.2 GHz frequency range covers a broad range of analysis needs +20 dBm to -160 dBm measurement range Captures interference to ensure that you see problems first time, every time Mil-Std 28800 Class 2 environmental, shock and vibration specifications for use in harsh conditions Key features Full-featured spectrum analysis capability with included Tektronix SignalVu-PC ™ software 27 spectrum and signal analysis measurements standard Options for mapping, modulation analysis, WLAN and Bluetooth standards support, pulse measurements, playback of recorded files, and frequency settling Real time Spectrum/Spectrogram display to minimize time spent on transient and interference hunting Application programming interface (API) included for Microsoft Windows environments MATLAB instrument driver for use with Instrument Control Toolbox Streaming capture records long-term events Applications Academic/education Maintenance, installation and repair in the factory or field Value-conscious design and manufacturing Interference hunting The RSA306: a new class of instrument The RSA306 offers full-featured spectrum analysis and deep signal analysis at a price unmatched by any previous offering. Using the latest in commercial interfaces and available computing power, the RSA306 separates signal acquisition from measurement, dramatically lowering the cost of instrument hardware. Data analysis, storage and replay is performed on your personal computer, tablet or laptop. Managing the PC separately from the acquisition hardware makes processing upgrades easy, and minimizes IT management issues. SignalVu-PC ™ software and an API for deep analysis and fast programmatic interaction The RSA306 operates with SignalVu-PC, a powerful program that is the basis of Tektronix performance signal analyzers. SignalVu-PC offers a deep analysis capability previously unavailable in value-priced solutions. Real-time processing of the DPX spectrum/spectrogram is enabled in your PC, further reducing the cost of hardware. Customers who need programmatic access to the instrument can choose either the SignalVu-PC programmatic interface or use the included application programming interface (API) that provides a rich set of commands and measurements. A MATLAB driver for the API is available, enabling operation with MATLAB and the Instrument Control Toolbox. www.tek.com 1
Transcript of Spectrum Analyzer...Spectrum analyzer Spans from 1 kHz to 6.2 GHz Three traces plus math and...

Spectrum AnalyzerRSA306 USB Real Time Spectrum Analyzer Datasheet
The RSA306 uses your PC and Tektronix SignalVu-PC™ RF SignalAnalysis Software to provide real time spectrum analysis, streamingcapture and deep signal analysis capabilities for signals from 9 kHz to6.2 GHz, all in a low-cost, highly portable package that is ideal for field,factory, or academic use.
Key performance specifications
9 kHz to 6.2 GHz frequency range covers a broad range of analysisneeds
+20 dBm to -160 dBm measurement range
Captures interference to ensure that you see problems first time, everytime
Mil-Std 28800 Class 2 environmental, shock and vibrationspecifications for use in harsh conditions
Key features
Full-featured spectrum analysis capability with included TektronixSignalVu-PC™ software
27 spectrum and signal analysis measurements standard
Options for mapping, modulation analysis, WLAN and Bluetoothstandards support, pulse measurements, playback of recorded files,and frequency settling
Real time Spectrum/Spectrogram display to minimize time spent ontransient and interference hunting
Application programming interface (API) included for MicrosoftWindows environments
MATLAB instrument driver for use with Instrument Control Toolbox
Streaming capture records long-term events
Applications
Academic/education
Maintenance, installation and repair in the factory or field
Value-conscious design and manufacturing
Interference hunting
The RSA306: a new class of instrumentThe RSA306 offers full-featured spectrum analysis and deep signalanalysis at a price unmatched by any previous offering. Using the latest incommercial interfaces and available computing power, the RSA306separates signal acquisition from measurement, dramatically lowering thecost of instrument hardware. Data analysis, storage and replay isperformed on your personal computer, tablet or laptop. Managing the PCseparately from the acquisition hardware makes processing upgrades easy,and minimizes IT management issues.
SignalVu-PC™ software and an API for deepanalysis and fast programmatic interactionThe RSA306 operates with SignalVu-PC, a powerful program that is thebasis of Tektronix performance signal analyzers. SignalVu-PC offers adeep analysis capability previously unavailable in value-priced solutions.Real-time processing of the DPX spectrum/spectrogram is enabled in yourPC, further reducing the cost of hardware. Customers who needprogrammatic access to the instrument can choose either the SignalVu-PCprogrammatic interface or use the included application programminginterface (API) that provides a rich set of commands and measurements. AMATLAB driver for the API is available, enabling operation with MATLABand the Instrument Control Toolbox.
www.tek.com 1
Measurements included in SignalVu-PC baseversionBasic functionality of the free SignalVu-PC program is far from basic. Thetable below summarizes the measurements included in the free SignalVu-PC software.
General signal analysisSpectrum analyzer Spans from 1 kHz to 6.2 GHz
Three traces plus math and spectrogramtraceFive markers with power, relative power,integrated power, power density anddBc/Hz functions
DPX Spectrum/Spectrogram Real time display of spectrum with 100%probability of intercept of 100 μsecsignals in up to 40 MHz span
Amplitude, frequency, phase vs. time,RF I and Q vs. time
Basic vector analysis functions
Time Overview/Navigator Enables easy setting of acquisition andanalysis times for deep analysis inmultiple domains
Spectrogram Analyze and re-analyze your signal witha 2-D or 3-D waterfall display
AM/FM listening Hear, and record to file, FM and AMsignals
Analog modulation analysisAM, FM, PM analysis Measures key AM, FM, PM parametersRF measurementsSpurious measurement User-defined limit lines and regions
provide automatic spectrum violationtesting across the entire range of theinstrument
Spectrum emission mask User-defined or standards-specificmasks
Occupied Bandwidth Measures 99% power, -xdB down pointsChannel Power and ACLR Variable channel and adjacent/alternate
channel parametersMCPR Sophisticated, flexible multi-channel
power measurementsCCDF Complementary Cumulative Distribution
Function plots the statistical variations insignal level
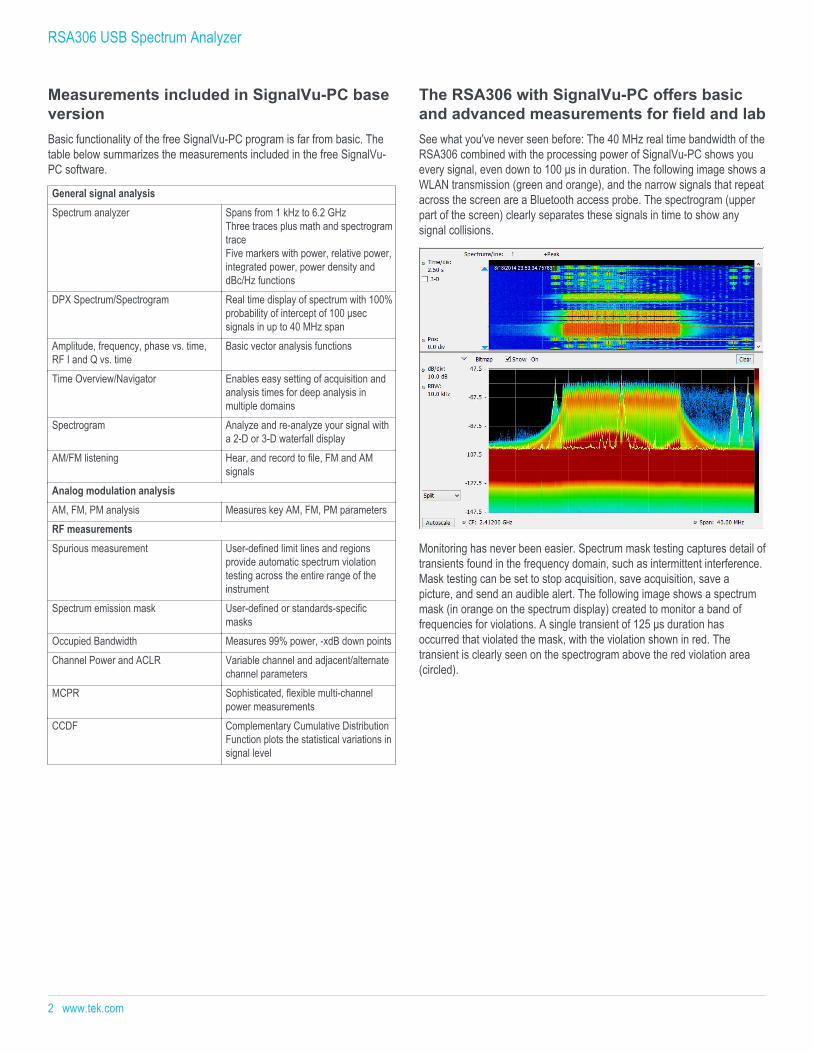
The RSA306 with SignalVu-PC offers basicand advanced measurements for field and labSee what you've never seen before: The 40 MHz real time bandwidth of theRSA306 combined with the processing power of SignalVu-PC shows youevery signal, even down to 100 μs in duration. The following image shows aWLAN transmission (green and orange), and the narrow signals that repeatacross the screen are a Bluetooth access probe. The spectrogram (upperpart of the screen) clearly separates these signals in time to show anysignal collisions.
Monitoring has never been easier. Spectrum mask testing captures detail oftransients found in the frequency domain, such as intermittent interference.Mask testing can be set to stop acquisition, save acquisition, save apicture, and send an audible alert. The following image shows a spectrummask (in orange on the spectrum display) created to monitor a band offrequencies for violations. A single transient of 125 μs duration hasoccurred that violated the mask, with the violation shown in red. Thetransient is clearly seen on the spectrogram above the red violation area(circled).
RSA306 USB Spectrum Analyzer
2 www.tek.com

EMI pre-compliance and diagnostic measurements are easy with theRSA306 and SignalVu-PC. Transducer, antenna, preamplifier, and cablegain/loss can be entered and stored in correction files, and the standardspurious measurement feature of SignalVu-PC can be used to establishlimit lines for your test. The following illustration shows a test from 400 MHzto 1 GHz with the test limit shown in green. Violations are recorded in theresults table of the test below the graph, and the control panel for externalloss entry is shown. CISPR peak detection and -6 dB filter bandwidths arestandard functions, giving you comparable results to other tools.
Analysis of AM and FM signals is standard in SignalVu-PC. The followingscreen shot shows a 1 kHz tone amplitude modulating a carrier to 48.9%total AM. Markers are used on the spectrum display to measure themodulation sideband at 1 kHz offset, 12.28 dB down from the carrier. Thesame signal is simultaneously viewed in the modulation display, showingAM versus time, with +Peak, -Peak and Total AM measurements.Advanced measurements for analog audio modulation including SINAD,THD and modulation rate are available in Option SVA.
SignalVu-PC application-specific licenses
SignalVu-PC offers a wealth of application-oriented measurement andanalysis options including:
General-purpose modulation analysis (27 modulation types including16/32/64/256 QAM, QPSK, O-QPSK, GMSK, FSK, APSK)
P25 analysis of phase I and phase 2 signals
WLAN analysis of 802.11a/b/g/j/p, 802.11n, 802.11ac
LTE™ FDD and TDD Base Station (eNB) Cell ID & RF measurements
Buetooth® analysis of Low Energy, Basic Rate and Enhanced DataRate
Mapping and signal strength
Pulse analysis
AM/FM/PM/Direct Audio Measurement including SINAD, THD
Playback of recorded files, including complete analysis in all domains
Signal Classification and Survey
Modulation analysis application SVM enables multiple displays ofmodulation quality. The following screen shot shows the standard ChannelPower/ACLR measurement combined with a constellation display andvector signal quality measurements on a QPSK signal.
Datasheet
www.tek.com 3

SignalVu-PC application SV26 enables quick, standards-based transmitterhealth checks on APCO P25 signals. The following image shows a Phase IIsignal being monitored for anomalies with the spectrum analyzer whileperforming transmitter power, modulation and frequency measurements.
Sophisticated WLAN measurements are easy. On the following 802.11gsignal display below, the spectrogram shows the initial pilot sequencefollowed by the main signal burst. The modulation is automatically detectedas 64 QAM for the packet and displayed as a constellation. The datasummary indicates an EVM of -33.24 dB RMS, and burst power ismeasured at 10.35 dBm. SignalVu-PC applications are available for802.11a/b/j/g/p, 802.11n and 802.11ac to 40 MHz bandwidth.
With application SV27 you can perform Bluetooth SIG standard-basedtransmitter RF measurements in the time, frequency, and modulationdomains. This application supports Basic Rate and Low Energy Transmittermeasurements defined by Bluetooth SIG Test Specification RF.TS.4.1.1 forBasic Rate and RF-PHY.TS.4.1.1 for Bluetooth Low Energy. ApplicationSV27 also automatically detects Enhanced Data Rate packets,demodulates them and provides symbol information. Data packet fields arecolor encoded in the Symbol table for clear identification.
Pass/Fail results are provided with customizable limits and the Bluetoothpresets make the different test set-ups push-button. The measurementbelow shows deviation vs. time, frequency offset and drift, and ameasurement summary with pass/fail results.
The SignalVu-PC MAP application enables interference hunting andlocation analysis. Locate interference with an azimuth function that lets youdraw a line or an arrow on a mapped measurement to indicate the directionyour antenna was pointing when you take a measurement. You can alsocreate and display measurement labels.
Application SV28 enables the following LTE base station transmittermeasurements:
Cell ID
Channel Power
Occupied Bandwidth
Adjacent Channel Leakage Ratio (ACLR)
Spectrum Emission Mask (SEM)
Transmitter Off Power for TDD
There are four presets to accelerate pre-compliance testing and determinethe Cell ID. These presets are defined as Cell ID, ACLR, SEM, ChannelPower and TDD Toff Power. The measurements follow the definition in3GPP TS Version 12.5 and support all base station categories, includingpicocells and femtocells. Pass/Fail information is reported and all channelbandwidths are supported.
RSA306 USB Spectrum Analyzer
4 www.tek.com

The Cell ID preset displays the Primary Synchronization Signal (PSS) andthe Secondary Synchronization Signal (SSS) in a Constellation diagram. Italso provides Frequency Error.
The ACLR preset measures the E-UTRA and the UTRA adjacent channels,with different chip rates for UTRA. ACLR also supports Noise Correctionbased on the noise measured when there is no input. Both ACLR and SEMwill operate in swept mode (default) or in faster single acquisition (real-time)when the measurement bandwidth required is less than 40 MHz.
Playback of recorded signals can reduce hours of watching and waiting fora spectral violation to minutes at your desk reviewing recorded data.Recording length is limited only by storage media size and recording is abasic feature included in SignalVu-PC. SignalVu-PC application SV56Playback allows for complete analysis by all SignalVu-PC measurements,including DPX Spectrogram. Minimum signal duration specifications aremaintained during playback. AM/FM audio demodulation can be performed.Variable span, resolution bandwidth, analysis length, and bandwidth are allavailable. Frequency mask testing can be performed on recorded signalsup to 40 MHz in span, with actions on mask violation including beep, stop,save trace, save picture, and save data. Portions of the playback can beselected and looped for repeat examination of signals of interest. Playbackcan be skip-free, or time gaps can be inserted to reduce review time. A LiveRate playback ensures fidelity of AM/FM demodulation and provides a1:1 playback vs. actual time. Clock time of the recording is displayed in thespectrogram markers for correlation to real world events. In the illustrationbelow, the FM band is being replayed, with a mask applied to detectspectral violations, simultaneous with listening to the FM signal at thecenter frequency of 92.3 MHz.
The signal classification application (SV54) enables expert systemsguidance to aid the user in classifying signals. It provides graphical toolsthat allow you to quickly create a spectral region of interest, enabling you toclassify and sort signals efficiently. The spectral profile mask, when overlaidon top of a trace, provides signal shape guidance, while frequency,bandwidth, channel number, and location are displayed allowing for quickchecks. WLAN, GSM, W-CDMA, CDMA, Bluetooth standard and enhanceddata rate, LTE FDD and TDD, and ATSC signals can be quickly and simplyclassified. Databases can be imported from your H500/RSA2500 signaldatabase library for easy transition to the new software base.
Above is a typical signal survey. This survey is of a portion of the TV broadcast band,and 7 regions have been declared as either Permitted, Unknown, or Unauthorized, asindicated by the color bars for each region.
In this illustration, a single region has been selected. Since we have declared this to bean ATSC video signal, the spectrum mask for the ATSC signal is shown overlaid in theregion. The signal is a close match to the spectrum mask, including the vestigial carrierat the lower side of the signal, characteristic of ATSC broadcasts.
SignalVu-PC with mapping can be used to manually indicate the azimuth ofa measurement made in the field, greatly aiding in triangulation efforts. Theaddition of a smart antenna able to report its direction to SignalVu-PCautomates this process. Automatically plotting the azimuth/bearing of ameasurement during interference hunting can greatly speed the time spentsearching for the source of interference. Tektronix offers the Alaris DF-A0047 handheld direction finding antenna with frequency coverage from20 MHz -8.5 GHz (optional 9 kHz-20 MHz) as part of a completeinterference hunting solution. Azimuth information and the selectedmeasurement is automatically recorded on the SignalVu-PC Map just byreleasing the control button on the antenna. Full specifications for the DF-A0047 antenna are available in a separate antenna datasheet available onwww.Tektronix.com.
Datasheet
www.tek.com 5

SpecificationsSpecifications are valid within the following conditions:
Operate the instrument in an environment that meets the temperature, altitude, and humidity characteristics listed in these specifications.
Warm up time is 30 minutes after connecting to the PC and starting the SignalVu application.
All specifications are guaranteed unless noted otherwise. All specifications apply to all models unless noted otherwise.
Frequency
RF input frequency range 9 kHz to 6.2 GHz
Frequency reference accuracyInitial ±3 ppm + aging (18 °C to 28 °C ambient, after 20 minute warm up)
±25 ppm + aging (-10 °C to 55 °C ambient, after 20 minute warm up), typicalAging (typical) ±3 ppm (1st year), ±1 ppm/year thereafter
External frequency reference inputInput frequency range 10 MHz ±10 HzInput level range -10 dBm to +10 dBm sinusoidImpedance 50 Ω
Center frequency resolutionBlock IQ samples 1 HzStreamed ADC samples 500 kHz
Amplitude
RF input impedance 50 Ω
RF input VSWR (typical) ≤ 1.8:1 (10 MHz to 6200 MHz, reference level ≥ +10 dBm)
Maximum RF input level withoutdamage
DC voltage ±40 VDC
Reference level ≥ –10 dBm +23 dBm (continuous or peak)Reference level < –10 dBm +15 dBm (continuous or peak)
Maximum RF input operating level The maximum level at the RF input for which the instrument will meet its measurement specifications.Center frequency < 22 MHz(low-frequency path)
+15 dBm
Center frequency ≥22 MHz(RF path)
+20 dBm
RSA306 USB Spectrum Analyzer
6 www.tek.com

Amplitude accuracy at all centerfrequencies
Center frequency Warranted (18 °C to 28 °C) Typical (95% confidence)(18 °C to 28 °C)
Typical (-10 °C to 55 °C)
9 kHz - < 3 GHz ±2.0 dB ±1.25 dB ±3.0 dB≥ 3 GHz - 6.2 GHz ±2.75 dB ±2.0 dB ±3.0 dB
Reference level +20 dBm to -30 dBm, alignment run prior to testing.
Applies to corrected IQ data, with signal to noise ratios > 40 dB.
Accuracy may degrade up to ±0.6 dB after storage at maximum storage temperature, recovers within 24 hours
Intermediate frequency and acquisition system
IF bandwidth 40 MHz
ADC sample rate and bit width 112 Ms/s, 14 bits
Real-time IF acquisition data(uncorrected)
112 Ms/s, 16-bit integer real samples
40 MHz BW, 28 ±0.25 MHz Digital IF, uncorrected. Corrected values are stored with saved files
Block streaming data at an average rate of 224 MB/s
Block baseband acquisition data(corrected)
Maximum acquisition time 1 secondBandwidths ≤ 40 /( 2N) MHz, 0 Hz Digital IF, N ≥ 0 Sample rates ≤ 56 / (2N) Msps, 32-bit float complex samples, N ≥ 0
Channel amplitude flatness ±1.0 dB, 18 ⁰C to 28 ⁰C±2.0 dB, -10 ⁰C to 55 ⁰C, typical
±3.0 dB, 22 MHz - 24 MHz, -10 ⁰C to 55 ⁰C, typical
Reference level +20 dBm to -30 dBm, alignment run before testing
Applies to corrected IQ data, with signal to noise ratios > 40 dB
Trigger
Trigger/sync inputVoltage range TTL, 0.0 V – 5.0 VTrigger level, positive-goingthreshold voltage
1.6 V minimum; 2.1 V maximum
Trigger level, negative-goingthreshold voltage
1.0 V minimum; 1.35 V maximum
Impedance 10 kΩ
IF power triggerThreshold range 0 dB to -50 dB from reference level, for trigger levels > 30 dB above the noise floorType Rising or falling edgeTrigger re-arm time ≤100 μs
Datasheet
Amplitude
www.tek.com 7

Noise and distortion
Displayed Average Noise Level(DANL)
Reference level = -50 dBm, input terminated with 50 Ω load, log-average detection (10 averages). SignalVu-PC Spectrummeasurements with Span > 40 MHz may use LF or RF path in the first segment of the spectrum sweep.
Center frequency Frequency range DANL (dBm/Hz) DANL (dBm/Hz), typical< 22 MHz(LF path)
100 kHz - 42 MHz -130 -133
≥ 22 MHz(RF path)
2 MHz - 5 MHz -145 -148 > 5 MHz - 1.0 GHz -160 -163 > 1.0 GHz - 2.0 GHz -158 -161 > 2.0 GHz - 4.0 GHz -155 -158 > 4.0 GHz - 6.2 GHz -150 -153
Phase noise Phase noise measured with 1 GHz CW signal at 0 dBm
The following table entries are in dBc/Hz units
Center frequencyOffset 1 GHz 10 MHz (typical) 1 GHz (typical) 2.5 GHz (typical) 6 GHz (typical)1 kHz -85 -115 -89 -78 -70 10 kHz -84 -122 -87 -84 -83 100 kHz -90 -126 -92 -92 -94 1 MHz -118 -127 -120 -114 -108
Residual spurious response < -78 dBm (Reference level ≤ -50 dBm, RF input terminated with 50 Ω)
Harmonics of 112 MHz in the range 1680-2688 MHz
LO related spurious in the ranges 3895-3945 MHz, 4780-4810 MHz, and 4920-4950 MHz
Input related spurious response(SFDR)
≤ -50 dBc, 18 ⁰C to 28 ⁰C, with auto settings on and signals 10 dB below reference level of -30 dBm, span ≤ 40 MHz
Input frequencies ≤ 8 GHz ≤ -50 dBc, -10 ⁰C to 55 ⁰C, typical
Exceptions, typical:
IF feedthrough: ≤ -45 dBc for 1850 MHz - 2700 MHz center frequency
Image: ≤ -35 dBc for 3700 MHz - 3882 MHz center frequency; ≤ -35 dBc for 5400 MHz - 5700 MHz center frequency
RFx3LO: ≤ -45 dBc for 4175 MHz - 4225 MHz center frequencyInput frequencies 6.2 GHz -8.0 GHz, typical
Image: ≤ -40 dBc for 3882 MHz - 4760 MHz center frequency
RFx2LO: ≤ -25 dBc for 4800 MHz - 5150 MHz center frequency
RFx3LO: ≤ -45 dBc for 4175 MHz - 4225 MHz center frequency
Residual FM < 10 HzP-P (95% confidence)
3RD order IM distortion Two input CW signals, 1 MHz separation, each input signal level 5 dB below the reference level setting at the RF input
Reference level at-15 dBm disables Preamp; reference level at -30 dBm enables PreampCenter frequency 2130 MHz ≤ -60 dBc at reference level -15 dBm, 18 ⁰C to 28 ⁰C
≤ -60 dBc, at reference level -15 dBm, -10 ⁰C to 55 ⁰C, typical40 MHz to 6.2 GHz, typical < -58 dBc at reference level = -10 dBm
< -50 dBc at reference level = -50 dBm
RSA306 USB Spectrum Analyzer
8 www.tek.com

3RD order intercept (TOI)Center frequency 2130 MHz ≥ +10 dBm at reference level -15 dBm, 18 ⁰C to 28 ⁰C
≥ +10 dBm, at reference level -15 dBm, -10 ⁰C to 55 ⁰C, typical40 MHz to 6.2 GHz, typical +14 dBm at reference level -10 dBm
-30 dBm at reference level -50 dBm
2ND harmonic distortion, typical < -55 dBc, 10 MHz to 300 MHz, reference level = 0 dBm
< -60 dBc, 300 MHz to 3.1 GHz, reference level = 0 dBm
< -50 dBc, 10 MHz to 3.1 GHz, reference level = -40 dBm
Exception: < -45 dBc in the range 1850-2330 MHz
2ND harmonic intercept (SHI) +55 dBm, 10 MHz to 300 MHz, reference level = 0 dBm
+60 dBm, 300 MHz to 3.1 GHz, reference level = 0 dBm
+10 dBm, 10 MHz to 3.1 GHz, reference level = -40 dBm
Exception: < +5 dBm in the range 1850-2330 MHz
Local oscillator feedthrough toinput connector
< -75 dBm at reference level = -30 dBm
Audio Output
Audio output (from SignalVu-PC orapplication programminginterface)
Types AM, FMIF bandwidth range Five selections, 8 kHz – 200 kHzAudio output frequency range 50 Hz – 10 kHzPC audio output 16 bits at 32 ks/sAudio file output format .wav format, 16 bit, 32 ks/s
SignalVu-PC base performance summarySelected SignalVu-PC features when used with the RSA306. See the SignalVu-PC datasheet for more information on the application features.
SignalVu-PC/RSA306 keycharacteristics
Maximum span 40 MHz real-time
9 kHz - 6.2 GHz sweptMaximum acquisition time 1.0 sMinimum IQ resolution 17.9 ns (acquisition BW = 40 MHz)Tuning Tables Tables that present frequency selection in the form of standards-based channels are available for the following.
Cellular standards families: AMPS, NADC, NMT-450, PDC, GSM, CDMA, CDMA-2000, 1xEV-DO WCDMA, TD-SCDMA, LTE,WiMax
Unlicensed short range: 802.11a/b/j/g/p/n/ac, Bluetooth
Cordless phone: DECT, PHS
Broadcast: AM, FM, ATSC, DVBT/H, NTSC
Mobile radio, pagers, other: GMRS/FRS, iDEN, FLEX, P25, PWT, SMR, WiMax
Datasheet
Noise and distortion
www.tek.com 9

Signal Strength displaySignal strength indicator Located at right side of displayMeasurement bandwidth Up to 40 MHz, dependent on span and RBW settingTone type Variable frequency based on received signal strength
Spectrum displayTraces Three traces + 1 math trace + 1 trace from spectrogram for spectrum displayTrace functions Normal, Average (VRMS), Max Hold, Min Hold, Average of LogsDetector Average (VRMS), Average, CISPR peak, +Peak, -Peak, SampleSpectrum trace length 801, 2401, 4001, 8001,10401, 16001, 32001, and 64001 pointsRBW range 10 Hz to 10 MHz
DPX spectrum displaySpectrum processing rate(RBW = auto, trace length 801)
10,000/s
DPX bitmap resolution 201x801Marker information Amplitude, frequency, signal densityMinimum signal duration for100% probability of detection
100 μs
Span: 40 MHz, RBW = Auto, Max-hold on
Due to the non-deterministic execution time of programs running under the Microsoft Windows OS, this specification may not bemet when the host PC is heavily loaded with other processing tasks
Span range (continuousprocessing)
1 kHz to 40 MHz
Span range (swept) Up to maximum frequency range of instrumentDwell time per step 50 ms to 100 sTrace processing Color-graded bitmap, +Peak, -Peak, averageTrace length 801, 2401, 4001, 10401 RBW range 1 kHz to 10 MHz
DPX Spectrogram displayTrace detection +Peak, -Peak, Average(VRMS)Trace length, memory depth 801 (60,000 traces)
2401 (20,000 traces)
4001 (12,000 traces)Time resolution per line 50 ms to 6400 s, user selectable
Analog modulation analysis(standard)
AM demodulation accuracy,typical
±2%
0 dBm input at center, carrier frequency 1 GHz, 1kHz/5kHz input/modulated frequency, 10% to 60% modulation depth
0 dBm input power level, reference level = 10 dBmFM demodulation accuracy,typical
±3%
0 dBm input at center, carrier frequency 1 GHz, 400Hz/1kHz input/modulated frequency
0 dBm input power level, reference level = 10 dBmPM demodulation accuracy,typical
±1% of measurement bandwidth
0 dBm input at center, carrier frequency 1 GHz, 1kHz/5kHz input/modulated frequency
0 dBm input power level, reference level = 10 dBm
RSA306 USB Spectrum Analyzer
SignalVu-PC base performance summary
10 www.tek.com

SignalVu-PC application licenses
AM/FM/PM and direct audiomeasurement (SVAxx-SVPC)
Carrier frequency range (formodulation and audiomeasurements)
(1/2 × audio analysis bandwidth) to maximum input frequency
Maximum audio frequencyspan
10 MHz
FM measurements (Mod. index>0.1)
Carrier Power, Carrier Frequency Error, Audio Frequency, Deviation (+Peak, -Peak, Peak-Peak/2, RMS), SINAD, ModulationDistortion, S/N, Total Harmonic Distortion, Total Non-harmonic Distortion, Hum and Noise
AM measurements Carrier Power, Audio Frequency, Modulation Depth (+Peak, -Peak, Peak-Peak/2, RMS), SINAD, Modulation Distortion, S/N, TotalHarmonic Distortion, Total Non-harmonic Distortion, Hum and Noise
PM measurements Carrier Power, Carrier Frequency Error, Audio Frequency, Deviation (+Peak, -Peak, Peak-Peak/2, RMS), SINAD, ModulationDistortion, S/N, Total Harmonic Distortion, Total Non-harmonic Distortion, Hum and Noise
Direct audio measurements Signal power, Audio frequency (+Peak, -Peak, Peak-Peak/2, RMS), SINAD, Modulation distortion, S/N, Total harmonic distortion,Total non-harmonic distortion, Hum and Noise
Audio filters Low pass: 0.3, 3, 15, 30, 80, 300, and user-entered up to 0.9 × audio bandwidth
High pass: 20, 50, 300, 400, and user-entered up to 0.9 × audio bandwidth
Standard: CCITT, C-Message
De-emphasis (μs): 25, 50, 75, 750, and user-entered
File: User-supplied .TXT or .CSV file of amplitude/frequency pairs. Maximum 1000 pairs
Performancecharacteristics, typical
Conditions: Unless otherwise stated, performance is given for:Modulation rate = 5 kHzAM depth: 50%PM deviation 0.628 RadiansFM AM PM Conditions
Carrier Power accuracy Refer to instrument amplitude accuracyCarrier Frequencyaccuracy
± 7 Hz + (transmitterfrequency × ref. freq.error)
Refer to instrumentfrequency accuracy
± 2 Hz + (transmitterfrequency × ref. freq.error)
FM deviation: 5 kHz /100 kHz
Depth of Modulationaccuracy
NA ± 0.5% NA Rate: 5 kHzDepth: 50%
Deviation accuracy ± (2% × (rate +deviation))
NA ± 3% FM deviation: 100 kHz
Rate accuracy ± 0.2 Hz ± 0.2 Hz ± 0.2 Hz FM deviation: 5 kHz /100 kHz
Residual THD 0.5% 0.5% NA FM Deviation: 5 kHz /100 kHzRate: 1 kHz
Residual SINAD 49 dB40 dB
56 dB 42 dB FM deviation 5 kHzFM deviation 100 kHzRate: 1 kHz
Pulse measurements (SVPxx-SVPC)
Measurements (nominal) Average On Power, Peak Power, Average Transmitted Power, Pulse Width, Rise Time, Fall Time, Repetition Interval(seconds),Repetition Interval (Hz), Duty Factor (%), Duty Factor (ratio), Ripple, Droop, Pulse-Pulse Frequency Difference, Pulse-Pulse PhaseDifference, RMS Frequency Error, Max Frequency Error, RMS Phase Error, Max Phase Error, Frequency Deviation, PhaseDeviation, Time Stamp, Delta Frequency, Impulse Response, Overshoot
Minimum pulse width fordetection
150 ns
Average ON power at 18 °C to28 °C, typical
±1.0 dB + absolute amplitude accuracy
For pulses of 300 ns width or greater, duty cycles of .5 to .001, and S/N ratio ≥ 30 dB
Datasheet
www.tek.com 11

Duty factor, typical ±0.2% of reading
For pulses of 450 ns width or greater, duty cycles of .5 to .001, and S/N ratio ≥ 30 dBAverage transmitted power,typical
±1.0 dB + absolute amplitude accuracy
For pulses of 300 ns width or greater, duty cycles of .5 to .001, and S/N ratio ≥ 30 dBPeak pulse power, typical ±1.5 dB + absolute amplitude accuracy
For pulses of 300 ns width or greater, duty cycles of .5 to .001, and S/N ratio ≥ 30 dBPulse width, typical ±0.25% of reading
For pulses of 450 ns width or greater, duty cycles of .5 to .001, and S/N ratio ≥ 30 dB
General purpose digitalmodulation analysis (SVMxx-SVPC)
Modulation formats BPSK, QPSK, 8PSK, 16QAM, 32QAM, 64QAM, 256QAM, PI/2DBPSK, DQPSK, PI/4DQPSK, D8PSK, D16PSK, SBPSK, OQPSK,SOQPSK, MSK, GFSK, CPM, 2FSK, 4FSK, 8FSK, 16FSK, C4FM
Analysis period Up to 81,000 samplesMeasurement filter Root Raised Cosine, Raised Cosine, Gaussian, Rectangular, IS-95 TX_MEA, IS-95 Base TXEQ_MEA, NoneReference Filter Gaussian, Raised Cosine, Rectangular, IS-95 REF, NoneFilter rolloff factor α:0.001 to 1, in 0.001 stepsMeasurements Constellation, Demod I&Q vs. Time, Error Vector Magnitude (EVM) vs. Time, Eye Diagram, Frequency Deviation vs. Time,
Magnitude Error vs. Time, Phase Error vs. Time, Signal Quality, Symbol Table, Trellis DiagramSymbol rate range 1 k symbols/s to 40 M symbols/s
Modulated signal must be contained entirely within the acquisition bandwidthAdaptive equalizer Linear, Decision-Directed, Feed-Forward (FIR) equalizer with coefficient adaptation and adjustable convergence rate. Supports
modulation types BPSK, QPSK, OQPSK, π/2-DBPSK, π/4-DQPSK, 8-PSK, 8-DSPK, 16-DPSK, 16/32/64/128/256-QAMQPSK Residual EVM (centerfrequency = 2 GHz), typical
1.1 % (100 kHz symbol rate)
1.1 % (1 MHz symbol rate)
1.2 % (10 MHz symbol rate)
2.5 % (30 MHz symbol rate)
400 symbols measurement length, 20 Averages, normalization reference = maximum symbol magnitude256 QAM Residual EVM(center frequency = 2 GHz),typical
0.8 % (10 MHz symbol rate)
1.5 % (30 MHz symbol rate)
400 symbols measurement length, 20 Averages, normalization reference = maximum symbol magnitude
WLAN Measurements, 802.11a/b/g/j/p (SV23xx-SVPC)
Measurements WLAN power vs. time; WLAN symbol table; WLAN constellation; spectrum emission mask; error vector magnitude (EVM) vs.symbol (or time), vs subcarrier (or frequency); mag error vs symbol (or time), vs. subcarrier (or frequency); phase error vs symbol(or time), vs. subcarrier (or frequency); channel frequency response vs. symbol (or time), vs. subcarrier (or frequency); spectralflatness vs. symbol (or time), vs. subcarrier (or frequency)
Residual EVM - 802.11a/g/j /p(OFDM), 64-QAM, typical
2.4 GHz, 20 MHz BW: -38 dB
5.8 GHz, 20 MHz BW: -38 dB
Input signal level optimized for best EVM, average of 20 bursts, ≥16 symbols eachResidual EVM - 802.11b,CCK-11, typical
2.4 GHz, 11 Mbps: 2.0 %
Input signal level optimized for best EVM, average of 1,000 chips, BT = .61
RSA306 USB Spectrum Analyzer
SignalVu-PC application licenses
12 www.tek.com
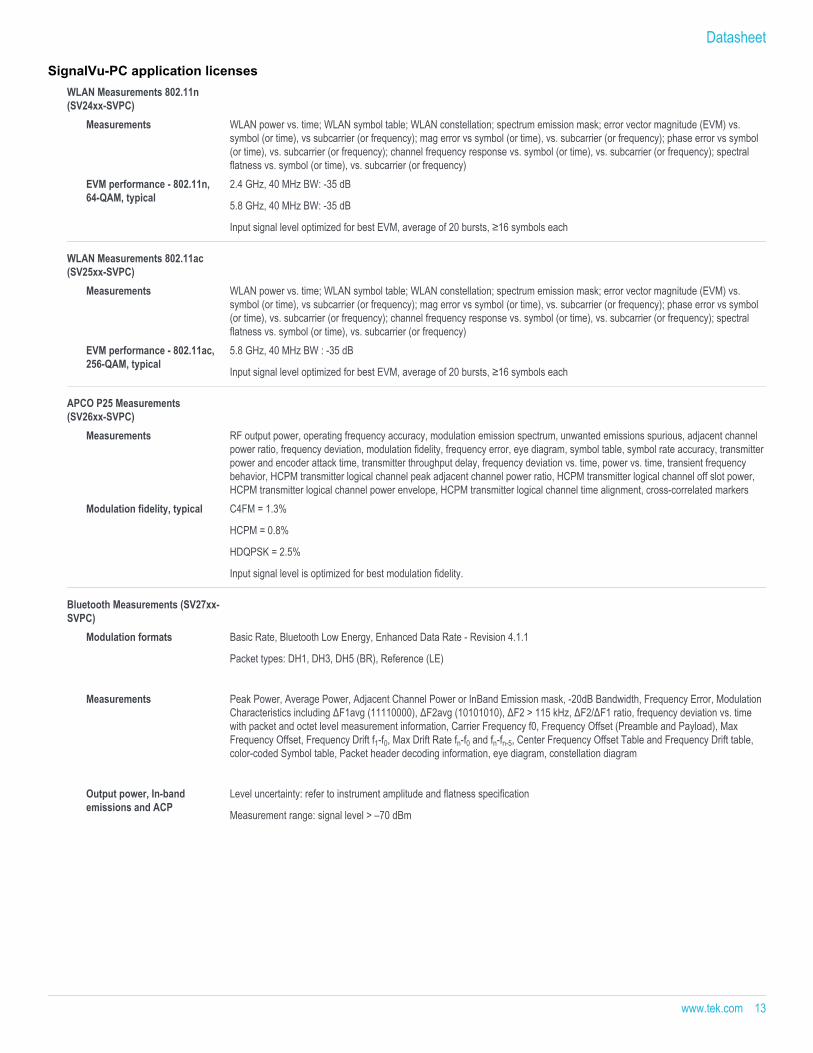
WLAN Measurements 802.11n(SV24xx-SVPC)
Measurements WLAN power vs. time; WLAN symbol table; WLAN constellation; spectrum emission mask; error vector magnitude (EVM) vs.symbol (or time), vs subcarrier (or frequency); mag error vs symbol (or time), vs. subcarrier (or frequency); phase error vs symbol(or time), vs. subcarrier (or frequency); channel frequency response vs. symbol (or time), vs. subcarrier (or frequency); spectralflatness vs. symbol (or time), vs. subcarrier (or frequency)
EVM performance - 802.11n,64-QAM, typical
2.4 GHz, 40 MHz BW: -35 dB
5.8 GHz, 40 MHz BW: -35 dB
Input signal level optimized for best EVM, average of 20 bursts, ≥16 symbols each
WLAN Measurements 802.11ac(SV25xx-SVPC)
Measurements WLAN power vs. time; WLAN symbol table; WLAN constellation; spectrum emission mask; error vector magnitude (EVM) vs.symbol (or time), vs subcarrier (or frequency); mag error vs symbol (or time), vs. subcarrier (or frequency); phase error vs symbol(or time), vs. subcarrier (or frequency); channel frequency response vs. symbol (or time), vs. subcarrier (or frequency); spectralflatness vs. symbol (or time), vs. subcarrier (or frequency)
EVM performance - 802.11ac,256-QAM, typical
5.8 GHz, 40 MHz BW : -35 dB
Input signal level optimized for best EVM, average of 20 bursts, ≥16 symbols each
APCO P25 Measurements(SV26xx-SVPC)
Measurements RF output power, operating frequency accuracy, modulation emission spectrum, unwanted emissions spurious, adjacent channelpower ratio, frequency deviation, modulation fidelity, frequency error, eye diagram, symbol table, symbol rate accuracy, transmitterpower and encoder attack time, transmitter throughput delay, frequency deviation vs. time, power vs. time, transient frequencybehavior, HCPM transmitter logical channel peak adjacent channel power ratio, HCPM transmitter logical channel off slot power,HCPM transmitter logical channel power envelope, HCPM transmitter logical channel time alignment, cross-correlated markers
Modulation fidelity, typical C4FM = 1.3%
HCPM = 0.8%
HDQPSK = 2.5%
Input signal level is optimized for best modulation fidelity.
Bluetooth Measurements (SV27xx-SVPC)
Modulation formats Basic Rate, Bluetooth Low Energy, Enhanced Data Rate - Revision 4.1.1
Packet types: DH1, DH3, DH5 (BR), Reference (LE)
Measurements Peak Power, Average Power, Adjacent Channel Power or InBand Emission mask, -20dB Bandwidth, Frequency Error, Modulation
Characteristics including ΔF1avg (11110000), ΔF2avg (10101010), ΔF2 > 115 kHz, ΔF2/ΔF1 ratio, frequency deviation vs. timewith packet and octet level measurement information, Carrier Frequency f0, Frequency Offset (Preamble and Payload), MaxFrequency Offset, Frequency Drift f1-f0, Max Drift Rate fn-f0 and fn-fn-5, Center Frequency Offset Table and Frequency Drift table,color-coded Symbol table, Packet header decoding information, eye diagram, constellation diagram
Output power, In-bandemissions and ACP
Level uncertainty: refer to instrument amplitude and flatness specification
Measurement range: signal level > –70 dBm
Datasheet
SignalVu-PC application licenses
www.tek.com 13

Modulation characteristics Deviation range: ±280 kHz
Deviation uncertainty (at 0 dBm)
2 kHz + instrument frequency uncertainty (basic rate)
3 kHz + instrument frequency uncertainty (low energy)
Measurement range: Nominal channel frequency ±100 kHz
Initial Carrier FrequencyTolerance (ICFT)
Measurement uncertainty (at 0 dBm): <1 kHz + instrument frequency uncertainty
Measurement range: Nominal channel frequency ±100 kHz
Carrier Frequency Drift Measurement uncertainty: <2 kHz + instrument frequency uncertainty
Measurement range: Nominal channel frequency ±100 kHz
LTE Downlink RF measurements(SV28xx-SVPC)
Standard Supported 3GPP TS 36.141 Version 12.5 Frame Format supported FDD and TDDMeasurements and DisplaysSupported
Adjacent Channel Leakage Ratio (ACLR), Spectrum Emission Mask (SEM), Channel Power, Occupied Bandwidth, Power vs. Timeshowing Transmitter OFF power for TDD signals and LTE constellation diagram for Primary Synchronization Signal, SecondarySynchronization Signal with Cell ID, Group ID, Sector ID and Frequency Error.
ACLR with E-UTRA bands(Nominal, with NoiseCorrection)
1st Adjacent Channel 65 dB (RSA306)
2nd Adjacent Channel 66 dB (RSA306)
Mapping (MAPxx-SVPC)Supported map types Pitney Bowes MapInfo (*.mif), Bitmap (*.bmp), Open Street Maps (.osm)Saved measurement results Measurement data files (exported results)Map file used for themeasurements
Google Earth KMZ file
Recallable results files (traceand setup files)
MapInfo-compatible MIF/MID files
Playback of recorded signals(SV56xx-SVPC)
Playback file type R3F recorded by RSA306Recorded file bandwidth 40 MHzFile playback controls General: Play, stop, exit playback
Location: Begin/end points of playback settable from 0-100%
Skip: Defined skip size from 73 μs up to 99% of file size
Live rate: Plays back at 1:1 rate to recording time
Loop control: Play once, or loop continuouslyMemory requirement Recording of signals requires storage with write rates of 300 MB/sec. Playback of recorded files at live rates requires storage with
read rates of 300 MB/sec.
RSA306 USB Spectrum Analyzer
SignalVu-PC application licenses
14 www.tek.com

Inputs, outputs, interfaces, power consumption
RF input Type N, female
External frequency reference input SMA, female
Trigger/sync input SMA, female
Status indicator LED, dual color red/green
USB device port USB 3.0 - Micro-B
Power consumption Per USB 3.0 SuperSpeed requirements: 5.0 V, ≤ 900 mA (nominal)
Physical characteristics
DimensionsHeight 30.5 mm (1.2 in)Width 190.5 mm (7.5 in)Depth 127 mm (5 in)
Weight 0.59 kg (1.3 lbs)
Regulatory
Safety UL61010-1, CAN/CSA-22.2 No.61010-1, EN61010-1, IEC61010-1
Regional certifications Europe: EN61326
Australia/New Zealand: AS/NZS 2064
EMC emissions EN61000-3-2, EN61000-3-3, EN61326-2-1
EMC immunity EN61326–1/2, IEC61000-4-2/3/4/5/6/8/11
Environmental performance
TemperatureOperating -10 °C to +55 °C (+14 °F to +131 °F)Nonoperating -51 °C to +71 °C (-60 °F to +160 °F)
Humidity (operating) 5% to 75% ±5% relative humidity (RH) from +30 °C to +40 °C (+86 °F to 104 °F)
5% to 45% RH above +40 °C to +55 °C (+86 °F to +131 °F)
AltitudeOperating Up to 9,144 meters (30,000 feet)Nonoperating 15,240 meters (50,000 feet)
DynamicsMechanical shock, operating Half-sine mechanical shocks, 30 g peak amplitude, 11 μs duration, three drops in each direction of each axis (18 total)Random vibration,nonoperating
0.030 g2/Hz, 10-500 Hz, 30 minutes per axis, three axes (90 minutes total)
Datasheet
www.tek.com 15
Handling and transitBench handling, operating Per MIL-PRF-28800F Class 2 operating: Rotational-edge-drops of appropriate edges on appropriate sides of the equipmentTransit drop, nonoperating Per MIL-PRF-28800F Class 2 nonoperating: Transit drops onto six faces and four corners of the equipment, from a height of
30 cm (11.8 in.) for a total of 10 impacts
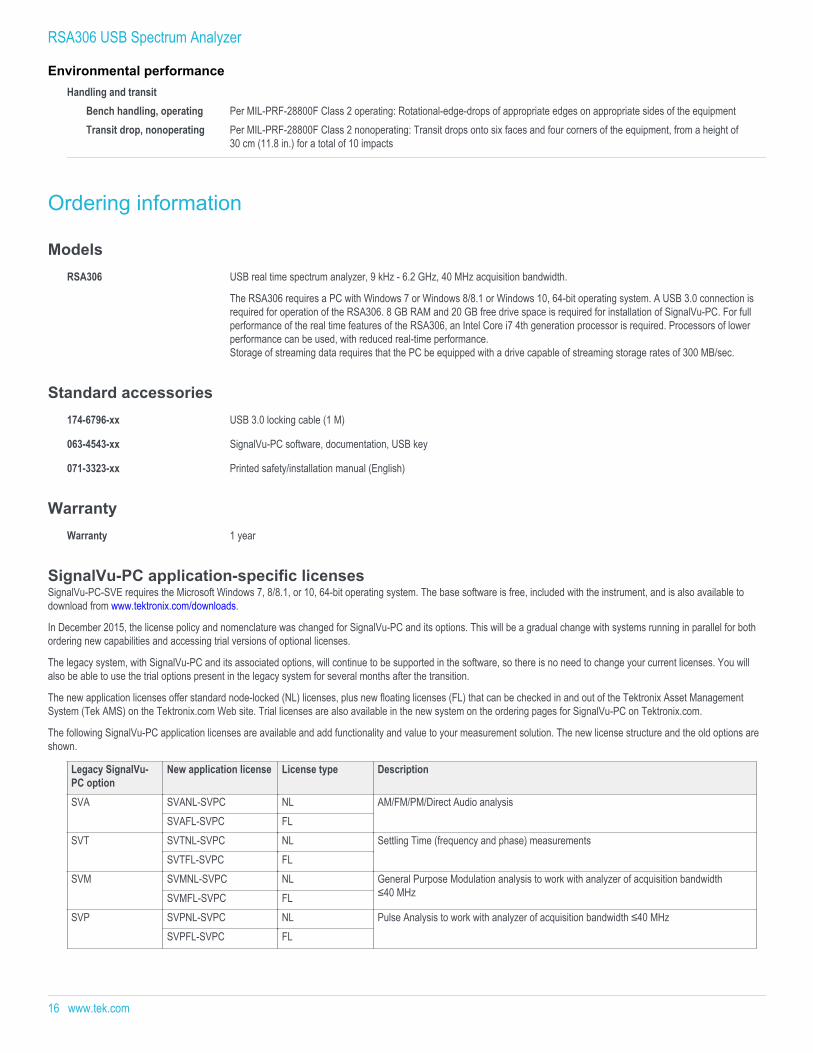
Ordering information
ModelsRSA306 USB real time spectrum analyzer, 9 kHz - 6.2 GHz, 40 MHz acquisition bandwidth.
The RSA306 requires a PC with Windows 7 or Windows 8/8.1 or Windows 10, 64-bit operating system. A USB 3.0 connection isrequired for operation of the RSA306. 8 GB RAM and 20 GB free drive space is required for installation of SignalVu-PC. For fullperformance of the real time features of the RSA306, an Intel Core i7 4th generation processor is required. Processors of lowerperformance can be used, with reduced real-time performance.Storage of streaming data requires that the PC be equipped with a drive capable of streaming storage rates of 300 MB/sec.
Standard accessories174-6796-xx USB 3.0 locking cable (1 M)
063-4543-xx SignalVu-PC software, documentation, USB key
071-3323-xx Printed safety/installation manual (English)
WarrantyWarranty 1 year
SignalVu-PC application-specific licensesSignalVu-PC-SVE requires the Microsoft Windows 7, 8/8.1, or 10, 64-bit operating system. The base software is free, included with the instrument, and is also available todownload from www.tektronix.com/downloads.
In December 2015, the license policy and nomenclature was changed for SignalVu-PC and its options. This will be a gradual change with systems running in parallel for bothordering new capabilities and accessing trial versions of optional licenses.
The legacy system, with SignalVu-PC and its associated options, will continue to be supported in the software, so there is no need to change your current licenses. You willalso be able to use the trial options present in the legacy system for several months after the transition.
The new application licenses offer standard node-locked (NL) licenses, plus new floating licenses (FL) that can be checked in and out of the Tektronix Asset ManagementSystem (Tek AMS) on the Tektronix.com Web site. Trial licenses are also available in the new system on the ordering pages for SignalVu-PC on Tektronix.com.
The following SignalVu-PC application licenses are available and add functionality and value to your measurement solution. The new license structure and the old options areshown.
Legacy SignalVu-PC option
New application license License type Description
SVA SVANL-SVPC NL AM/FM/PM/Direct Audio analysisSVAFL-SVPC FL
SVT SVTNL-SVPC NL Settling Time (frequency and phase) measurementsSVTFL-SVPC FL
SVM SVMNL-SVPC NL General Purpose Modulation analysis to work with analyzer of acquisition bandwidth≤40 MHzSVMFL-SVPC FL
SVP SVPNL-SVPC NL Pulse Analysis to work with analyzer of acquisition bandwidth ≤40 MHzSVPFL-SVPC FL
RSA306 USB Spectrum Analyzer
Environmental performance
16 www.tek.com

Legacy SignalVu-PC option
New application license License type Description
SVO SVONL-SVPC NL Flexible OFD analysisSVOFL-SVPC FL
SV23 SV23NL-SVPC NL WLAN 802.11a/b/g/j/p measurement to work with analyzerSV23FL-SVPC FL
SV24 SV24NL-SVPC NL WLAN 802.11n measurement (requires SV23)SV24FL-SVPC FL
SV25 SV25NL-SVPC NL WLAN 802.11ac measurement to work with analyzer of acquisition bandwidth ≤40 MHz(requires SV23 and SV24)SV25FL-SVPC FL
SV26 SV26NL-SVPC NL APCO P25 measurementSV26FL-SVPC FL
SV27 SV27NL-SVPC NL Bluetooth measurement to work with analyzer of acquisition bandwidth ≤40 MHzSV27FL-SVPC FL
MAP MAPNL-SVPC NL MappingMAPFL-SVPC FL
SV56 SV56NL-SVPC NL Playback of recorded filesSV56FL-SVPC FL
CON CONNL-SVPC NL SignalVu-PC live link to the RSA306 spectrum analyzer and MDO4000B/C series mixed-domain oscilloscopesCONFL-SVPC FL
SV2C SV2CNL-SVPC NL WLAN 802.11a/b/g/j/p/n/ac and live link to MDO4000B to work with analyzer of acquisitionbandwidth ≤40 MHzSV2CFL-SVPC FL
SV28 SV28NL-SVPC NL LTE Downlink RF measurement to work with analyzer of acquisition bandwidth ≤40 MHzSV28FL-SVPC FL
SV54 SV54NL-SVPC NL Signal survey and classificationSV54FL-SVPC FL
SignalVu-PC EDU EDUFL-SVPC FL Education-only version of all modules for SignalVu-PC
Opt. C3 Calibration Service 3 Years
Opt. C5 Calibration Service 5 Years
Opt. D1 Calibration Data Report
Opt. D3 Calibration Data Report 3 Years (with Opt. C3)
Opt. D5 Calibration Data Report 5 Years (with Opt. C5)
Opt. R3 Repair Service 3 Years (including warranty)
Opt. R5 Repair Service 5 Years (including warranty)
Datasheet
www.tek.com 17

RSA300CASE Soft case with shoulder-strap
RSA300TRANSIT Hard-sided transit case for RSA300 with room for USB cable and small accessories. Pelican model Stormcase iM2100
RSA306RACK Rackmount with slots for two RSA306. 19 inch rack with cover for unused slot
119-6609-xx BNC whip antenna
DF-A0047 Directional Antenna, 20-8500 MHz, with electronic compass and preamp (Search for DF-A0047 on www.Tektronix.com foradditional information.)
DF-A0047-01 Frequency range extension for DF-A0047 directional antenna, 9 kHz-20 MHz Upgrade
DF-A0047-C1 Includes DF-A0047 antenna and DF-A0047-01 extension
016210700 Transit case for DF-A0047 and DF-A0047-01
103-0045-xx N-BNC adapter
119-6594-xx Beam antenna, 824 MHz to 896 MHz
119-6595-xx Beam antenna, 896 MHz to 960 MHz
119-6596-xx Beam antenna, 1710 MHz to 1880 MHz
119-6597-xx Beam antenna, 1850 MHz to 1990 MHz
119-6970-xx Magnetic mount antenna, 824 MHz to 2170 MHz (requires adapter 103-0449-00)
119-7246-xx Pre-filter, general purpose, 824 MHz to 2500 MHz, Type-N (f) connector
119-7426-xx Pre-filter, general purpose, 2400 MHz to 6200 MHz, Type-N (f) connector
012-0482-xx Cable, 50 Ω, BNC (m) 3 foot (91 cm)
174-4977-xx Cable, 50 Ω, straight Type-N (m) and angled Type-N (m) connector, 1.6 foot (50 cm)
174-5002-xx Cable, 50 Ω, Type-N (m) to Type-N (m) connector, 3 foot (91 cm)
119-4146-xx EMCO E/H-field probes
10 dB 2W pad, SMA M-F Available from Pasternack http://www.pasternack.com/10db-fixed-sma-male-sma-female-2-watts-attenuator-pe7045-10-p.aspx
E/H field probes, lower costalternative
Available from Beehive www. http://beehive-electronics.com/
Tektronix is registered to ISO 9001 and ISO 14001 by SRI Quality System Registrar.
Product(s) complies with IEEE Standard 488.1-1987, RS-232-C, and with Tektronix Standard Codes and Formats.
Product Area Assessed: The planning, design/development and manufacture of electronic Test and Measurement instruments.
Bluetooth® Bluetooth is a registered trademark of Bluetooth SIG, Inc.
LTE is a trademark of ETSI.
RSA306 USB Spectrum Analyzer
18 www.tek.com

Datasheet
www.tek.com 19

RSA306 USB Spectrum Analyzer
ASEAN / Australasia (65) 6356 3900 Austria 00800 2255 4835* Balkans, Israel, South Africa and other ISE Countries +41 52 675 3777 Belgium 00800 2255 4835* Brazil +55 (11) 3759 7627 Canada 1 800 833 9200 Central East Europe and the Baltics +41 52 675 3777 Central Europe & Greece +41 52 675 3777 Denmark +45 80 88 1401 Finland +41 52 675 3777 France 00800 2255 4835* Germany 00800 2255 4835*Hong Kong 400 820 5835 India 000 800 650 1835 Italy 00800 2255 4835*Japan 81 (3) 6714 3010 Luxembourg +41 52 675 3777 Mexico, Central/South America & Caribbean 52 (55) 56 04 50 90 Middle East, Asia, and North Africa +41 52 675 3777 The Netherlands 00800 2255 4835* Norway 800 16098 People's Republic of China 400 820 5835 Poland +41 52 675 3777 Portugal 80 08 12370 Republic of Korea +822 6917 5084, 822 6917 5080 Russia & CIS +7 (495) 6647564 South Africa +41 52 675 3777 Spain 00800 2255 4835* Sweden 00800 2255 4835* Switzerland 00800 2255 4835*Taiwan 886 (2) 2656 6688 United Kingdom & Ireland 00800 2255 4835* USA 1 800 833 9200
* European toll-free number. If not accessible, call: +41 52 675 3777
For Further Information. Tektronix maintains a comprehensive, constantly expanding collection of application notes, technical briefs and other resources to help engineers working on the cutting edge of technology. Please visit www.tek.com.
Copyright © Tektronix, Inc. All rights reserved. Tektronix products are covered by U.S. and foreign patents, issued and pending. Information in this publication supersedes that in all previously published material. Specification andprice change privileges reserved. TEKTRONIX and TEK are registered trademarks of Tektronix, Inc. All other trade names referenced are the service marks, trademarks, or registered trademarks of their respective companies.
08 Feb 2016 37W-30767-6
www.tek.com