South Korea - Deloitte US · PDF fileMarket opportunities for Queensland agribusiness from...
31
Market opportunities for Queensland agribusiness from FTAs with China, Japan and South Korea South Korea
Transcript of South Korea - Deloitte US · PDF fileMarket opportunities for Queensland agribusiness from...
Market opportunities for Queensland agribusiness from FTAs with China, Japan and South Korea
South Korea
Scope
2
Australia recently signed Free Trade Agreements (FTAs) with China (June 2015), Japan (July 2014) and South Korea (April 2014). These agreements substantially reduce or remove tariffs on a range of Australian food and agribusiness export products including beef, grains, horticulture, seafood and processed foods, which together represent a large share of Queensland’s total agricultural production and exports. This document provides an overview of Stage 1 of a two stage project. The overarching objective of the whole project is to identify where there are the strongest opportunities arising from the FTAs and what barriers exist to realising these opportunities. Principally, the focus of identifying opportunities has been on the four broad agribusiness sectors of beef, grains, horticulture and seafood/aquaculture, including both unprocessed and processed products. The purpose of Stage 1 is to take a ‘data view’ on opportunities from the three FTAs and undertake consultations with Queensland agribusiness stakeholders on opportunities and barriers. Stage 2 will investigate, in more detail, the specific opportunities identified and focus on in-market consultations in China, Japan and South Korea which are expected to lead to the generation of trade and investment leads.
Overview 4
• Food consumption 5
• Queensland’s agricultural exports 6
• Key Queensland exports 7
Competition in South Korean markets 9
• Market share 10
• Competitiveness 12
Food demand and supply in South Korea 14
• Beef consumption 15
• Beef food balance 16
• Grain consumption 17
• Grain food balance 18
• Horticulture consumption 19
• Horticulture food balance 20
• Seafood/aquaculture consumption 21
• Seafood/aquaculture food balance 22
Changes from KAFTA 23
• Tariff rates 24
Opportunity map 25
Non-tariff considerations 27
Implications 28
Appendix 29
• Schedule of tariff reductions 30
Contents
3
This document presents opportunities and challenges for Queensland agriculture arising from the Korea-Australia Free Trade Agreement (KAFTA). The opportunities are derived after a detailed analysis of Queensland's relative competitiveness in the market, review of tariff reductions for key commodities and assessment of key production and consumption trends affecting demand for agriculture products.

Deloitte Access Economics Pty Ltd © 2016
Overview
South Korea faces a range of challenges, from its aging population to its lagging productivity in the service sector and its position in a geopolitically unstable region. On the back of this, economic growth is expected to remain subdued in 2016 as South Korean exports remain weak, household debt levels are high and consumers face hurdles such as youth unemployment and the impacts of an aging population with high healthcare expenditure (and therefore limited discretionary spending).1
Overall, as the population continues to age, South Korea’s projected growth in food consumption is expected to be limited. This limitation is also due to already high incomes and per person food consumption, and modest future income growth. As part of the demographic shift, demand for healthy, easy-to-cook and semi-processed food is anticipated to grow.
South Korea experienced a rapid shift in diets beginning in the 1970s, as the proportion of calories consumed from grains dropped. Due to continued economic, political and demographic shifts, food products most sought after by 2050 are expected to be vegetables, fruit, meat, dairy products, cereals and fish commodity groups.2
In line with these demographic shifts, South Koreans have revived a consumer preference for all things foreign. This preference is associated with a shift away from previously ‘patriotic shopping’ and historically high tariffs, towards online shopping and the increased ease of importing inexpensive products.3
Despite South Korea’s food consumption growth being projected to be limited, as South Korea has smaller land endowments per person and agricultural output growth has slowed in recent decades, continued large net imports are likely. This is good news for Australian agricultural exporters.
1 Euromonitor International, 2015, Consumer Lifestyles in South Korea
2 ABARES, 2013, What Asia wants: Long-term food consumption trends in Asia
3 The Economist, 2015, South Korean Consumers Won Over
4

Deloitte Access Economics Pty Ltd © 2016
Food consumption Table 1.1 outlines the detail of South Korea’s daily food consumption per person. A typical South Korean’s protein consumption consists mainly of seafood and pork while a typical Australian’s protein consumption is predominantly comprised of poultry, beef and seafood.
Table 1.1: Top 10 categories of food consumption – South Korea
Source: National Geographic, What the world eats, 2011
Note: rank in square brackets (out of 22).
Chart 1.1: Fruit consumption – South Korea
5
South Korea
(grams per person per day)
Australia
(grams per person per day) Vegetables 607 [1] 262 [3] Rice 235 [2] 30 [15] Alcoholic beverages 205 [3] 289 [2] Fruits 184 [4] 258 [4] Seafood 159 [5] 70 [10] Wheat 142 [6] 191 [5] Sugar and sweeteners 99 [7] 127 [7] Pork 85 [8] 63 [12] Milk 72 [9] 630 [1] Miscellaneous 69 [10] 50 [14] Beef 40 [14] 111 [9]
32%
10%
5% 3% 10%
40%
Oranges, Mandarins
Lemons, Limes andproducts
Grapefruit and products
Citrus, Other
Bananas
Apples and products
Pineapples and products
Dates
Grapes and products (exclwine)
Fruits, Other
17%
2%
9%
29% 6%
11%
26%
South Korea Australia
Deloitte Access Economics Pty Ltd © 2016
Queensland’s agricultural exports
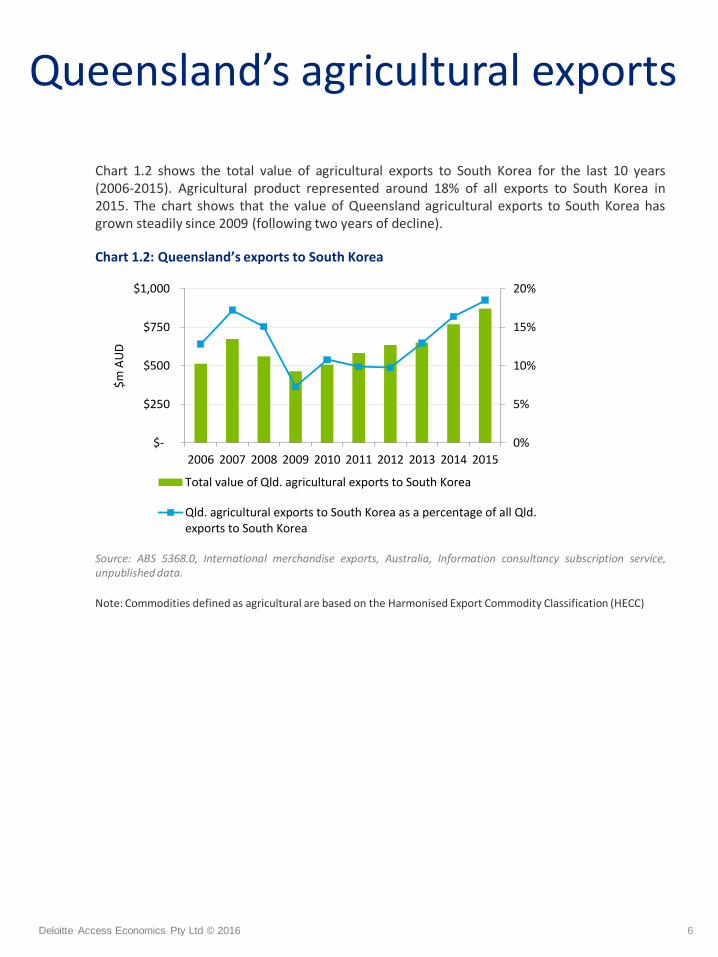
Chart 1.2 shows the total value of agricultural exports to South Korea for the last 10 years (2006-2015). Agricultural product represented around 18% of all exports to South Korea in 2015. The chart shows that the value of Queensland agricultural exports to South Korea has grown steadily since 2009 (following two years of decline).
Chart 1.2: Queensland’s exports to South Korea
Source: ABS 5368.0, International merchandise exports, Australia, Information consultancy subscription service, unpublished data.
Note: Commodities defined as agricultural are based on the Harmonised Export Commodity Classification (HECC)
6
0%
5%
10%
15%
20%
$-
$250
$500
$750
$1,000
2006 2007 2008 2009 2010 2011 2012 2013 2014 2015
$m
AU
D
Total value of Qld. agricultural exports to South Korea
Qld. agricultural exports to South Korea as a percentage of all Qld.exports to South Korea
Deloitte Access Economics Pty Ltd © 2016
Key Queensland exports
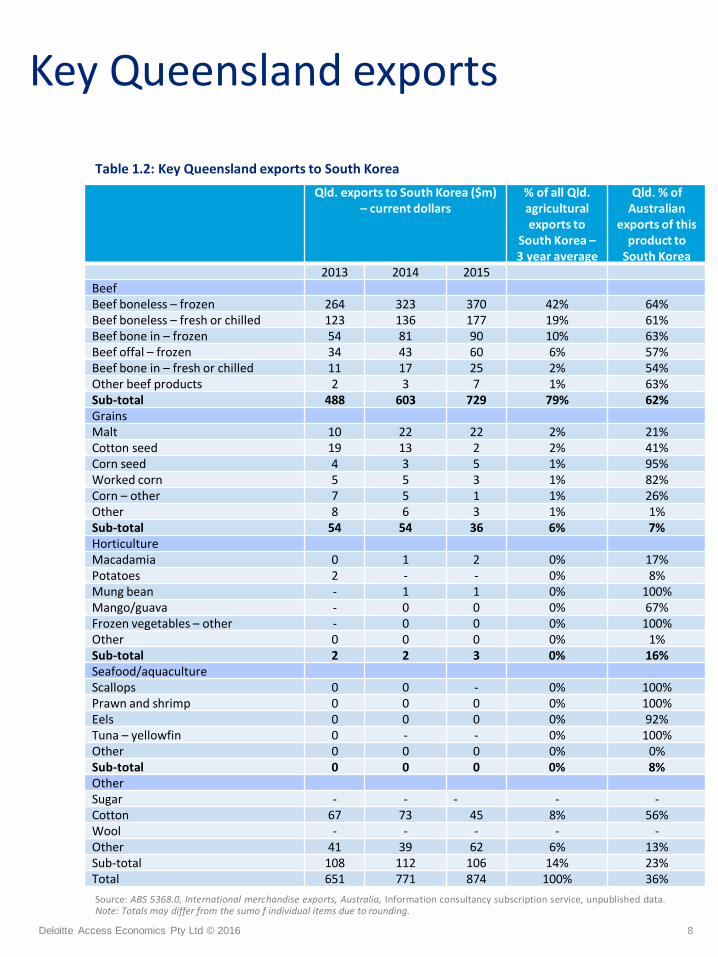
Table 1.2 provides more detail of Queensland exports to South Korea for the last three years. The table shows that beef products are by far the largest commodities by export value, together representing 79% of all Queensland agricultural exports to South Korea. Queensland beef exports also represent the majority (62%) of all Australia’s beef exports to South Korea, showing Queensland to be the dominant exporter of beef amongst Australian states.
Grains and related products, in particular malt, cotton seed, and corn products represent 6% of all agricultural exports.
Horticulture and seafood/aquaculture are small by comparison. Macadamia, potatoes and mung beans are the only commodities to have exports greater than $1 million in any given year (for the period of our analysis).
Cotton exports to South Korea also make a significant contribution (8% of all Australian exports to South Korea).
7
Deloitte Access Economics Pty Ltd © 2016
Key Queensland exports
Table 1.2: Key Queensland exports to South Korea
S
Source: ABS 5368.0, International merchandise exports, Australia, Information consultancy subscription service, unpublished data. Note: Totals may differ from the sumo f individual items due to rounding.
8
Qld. exports to South Korea ($m) – current dollars
% of all Qld. agricultural exports to
South Korea – 3 year average
Qld. % of Australian
exports of this product to
South Korea 2013 2014 2015
Beef Beef boneless – frozen 264 323 370 42% 64% Beef boneless – fresh or chilled 123 136 177 19% 61% Beef bone in – frozen 54 81 90 10% 63% Beef offal – frozen 34 43 60 6% 57% Beef bone in – fresh or chilled 11 17 25 2% 54% Other beef products 2 3 7 1% 63% Sub-total 488 603 729 79% 62% Grains Malt 10 22 22 2% 21% Cotton seed 19 13 2 2% 41% Corn seed 4 3 5 1% 95% Worked corn 5 5 3 1% 82% Corn – other 7 5 1 1% 26% Other 8 6 3 1% 1% Sub-total 54 54 36 6% 7% Horticulture Macadamia 0 1 2 0% 17% Potatoes 2 - - 0% 8% Mung bean - 1 1 0% 100% Mango/guava - 0 0 0% 67% Frozen vegetables – other - 0 0 0% 100% Other 0 0 0 0% 1% Sub-total 2 2 3 0% 16% Seafood/aquaculture Scallops 0 0 - 0% 100% Prawn and shrimp 0 0 0 0% 100% Eels 0 0 0 0% 92% Tuna – yellowfin 0 - - 0% 100% Other 0 0 0 0% 0% Sub-total 0 0 0 0% 8% Other Sugar - - - - - Cotton 67 73 45 8% 56% Wool - - - - - Other 41 39 62 6% 13% Sub-total 108 112 106 14% 23% Total 651 771 874 100% 36%
Deloitte Access Economics Pty Ltd © 2016 9
Competition in South Korean markets
This section presents a picture on the competitiveness of Queensland’s agricultural products in the South Korean market through an analysis of import market share and the factors that contribute to agricultural competitiveness.
Deloitte Access Economics Pty Ltd © 2016
Market share
10
Market share is one indicator of a country’s competitiveness. Table 1.3 shows the market share of major suppliers to South Korea for each of the four key agricultural categories. This is compared to Australia’s market share position and also shows Queensland’s market share by calculating its share of Australian exports to South Korea.
The table shows that Australia is clearly the market leader in terms of beef with a market share of 51% (of which Queensland has 62% of this share). Queensland’s main competitors in this market are the USA with 41% market share and New Zealand with 7% market share.
There are four key suppliers for grain, of which Australia is one. The other three are USA, Brazil and China, with a combined market share of 70%. Australia has 11% market share and is ranked fourth overall. Queensland, however, has only a relatively small proportion (7%) of this.
For horticulture, there are two dominant market players, the USA and China, together representing 70% of all horticultural imports. Australia is a minor player (ranking tenth overall) with Queensland representing only 16% of Australia’s exports.
For seafood/aquaculture, there are four main players making up 77% of imports. Australia is an extremely small player in this category and Queensland represents a small proportion (8%) of Australia’s exports.

Deloitte Access Economics Pty Ltd © 2016
Market share
11
Table 1.3: South Korea’s imports of major QLD-South Korea exports
Source: UN Comtrade Database 2015.
% of South Korea imports
(total 2012 to 2014 by value)
Cumulative percentage
Beef USA 41% 41% New Zealand 7% 48% Canada 1% 49% Mexico 0% 49% Uruguay 0% 49% Other 0% 49% Australia 51% - ranks 1st 100% Queensland 62% of Australian exports
(32% market share)
Grains USA 33% 33% Brazil 15% 48% China 11% 59% Argentina 7% 65% India 5% 71% Other 19% 89% Australia 11% - ranks 4th 100% Queensland 7% of Australian exports
(0.8% market share)
Horticulture USA 40% 40% China 30% 70% Chile 9% 79% Philippines 8% 87% Vietnam 4% 91% Other 8% 99% Australia 1% - ranks 10th 100% Queensland 16% of Australian exports
(0.02% market share)
Seafood/aquaculture China 31% 31% Russia 26% 57% Vietnam 11% 67% USA 10% 77% Norway 3% 80% Other 20% 100% Australia 0% 100% Queensland 8% of Australia’s exports
(0% market share)
Deloitte Access Economics Pty Ltd © 2016
Competitiveness
12
While market share might indicate relative competitiveness for certain commodities, it does tend to reflect historical factors and, as such, does not always provide the present day picture of competitiveness nor the factors that contribute to future competitiveness.
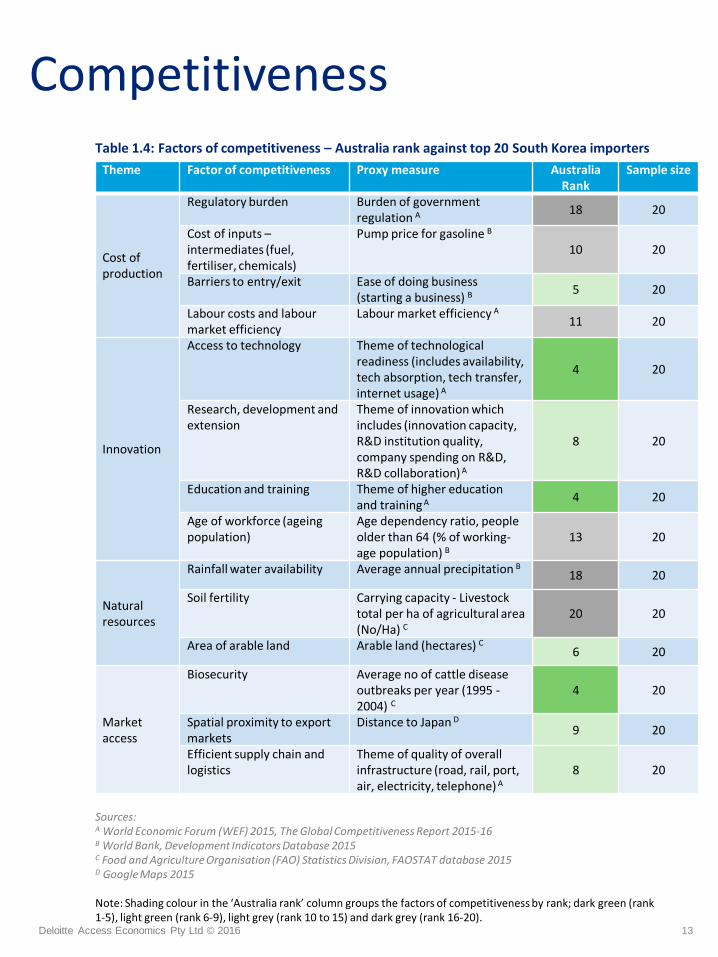
Table 1.4 compares Australia against its key competitors in the South Korean market (top 20 competitors by value) against 14 key factors that contribute to agricultural competitiveness. The table shows that Australia, in general, compares well in areas of innovation (i.e. access to technology, research and development and education) and in terms of land availability. It also is strong in market access, in particular biosecurity. However Australia does not rank as well in terms of the cost of production metrics, particularly in relation to regulatory burden and labour market efficiency, or in rainfall or soil fertility (noting that in some areas of Australia soil fertility is considerably higher than the average). However, it should be noted that, given Australia’s sheer size and diversity, there are pockets of high soil fertility and rainfall meaning that certain regions may score quite highly by comparison.
In terms of Australia’s low ranking on regulatory burden, this can be seen from both a positive and negative angle. There is a level of ‘good and necessary’ regulation to ensure Australia’s reputation for high quality and safe food. However, regulation often crosses a line and becomes a ‘burden’ due to lack of coordination between agencies, inadequate assessment of the costs and benefits and the cumulative effect of regulations.
In terms of Australia’s generally lower fertility soils, and its broadacre production systems, this actually presents as an opportunity for intensification of production systems and productivity increases. Australia’s opportunity here is probably greater than what is possible in other countries, where even a small increase in carrying capacity (per unit area) gives rise to substantial production gains for the industry.
Queensland’s advantage versus competitors is similar to Australia for most of these metrics. In relation to spatial proximity, area of arable land and average rainfall it is likely to rank slightly better than Australia. However, rainfall variability and drought across Australia will continue to disadvantage Australia as it creates additional complications and cost to ensure security of supply and the honouring of any contracts entered into.
Deloitte Access Economics Pty Ltd © 2016
Competitiveness
13
Table 1.4: Factors of competitiveness – Australia rank against top 20 South Korea importers
Sources: A World Economic Forum (WEF) 2015, The Global Competitiveness Report 2015-16 B World Bank, Development Indicators Database 2015 C Food and Agriculture Organisation (FAO) Statistics Division, FAOSTAT database 2015 D Google Maps 2015 Note: Shading colour in the ‘Australia rank’ column groups the factors of competitiveness by rank; dark green (rank 1-5), light green (rank 6-9), light grey (rank 10 to 15) and dark grey (rank 16-20).
Theme Factor of competitiveness Proxy measure Australia Rank
Sample size
Cost of production
Regulatory burden Burden of government regulation A
18 20
Cost of inputs – intermediates (fuel, fertiliser, chemicals)
Pump price for gasoline B 10 20
Barriers to entry/exit Ease of doing business (starting a business) B
5 20
Labour costs and labour market efficiency
Labour market efficiency A 11 20
Innovation
Access to technology Theme of technological readiness (includes availability, tech absorption, tech transfer, internet usage) A
4 20
Research, development and extension
Theme of innovation which includes (innovation capacity, R&D institution quality, company spending on R&D, R&D collaboration) A
8 20
Education and training Theme of higher education and training A
4 20
Age of workforce (ageing population)
Age dependency ratio, people older than 64 (% of working-age population) B
13 20
Natural resources
Rainfall water availability Average annual precipitation B 18 20
Soil fertility Carrying capacity - Livestock total per ha of agricultural area (No/Ha) C
20 20
Area of arable land Arable land (hectares) C 6 20
Market access
Biosecurity Average no of cattle disease outbreaks per year (1995 - 2004) C
4 20
Spatial proximity to export markets
Distance to Japan D 9 20
Efficient supply chain and logistics
Theme of quality of overall infrastructure (road, rail, port, air, electricity, telephone) A
8 20
Deloitte Access Economics Pty Ltd © 2016
Food demand and supply in South Korea
For each of the four key areas of focus (beef, grains, horticulture and seafood/aquaculture) this section presents data on consumption trends (i.e. the current and future demand for food in South Korea) and the local South Korean production, imports and exports for each area (i.e. how this demand is supplied). This analysis gives a sense for how South Korea currently meets its food demand and how it is likely to meet future demand.
14

Deloitte Access Economics Pty Ltd © 2016
Beef consumption
Chart 1.2 shows that there has been strong growth in total and per capita consumption of beef in South Korea over the last decade. Per capita consumption in 2015 was 44% higher than 2006 levels, and total consumption 51% higher (due to population growth of around 5%).
Per capita consumption is now even higher in South Korea than Japan, but is still well below levels in Australia (31 kilograms per capita in 2015)4 and other developed western countries. While population growth is likely to slow in South Korea, it is projected to remain positive for much of the next 35 years,5 creating reasonable prospects for total consumption growth.
Chart 1.2: South Korea – Beef consumption
Source: United States Department of Agriculture (USDA) (2015) Production, Supply and Distribution Online, livestock dataset.
Note: Specifically, the data is for ‘Meat, Beef and Veal’
4United Nations, 2015, World Population Prospects 2015, Total Population – Both Sexes dataset; USDA, 2015, Production, Supply and Distribution Online, livestock dataset.
5United Nations, 2015, Probabilistic Population Projections based on the World Population Prospects: The 2015 Revision.
15
-
2
4
6
8
10
12
14
16
-
100
200
300
400
500
600
700
800
2006 2007 2008 2009 2010 2011 2012 2013 2014 2015
kilo
gram
s ca
rcas
s w
eigh
t eq
uiv
alen
t
'00
0 t
on
nes
car
cass
wei
ght
eq
uiv
alen
t
Total consumption - left axis Consumption per capita - right axis

Deloitte Access Economics Pty Ltd © 2016
Beef food balance
Chart 1.4 shows that while imports have consistently been greater than production of beef in South Korea, the relative size of imports and production has varied over the last decade. This is despite the fact that domestic consumption has been consistently growing over the period, suggesting South Korea’s capacity, or incentive, to satisfy demand through domestic production is limited, creating opportunities for exporting countries, including Australia.
In 2014, imports of beef into South Korea were worth $2.1 billion,6 over 50% of the value of Queensland production. South Korea’s domestic production is estimated to have been worth around $1.8 billion in the same year.
Chart 1.4: South Korea – beef food balance
Source: United States Department of Agriculture (USDA) (2015) Production, Supply and Distribution Online, livestock dataset.
Note: Specifically, the data is for ‘Meat, Beef and Veal’
6UN Comtrade Database.
16
0%
25%
50%
75%
100%
2006 2007 2008 2009 2010 2011 2012 2013 2014 2015
Production Exports Imports
Deloitte Access Economics Pty Ltd © 2016
Grain consumption
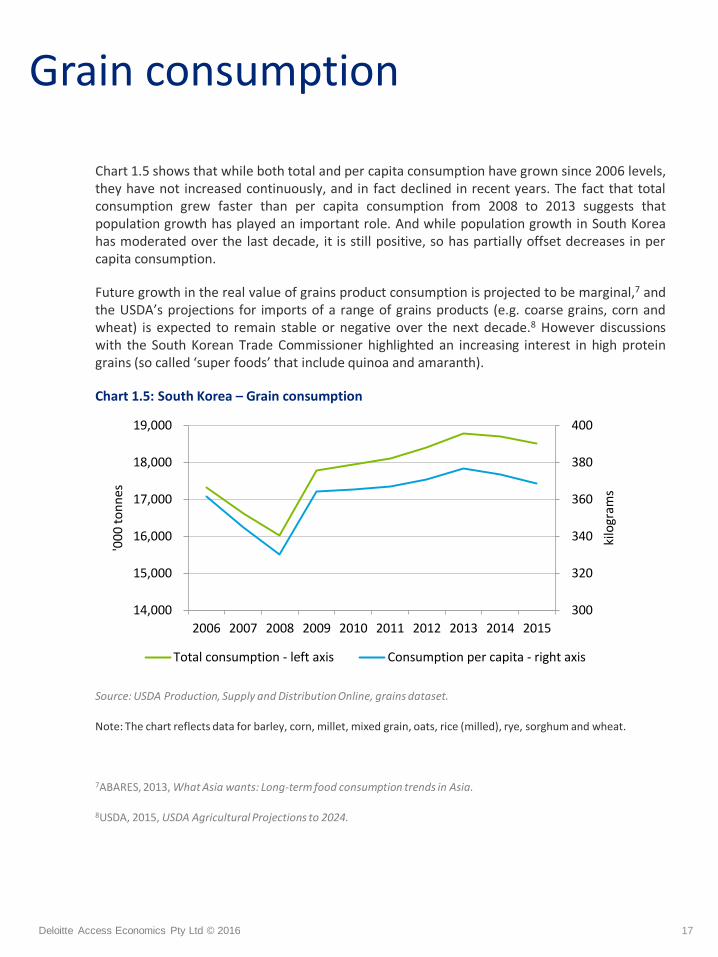
Chart 1.5 shows that while both total and per capita consumption have grown since 2006 levels, they have not increased continuously, and in fact declined in recent years. The fact that total consumption grew faster than per capita consumption from 2008 to 2013 suggests that population growth has played an important role. And while population growth in South Korea has moderated over the last decade, it is still positive, so has partially offset decreases in per capita consumption.
Future growth in the real value of grains product consumption is projected to be marginal,7 and the USDA’s projections for imports of a range of grains products (e.g. coarse grains, corn and wheat) is expected to remain stable or negative over the next decade.8 However discussions with the South Korean Trade Commissioner highlighted an increasing interest in high protein grains (so called ‘super foods’ that include quinoa and amaranth).
Chart 1.5: South Korea – Grain consumption
Source: USDA Production, Supply and Distribution Online, grains dataset.
Note: The chart reflects data for barley, corn, millet, mixed grain, oats, rice (milled), rye, sorghum and wheat.
7ABARES, 2013, What Asia wants: Long-term food consumption trends in Asia.
8USDA, 2015, USDA Agricultural Projections to 2024.
17
300
320
340
360
380
400
14,000
15,000
16,000
17,000
18,000
19,000
2006 2007 2008 2009 2010 2011 2012 2013 2014 2015
kilo
gram
s
'00
0 t
on
nes
Total consumption - left axis Consumption per capita - right axis
Deloitte Access Economics Pty Ltd © 2016
Grain food balance
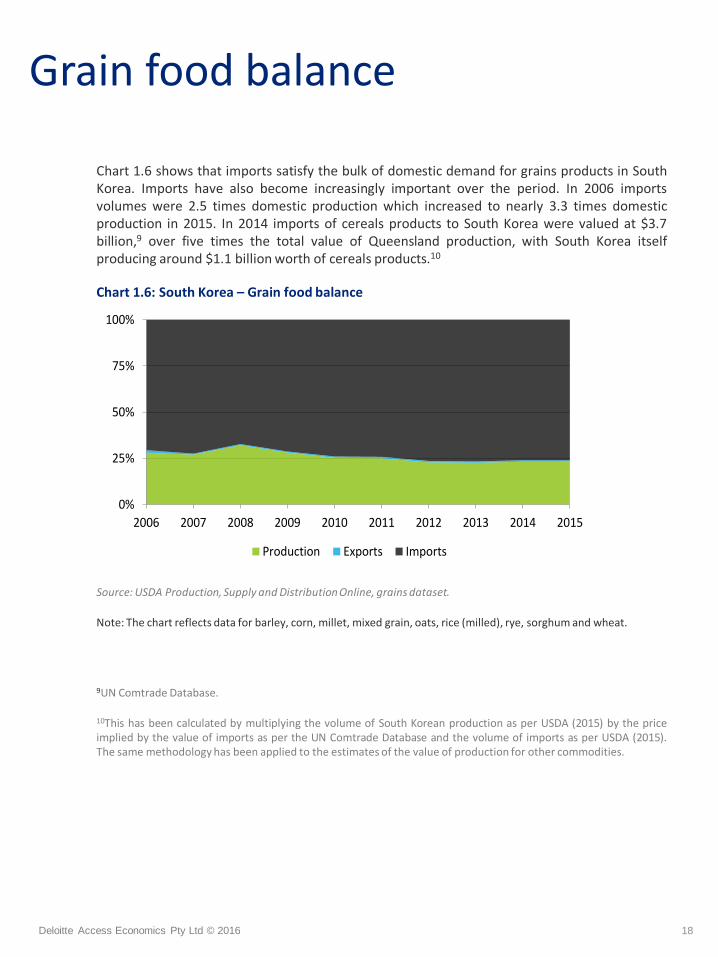
Chart 1.6 shows that imports satisfy the bulk of domestic demand for grains products in South Korea. Imports have also become increasingly important over the period. In 2006 imports volumes were 2.5 times domestic production which increased to nearly 3.3 times domestic production in 2015. In 2014 imports of cereals products to South Korea were valued at $3.7 billion,9 over five times the total value of Queensland production, with South Korea itself producing around $1.1 billion worth of cereals products.10
Chart 1.6: South Korea – Grain food balance
Source: USDA Production, Supply and Distribution Online, grains dataset.
Note: The chart reflects data for barley, corn, millet, mixed grain, oats, rice (milled), rye, sorghum and wheat.
9UN Comtrade Database.
10This has been calculated by multiplying the volume of South Korean production as per USDA (2015) by the price implied by the value of imports as per the UN Comtrade Database and the volume of imports as per USDA (2015). The same methodology has been applied to the estimates of the value of production for other commodities.
18
0%
25%
50%
75%
100%
2006 2007 2008 2009 2010 2011 2012 2013 2014 2015
Production Exports Imports
Deloitte Access Economics Pty Ltd © 2016
Horticulture consumption
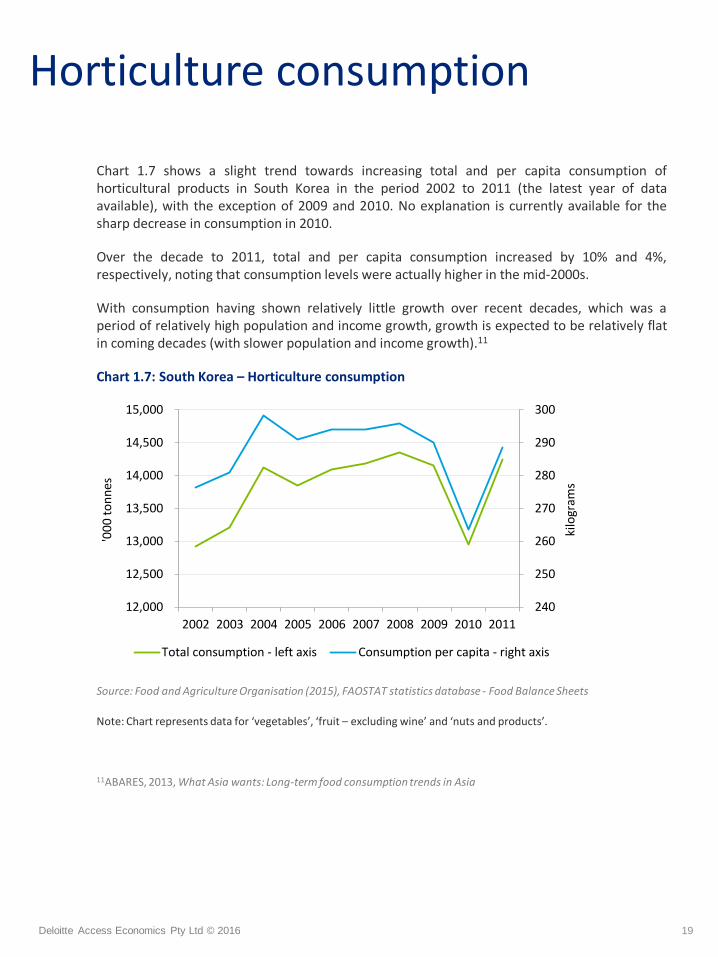
Chart 1.7 shows a slight trend towards increasing total and per capita consumption of horticultural products in South Korea in the period 2002 to 2011 (the latest year of data available), with the exception of 2009 and 2010. No explanation is currently available for the sharp decrease in consumption in 2010.
Over the decade to 2011, total and per capita consumption increased by 10% and 4%, respectively, noting that consumption levels were actually higher in the mid-2000s.
With consumption having shown relatively little growth over recent decades, which was a period of relatively high population and income growth, growth is expected to be relatively flat in coming decades (with slower population and income growth).11
Chart 1.7: South Korea – Horticulture consumption
Source: Food and Agriculture Organisation (2015), FAOSTAT statistics database - Food Balance Sheets
Note: Chart represents data for ‘vegetables’, ‘fruit – excluding wine’ and ‘nuts and products’.
11ABARES, 2013, What Asia wants: Long-term food consumption trends in Asia
19
240
250
260
270
280
290
300
12,000
12,500
13,000
13,500
14,000
14,500
15,000
2002 2003 2004 2005 2006 2007 2008 2009 2010 2011
kilo
gram
s
'00
0 t
on
nes
Total consumption - left axis Consumption per capita - right axis
Deloitte Access Economics Pty Ltd © 2016
Horticulture food balance
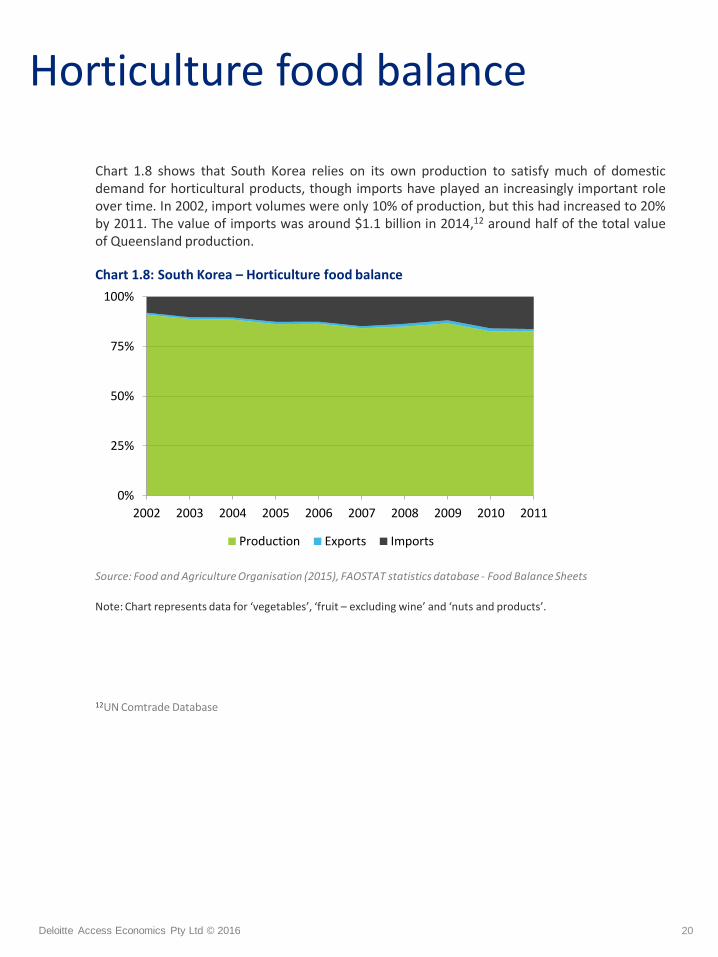
Chart 1.8 shows that South Korea relies on its own production to satisfy much of domestic demand for horticultural products, though imports have played an increasingly important role over time. In 2002, import volumes were only 10% of production, but this had increased to 20% by 2011. The value of imports was around $1.1 billion in 2014,12 around half of the total value of Queensland production.
Chart 1.8: South Korea – Horticulture food balance
Source: Food and Agriculture Organisation (2015), FAOSTAT statistics database - Food Balance Sheets
Note: Chart represents data for ‘vegetables’, ‘fruit – excluding wine’ and ‘nuts and products’.
12UN Comtrade Database
20
0%
25%
50%
75%
100%
2002 2003 2004 2005 2006 2007 2008 2009 2010 2011
Production Exports Imports
Deloitte Access Economics Pty Ltd © 2016
Seafood/aquaculture consumption
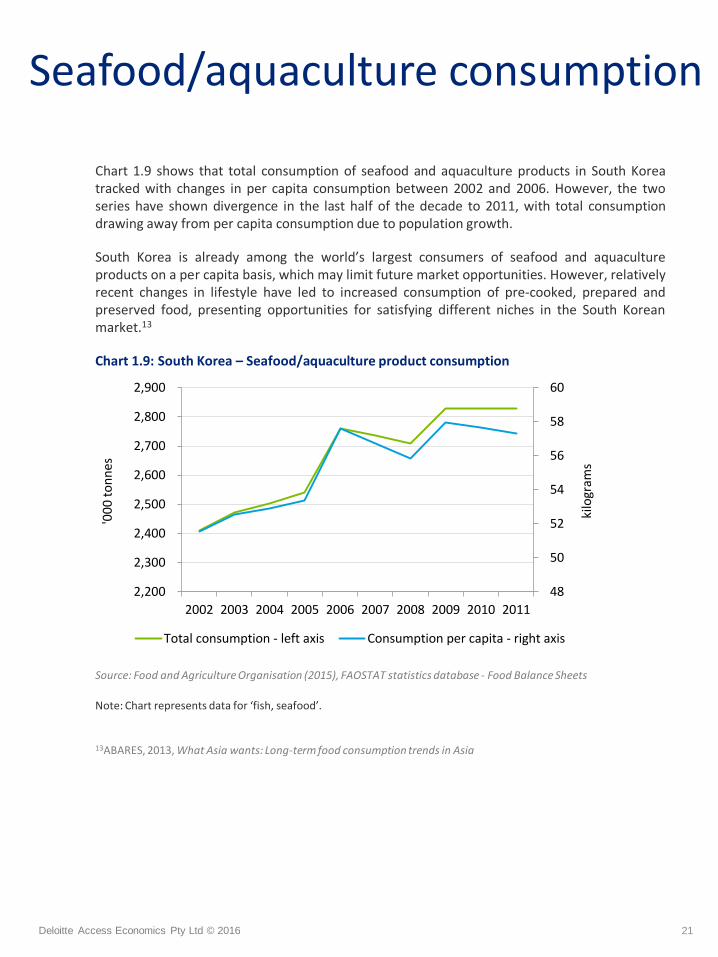
Chart 1.9 shows that total consumption of seafood and aquaculture products in South Korea tracked with changes in per capita consumption between 2002 and 2006. However, the two series have shown divergence in the last half of the decade to 2011, with total consumption drawing away from per capita consumption due to population growth.
South Korea is already among the world’s largest consumers of seafood and aquaculture products on a per capita basis, which may limit future market opportunities. However, relatively recent changes in lifestyle have led to increased consumption of pre-cooked, prepared and preserved food, presenting opportunities for satisfying different niches in the South Korean market.13
Chart 1.9: South Korea – Seafood/aquaculture product consumption
Source: Food and Agriculture Organisation (2015), FAOSTAT statistics database - Food Balance Sheets
Note: Chart represents data for ‘fish, seafood’.
13ABARES, 2013, What Asia wants: Long-term food consumption trends in Asia
21
48
50
52
54
56
58
60
2,200
2,300
2,400
2,500
2,600
2,700
2,800
2,900
2002 2003 2004 2005 2006 2007 2008 2009 2010 2011
kilo
gram
s
'00
0 t
on
nes
Total consumption - left axis Consumption per capita - right axis

Deloitte Access Economics Pty Ltd © 2016
Seafood/aquaculture food balance
Chart 1.10 shows that, while South Korea imports around 80% of the volume of seafood and aquaculture products that it produces, much of that domestic production is still exported. In 2014, imports were worth around $4.77 billion14 – over 17 times the total value of Queensland production.
Wild-caught fish and other aquatic animals still account for the majority of South Korean production, but the aquaculture sector has grown significantly in recent years.15 Much of this growth has been in shellfish production, with South Korea recently becoming the world’s second largest producer of farmed oysters (after China).
Chart 1.10: South Korea – Seafood/aquaculture food balance
Source: Food and Agriculture Organisation (2015), FAOSTAT statistics database - Food Balance Sheets.
Note: Chart represents data for ‘fish, seafood’.
14UN Comtrade Database
15ABARES, 2013, What Asia wants: Long-term food consumption trends in Asia
22
0%
25%
50%
75%
100%
2002 2003 2004 2005 2006 2007 2008 2009 2010 2011
Production Exports Imports

Deloitte Access Economics Pty Ltd © 2016
Changes from KAFTA
This section summarises the key changes arising from the KAFTA for the four key categories of interest (beef, grains, horticulture and seafood/aquaculture). For each key commodity export in each category, Table 1.5 (on the following page) shows the current tariff rate, the expected tariff rate 10 years after the FTA has commenced and the tariff rate after the FTA has had its full effect. This is then compared to the current tariffs for the top three competitors in each commodity to show the tariff differentials between competitors. This is a static picture of the present day tariffs and does not represent possible tariff changes for these competitors in the future.
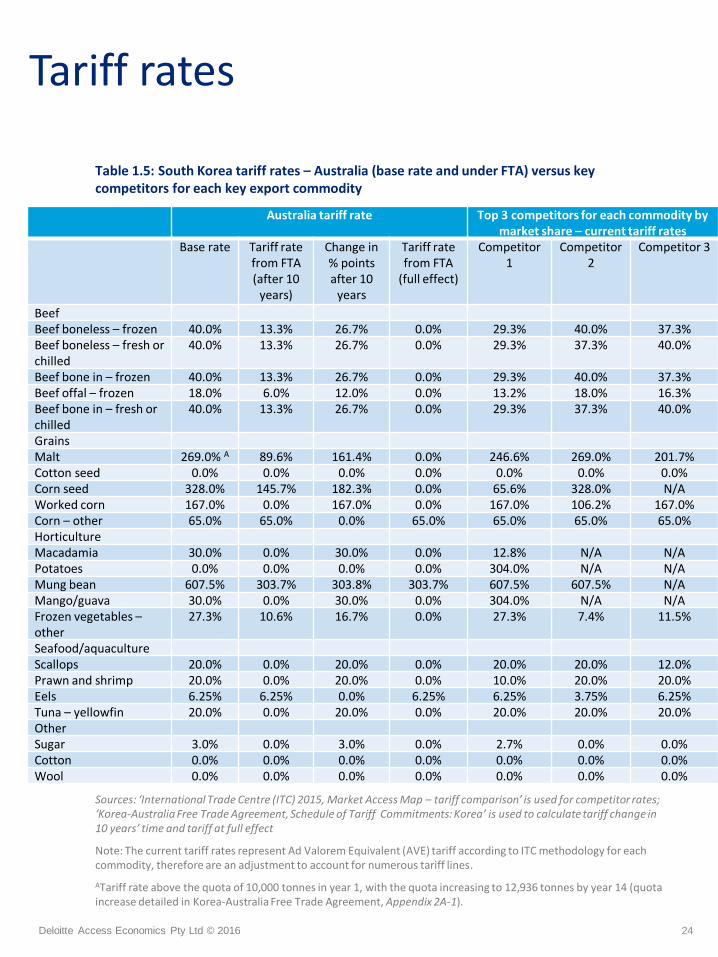
The table shows that tariffs will be eliminated for all beef products once the FTA has been given full effect (i.e. over 15 years). Australia’s main competitor in this market is the USA, which has a lower tariff of 29.3% (compared to Australia’s base rate of 40%) for the beef boneless and bone in products. Tariffs for the two other competitors are roughly equivalent to Australia for all beef products.
With the exception of ‘corn – other’, grains tariffs will be eliminated once the FTA has had full effect. The phasing for this varies with corn seed reducing to zero over 18 years, worked corn (10 years) and malt (12 years). Competitors in grains currently have similar tariffs to Australia, with the exception of corn seed where the USA has a much lower tariff of 65% (compared to Australia’s base rate of 328%).
For horticulture, tariffs will be eliminated once the FTA has reached its full effect with the exception of mung bean16 which will only be halved over 10 years. Mango will be phased out over 10 years, macadamias over five years and frozen vegetables over 10 years. Australia currently has lower tariffs than its competitors for mangoes and potatoes, and higher tariffs for macadamia and frozen vegetables.
For seafood/aquaculture, tariffs will be eliminated for all top four products over 20 years with the exception of eels. Australian produce currently experiences similar tariff rates to its competitors.
16According to HECC codes, mung beans are considered under 07 - Edible vegetables and certain roots and tubers
23
Deloitte Access Economics Pty Ltd © 2016
Tariff rates
24
Table 1.5: South Korea tariff rates – Australia (base rate and under FTA) versus key competitors for each key export commodity
Sources: ‘International Trade Centre (ITC) 2015, Market Access Map – tariff comparison’ is used for competitor rates; ‘Korea-Australia Free Trade Agreement, Schedule of Tariff Commitments: Korea’ is used to calculate tariff change in 10 years’ time and tariff at full effect
Note: The current tariff rates represent Ad Valorem Equivalent (AVE) tariff according to ITC methodology for each commodity, therefore are an adjustment to account for numerous tariff lines.
ATariff rate above the quota of 10,000 tonnes in year 1, with the quota increasing to 12,936 tonnes by year 14 (quota increase detailed in Korea-Australia Free Trade Agreement, Appendix 2A-1).
Australia tariff rate Top 3 competitors for each commodity by market share – current tariff rates
Base rate Tariff rate from FTA (after 10
years)
Change in % points after 10
years
Tariff rate from FTA
(full effect)
Competitor 1
Competitor 2
Competitor 3
Beef Beef boneless – frozen 40.0% 13.3% 26.7% 0.0% 29.3% 40.0% 37.3% Beef boneless – fresh or chilled
40.0% 13.3% 26.7% 0.0% 29.3% 37.3% 40.0%
Beef bone in – frozen 40.0% 13.3% 26.7% 0.0% 29.3% 40.0% 37.3% Beef offal – frozen 18.0% 6.0% 12.0% 0.0% 13.2% 18.0% 16.3% Beef bone in – fresh or chilled
40.0% 13.3% 26.7% 0.0% 29.3% 37.3% 40.0%
Grains Malt 269.0% A 89.6% 161.4% 0.0% 246.6% 269.0% 201.7% Cotton seed 0.0% 0.0% 0.0% 0.0% 0.0% 0.0% 0.0% Corn seed 328.0% 145.7% 182.3% 0.0% 65.6% 328.0% N/A Worked corn 167.0% 0.0% 167.0% 0.0% 167.0% 106.2% 167.0% Corn – other 65.0% 65.0% 0.0% 65.0% 65.0% 65.0% 65.0% Horticulture Macadamia 30.0% 0.0% 30.0% 0.0% 12.8% N/A N/A Potatoes 0.0% 0.0% 0.0% 0.0% 304.0% N/A N/A Mung bean 607.5% 303.7% 303.8% 303.7% 607.5% 607.5% N/A Mango/guava 30.0% 0.0% 30.0% 0.0% 304.0% N/A N/A Frozen vegetables – other
27.3% 10.6% 16.7% 0.0% 27.3% 7.4% 11.5%
Seafood/aquaculture Scallops 20.0% 0.0% 20.0% 0.0% 20.0% 20.0% 12.0% Prawn and shrimp 20.0% 0.0% 20.0% 0.0% 10.0% 20.0% 20.0% Eels 6.25% 6.25% 0.0% 6.25% 6.25% 3.75% 6.25% Tuna – yellowfin 20.0% 0.0% 20.0% 0.0% 20.0% 20.0% 20.0% Other Sugar 3.0% 0.0% 3.0% 0.0% 2.7% 0.0% 0.0% Cotton 0.0% 0.0% 0.0% 0.0% 0.0% 0.0% 0.0% Wool 0.0% 0.0% 0.0% 0.0% 0.0% 0.0% 0.0%

Deloitte Access Economics Pty Ltd © 2016
Opportunity map
25
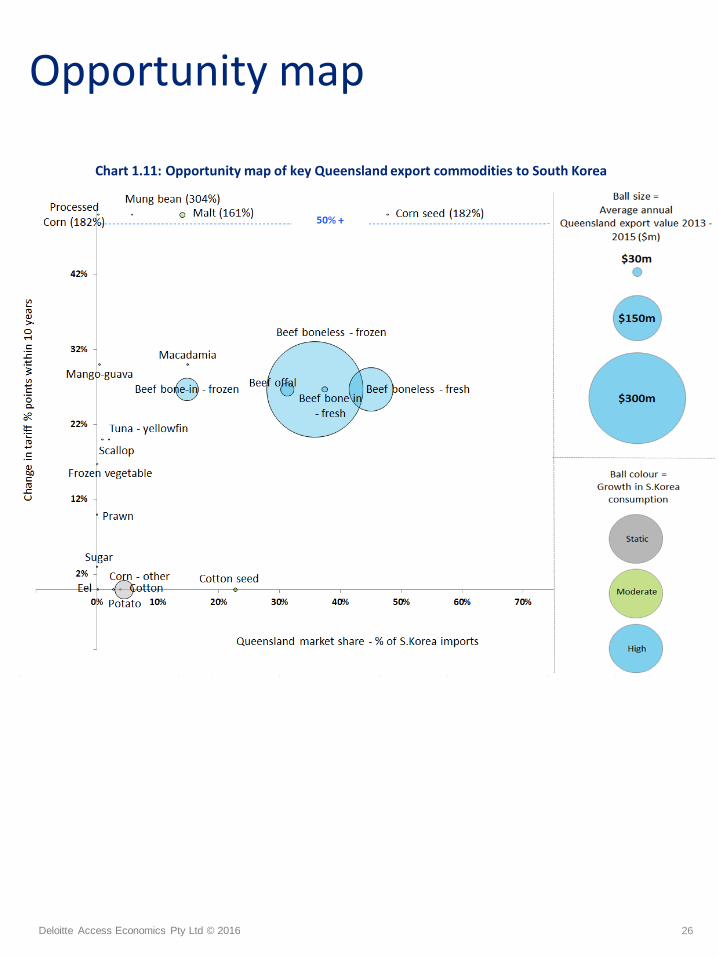
This ‘opportunity map’ consolidates the preceding analysis by combining the value of Queensland food and fibre exports, tariff changes in the South Korea FTA, Queensland’s market share of South Korea imports, and consumption growth in South Korea for specific commodities.
The sectors which are large, blue and are located towards the top right of the chart are those with the greatest opportunity for growth in the South Korean market. This is because they represent the strongest combination of:
• Being an established export market (ball size);
• Strong competitive advantage represented by market share (horizontal axis);
• Large tariff reductions from the FTA (vertical axis); and
• Strong consumption growth in the South Korean market (ball colour – where blue represents strong recent and expected continued growth, green represents moderate demand growth and grey represents static or declining demand growth).
The opportunity map shows beef and beef products as being the largest opportunity for trade and investment growth, given its established market and Queensland’s dominant market share. The tariff reductions applied to Australian beef will serve to strengthen this market further. Beef consumption is also relatively strong in South Korea compared to other commodities.
For grains, current tariffs are extremely high. Some tariff lines such as worked corn, malt and corn seed are being dramatically phased out over 10-18 years (depending on the tariff line). Malt and corn seed perhaps represent the largest opportunities for grains given there is a market presence for these commodities, as well as moderate demand growth.
For horticultural products, mung bean, macadamia, mango and frozen vegetables will all enjoy healthy tariff reductions. However, macadamia has the strongest combination of tariff reduction, demand growth and market share (although the actual value of exports in recent years is relatively low at around $1m per annum).
For seafood/aquaculture products, total demand has been relatively static in the five years to 2011. With the exception of eels, all seafood/aquaculture products will enjoy some tariff reduction. However, without an established market presence for any of the commodities in this category, it would appear that seafood/aquaculture is not an immediate opportunity for significant Queensland trade.
Deloitte Access Economics Pty Ltd © 2016
Opportunity map
26
Chart 1.11: Opportunity map of key Queensland export commodities to South Korea
Deloitte Access Economics Pty Ltd © 2016
Non-tariff considerations
27
Through consultation, stakeholders did not identify any material non-tariff barriers in relation to trade opportunities with South Korea.
This will be explored in greater detail during Stage 2.
Deloitte Access Economics Pty Ltd © 2016
Implications
28
The previous analysis suggests that the major opportunity for Queensland in terms of value is in increasing beef exports to South Korea, given the relatively high tariff reductions and strong market share. However, given beef is already a relatively large export market to South Korea, Stage 2 will also investigate the comparatively smaller (but still significant) emerging opportunities in other categories.
In terms of horticulture, this initial research has highlighted the emerging opportunities in commodities where export channels have been established, with particular opportunities in macadamia and mangoes. With respect to grains, further investigation could be conducted into the opportunities for corn , malt and high protein grains.
However, there may also be other opportunities for Queensland exports to South Korea where exports do not currently occur. Identifying these opportunities would involve analysis to match Queensland’s production capability, market access for each commodity, and more detailed consumption analysis for South Korea down to the specific product level.

Appendix
29
Deloitte Access Economics Pty Ltd © 2016
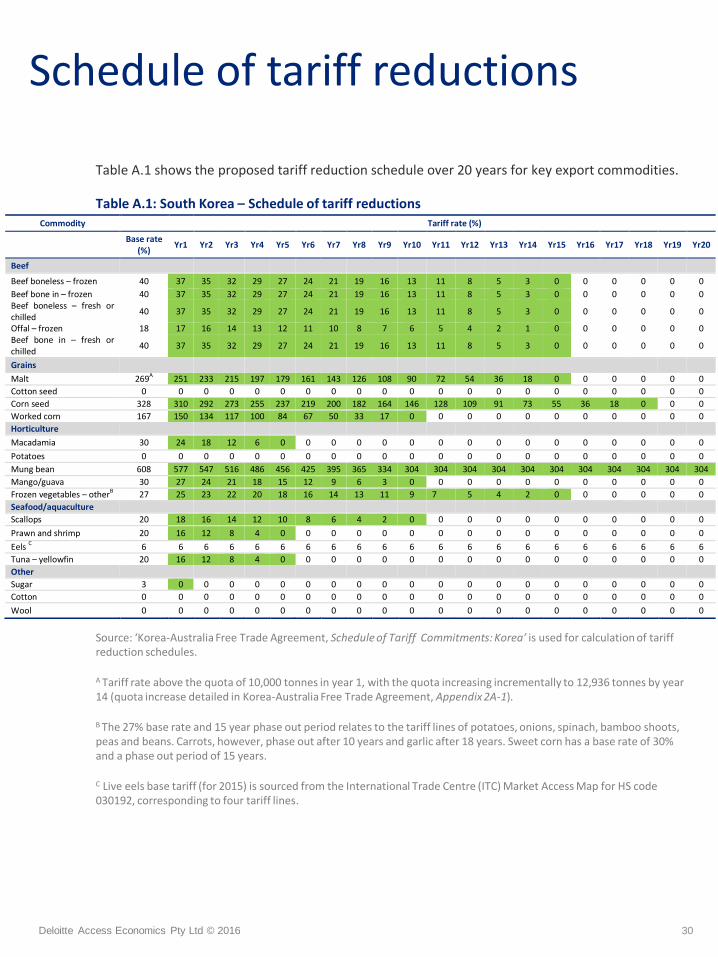
Table A.1 shows the proposed tariff reduction schedule over 20 years for key export commodities.
Table A.1: South Korea – Schedule of tariff reductions
Source: ‘Korea-Australia Free Trade Agreement, Schedule of Tariff Commitments: Korea’ is used for calculation of tariff reduction schedules.
A Tariff rate above the quota of 10,000 tonnes in year 1, with the quota increasing incrementally to 12,936 tonnes by year 14 (quota increase detailed in Korea-Australia Free Trade Agreement, Appendix 2A-1).
B The 27% base rate and 15 year phase out period relates to the tariff lines of potatoes, onions, spinach, bamboo shoots, peas and beans. Carrots, however, phase out after 10 years and garlic after 18 years. Sweet corn has a base rate of 30% and a phase out period of 15 years.
C Live eels base tariff (for 2015) is sourced from the International Trade Centre (ITC) Market Access Map for HS code 030192, corresponding to four tariff lines.
30
Schedule of tariff reductions
Commodity Tariff rate (%)
Base rate
(%) Yr1 Yr2 Yr3 Yr4 Yr5 Yr6 Yr7 Yr8 Yr9 Yr10 Yr11 Yr12 Yr13 Yr14 Yr15 Yr16 Yr17 Yr18 Yr19 Yr20
Beef
Beef boneless – frozen 40 37 35 32 29 27 24 21 19 16 13 11 8 5 3 0 0 0 0 0 0
Beef bone in – frozen 40 37 35 32 29 27 24 21 19 16 13 11 8 5 3 0 0 0 0 0 0 Beef boneless – fresh or chilled
40 37 35 32 29 27 24 21 19 16 13 11 8 5 3 0 0 0 0 0 0
Offal – frozen 18 17 16 14 13 12 11 10 8 7 6 5 4 2 1 0 0 0 0 0 0 Beef bone in – fresh or chilled
40 37 35 32 29 27 24 21 19 16 13 11 8 5 3 0 0 0 0 0 0
Grains
Malt 269A 251 233 215 197 179 161 143 126 108 90 72 54 36 18 0 0 0 0 0 0
Cotton seed 0 0 0 0 0 0 0 0 0 0 0 0 0 0 0 0 0 0 0 0 0
Corn seed 328 310 292 273 255 237 219 200 182 164 146 128 109 91 73 55 36 18 0 0 0
Worked corn 167 150 134 117 100 84 67 50 33 17 0 0 0 0 0 0 0 0 0 0 0
Horticulture
Macadamia 30 24 18 12 6 0 0 0 0 0 0 0 0 0 0 0 0 0 0 0 0
Potatoes 0 0 0 0 0 0 0 0 0 0 0 0 0 0 0 0 0 0 0 0 0
Mung bean 608 577 547 516 486 456 425 395 365 334 304 304 304 304 304 304 304 304 304 304 304
Mango/guava 30 27 24 21 18 15 12 9 6 3 0 0 0 0 0 0 0 0 0 0 0
Frozen vegetables – otherB 27 25 23 22 20 18 16 14 13 11 9 7 5 4 2 0 0 0 0 0 0
Seafood/aquaculture
Scallops 20 18 16 14 12 10 8 6 4 2 0 0 0 0 0 0 0 0 0 0 0
Prawn and shrimp 20 16 12 8 4 0 0 0 0 0 0 0 0 0 0 0 0 0 0 0 0
Eels C 6 6 6 6 6 6 6 6 6 6 6 6 6 6 6 6 6 6 6 6 6
Tuna – yellowfin 20 16 12 8 4 0 0 0 0 0 0 0 0 0 0 0 0 0 0 0 0
Other
Sugar 3 0 0 0 0 0 0 0 0 0 0 0 0 0 0 0 0 0 0 0 0
Cotton 0 0 0 0 0 0 0 0 0 0 0 0 0 0 0 0 0 0 0 0 0
Wool 0 0 0 0 0 0 0 0 0 0 0 0 0 0 0 0 0 0 0 0 0
General information only
This presentation contains general information only, and none of Deloitte Touche Tohmatsu Limited, its member firms, or their related entities (collectively the
“Deloitte Network”) is, by means of this presentation, rendering professional advice or services. Before making any decision or taking any action that may
affect your finances or your business, you should consult a qualified professional adviser. No entity in the Deloitte Network shall be responsible for any loss
whatsoever sustained by any person who relies on this presentation.
About Deloitte
Deloitte refers to one or more of Deloitte Touche Tohmatsu Limited, a UK private company limited by guarantee, and its network of member firms, each of
which is a legally separate and independent entity. Please see www.deloitte.com/au/about for a detailed description of the legal structure of Deloitte Touche
Tohmatsu Limited and its member firms.
Deloitte provides audit, tax, consulting, and financial advisory services to public and private clients spanning multiple industries. With a globally connected
network of member firms in more than 150 countries, Deloitte brings world-class capabilities and high-quality service to clients, delivering the insights they
need to address their most complex business challenges. Deloitte has in the region of 225,000 professionals, all committed to becoming the standard of
excellence.
About Deloitte Australia
In Australia, the member firm is the Australian partnership of Deloitte Touche Tohmatsu. As one of Australia’s leading professional services firms. Deloitte
Touche Tohmatsu and its affiliates provide audit, tax, consulting, and financial advisory services through approximately 6,000 people across the country.
Focused on the creation of value and growth, and known as an employer of choice for innovative human resources programs, we are dedicated to helping
our clients and our people excel. For more information, please visit our web site at www.deloitte.com.au.
Liability limited by a scheme approved under Professional Standards Legislation.
Member of Deloitte Touche Tohmatsu Limited
© 2016 Deloitte Access Economics Pty Ltd
31
General use restriction
This report is prepared solely for the Department of Agriculture and Fisheries and Trade and Investment Queensland by Deloitte Access Economics . This report is not intended to and should not be used or relied upon by anyone else and we accept no duty of care to any other person or entity. The report has been prepared for the purpose of identifying the opportunities for Queensland agribusiness from the Free Trade Agreements with Japan, Japan and South Korea. You should not refer to or use our name or the advice for any other purpose.