![NONFLAMMABLE LIQUIDS FORCRYOSTATS - NIST Pagenvlpubs.nist.gov/nistpubs/ScientificPapers/nbsscientificpaper520... · Kanolt] NonflammableLiquidsforCryostats The ofthe Theof istheof](https://static.fdocuments.in/doc/165x107/5aba2d137f8b9a297f8b5f74/nonflammable-liquids-forcryostats-nist-nonflammableliquidsforcryostats-the-ofthe.jpg)
Some optical and photoelectric properties of...
42
SOME OPTICAL AND PHOTOELECTRIC PROPERTIES OF MOLYBDENITE By W. W. Coblentz and H. Kahler CONTENTS Page I. Introductory statement 121 II. Summary of previous work 122 III. Apparatus and methods 123 1 Diffuse-light tests 125 2. Sources of material examined 126 IV. Transmitting and reflecting power of molybdenite 126 1. Transmission measurements 127 2 Reflectivity measurements 128 V. Variation of photoelectric current with time of exposure 132 VI. Spectral range of photoelectric sensitivity ' . . 134 VII. Experimental data on various samples 136 VIII. Effect of intensity of radiation upon electrical conductivity 141 IX. Effect of temperature upon photoelectric sensitivity 146 X. Effect of humidity, vacuum, and mechanical working 151 XI. Photoelectric sensitivity versus current rectification 153 1. Exudation of a dark-blue liquid 155 XII. Theoretical applications 156 XIII. Summary 159 Appendixes : Appendix 1 . —Photoelectric activity induced in unilluminated parts of a crystal 161 Appendix 2. —Polarization by reflection from molybdenite 161 I. INTRODUCTORY STATEMENT In previous communications * data were given on the photo- electric sensitivity of various minerals, using heterochromatic light. As it frequently happens, while this preliminary investi- gation was in progress, the results of a similar survey were pub- lished. 2 This method of attack was therefore discontinued and the detailed investigation of the spectral photoelectric sensi- tivity of various substances was resumed. 3 1 Proc. Phil. Soc. Wash., Feb. 3, 1917; Jour. Wash. Acad. Sci., 7, p. 525, 1917; this Bulletin, 14, p. 591, 1918. 2 Case. Phys. Rev. (2), 9, p. 305, April, 1917. Data on selenium, potassium, etc., are given in this Bulletin, 14, p. 507, 1918. Preliminary data on molybdenite were obtained with the assistance of M. B. Long and published under joint authorship in the Phys. Rev., 11, p. 497, 1918, and 13, p. 140, 1919- The latter gives data presented at the Pittsburgh meeting, Dec. 27, 1917. 121
Transcript of Some optical and photoelectric properties of...
SOME OPTICAL AND PHOTOELECTRIC PROPERTIESOF MOLYBDENITE
By W. W. Coblentz and H. Kahler
CONTENTSPage
I. Introductory statement 121
II. Summary of previous work 122
III. Apparatus and methods 123
1
.
Diffuse-light tests 125
2. Sources of material examined 126
IV. Transmitting and reflecting power of molybdenite 126
1. Transmission measurements 127
2
.
Reflectivity measurements 128
V. Variation of photoelectric current with time of exposure 132
VI. Spectral range of photoelectric sensitivity '. . 134
VII. Experimental data on various samples 136
VIII. Effect of intensity of radiation upon electrical conductivity 141
IX. Effect of temperature upon photoelectric sensitivity 146
X. Effect of humidity, vacuum, and mechanical working 151
XI. Photoelectric sensitivity versus current rectification 153
1. Exudation of a dark-blue liquid 155
XII. Theoretical applications 156
XIII. Summary 159
Appendixes :
Appendix 1 .—Photoelectric activity induced in unilluminated parts of a
crystal 161
Appendix 2.—Polarization by reflection from molybdenite 161
I. INTRODUCTORY STATEMENT
In previous communications * data were given on the photo-
electric sensitivity of various minerals, using heterochromatic
light. As it frequently happens, while this preliminary investi-
gation was in progress, the results of a similar survey were pub-
lished. 2 This method of attack was therefore discontinued and
the detailed investigation of the spectral photoelectric sensi-
tivity of various substances was resumed. 3
1 Proc. Phil. Soc. Wash., Feb. 3, 1917; Jour. Wash. Acad. Sci., 7, p. 525, 1917; this Bulletin, 14, p. 591,
1918.
2 Case. Phys. Rev. (2), 9, p. 305, April, 1917.
Data on selenium, potassium, etc., are given in this Bulletin, 14, p. 507, 1918. Preliminary data on
molybdenite were obtained with the assistance of M. B. Long and published under joint authorship in
the Phys. Rev., 11, p. 497, 1918, and 13, p. 140, 1919- The latter gives data presented at the Pittsburgh
meeting, Dec. 27, 1917.
121
122 Scientific Papers of the Bureau of Standards [Voi.15
The present paper gives data on the spectral photoelectric
sensitivity of molybdenite, under various conditions of operation.
Molybdenite was selected for detailed examination because it is
one of the few minerals available which is sufficiently homogene-
ous to determine various optical and electrical properties, all of
which data may prove useful in arriving at an explanation of
the phenomenon of change in electrical resistance of certain sub-
stances when exposed to thermal radiation.
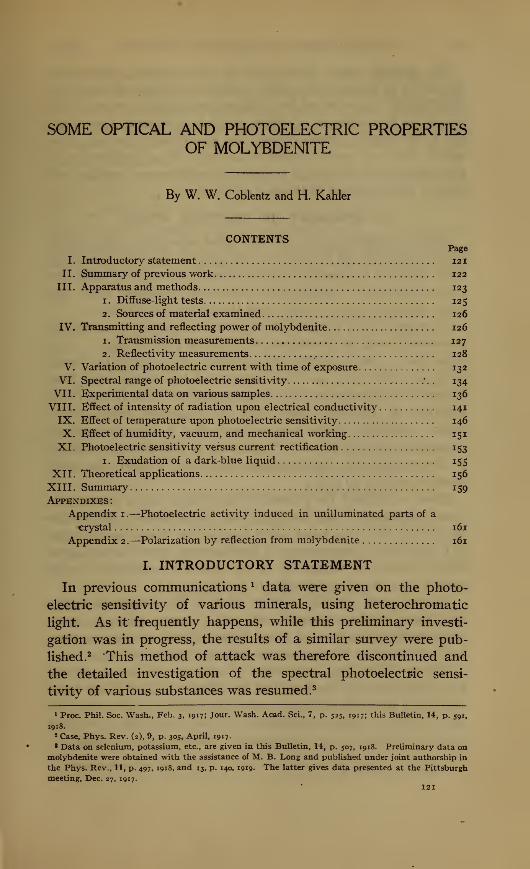
II. SUMMARY OF PREVIOUS WORKPrior to January, 191 7, but few solid substances were known
which exhibited the property of changing in electrical resistance
when exposed to thermal radiant energy, especially visible and
ultra-violet rays. Among the substances examined were sele-
nium, stibnite, cuprous oxide, and the halide salts of silver.
Selenium.—It is beyond the scope of this paper to attempt to
summararize all the investigations made on this substance. Sele-
nium has a very prominent maximum of photoelectric sensi-
tivity at about 0.7 n (/x = 0.001 mm) and a less intense wide bandof sensitivity throughout the visible spectrum. The recent inves-
tagations of Dietrich 4 show that the character of the wave-
length sensitivity curve can be controlled by heat treatment.
Annealing the cell at 200 C produces a maximum sensitivity
in the extreme red, while annealing it at 1 50 C shifts the maxi-
mum sensitivity to 0.55 /x.
Elliot 5 examined the photoelectrical sensitivity of selenium at
room temperature, also at liquid-air temperature. His results
show that the 0.7 fi band shifts toward the short wave lengths
(0.6 ju) at low temperatures. Furthermore, there is an appre-
ciable increase in sensitivity in the infra-red producing a wide
band with a maximum sensitivity at about 1.2/4.
Further tests (see Fig. 1) were made in the present investiga-
tion, using a Giltay selenium cell, and a fluorite prism to deter-
mine conclusively that, at room temperatures, selenium is prac-
tically insensitive throughout the infra-red spectrum to 4 /*.
Stibnite.—The light sensitivity of stibnite (Sb 2S3) as affected
by temperature has been studied by Elliot. 6 At 20 C the light-
sensitivity curve of stibnite is somewhat similar to the selenium
curve shown in Fig. 1, excepting that the maximum sensitivity
occurs at about 0.75 fx. Lowering the temperature to — 190 C( ?)
4 Dietrich, Phys. Rev. (2), p. 467, 1914; 8, p. 191, 1916. 6 Elliot, Phy. Rev. (2), 5, p. 59, 1915.
6 Elliot, Phys. Rev. (2), 5, p. 53, 1915.
CoblentzlKahlcr J
Physical Properties of Molybdenite 123
causes this maximum to shift to about 0.68 ju, and increases some-
what the sensitivity throughout the infra-red to about 2 /x. Thatstibnite is sensitive to infra-red rays even at room temperature
was shown by Martin 7 who observed a strong photoelectric effect
produced by infra-red rays transmitted by a plate of ebonite
2 mm in thickness.
Cuprous Oxide.—The photoelectric sensitivity of cuprous oxide
(Cu20) was studied by Pfund. 8 He found the region of greatest
light sensitivity to be in the ultra-violet, near X =0.28 /x. Asmaller maximum was observed at about 0.625 a*. Lowering the
temperature from 19 C to -127 C shifted this latter band
toward the shorter wave lengths, -0.6 /z. Using the same mate-
rs
ZH
Hi
it
us
hi
5J
(1
S«.
"%1
J 1
\
V—__ -
Fig. 1.
—
Spectral photoelectric sensitivity of selenium
rial, the light-sensitivity curve depends upon the design of the
cell. A further observation of importance was that the change
in conductivity in cuprous oxide is limited to the portions pene-
trated by radiation.
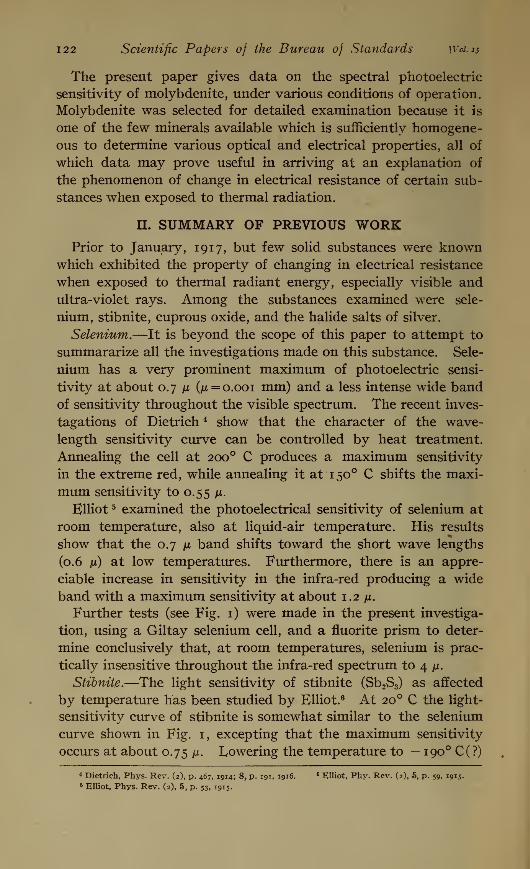
III. APPARATUS AND METHODS
The spectroradiometric apparatus used consisted of a mirror
spectrometer, a fluorite prism, and a vacuum bismuth-silver
thermopile, described in previous papers. 9
The source of radiation consisted of a 500-watt, gas-filled
tungsten lamp securely mounted in front of the slit of the spec-
trometer. Using a vacuum thermopile and an accurately cali-
brated ammeter, the lamp was calibrated to emit equal energies
throughout the spectrum. Starting in the blue-green, the lamp
7 Martin, Phys. Zeit., 12, p. 41, 1911.
8 Pfund, Phys. Rev. (2), 7, p. 289. 1916.
9 This Bulletin, 10, p. 1, 1913; 11, p. 132, 1914.
124 Scientific Papers of the Bureau of Standards [Vol. 13
was operated at normal current (4-ampere) and the galvano-
meter deflection noted. This deflection was taken as a standard
and for the remainder of the spectrum the current was varied so as
to give the same deflection throughout the spectrum to 4 fi. These
ammeter readings (which were as low as 1.5 amperes at about
1.6 ll) were then plotted upon coordinate paper. Several subse-
quent calibrations, made during the course of this investigation,
showed no appreciable change in the original calibration curve.
The arrangement of the apparatus for projecting the mono-chromatic radiation upon the photoelectric substance is shownin Fig. 2. The radiations from the tungsten lamp, after being
dispersed into a spectrum, pass through the exit slit 5 (size 0.5
by 10 mm) , and, after reflection from a 50 cm focal length, silvered-
5/DE VIEW TOP V/EW
tr^frf]si
A-
mFig. 2.
—
Arrangement of apparatus
glass mirror and a right-angled glass prism, are brought to focus
upon the substance P, which is under investigation. In this
manner radiations of different wave lengths, and of equal energy
value ( = 1.1 Xio-6 watt, as determined by measurement with
the thermopile placed at P) could be projected upon the molyb-
denite.
The crystal of molybdenite was soldered to copper electrodes
(illustrated in the rectangular diagrams, in Figs. 10 and 11),
usually mounted upon a fiber support, 10 which was attached (by
wire) to a heavy metal base, P, Fig. 2. The whole was mounted
in a glass vessel G, about 25 cm in length and 5 cm in diameter.
The copper-constantan thermocouple and the current wires lead-
ing to the molybdenite are shown diagrammatically at T. The
10 Shown in No. 4 of Fig. 3, this Bulletin, 11, p. 154, 1914.
K%hi!!rtz
]Physical Properties of Molybdenite 125
glass container rested upon a flexible-metal support in a Dewarflask, containing liquid air, ice, or water which was heated to a
definite temperature by passing an electric current through a
thin strip of manganin immersed in the water.
The liquid air was replenished by means of a cardboard funnel
attached to the Dewar flask, which was surrounded with cotton
batting in order to maintain constant temperature conditions.
After making the initial adjustments, small quantities of liquid
air could be introduced into the flask without disturbing the
adjustments. For most of the observations the glass vessel was
evacuated. In this manner various temperatures could be
obtained, which could be easily maintained constant to o.i° C.
This is an important item in view of the fact that a change in
temperature causes a change in the conductivity, and hence a
change in the "dark current" through the crystal. The scale
reading of the galvanometer is greatly affected by variations in
the dark current.
The resistivity of molybdenite is high. The crystal was there-
fore operated directly in circuit with a d'Arsonval galvanometer
and an electric battery of suitable voltage, which varied from 2
to 4 volts when the crystal was at room temperature to 120
volts, at liquid-air temperature.
The sample under investigation was usually covered with a
piece of thick, white cardboard, perforated by a slit (0.5 by 10
mm.) which enabled the observer to expose a definite part of the
crystal to radiation.
The method of observation consisted in setting the spectrom-
eter circle so as to permit radiation of a given wave length to
pass out through the slit S, and from thence to the crystal P.
The ammeter was set to the proper value as determined by the
calibration curve. The shutter was then raised and the crystal
exposed to the radiation stimulus for an unlimited time, which
varied from 5 seconds for visible radiations to 6 to 12 minutes
for infra-red rays.
1. DIFFUSE-LIGHT TESTS
The novelty of finding bands of photoelectric sensitivity far
beyond the range heretofore observed in the infra-red raised the
question whether this might be owing to scattered radiations.
Tests were therefore made using glass screens 11(e. g., Corning
G585), which absorbed all radiations except those at 1 fi. By
11 This Bulletin, 14, p. 653; 1918.
111676°—19 2
126 Scientific Papers of the Bureau of Standards [Voi.15
means of the thermopile the lamp was calibrated to emit the
same energy with and without the glass screen in place before the
spectrometer slit. Repeated tests showed that within less than
1 per cent the scattered light had no effect on the shape andposition of the bands of photoelectric sensitivity observed at
1 to 1 .2 jx. The observations were therefore made without employ-
ing additional screens for absorbing scattered light.
2. SOURCES OF MATERIAL EXAMINED
The majority of the samples examined, 18 in all, were obtained
from the United States National Museum. Some were obtained
from mineral dealers. The localities from which they had been
obtained were Alaska, Australia, Canada, Japan; and in the
United States, California, Colorado, Maine, Montana, Vermont,
and Washington. From preliminary sensitivity tests, made with
a photophone consisting of a rotating sector, telephone, and an
audion amplifier, using high intensities, it was found that all
the material was of low resistance and low or uncertain photo-
electric sensitivity, except certain samples obtained from Yorkes
Peninsula, South Australia. Projecting an image of a point source
of light upon the samples showed that the photoelectric sensi-
tivity was usually localized in spots as shown in Figs. 10 and 11,
and as previously found in bismuthinite. 12
IV. TRANSMITTING AND REFLECTING POWER OFMOLYBDENITE
As already mentioned, molybdenite is unusually well adapted
for investigating the bearing of various physical properties uponphotoelectrical sensitivity. It was therefore of interest to deter-
mine whether there is any close relation between the optical and
photoelectrical properties of this substance. For this purpose the
spectral transmission and reflection of several samples were deter-
mined by means of the spectroradiometric apparatus used in the
photoelectric work.
On the supposition that photoelectric activity is a resonance
phenomenon, Pfund 13 sought a relation between thermal radiant
energy absorbed and change in electrical conductivity. On this
basis he should have found the greatest photoelectrical activity
of selenium in the blue, where the absorption was the greatest.
This deduction was not verified by experiment, which showed
12 This Bulletin, 14, p. 591; 1918. 13 Pfund, Phys. Rev., 28, p. 324; 1909.
CoblentzlKakler J
Physical Properties of Molybdenite 127
that the maximum photoelectric sensitivity of selenium is in
the red.
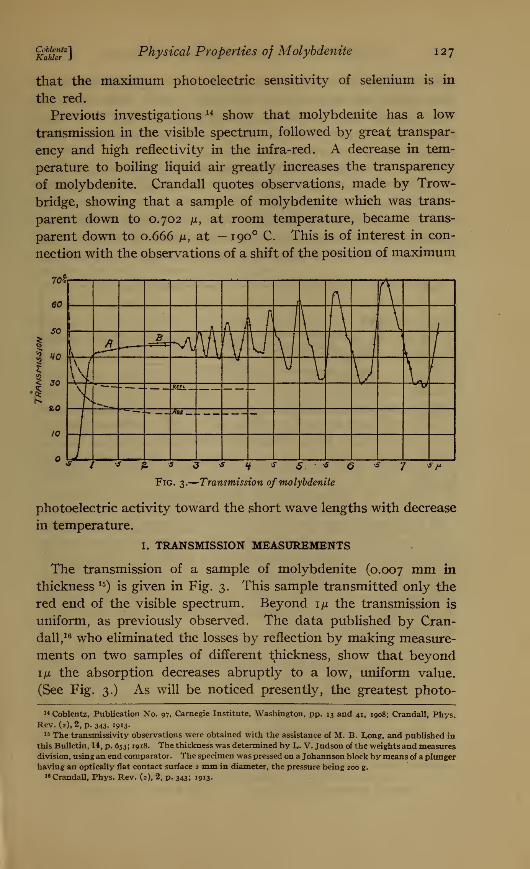
Previous investigations u show that molybdenite has a low
transmission in the visible spectrum, followed by great transpar-
ency and high reflectivity in the infra-red. A decrease in tem-
perature to boiling liquid air greatly increases the transparency
of molybdenite. Crandall quotes observations, made by Trow-
bridge, showing that a sample of molybdenite which was trans-
parent down to 0.702 ix, at room temperature, became trans-
parent down to 0.666 /x, at - 190 C. This is of interest in con-
nection with the observations of a shift of the position of maximum
10%
60
SO
I? HO
X
10
10
1 1 A f
[ nfl ! fJ\ \ 1
\
\ /1
M *^~B
... r:M,%»Vu \1 \ ,
!
u \JV V Vv
/
I
Ei£JL- ^V
A*_.
£ 5 J 5 if * 5 vS aFig. 3.
—
Transmission of molybdenite
s h
photoelectric activity toward the short wave lengths with decrease
in temperature.
1. TRANSMISSION MEASUREMENTS
The transmission of a sample of molybdenite (0.007 mm mthickness 15
) is given in Fig. 3. This sample transmitted only the
red end of the visible spectrum. Beyond i/jl the transmission is
uniform, as previously observed. The data published by Cran-
dall, 16 who eliminated the losses by reflection by making measure-
ments on two samples of different thickness, show that beyondi/jl the absorption decreases abruptly to a low, uniform value.
(See Fig. 3.) As will be noticed presently, the greatest photo-
14 Coblentz, Publication No. 97. Carnegie Institute, Washington, pp. 13 and 41, 1908; Crandall, Phys.
Rev. (2), 2, p. 343, 1913.
15 The transmissivity observations were obtained with the assistance of M. B. Long, and published in
this Bulletin, 14, p. 653 ; 1918. The thickness was determined by L. V. Judson of the weights and measuresdivision, using an end comparator. The specimen was pressed on a Johannson block by means of a plunger
having an optically flat contact surface 2 mm in diameter, the pressure being 200 g.
16 Crandall, Phys. Rev. (2), 2, p. 343; 1913.
128 Scientific Papers of the Bureau of Standards [Voi.15
electric activity of molybdenite occurs in the region of the spec-
trum where the absorption is changing rapidly, from which it
would appear that, as previously had been observed to a morelimited extent, the connection between optical absorption andphotoelectrical activity is rather intricate.
The wavy character of the transmission curve beyond 2.5^ is
the result of interference bands. It is of interest in showing the
resolving power of the apparatus. Curves of this type are of
interest to students in physical optics in connection with the
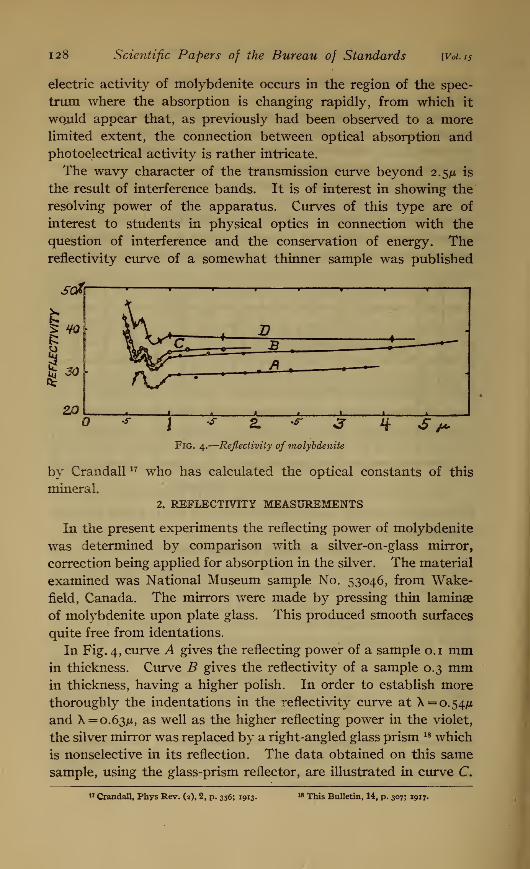
question of interference and the conservation of energy. Thereflectivity curve of a somewhat thinner sample was published
soX\
S: HO
ik
30
ZO
r\s~
•s-
I* a * 3 q s^
Fig. 4.
—
Reflectivity of molybdenite
by Crandall 17 who has calculated the optical constants of this
mineral.
2. REFLECTIVITY MEASUREMENTS
In the present experiments the reflecting power of molybdenite
was determined by comparison with a silver-on-glass mirror,
correction being applied for absorption in the silver. The material
examined was National Museum sample No. 53046, from Wake-field, Canada. The mirrors were made by pressing thin laminae
of molybdenite upon plate glass. This produced smooth surfaces
quite free from identations.
In Fig. 4, curve A gives the reflecting power of a sample 0.1 mmin thickness. Curve B gives the reflectivity of a sample 0.3 mmin thickness, having a higher polish. In order to establish more
thoroughly the indentations in the reflectivity curve at X =0.54/1
and X = o.63/x, as well as the higher reflecting power in the violet,
the silver mirror was replaced by a right-angled glass prism 18 which
is nonselective in its reflection. The data obtained on this same
sample, using the glass-prism reflector, are illustrated in curve C.
« Crandall, Phys Rev. (2), 2, p. 356; 1913- l8 This Bulletin, 14, p. 307; 1917.
CoblenizKahler ;
Physical Properties of Molybdenite 129
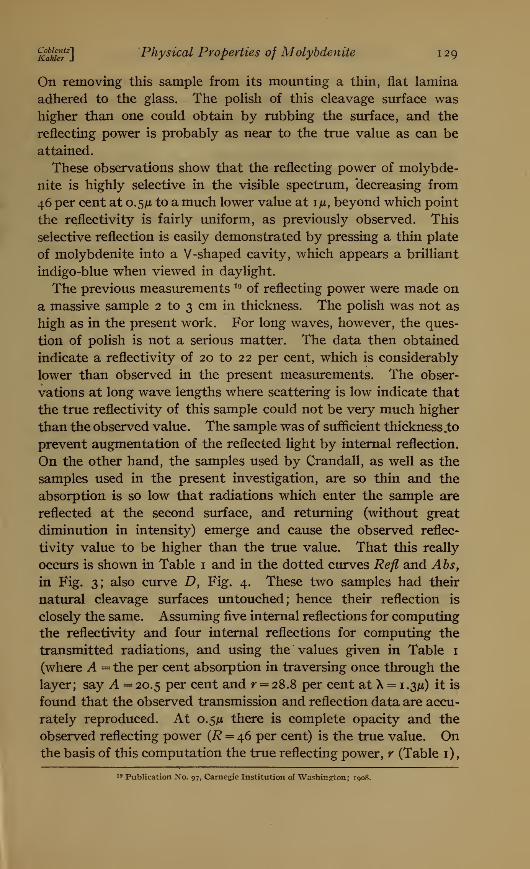
On removing this sample from its mounting a thin, flat lamina
adhered to the glass. The polish of this cleavage surface washigher than one could obtain by rubbing the surface, and the
reflecting power is probably as near to the true value as can be
attained.
These observations show that the reflecting power of molybde-
nite is highly selective in the visible spectrum, 'decreasing from
46 per cent at 0.5/i to a much lower value at im, beyond which point
the reflectivity is fairly uniform, as previously observed. This
selective reflection is easily demonstrated by pressing a thin plate
of molybdenite into a V-shaped cavity, which appears a brilliant
indigo-blue when viewed in daylight.
The previous measurements 19 of reflecting power were made on
a massive sample 2 to 3 cm in thickness. The polish was not as
high as in the present work. For long waves, however, the ques-
tion of polish is not a serious matter. The data then obtained
indicate a reflectivity of 20 to 22 per cent, which is considerably
lower than observed in the present measurements. The obser-
vations at long wave lengths where scattering is low indicate that
the true reflectivity of this sample could not be very much higher
than the observed value. The sample was of sufficient thickness .to
prevent augmentation of the reflected light by internal reflection.
On the other hand, the samples used by Crandall, as well as the
samples used in the present investigation, are so thin and the
absorption is so low that radiations which enter the sample are
reflected at the second surface, and returning (without great
diminution in intensity) emerge and cause the observed reflec-
tivity value to be higher than the true value. That this really
occurs is shown in Table 1 and in the dotted curves Refl and Abs,
in Fig. 3; also curve D, Fig. 4. These two samples had their
natural cleavage surfaces untouched; hence their reflection is
closely the same. Assuming five internal reflections for computing
the reflectivity and four internal reflections for computing the
transmitted radiations, and using the values given in Table 1
(where A = the per cent absorption in traversing once through the
layer; say A = 20.5 per cent and r = 28.8 per cent at X = 1.3/1) it is
found that the observed transmission and reflection data are accu-
rately reproduced. At 0.5/z there is complete opacity and the
observed reflecting power (R = 46 per cent) is the true value. Onthe basis of this computation the true reflecting power, r (Table 1),
19 Publication No. 97, Carnegie Institution of Washington; 1908.
13° Scientific Papers of the Bureau of Standards [Voi.15
of molybdenite is illustrated by the dotted curve Reft in Fig. 3.
which is more nearly in agreement with the previous observations,
The absorption produced in traversing once through the layer is
illustrated in the curve marked Abs in Fig. 3; complete absorp-
tion occurred at wave lengths less than 0.5^. These calculations
indicate that the true reflecting power is of the order of 28 to 30
per cent instead of 38 to 40 per cent, as observed.
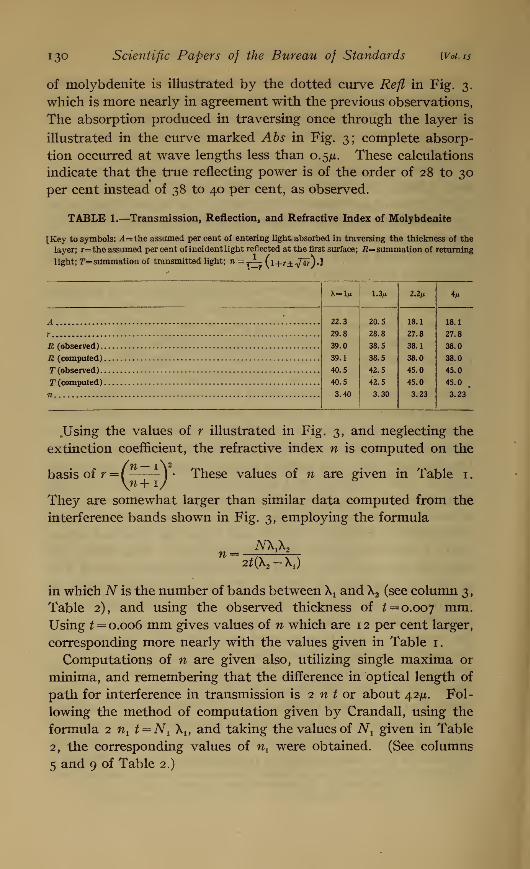
TABLE 1.—Transmission, Reflection, and Refractive Index of Molybdenite
[Key to symbols: ^4= the assumed per cent of entering light absorbed in traversing the thickness of the
layer; r=the assumed per cent of incident light reflected at the first surface; R= summation of returning
light; ^summation of transmitted light; n = T3~ (i+ r±-j~4r)-)
Ar
R (observed).
R (computed)
T (observed).
T (computed)
n
X=1m 1.3/x 2.2M
22.3 20.5 18.1
29.8 28.8 27.8
39.0 38.5 38.1
39.1 38.5 38.0
40.5 42.5 45.0
40.5 42.5 45.0
3.40 3.30 3.23
18.1
27.8
38.0
38.0
45.0
45.0
3.23
.Using the values of r illustrated in Fig. 3, and neglecting the
extinction coefficient, the refractive index n is computed on the
basis of r_/n-iV These values of n are given in Table 1.
They are somewhat larger than similar data computed from the
interference bands shown in Fig. 3, employing the formula
n =N\\
2*(X2 -A1)
in which N is the number of bands between \ and X2 (see column 3,
Table 2), and using the observed thickness of 2 = 0.007 mm -
Using if = 0.006 mm gives values of n which are 12 per cent larger,
corresponding more nearly with the values given in Table 1
.
Computations of n are given also, utilizing single maxima or
minima, and remembering that the difference in optical length of
path for interference in transmission is 2 n t or about 42/1. Fol-
lowing the method of computation given by Crandall, using the
formula 2 n^ t =Nt \, and taking the values of N1 given in Table
2, the corresponding values of nlwere obtained. (See columns
5 and 9 of Table 2.)
CoblentzlKakler J
Physical Properties of Molybdenite 131
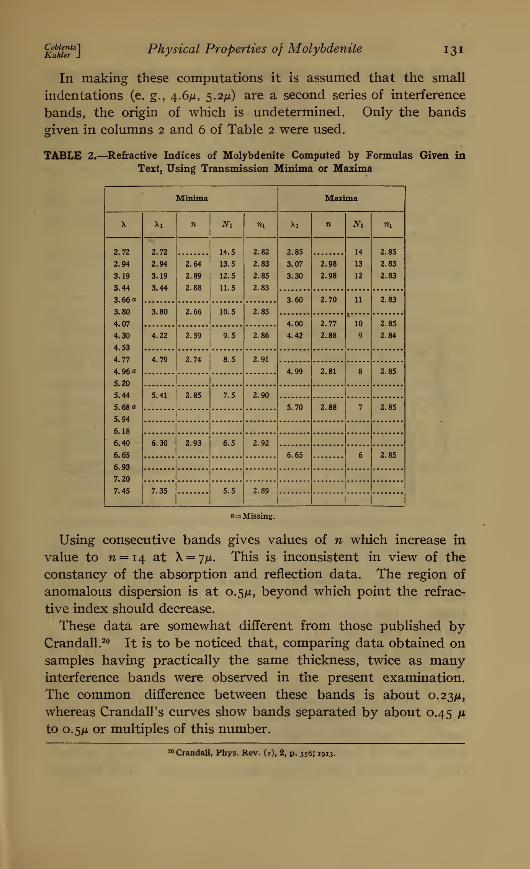
In making these computations it is assumed that the small
indentations (e. g., 4.6/z, 5.2/1) are a second series of interference
bands, the origin of which is undetermined. Only the bands
given in columns 2 and 6 of Table 2 were used.
TABLE 2.—Refractive Indices of Molybdenite Computed by Formulas Given in
Text, Using Transmission Minima or Maxima
Minima Maxima
X Xi n m tii X! n m ni
2.72
2.94
3.19
3.44
3.66 a
3.80
4.07
4.30
4.53
4.77
4.96 a
5.20
5.44
5.68 a
5.94
6.18
6.40
6.65
6.93
7.20
7.45
2.72
2.94
3.19
3.44
2.64
2.89
2.88
14.5
13.5
12.5
11,
2.82
2.83
2.85
2.83
2.85
3.07
3.30
2.98
2.98
14
13
12
2.85
2.83
2.83
3.60 2.70 11 2.83
3.80 2.66 10.5 2.85
4.00
4.42
2.77
2.88
10
9
2.85
2.844.22 2.59 9.5 2.86
4.79 2.74 8.5 2.91
4.99 2.81 8 2.85
5.41 2.85 7.5 2.90
5.70 2.88 7 2.85
6.30 2.93 6.5 2.92
6.65 6 2.85
7.35 5.5 2.89i
1
a= Missing.
Using consecutive bands gives values of n which increase in
value to ^ = 14 at X = 7/x. This is inconsistent in view of the
constancy of the absorption and reflection data. The region of
anomalous dispersion is at 0.5/x, beyond which point the refrac-
tive index should decrease.
These data are somewhat different from those published byCrandall. 20 It is to be noticed that, comparing data obtained on
samples having practically the same thickness, twice as manyinterference bands were observed in the present examination.
The common difference between these bands is about 0.23/x,
whereas Crandall 's curves show bands separated by about 0.45 pto 0.5/i or multiples of this number.
20 Crandall, Phys. Rev. (2), 2, p. 356; 1913.
132 Scientific Papers of the Bureau of Standards {Voi.15
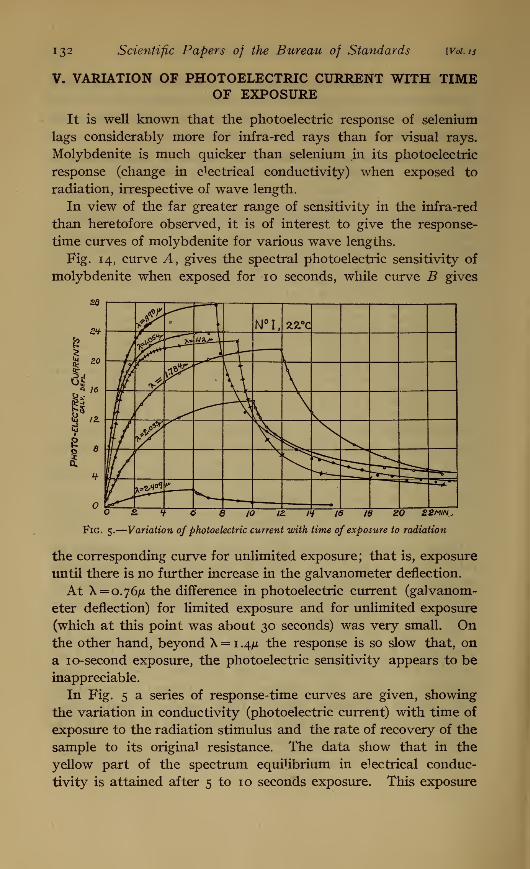
V. VARIATION OF PHOTOELECTRIC CURRENT WITH TIMEOF EXPOSURE
It is well known that the photoelectric response of selenium
lags considerably more for infra-red rays than for visual rays.
Molybdenite is much quicker than selenium in its photoelectric
response (change in electrical conductivity) when exposed to
radiation, irrespective of wave length.
In view of the far greater range of sensitivity in the infra-red
than heretofore observed, it is of interest to give the response-
time curves of molybdenite for various wave lengths.
Fig. 14, curve A, gives the spectral photoelectric sensitivity of
molybdenite when exposed for 10 seconds, while curve B gives
Fig
2. V 6 g JO IE 1H 16 W ZO £2min,
5.
—
Variation of photoelectric current with time of exposure to radiation
the corresponding curve for unlimited exposure; that is, exposure
until there is no further increase in the galvanometer deflection.
At X = o.76/x the difference in photoelectric current (galvanom-
eter deflection) for limited exposure and for unlimited exposure
(which at this point was about 30 seconds) was very small. Onthe other hand, beyond X = 1 .4/* the response is so slow that, on
a 10-second exposure, the photoelectric sensitivity appears to be
inappreciable.
In Fig. 5 a series of response-time curves are given, showing
the variation in conductivity (photoelectric current) with time of
exposure to the radiation stimulus and the rate of recovery of the
sample to its original resistance. The data show that in the
yellow part of the spectrum equilibrium in electrical conduc-
tivity is attained after 5 to 10 seconds exposure. This exposure
§S?2
]Physical Properties of Molybdenite 133
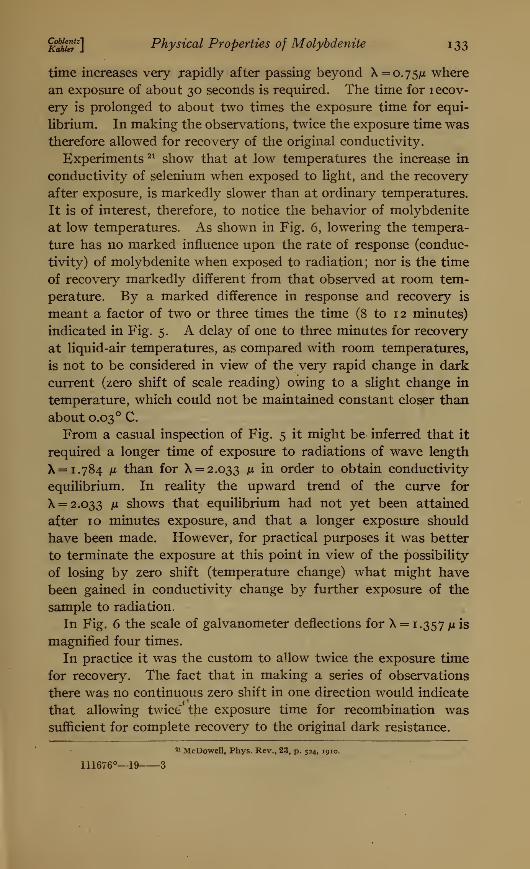
time increases very rapidly after passing beyond X = o.75ju where
an exposure of about 30 seconds is required. The time for recov-
ery is prolonged to about two times the exposure time for equi-
librium. In making the observations, twice the exposure time wastherefore allowed for recovery of the original conductivity.
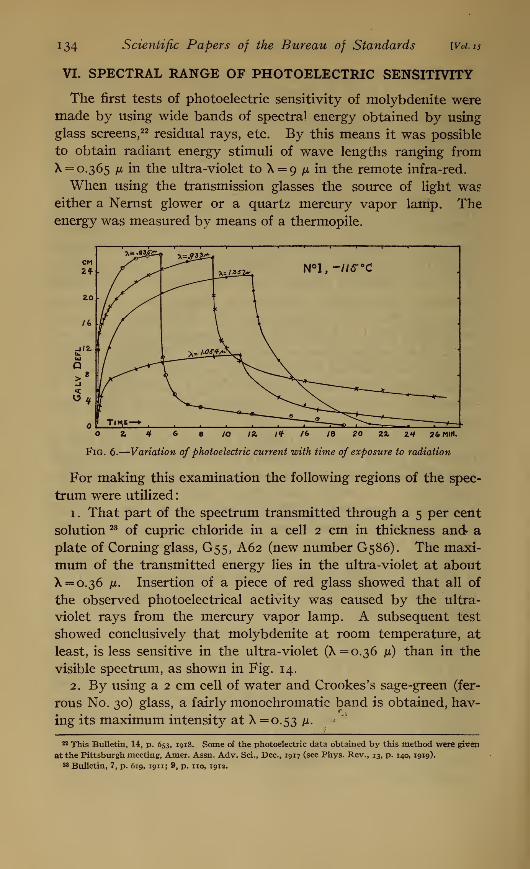
Experiments 21 show that at low temperatures the increase in
conductivity of selenium when exposed to light, and the recovery
after exposure, is markedly slower than at ordinary temperatures.
It is of interest, therefore, to notice the behavior of molybdenite
at low temperatures. As shown in Fig. 6, lowering the tempera-
ture has no marked influence upon the rate of response (conduc-
tivity) of molybdenite when exposed to radiation ; nor is the time
of recovery markedly different from that observed at room tem-
perature. By a marked difference in response and recovery is
meant a factor of two or three times the time (8 to 12 minutes)
indicated in Fig. 5. A delay of one to three minutes for recovery
at liquid-air temperatures, as compared with room temperatures,
is not to be considered in view of the very rapid change in dark
current (zero shift of scale reading) owing to a slight change in
temperature, which could not be maintained constant closer than
about 0.03 ° C.
From a casual inspection of Fig. 5 it might be inferred that it
required a longer time of exposure to radiations of wave length
X= 1.784 n than for X = 2.033 M m order to obtain conductivity
equilibrium. In reality the upward trend of the curve for
X = 2.033 jii shows that equilibrium had not yet been attained
after 10 minutes exposure, and that a longer exposure should
have been made. However, for practical purposes it was better
to terminate the exposure at this point in view of the possibility
of losing by zero shift (temperature change) what might have
been gained in conductivity change by further exposure of the
sample to radiation.
In Fig. 6 the scale of galvanometer deflections for X = 1.357 M is
magnified four times.
In practice it was the custom to allow twice the exposure time
for recovery. The fact that in making a series of observations
there was no continuous zero shift in one direction would indicate
that allowing twice the exposure time for recombination wassufficient for complete recovery to the original dark resistance.
21 McDowell. Phys. Rev., 23, p. 524, 1910.
111676°—19 3
134 Scientific Papers of the Bureau of Standards [Voi.15
VI. SPECTRAL RANGE OF PHOTOELECTRIC SENSITIVITY
The first tests of photoelectric sensitivity of molybdenite weremade by using wide bands of spectral energy obtained by using
glass screens, 22 residual rays, etc. By this means it was possible
to obtain radiant energy stimuli of wave lengths ranging from
X = o.365 jli in the ultra-violet to X = q jjl in the remote infra-red.
When using the transmission glasses the source of light waseither a Nernst glower or a quartz mercury vapor lamp. Theenergy was measured by means of a thermopile.
o 2. 4 6 e /o iz if /& /8 20 zz m j?6min.
Fig. 6.
—
Variation of photoelectric current with time of exposure to radiation
For making this examination the following regions of the spec-
trum were utilized
:
1
.
That part of the spectrum transmitted through a 5 per cent
solution 23 of cupric chloride in a cell 2 cm in thickness and a
plate of Coming glass, G55, A62 (new number G586). The maxi-
mum of the transmitted energy lies in the ultra-violet at about
X = o.36 fx. Insertion of a piece of red glass showed that all of
the observed photoelectrical activity was caused by the ultra-
violet rays from the mercury vapor lamp. A subsequent test
showed conclusively that molybdenite at room temperature, at
least, is less sensitive in the ultra-violet (X=o.36 fi) than in the
visible spectrum, as shown in Fig. 14.
2. By using a 2 cm cell of water and Crookes's sage-green (fer-
rous No. 30) glass, a fairly monochromatic band is obtained, hav-
ing its maximum intensity at X =0.53 \x.
22 This Bulletin, 14, p. 653, 1918. Some of the photoelectric data obtained by this method were given
at the Pittsburgh meeting, Amer. Assn. Adv. Sci., Dec, 1917 (see Phys. Rev., 13, p. 140, 1919).
23 Bulletin, 7, p. 619, 1911; 9, p. no, 1912.
<
KahUrZ~\ Physical Properties of Molybdenite 135
3. Using a Corning Noviweld glass "shade 30 per cent," a 2
cm water cell, and a Nernst glower, regulated to give equal ener-
gies throughout the spectrum, the maximum intensity of the light
stimulus was at about X =0.56 /x.
4. Using Corning purple glass, G55, A62, Schott's red glass,
2745, and a 2 cm cell of water, gave a transmission band having
its maximum intensity at X =0.77 /x.
5. Using Corning blue-purple glass G585, Schott's red glass,
2745, and a 2 cm cell of water (when using the Nernst glower
below normal operation) gave a band of maximum transmission
at about X=o.85 /x.
6. Using three sheets of electric-smoke glass gave a wide band
of spectral energy with a maximum at about 2.2 /x.
7. The radiation from a Bunsen flame gave an emission bandwith maximum at 4.4 fx.
8. The residual rays obtained by reflection from two surfaces
of quartz, using a Nernst glower as a source, gave two intense
bands of selective reflection, 8.5 /x and 9.05 /x, respectively, the
mean value being about X = 8.8 ix.
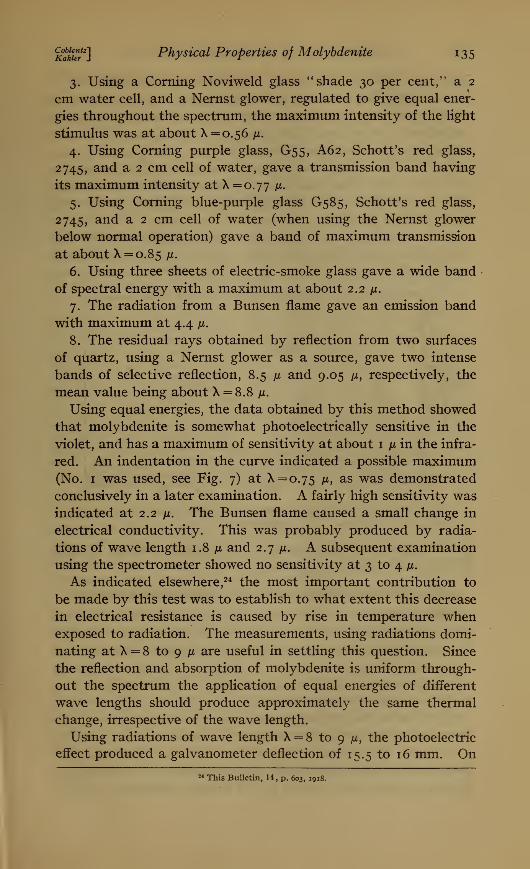
Using equal energies, the data obtained by this method showed
that molybdenite is somewhat photoelectrically sensitive in the
violet, and has a maximum of sensitivity at about 1 fx in the infra-
red. An indentation in the curve indicated a possible maximum(No. 1 was used, see Fig. 7) at X=o.75 ix, as was demonstrated
conclusively in a later examination. A fairly high sensitivity wasindicated at 2.2 jx. The Bunsen flame caused a small change in
electrical conductivity. This was probably produced by radia-
tions of wave length 1.8 \x and 2.7 \x. A subsequent examination
using the spectrometer showed no sensitivity at 3 to 4 /x.
As indicated elsewhere, 24 the most important contribution to
be made by this test was to establish to what extent this decrease
in electrical resistance is caused by rise in temperature whenexposed to radiation. The measurements, using radiations domi-
nating at X = 8 to 9 /x are useful in settling this question. Since
the reflection and absorption of molybdenite is uniform through-
out the spectrum the application of equal energies of different
wave lengths should produce approximately the same thermal
change, irrespective of the wave length.
Using radiations of wave length X = 8 to 9 /x, the photoelectric
effect produced a galvanometer deflection of 15.5 to 16 mm. On
24 This Bulletin, 14, p. 603, 1918.
136 Scientific Papers of the Bureau of Standards [Vol. 15
inserting a plate of clear glass, which is opaque to radiations of
wave length greater than 4 ju, the deflection was 14.5 mm, indi-
cating that the photoelectric effect is produced by scattered
radiations of wave length less than 4 n. Moreover, it is caused
entirely by the energy of wave lengths less than 4 /x. For, cor-
recting for losses by reflection and absorption which amount to
8 to 9 per cent in the glass plate, the deflection is increased from
14.5 to 15.8 mm, which is in agreement with the observations
made without the glass.
The conclusions to be drawn from these experiments are that
molybdenite is not photoelectrically sensitive to infra-red rays of
wave lengths A = 8 to 9 /*, and that the observations at the shorter
Fig. 7.
—
Spectral photoelectric sensitivity of different parts of a crystal of
molybdenite
wave lengths were not affected by the purely thermal changes
produced on exposure to radiation.
VII. EXPERIMENTAL DATA ON VARIOUS SAMPLES
Unless otherwise stated, the samples examined were selected
from material obtained from Yorkes Peninsula, South Australia.
They were numbered consecutively as investigated. Their dimen-
sions and resistances are given in Table 3. Under the present
caption are given additional particulars and comments relative
to the behavior of these samples.
In all these illustrations, unless otherwise stated, the samples
were exposed in the glass container P, shown in Fig. 2.
In these illustrations the ordinates represent the observed
galvanometer deflections, which are proportional to the change in
electrical conductivity caused by the energy stimulus.
CoblentzlKahler J
Physical Properties of Molybdenite 137
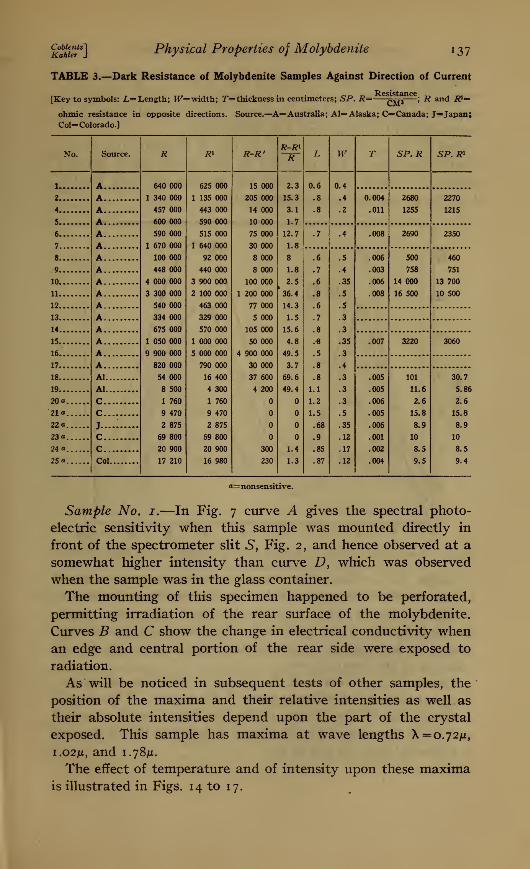
TABLE 3.—Dark Resistance of Molybdenite Samples Against Direction of Current
[Key to symbols: L= Length; W^width; T=thickness in centimeters; SP. R= ^rp ; R and R1=
ohmic resistance in
Col= Colorado.]
opposite directions. Source.—A=Australia; Al= Alaska; C=Canada; J-Japan j
No. Source. R #1 R-R'R-RiR L W T SP. R SP. /?»
1 A 640 000
1 340 000
457 000
600 000
590 000
1 670 000
100 000
448 000
4 000 000
3 300 000
540 000
334 000
675 000
1 050 000
9 900 000
820 000
54 000
8 500
1 760
9 470
2 875
69 800
20 900
17 210
625 000
1 135 000
443 000
590 000
515 000
1 640 000
92 000
440 000
3 900 000
2 100 000
463 000
329 000
570 000
1 000 000
5 000 000
790 000
16 400
4 300
1 760
9 470
2 875
69 800
20 900
16 980
15 000
205 000
14 000
10 000
75 000
30 000
8 000
8 000
100 000
1 200 000
77 000
5 000
105 000
50 000
4 900 000
30 000
37 600
4 200
300
230
2.3
15.3
3.1
1.7
12.7
1.8
8
1.8
2.5
*36.4
14.3
1.5
15.6
4.8
49.5
3.7
69.6
49.4
1.4
1.3
0.6
.8
.8
0.4
.4
.2
2
4
5
AAA
0.004
.011
2680
1255
2270
1215
6
7
AA
.7 .4 .008 2690 2350
8 A .6
.7
.6
.8
.6
.7
.8
.-8
.5
.8
.8
1.1
1.2
1.5
.68
.9
.85
.87
.5
.4
.35
.5
.5
.3
.3
.35
.3
.4
.3
.3
.3
.5
.35
.12
.17
.12
.006
.003
.006
.008
500
758
14 000
16 500
460
.9
10
11
12
AAAA
751
13 700
10 500
13 A14 A15
16
AA
.007 3220 3060
17 A18
19
Al
Al
.005
.005
.006
.005
.006
.001
.002
.004
101
11.6
2.6
15.8
8.9
10
8.5
9.5
30.7
5.86
20a
21a
22a
23a. ...
CCJ
c
2.6
15.8
8.9
10
24a
25a
cCol
8.5
9.4
a= nonsensitive.
Sample No. 1.—In Fig. 7 curve A gives the spectral photo-
electric sensitivity when this sample was mounted directly in
front of the spectrometer slit S, Fig. 2, and hence observed at a
somewhat higher intensity than curve D, which was observed
when the sample was in the glass container.
The mounting of this specimen happened to be perforated,
permitting irradiation of the rear surface of the molybdenite.
Curves B and C show the change in electrical conductivity whenan edge and central portion of the rear side were exposed to
radiation.
As will be noticed in subsequent tests of other samples, the
position of the maxima and their relative intensities as well as
their absolute intensities depend upon the part of the crystal
exposed. This sample has maxima at wave lengths X =0.72/1,
i.02ju, and 1.78/1.
The effect of temperature and of intensity upon these maximais illustrated in Figs. 14 to 17.
138 Scientific Papers of the Bureau of Standards [Voi.15
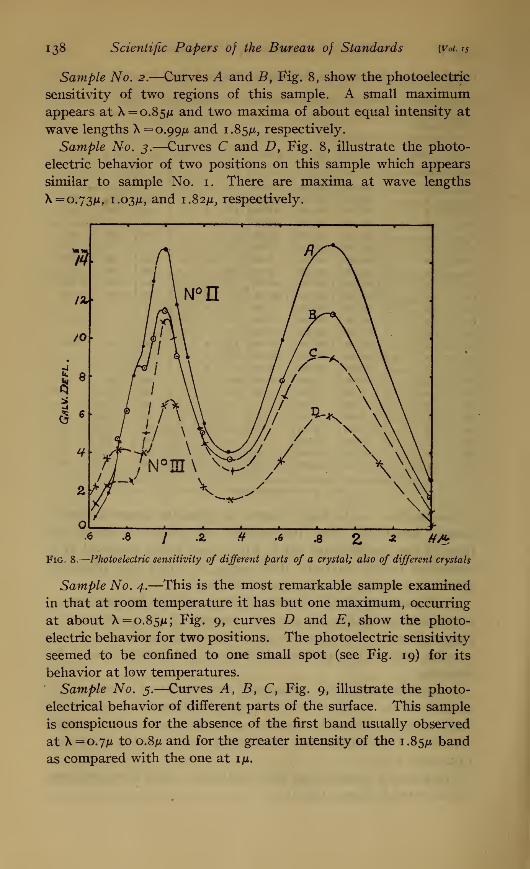
Sample No. 2.—Curves A and B, Fig. 8, show the photoelectric
sensitivity of two regions of this sample. A small maximumappears at X=o.85/z and two maxima of about equal intensity at
wave lengths X= 0.99/* and 1.85/*, respectively.
Sample No. 3.—Curves C and D, Fig. 8, illustrate the photo-
electric behavior of two positions on this sample which appears
similar to sample No. 1 . There are maxima at wave lengths
X=o.73/x, 1.03/x, and 1.82/x, respectively.
•« -8 / -SL # .6' & Z ^ #&
Fig. 8.
—
Photoelectric sensitivity of different parts of a crystal; also of different crystals
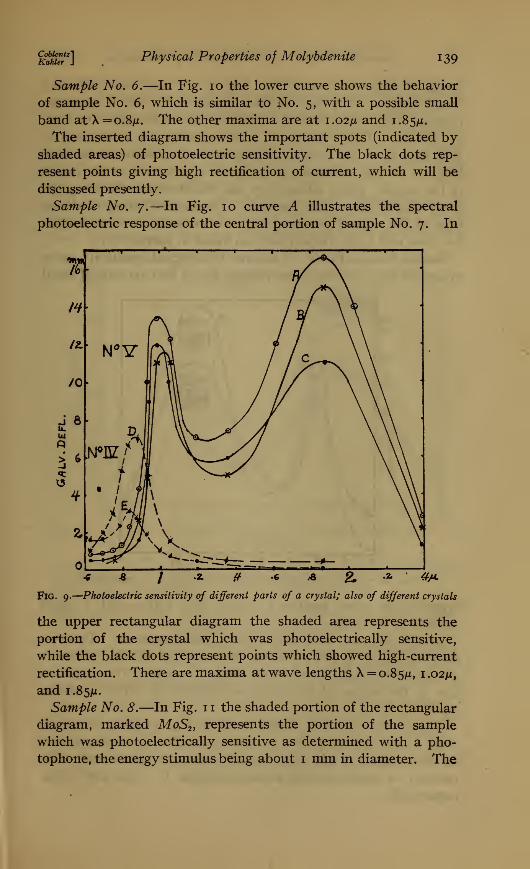
Sample No. 4.—This is the most remarkable sample examined
in that at room temperature it has but one maximum, occurring
at about X = o.85m; Fig. 9, curves D and E, show the photo-
electric behavior for two positions. The photoelectric sensitivity
seemed to be confined to one small spot (see Fig. 19) for its
behavior at low temperatures.
Sample No. 5.—Curves A, B, C, Fig. 9, illustrate the photo-
electrical behavior of different parts of the surface. This sample
is conspicuous for the absence of the first band usually observed
at X = o.7ju to o.8ju and for the greater intensity of the 1.85/t band
as compared with the one at iju.
Coblentz]Kahler J
Physical Properties of Molybdenite 139
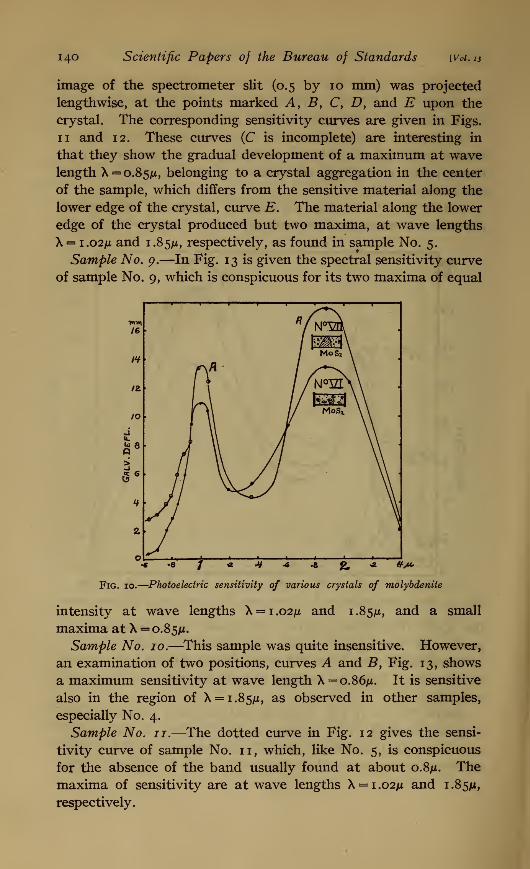
Sample No. 6.—In Fig. 10 the lower curve shows the behavior
of sample No. 6, which is similar to No. 5, with a possible small
band at \=o.8/x. The other maxima are at 1.02/x and 1.85/j.
The inserted diagram shows the important spots (indicated byshaded areas) of photoelectric sensitivity. The black dots rep-
resent points giving high rectification of current, which will be
discussed presently.
Sample No. 7.—In Fig. 10 curve A illustrates the spectral
photoelectric response of the central portion of sample No. 7. In
« A / -* # -6 A 2m A ' #M-
Fig. 9.
—
Photoelectric sensitivity of different parts of a crystal; also of different crystals
the upper rectangular diagram the shaded area represents the
portion of the crystal which was photoelectrically sensitive,
while the black dots represent points which showed high-current
rectification. There are maxima at wave lengths X = 0.85^1, i.o2ju,
and 1.85/x.
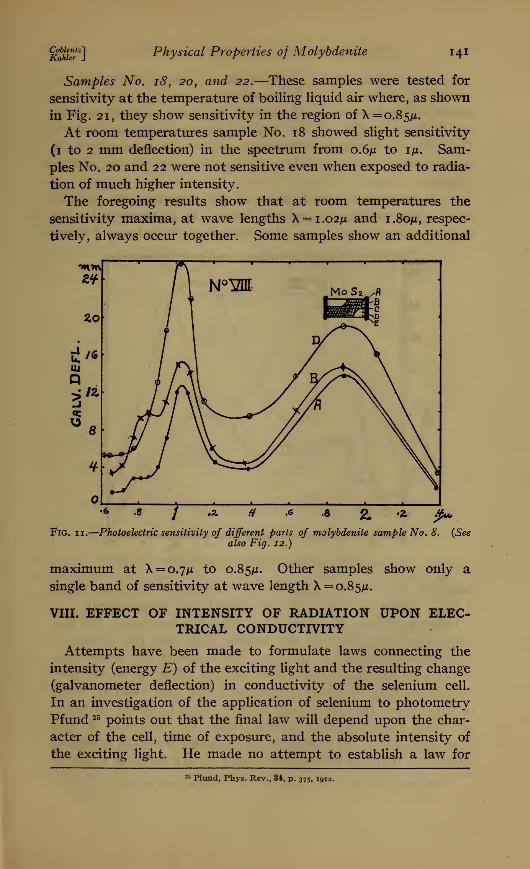
Sample No. 8.—In Fig. 1 1 the shaded portion of the rectangular
diagram, marked MoS2 , represents the portion of the sample
which was photoelectrically sensitive as determined with a pho-
tophone, the energy stimulus being about 1 mm in diameter. The
140 Scientific Papers of the Bureau of Standards [Voi.is
image of the spectrometer slit (0.5 by 10 mm) was projected
lengthwise, at the points marked A, B, C, D, and E upon the
crystal. The corresponding sensitivity curves are given in Figs.
11 and 12. These curves (C is incomplete) are interesting in
that they show the gradual development of a maximum at wavelength X = o.85ju, belonging to a crystal aggregation in the center
of the sample, which differs from the sensitive material along the
lower edge of the crystal, curve E. The material along the lower
edge of the crystal produced but two maxima, at wave lengths
X = 1.02/i and 1.85JU, respectively, as found in sample No. 5.
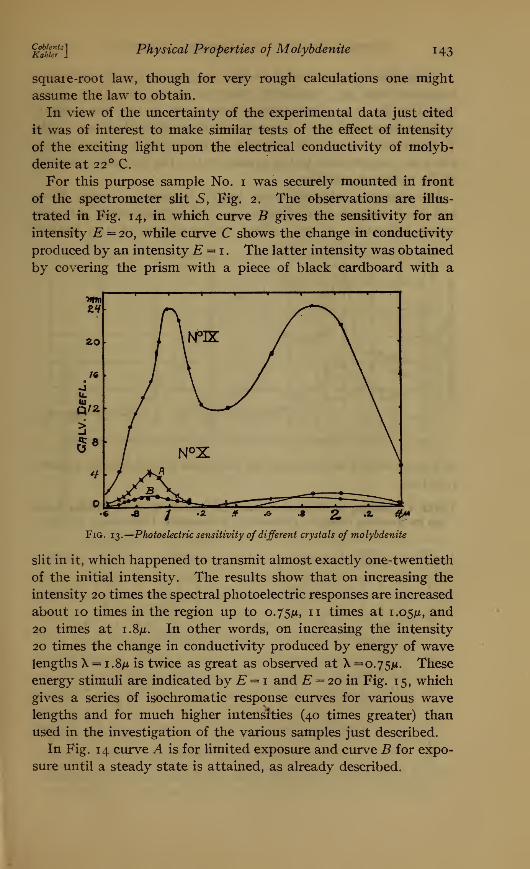
Sample No. 0.—In Fig. 13 is given the spectral sensitivity curve
of sample No. 9, which is conspicuous for its two maxima of equal
Fig. 10.
—
Photoelectric sensitivity of various crystals of molybdenite
intensity at wave lengths X = i.o2ju and 1.85M, and a small
maxima at X = 0.85/x.
Sample No. 10.—This sample was quite insensitive. However,
an examination of two positions, curves A and B, Fig. 13, shows
a maximum sensitivity at wave length X=o.86/*. It is sensitive
also in the region of X = i.85m, as observed in other samples,
especially No. 4.
Sample No. 11.—The dotted curve in Fig. 12 gives the sensi-
tivity curve of sample No. 11, which, like No. 5, is conspicuous
for the absence of the band usually found at about o.8ju. Themaxima of sensitivity are at wave lengths X = i.o2ju and 1.85JU,
respectively.
CoblentzlKakler J
Physical Properties of Molybdenite 141
Samples No. 18 , 20, and 22.—These samples were tested for
sensitivity at the temperature of boiling liquid air where, as shown
in Fig. 21, they show sensitivity in the region of X = 0.85^.
At room temperatures sample No. 18 showed slight sensitivity
(1 to 2 mm deflection) in the spectrum from 0.6/x to 1/1. Sam-
ples No. 20 and 22 were not sensitive even when exposed to radia-
tion of much higher intensity.
The foregoing results show that at room temperatures the
sensitivity maxima, at wave lengths X = i.o2ju and 1.80/A, respec-
tively, always occur together. Some samples show an additional
Fig. 11.
—
Photoelectric sensitivity of different parts of molybdenite sample No. 8.
also Fig. 12.)
(See
maximum at X =0.7/1 to 0.85^. Other samples show only a
single band of sensitivity at wave length X = o.85/x.
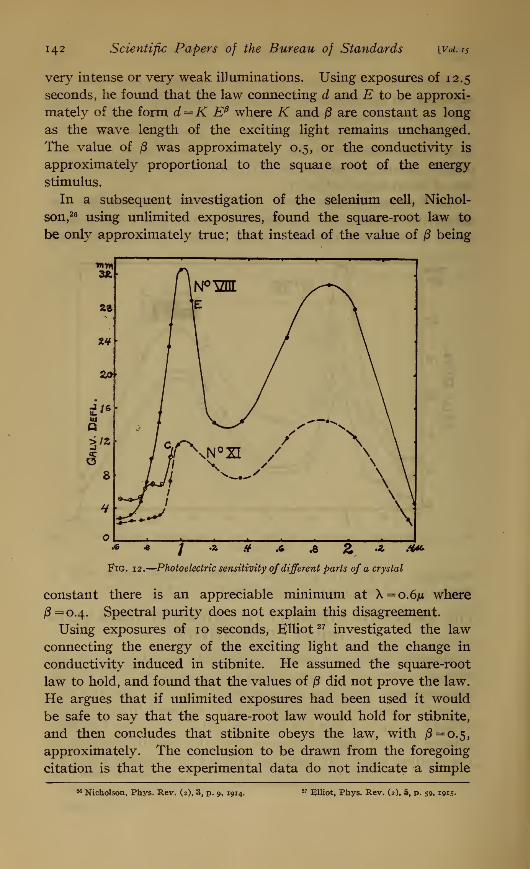
VIII. EFFECT OF INTENSITY OF RADIATION UPON ELEC-TRICAL CONDUCTIVITY
Attempts have been made to formulate laws connecting the
intensity (energy E) of the exciting light and the resulting change
(galvanometer deflection) in conductivity of the selenium cell.
In an investigation of the application of selenium to photometry
Pfund 25 points out that the final law will depend upon the char-
acter of the cell, time of exposure, and the absolute intensity of
the exciting light. He made no attempt to establish a law for
25 Pfund, Phys. Rev., 34, p. 37s , 1912.
142 Scientific Papers of the Bureau of Standards [va.zs
very intense or very weak illuminations. Using exposures of 12.5
seconds, he found that the law connecting d and E to be approxi-
mately of the form d=K E where K and are constant as long
as the wave length of the exciting light remains unchanged.
The value of /3 was approximately 0.5, or the conductivity is
approximately proportional to the squaie root of the energy
stimulus.
In a subsequent investigation of the selenium cell, Nichol-
son,26 using unlimited exposures, found the square-root law to
be only approximately true; that instead of the value of /3 being
•« * / z # a .8 Z •* •**
Fig. 12.
—
Photoelectric sensitivity of different parts of a crystal
constant there is an appreciable minimum at X=o.6/j where
/3=o.4. Spectral purity does not explain this disagreement.
Using exposures of 10 seconds, Elliot 27 investigated the law
connecting the energy of the exciting light and the change in
conductivity induced in stibnite. He assumed the square-root
law to hold, and found that the values of p did not prove the law.
He argues that if unlimited exposures had been used it would
be safe to say that the square-root law would hold for stibnite,
and then concludes that stibnite obeys the law, with £=0.5,
approximately. The conclusion to be drawn from the foregoing
citation is that the experimental data do not indicate a simple
26 Nicholson, Phys. Rev. (2), 3, p. 9, 1914. 27 Elliot, Phys. Rev. (2), 5, p. 59, 1915-
Coblentz]Kahler 1
Physical Properties of Molybdenite 143
square-root law, though for very rough calculations one might
assume the law to obtain.
In view of the uncertainty of the experimental data just cited
it was of interest to make similar tests of the effect of intensity
of the exciting light upon the electrical conductivity of molyb-
denite at 22 C.
For this purpose sample No. i was securely mounted in front
of the spectrometer slit S, Fig. 2. The observations are illus-
trated in Fig. 14, in which curve B gives the sensitivity for an
intensity E = 20, while curve C shows the change in conductivity
produced by an intensity E = 1 . The latter intensity was obtained
by covering the prism with a piece of black cardboard with a
Fig. 13.
—
Photoelectric sensitivity of different crystals of molybdenite
slit in it, which happened to transmit almost exactly one-twentieth
of the initial intensity. The results show that on increasing the
intensity 20 times the spectral photoelectric responses are increased
about 10 times in the region up to 0.75^, 11 times at 1.05/x, and
20 times at 1.8/x. In other words, on increasing the intensity
20 times the change in conductivity produced by energy of wavelengths X = 1.8/x is twice as great as observed at X = 0.75^. These
energy stimuli are indicated by E = 1 and E = 20 in Fig. 15, which
gives a series of isochromatic response curves for various wavelengths and for much higher intensities (40 times greater) than
used in the investigation of the various samples just described.
In Fig. 14 curve A is for limited exposure and curve B for expo-
sure until a steady state is attained, as already described.
144 Scientific Papers of the Bureau of Standards [Voi.ij
Using the data illustrated in Fig. 15, which are for unlimited
exposure (and are considered more accurate than those illus-
trated in Fig. 14), computations were made to test the validity
of the square-root law. The computations show that (see Table
4) the induced change in electrical conductivity is not, as a gen-
eral rule, proportional to the square root of the intensity (energy)
of the radiation stimulus.
For example, selecting wave length X = 0.6252/1, using £ = 2
and E = S (square root of ratio = 2), the corresponding galvano-
meter deflections, d, are 4.4 and 9.8, or a ratio of 2.23 instead
Fig. 14.
—
Effect of intensity of radiation upon spectral photoelectric sensitivity
of 2.0, as would be expected on the basis of the alleged square-
root law.
TABLE 4.—Showing the Relation Between the Intensity E of the Exciting Light
and the Resulting Change in Conductivity, Galvanometer Deflection, d; d=kEP
X= 0.5876m
X=0.625MX= 0.6975 X=0.725 X= 0.882 X=1.44 X= 2.033
Ey Ex dy dxdy
dxdy dx
dy
dxdy dx
dy
dxdy dx
dy
dxdy dx
dy
dxdy dx
dy
dx
4
1
2
2.5
3.0
4
6.6
9.8
11.1
12.5
- 8.5 9.7 12.4 14.1
2.72.44
--
2.73.15
3.52.77
5
2.486
2.35
8 12.1
13.7
15.1
17.9
13.1
15
16.7
19.8
14.9
15.0
19.1
23.1
17.6
20
22.1
19.7
22.1
24.4
10
4.42.22
5
2.425.1
2.546.1
2.446.6
2.6710
1.97
12
5.02.21
5.72.40
6.12.46
7.02.14
9.62.08
11.21.98
16
5.52.27
6.52.32
7.02.39
8.02.38
10.72.06
12.12.02
--
82.24
8.52.34
9.72.38
--
--
CoblentzlKafder J
Physical Properties of Molybdenite 145
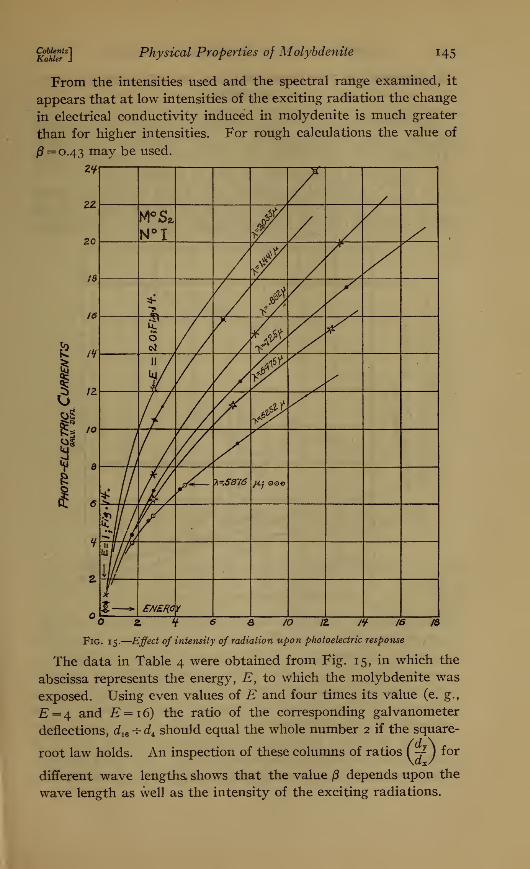
From the intensities used and the spectral range examined, it
appears that at low intensities of the exciting radiation the change
in electrical conductivity induced in molydenite is much greater
than for higher intensities. For rough calculations the value of
/? = 0.43 may be used.
zz
20
;&
16
s
I
IH
12.
10
/ /
f / yV
^*> 7 /
O/
V?/"S
II /
4c / 0,1 //
/ //* // l/fr /
%-. **S876 J4.JOGQ
kj/jf" // 1 frui/y//
SNERC Y
e /o 1Z J* 16 /a
Fig. 15.
—
Effect of intensity of radiation upon photoelectric response
The data in Table 4 were obtained from Fig. 15, in which the
abscissa represents the energy, E, to which the molybdenite was
exposed. Using even values of E and four times its value (e. g.,
E = 4 and E = 1 6) the ratio of the corresponding galvanometer
deflections, d1Q+ d4 should equal the whole number 2 if the square-
root law holds. An inspection of these columns of ratiosy-f)
for
different wave lengths shows that the value /3 depends upon the
wave length as well as the intensity of the exciting radiations.
146 Scientific Papers of the Bureau of Standards [Voi.15
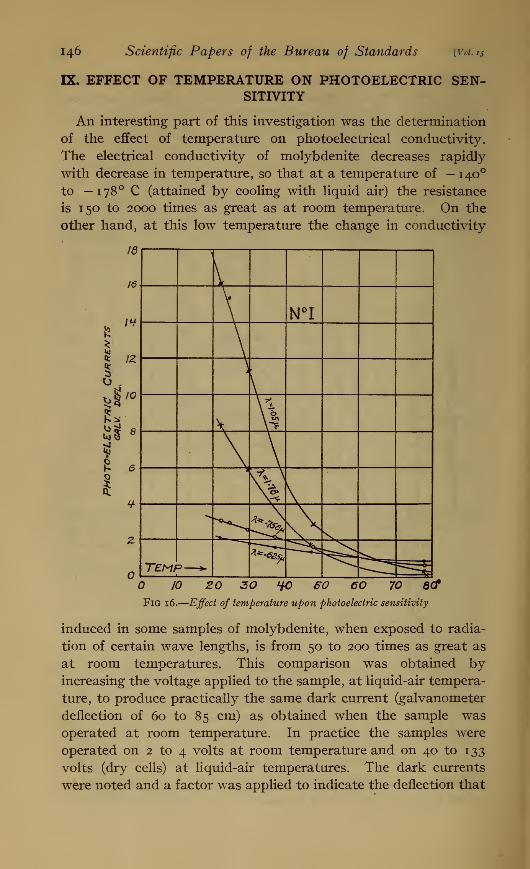
E. EFFECT OF TEMPERATURE ON PHOTOELECTRIC SEN-SITIVITY
An interesting part of this investigation was the determination
of the effect of temperature on photoelectrical conductivity.
The electrical conductivity of molybdenite decreases rapidly
with decrease in temperature, so that at a temperature of — 140
to — 178 C (attained by cooling with liquid air) the resistance
is 150 to 2000 times as great as at room temperature. On the
other hand, at this low temperature the change in conductivity
16
16
a.
I
1
\H
IZ
10
1
\
\ N°I
\\
\
\
**— ^*'-esf,
TEMt=>—>-
10 20 ZO HO SO 60 70 8(f
Fig 16.
—
Effect of temperature upon photoelectric sensitivity
induced in some samples of molybdenite, when exposed to radia-
tion of certain wave lengths, is from 50 to 200 times as great as
at room temperatures. This comparison was obtained byincreasing the voltage applied to the sample, at liquid-air tempera-
ture, to produce practically the same dark current (galvanometer
deflection of 60 to 85 cm) as obtained when the sample was
operated at room temperature. In practice the samples were
operated on 2 to 4 volts at room temperature and on 40 to 133
volts (dry cells) at liquid-air temperatures. The dark currents
were noted and a factor was applied to indicate the deflection that
CoblentzlKahler
Physical Properties of Molybdenite 147
would have been obtained if the sample had shown the same
dark current at these two temperatures. This does not affect
the relative spectral sensitivity curves, but merely gives the
reader some idea of the size of the deflections that would be
expected when the crystal was examined under comparable
conditions.
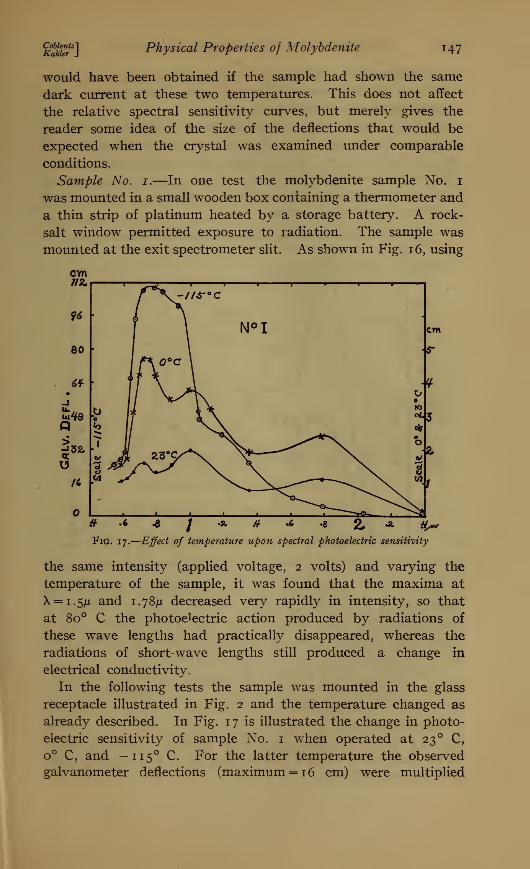
Sample No. 1.—In one test the molybdenite sample No. 1
was mounted in a small wooden box containing a thermometer and
a thin strip of platinum heated by a storage battery. A rock-
salt window permitted exposure to radiation. The sample was
mounted at the exit spectrometer slit. As shown in Fig. 16, using
cm
«
Fig. 17. -Effect of temperature upon spectral photoelectric sensitivity
the same intensity (applied voltage, 2 volts) and varying the
temperature of the sample, it was found that the maxima at
X = i.5/x and 1.78^ decreased very rapidly in intensity, so that
at 8o° C the photoelectric action produced by radiations of
these wave lengths had practically disappeared, whereas the
radiations of short-wave lengths still produced a change in
electrical conductivity.
In the following tests the sample was mounted in the glass
receptacle illustrated in Fig. 2 and the temperature changed as
already described. In Fig. 1 7 is illustrated the change in photo-
electric sensitivity of sample No. 1 when operated at 23 ° C,
o° C, and -115 C. For the latter temperature the observed
galvanometer deflections (maximum = 1 6 cm) were multiplied
148 Scientific Papers of the Bureau of Standards )Vol. 15
by the factor 8, in order to show the approximate sizes of the
deflection to be expected for the same dark current. Thepotential actually applied was 10 volts.
At o° C, sample No. 1 on 2 volts gave a (dark-current) gal-
vanometer deflection of 43 cm and on 4 volts a deflection of 86
cm. Using radiations of X = 0.724^, the corresponding (photo-
electric) galvanometer deflections were 23.5 and 47 mm, respec-
tively, indicating a close proportionality between the dark current
and the photoelectric current.
m [
HZ
80
u-64Id
Q
^5*
f \-J7Z°C
.
N°n.
.
RJ
T /
3 /
y^s2*3'
1
KJ
Ifje
4 -6 .6 I -Z •¥ -6 8 2m * aVt*
Fig. 18.
—
Effect of temperature upon spectral photoelectric sensitivity
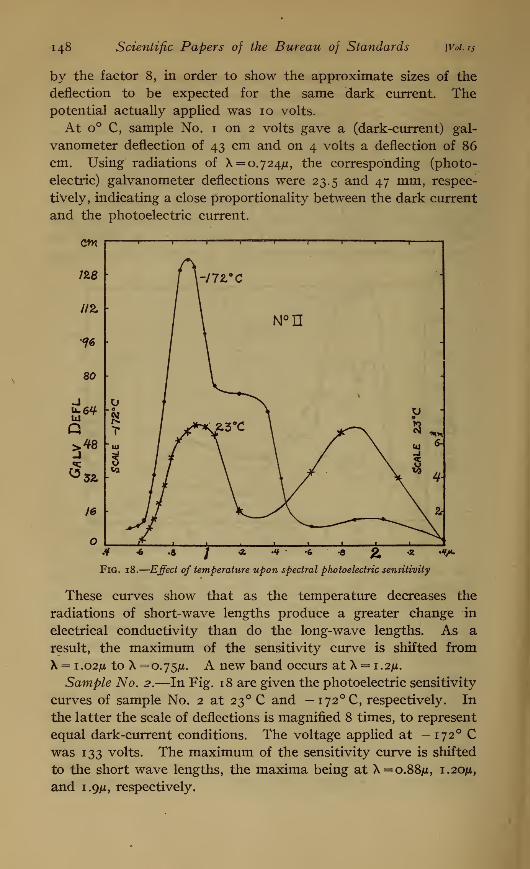
These curves show that as the temperature decreases the
radiations of short-wave lengths produce a greater change in
electrical conductivity than do the long-wave lengths. As a
result, the maximum of the sensitivity curve is shifted from
X = 1 .02jli to X =o.75ju. A new band occurs at X = 1 .2/*.
Sample No. 2.—In Fig. 18 are given the photoelectric sensitivity
curves of sample No. 2 at 23 ° C and — i72°C, respectively. In
the latter the scale of deflections is magnified 8 times, to represent
equal dark-current conditions. The voltage applied at — 172 Cwas 133 volts. The maximum of the sensitivity curve is shifted
to the short wave lengths, the maxima being at X = o.88ju, 1.20/*,
and 1.9JU, respectively.
Coblentz 1
Kahler JPhysical Properties of Molybdenite 149
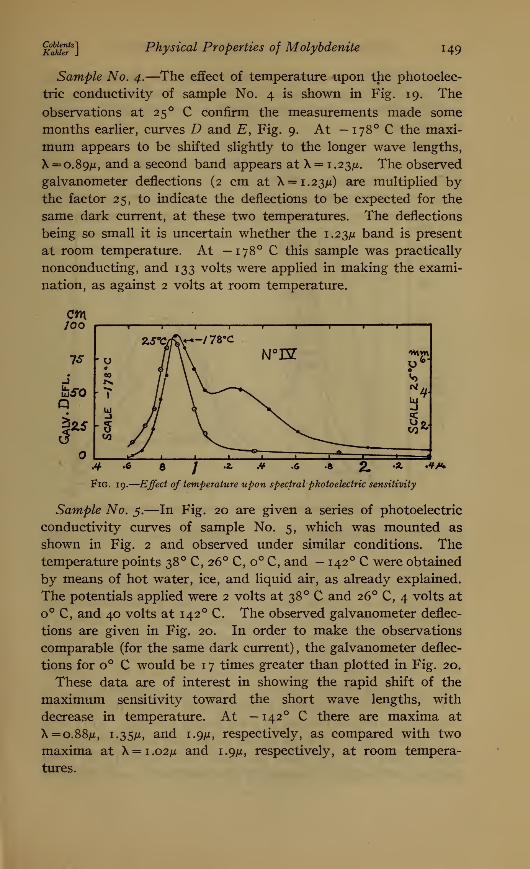
Sample No. 4.—The effect of temperature upon the photoelec-
tric conductivity of sample No. 4 is shown in Fig. 19. The
observations at 25 ° C confirm the measurements made some
months earlier, curves D and E, Fig. 9. At — 178 C the maxi-
mum appears to be shifted slightly to the longer wave lengths,
X =0.89/*, and a second band appears at X = 1.23^1. The observed
galvanometer deflections (2 cm at X = i.23ju) are multiplied bythe factor 25, to indicate the deflections to be expected for the
same dark current, at these two temperatures. The deflections
being so small it is uncertain whether the 1.23/x band is present
at room temperature. At — 178 C this sample was practically
nonconducting, and 133 volts were applied in making the exami-
nation, as against 2 volts at room temperature.
crn/oo
7* r
Jhsoo
ZS*C/f
1 1 '
' u•
N°ET00
*1
Li
111•J
J K'5OQ
—A --T-* -
.^ .6 a / •*> .* •* •» 2. *a ,¥/<»
Fig. 19.
—
Effect of temperature upon spectral photoelectric sensitivity
Sample No. 5.—In Fig. 20 are given a series of photoelectric
conductivity curves of sample No. 5, which was mounted as
shown in Fig. 2 and observed under similar conditions. Thetemperature points 38°C, 26°C,o°C, and - 142 C were obtained
by means of hot water, ice, and liquid air, as already explained.
The potentials applied were 2 volts at 38 ° C and 26 C, 4 volts at
o° C, and 40 volts at 142 C. The observed galvanometer deflec-
tions are given in Fig. 20. In order to make the observations
comparable (for the same dark current) , the galvanometer deflec-
tions for o° C would be 1 7 times greater than plotted in Fig. 20.
These data are of interest in showing the rapid shift of the
maximum sensitivity toward the short wave lengths, with
decrease in temperature. At — 142 C there are maxima at
X = o.88/x, 1.35m, and 1.9/x, respectively, as compared with two
maxima at X = i.o2ju and i.gji, respectively, at room tempera-
tures.
150 Scientific Papers of the Bureau of Standards [Voi.i5
In view erf the long time required in order to obtain the data
at i.Sn, the irregularities in the relative intensities and in the
position of the maximum are probably to be attributed to experi-
mental errors.
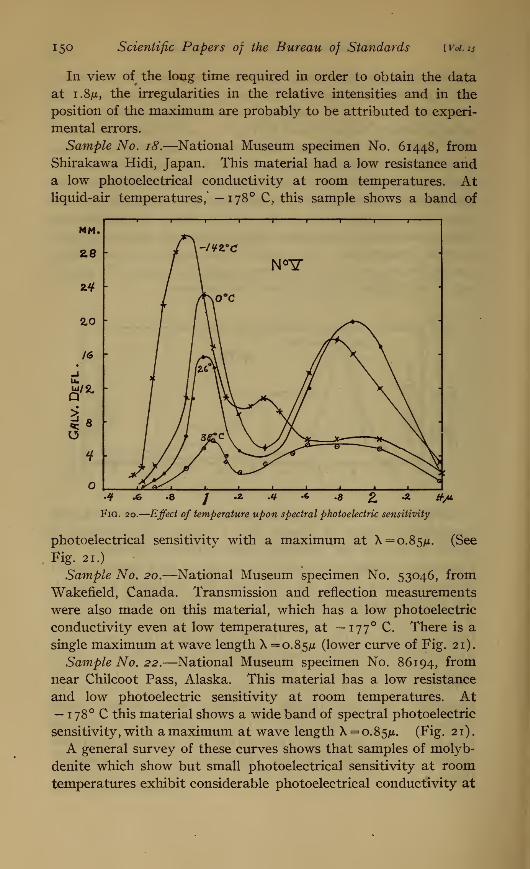
Sample No. 18.—National Museum specimen No. 61448, fromShirakawa Hidi, Japan. This material had a low resistance anda low photoelectrical conductivity at room temperatures. Atliquid-air temperatures,' — 178 C, this sample shows a band of
MM.
£8 f\'/fZ.9C
N°V-
Zt
I n\°°c
•
2,0 /^\
/<s y jk \
u.
P1 lPx\
\ \
^8I If 3£cV\
\\
Hs ^^v^ \
,i 1 1
.? A .8 /A .if .6 .8 2. * •*/*
Fig. 20.
—
Effect of temperature upon spectral photoelectric sensitivity
photoelectrical sensitivity with a maximum at X = o.85/x. (See
Fig. 21.)
Sample No. 20.—National Museum specimen No. 53046, from
Wakefield, Canada. Transmission and reflection measurements
were also made on this material, which has a low photoelectric
conductivity even at low temperatures, at — 177 C. There is a
single maximum at wave length X = 0.85^1 (lower curve of Fig. 21).
Sample No. 22.—National Museum specimen No. 86194, from
near Chilcoot Pass, Alaska. This material has a low resistance
and low photoelectric sensitivity at room temperatures. At— 1
78 ° C this material shows a wide band of spectral photoelectric
sensitivity, with a maximum at wave length X = 0.85/1. (Fig. 21).
A general survey of these curves shows that samples of molyb-
denite which show but small photoelectrical sensitivity at roomtemperatures exhibit considerable photoelectrical conductivity at
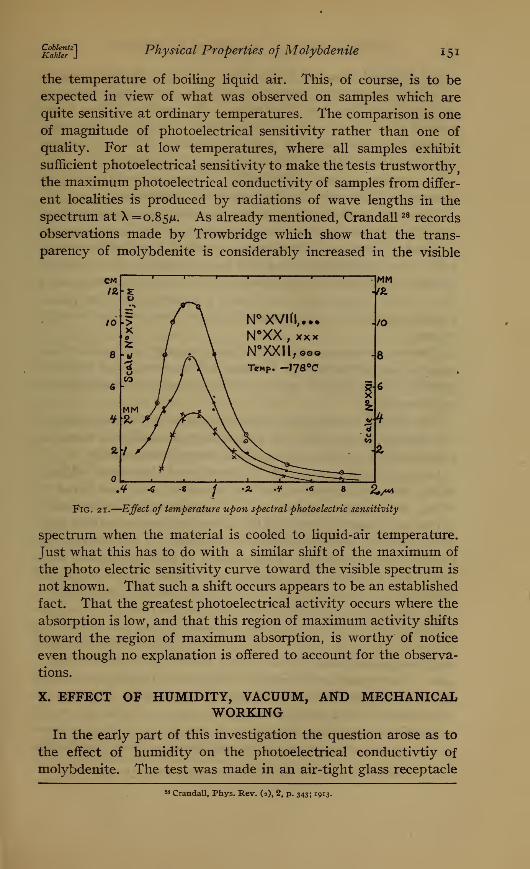
Coblentz]Kahler J
Physical Properties of Molybdenite I5i
the temperature of boiling liquid air. This, of course, is to beexpected in view of what was observed on samples which are
quite sensitive at ordinary temperatures. The comparison is one
of magnitude of photoelectrical sensitivity rather than one of
quality. For at low temperatures, where all samples exhibit
sufficient photoelectrical sensitivity to make the tests trustworthy?
the maximum photoelectrical conductivity of samples from differ-
ent localities is produced by radiations of wave lengths in the
spectrum at X = 0.85^. As already mentioned, Crandall 28 records
observations made by Trowbridge which show that the trans-
parency of molybdenite is considerably increased in the visible
Fig. 21.
—
Effect of temperature upon spectral photoelectric sensitivity
spectrum when the material is cooled to liquid-air temperature.
Just what this has to do with a similar shift of the maximum of
the photo electric sensitivity curve toward the visible spectrum is
not known. That such a shift occurs appears to be an established
fact. That the greatest photoelectrical activity occurs where the
absorption is low, and that this region of maximum activity shifts
toward the region of maximum absorption, is worthy of notice
even though no explanation is offered to account for the observa-
tions.
X. EFFECT OF HUMIDITY, VACUUM, AND MECHANICALWORKING
In the early part of this investigation the question arose as to
the effect of humidity on the photoelectrical conductivtiy of
molybdenite. The test was made in an air-tight glass receptacle
28 Crandall, Phys. Rev. (2), 2, p. 343; 1913.
152 Scientific Papers of the Bureau of Standards [Voi.15
which replaced the glass tube G, Fig. 2. Provision was made to
introduce phosphorus pentoxide into the vessel and sealing it
without disturbing the adjustments. An interval of four hours
elapsed after introducing the dehydrating material. The obser-
vations were made at 25 ° C with the humidity of the surrounding
air amounting to 81 per cent or 12.1 g per cubic meter.
The results obtained show that this amount of moisture had no
observable effect upon the photoelectrical conductivity.
Observations of the effect of air upon photoelectrical change in
conductivity were made, using the sample in the glass receptacle
G, Fig. 2. Keeping the temperature constant, the results obtained
with the molybdenite in air and a vacuum show that the spectral
photoelectric sensitivity curve was not affected by the surrounding
air. Recent experiments of Tisdale 29 indicate that the photo-
electric conductivity of selenium is affected by gases and metallic
vapors.
The conclusion arrived at is that the photoelectrical conductivity
observed in molybdenite is inherent in the crystal, and that this
property is not affected by the ordinary changes in humidity andgas pressure.
One line of investigation which requires further attention is
the effect produced upon the photoelectrical sensitivity when the
surface of the molybdenite sample is worked mechanically.
In a previous investigation 30 it was found that silver sulphide
which had been prepared in the laboratory and subjected to
rolling and hammering was not very sensitive photo-electrically.
On the other hand, a sample of the natural mineral, acanthite Ag2S,
was rendered photoelectrically insensitive by hammering the
crystals into a flat plate. Furthermore, in this preliminary work
there was evidence that samples of molybdenite were photo-
electrically less sensitive after rubbing and polishing the lamina.
In the present tests the sample was soldered to No. 26 copper-
wire electrodes (see Fig. 10) and a sensitive spot was located bymeans of the radiophone. This photoelectrically sensitive spot
was then pressed and rubbed with a smooth, flat, wooden tooth-
pick. On reexamination (using a radiophone) , the spot was found
less sensitive photoelectrically than it was before subjecting it
to pressure. No material having been removed in the process of
rubbing and smoothing the surface, it would appear that destruc-
tion of crystal structure may have something to do with the change
29 Tisdale, Phys. Rev. (2), 12, p. 325; 1918. 30 This Bulletin, 14, p. 591; 1918.
SSL]
Physical Properties of Molybdenite 153
in photoelectric sensitivity. Sometimes laminae of molybdenite
are found which contain pockets of line crystalline material, and
it is not unreasonable to suppose that crystals of microscopic size
are included in the regular lamina.
XI. PHOTOELECTRIC SENSITIVITY VERSUS CURRENTRECTIFICATION
In the course of this investigation it was observed, as already
mentioned, that samples of molybdenite which are photo-
electrically sensitive have a considerably higher electrical resist-
ance (see Table 3) than samples which are not sensitive to light.
Moreover, the conductivity of the insensitive samples was found
to be quite independent of the direction in which the current
passed (lengthwise) through the crystal.
On the other hand, samples of molybdenite which are sensitive
photoelectrically were found to possess a much higher conduc-
tivity when the electric current (from a 4-volt battery) waspassed in one direction than when it was passed in the opposite
direction through the crystal. As shown in Table 3, this differ-
ence in current leakage (dark current), as dependent upon the
direction of the current through the crystal, varied from 10 to 30
per cent for different crystals. In observing the foregoing sen-
sitivity curves, the photoelectric current was therefore propor-
tionately increased by connecting the crystal into the battery
circuit in the proper direction to obtain the maximum change in
photoelectric conductivity.
In view of these observations it was of interest to determine
whether there is any connection between photoelectric sensitivity
and the rectifying action which occurs when the crystal is placed
in a high frequency oscillating circuit. 31
For this purpose crystals (size 10 by 4 by 0.1 mm) were selected
which showed one or two small photoelectrically sensitive spots,
but which were quite insensitive throughout the remainder of the
surface of the crystal.
These sensitive spots were mapped by projecting a spot of light
upon the sample, the change in conductivity being detected bymeans of the radiophonic apparatus described elsewhere in this
paper. In Figs. 10 and 11 the rectangular areas represent the
sample soldered to copper-wire electrodes. The photoelectrically
sensitive spots are represented by the cross-hatched areas.
31 These data were obtained in collaboration with Dr. Louise S. McDowell and reported upon at the
meeting of the American Phys. Soc, December, 1918; Phys. Rev.. 13, p. 154, 1919.
154 Scientific Papers of the Bureau of Standards [Voi.15
The rectification tests were made by means of an ordinary-
tuned buzzer circuit. The telephone and detector, in series, were
placed in parallel with the condenser of the secondary circuit.
The coupling was adjusted to produce strong oscillations in the
secondary circuit.
The molybdenite crystal was explored for rectification bytouching the surface by means of a fine metal point.- In Figs. 10
and 11 the dark points in the rectangular areas represent spots
showing current rectification, the size of the spot representing the
magnitude of the effect observed.
The results of these tests show that the low-resistance, photo-
electrical]y insensitive samples of molybdenite are far moreefficient rectifiers than the high-resistance light-sensitive speci-
mens. One specimen which showed no photoelectric sensitive-
ness,, whatever, as determined by a sensitive galvanometer, pro-
duced decided rectification over almost its entire surface. In
fact, it was difficult to find a spot which produced no rectifica-
tion. On the other hand, the samples of molybdenite having a
high resistance exhibited the rectifying action only in spots,
which usually did not coincide with the photoelectrical!y sensitive
spots. These radioelectrically sensitive spots were widely scat-
tered over the surface, but sometimes comparatively large areas
were found which showed no electrical rectification, as indicated
by the telephone. Only the most sensitive spots of the high-
resistance material produced a rectification approaching that of
the specimens having a low resistance.
In two instances especially electrically sensitive spots were
found upon the light-sensitive areas (see Fig. 10, No. VII), but
other equally sensitive spots occurred in the areas which were
photoelectrically insensitive. This test alone would seem to be
sufficient to prove that the two phenomena are not intimately
connected.
The conclusions to be drawn are, therefore, that (1) the low-
resistance, photoelectrically insensitive molybdenite exhibits muchgreater rectifying action than the high-resistance photoelectri-
cally sensitive specimens; (2) there is no apparent relation between
the electrical rectification and the photoelectiic change in con-
ductivity observed in molybdenite.
Kola!!?3
]Physical Properties of Molybdenite
'
155
1. EXUDATION OF A DARK-BLUB LIQUID
One of the numerous questions requiring further investigation is
the exudation of a dark-blue liquid from some samples of molybde-
nite. At the beginning of this investigation it was found that some
samples became a black amorphous mass in spots when electric
current was passed thiough them. The behavior of one sample
deserves description. In making the preliminary sensitivity
tests this sample was clamped between heavy brass electrodes
and tested for local sensitivity, using an audion. amplifier and tele-
phone receiver. It was found that one end of this sample, close
to the electrode, was unusually sensitive, causing a loud note to
be emitted by the telephone receiver. On examination a bubble
of liquid was found in violent ebullition. Exposure of this bubble
to Hght produced a change in electric current and hence a sound
in the telephone receiver. Other samples were found which be-
came dark masses in spots which did not appear to be markedly
sensitive photoelectrically.
The presence of a dark-blue liquid (probably the "blue oxide"
described by Guichard 32) on a surface of a molybdenite detector
is mentioned by Huizinga 32. According to Guichard the blue
oxide of molybdenum is a colloid which is extremely soluble in
water.
In view of the foregoing experiments, further tests were madeon the production and the photoelectric sensitivity of this dark
substance. In order to produce this dark substance, the end of a
thin platinum wire was placed in contact with the surface of a
sample of molybdenite, and this combination was joined in series
with a dry battery of 10 to 75 volts and an audion amplifier. It
was found that a black viscous mass was formed on the high-
resistance, photoeJectrically sensitive samples, but no blackening
of the surface occurred at the point of contact of the platinum
wire with the surface of samples of molybdenite which had a low
resistance. This black substance, which indicated an acid re-
action when tested with litfnus paper, was formed irrespective of
the direction of the electric current. Tested with an iron-constan-
tan thermocouple of fine wires, the temperature rise at the point
of contact of the platinum wire with the molybdenite was the
higher for the low-resistance material. It would, therefore, seem
that this is not a phenomenon resulting alone from a high tempera-
32 Guichard, Ann. Chimie et Physique (7), 23, p. 519, 1901; Huizinga, Proc. K. Akad. Amsterdam, 19,
p. 513, 1917.
156 Scientific Papers of the Bureau of Standards [Voi.i5
tare. This blue substance becomes hard and brittle on breaking
the electric circuit and is easily removed by touching the surface
with a bit of cotton moistened with water.
For the photoelectric test a spot of thin, dark substance, about
3 mm in diameter, was formed surrounding the point of contact
of the platinum point with the surface of a sample of molybdenite
of average photoelectric sensitivity. Light of high intensity pass-
ing through the rotating sectored disk was projected upon this
viscous, bubbling substance. Sensitivity tests were made before
the formation of this substance, also during its formation, and
again after its removal. The results showed that, if anything, the
presence of this substance decreased the photoelectric sensitivity
of the sample. In other words, this blue oxide does not appear
to be sensitive photoelectrically.
A further observation worth mentioning is that the bunsen-
flame spectrum of molybdenite shows more sodium in the photo-
electrically sensitive samples than in the nonsensitive material.
Evidently this whole subject needs further investigation.
XII. THEORETICAL APPLICATIONS
It is of interest to notice the bearing of the foregoing data upon
theories of photoelectrical conduction. Pfund 33 has proposed a
theory based on electronic conduction, the electrons being set free
by the incident radiations. Among others, he has sought a con-
nection between optical absorption and photoelectrical activity.
He avoids the apparent inconsistency of greatest photoelectrical
activity in the region of the spectrum where the absorption is the
least by assuming a critical thickness at which change of resistance
sets in. In the region of greatest absorption the rays do not pene-
trate deeply and the current-carrying layer is less than this critical
thickness. In the more transparent regions of the spectrum the
depth of penetration is greater; the current-carrying layer be-
comes greater than the critical thickness and hence a greater
change in conductivity is possible. It is assumed that the light
is effective in producing changes in resistance only until the
amplitude has decreased to a certain minimum value, below which
its effectiveness is lost. This agrees with the resonance theory,
since no electrons are expelled from the atom until the amplitude
due to resonance exceeds a definite minimum value.
33 Pfund, Phys. Rev., 28, p. 324, 1909.
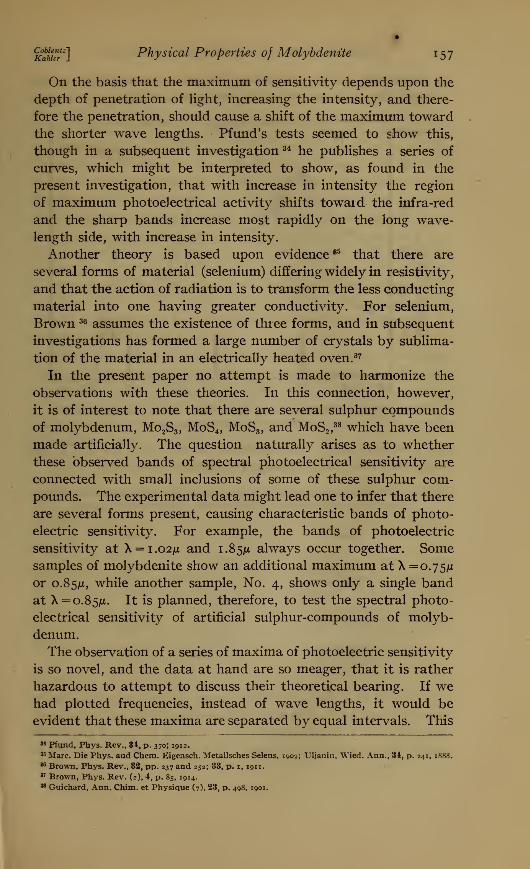
CoblentzKattlcr
Physical Properties of Molybdenite 157
On the basis that the maximum of sensitivity depends upon the
depth of penetration of light, increasing the intensity, and there-
fore the penetration, should cause a shift of the maximum toward
the shorter wave lengths. Pfund's tests seemed to show this,
though in a subsequent investigation 34 he publishes a, series of
curves, which might be interpreted to show, as found in the
present investigation, that with increase in intensity the region
of maximum photoelectrical activity shifts towaid the infra-red
and the sharp bands increase most rapidly on the long wave-
length side, with increase in intensity.
Another theory is based upon evidence 85 that there are
several forms of material (selenium) differing widely in resistivity,
and that the action of radiation is to transform the less conducting
material into one having greater conductivity. For selenium,
Brown 36 assumes the existence of three forms, and in subsequent
investigations has formed a large number of crystals by sublima-
tion of the material in an electrically heated oven. 37
In the present paper no attempt is made to harmonize the
observations with these theories. In this connection, however,
it is of interest to note that there are several sulphur compoundsof molybdenum, Mo
2S3 , MoS4 , MoS3 , and MoS2 ,
38 which have been
made artificially. The question naturally arises as to whether
these observed bands of spectral photoelectrical sensitivity are
connected with small inclusions of some of these sulphur com-
pounds. The experimental data might lead one to infer that there
are several forms present, causing characteristic bands of photo-
electric sensitivity. For example, the bands of photoelectric
sensitivity at X = i.o2ju and 1.85/1 always occur together. Somesamples of molybdenite show an additional maximum at X =0.75^
or 0.85/1, while another sample, No. 4, shows only a single bandat X=o.85ju. It is planned, therefore, to test the spectral photo-
electrical sensitivity of artificial sulphur-compounds of molyb-
denum.
The observation of a series of maxima of photoelectric sensitivity
is so novel, and the data at hand are so meager, that it is rather
hazardous to attempt to discuss their theoretical bearing. If wehad plotted frequencies, instead of wave lengths, it would be
evident that these maxima are separated by equal intervals. This
34 Pfund, Phys. Rev., 34, p. 370; 1912.
35 Marc. Die Phys. and Chem. Eigensch. Metallsches Selens, 1909; Uljanin, Wied. Ann., 34, p. 241, 1888.
86 Brown, Phys. Rev., 32, pp. 237 and 252; 33, p. 1, 1911.
37 Brown, Phys. Rev. (2), 4, p. 85, 1914.38 Guichard, Ann. Chim. et Physique (7), 23, p. 498, 1901.
158 Scientific Papers of the Bureau of Standards [Voi.is
is illustrated in Fig. 22, where the data given in Fig. 17 are
plotted, the abscissae being the reciprocals of the wave lengths
*o~%Fig 22.
—
Spectral photoelectric sensitivity plotted against frequency instead of
wave length of the radiation stimulus
(in /x =0.001 mm). The ordinates of the curve for 23 C are
magnified three times, in order to facilitate comparsion.
TABLE 5.—Maxima of Photoelectric Sensitivity and the Wave Number, n, or Com-mon Difference Between the Reciprocals of these Wave Lengths
Sample Sample
No. 1:
23° C ...^X=1.02mC n_ 42lx=1.78M
>n_4Z
No. 2:
-172° C...|X=0.88. n ,n
..Jx=1.20>"= 3°
lx=1.90>n=31
0°C|X=0.73. n . n
... X=1.04>°=$lx=1.78
>n- 40
No. 3:
22° C.|X=0.73. „ , n
lx=1.82>n~ 42
-115° C...(X=0.75. -,
..Jx=0.93>"=^[X=1.2 >n=2°
No. 4:
-178° C... ix=?f3>n= 31
As shown in Table 5, the difference in the frequency maxima or
wave number is n = 40 for room temperature ; while at low tempera-
tures it is n = 25 in some cases and n = 30, just as though there were
several kinds of crystals present. The data on samples No. 2 and
Kau£z
]Physical Properties of Molybdenite 159
No. 4 would seem to indicate, as already noted, that the great
variation in photoelectric sensitivity seems to be one of degree of
sensitivity and not one of quality.
It is to be noted that the spectral lines represent an emission of
thermal radiation as the result of (electrical) excitation of gas ions
or electrons, whereas in the present case thermal radiations of
certain frequencies produce marked changes in the electrical con-
ductivity of the substance. On the resonance theory one would be
led to expect fundamental and harmonic frequencies which are
capable of producing marked changes in electrical conductivity.
On this basis one would expect to find additional harmonic bands,
which for sample No. 1 should occur at \=o.^6ijl and X = 6.5ju.#
As a matter of fact this sample is quite sensitive in the visible
spectrum (see Fig. 14) , but this question was not foreseen and the
energy calibration was not sufficiently accurate to establish a
maximum at this wave length.
Before discussing the data more closely, it will be desirable to
make a further examination of these samples, using a very muchlarger dispersion, which will give greater purity of the radiation
stimulus in the region of 0.6/x to i.2ju. As matters now stand, it is
not apparent, in some cases, why the band at 0.72/1 is absent if it
is harmonic with the bands at i.o2ju and 1.78/x.
XIII. SUMMARYThe present paper gives data on the change in the electrical con-
ductivity of molybdenite when exposed to thermal radiations of
wave lengths extending from wave length \=o.36/x in the ultra-
violet to beyond X = 9/1 in the infra-red.
The radiations of wave lengths extending from the ultra-violet to
about 3m produce a change in the electrical conductivity of molyb-
denite. The effect of temperature, humidity, intensity of the
exciting light, etc., upon the photoelectrical sensitivity of molybde-
nite was investigated. Atmospheric humidity does not appear to
affect the shape of the spectral photoelectric sensitivity curve.
The effect of increasing the intensity of the exciting radiations
appears to be to produce a more rapid response in the long wavelengths than in the short wave lengths, with a resultant shift of
the spectral photoelectric sensitivity curve toward the long wavelengths.
There is no simple law governing the variation in the photo-
electric response in molybdenite, with variation in intensity of the
radiation stimulus.
160 Scientific Papers of the Bureau of Standards [Voi.15
At room temperatures there are maxima of sensitivity in the
region of X = 0.7//, 0.85,11, 1.02/x, and 1.8/x. Beyond 2.5/x the photo-
electric sensitivity is practically nil.
Raising the temperature causes a rapid decrease in the spectral
photoelectric sensitivity, especially in the regions of 1.02/A to i.8ju.
At 8o° C. the spectral photoelectric sensitivity has practically dis-
appeared, only slight indications being observed for radiations of
wave lengths X = o.6/x to o.8m.
The effect produced by lowering the temperature is to greatly
increase the sensitivity curve throughout the whole spectrum from
the ultra-violet to 2.5/x in the infra-red. This increase in sensi-
tivity is greatest in the region of 0.8^ to 0.9ju, so that at the tem-
perature of boiling liquid air the maximum sensitivity occurs at
about 0.85/4, with a new band at 1.25/z to 1.35/1. Samples of
molybdenite which are quite insensitive at room temperatures be-
come fairly sensitive, photoelectrical ly, at - 178 C. At low tem-
peratures the spectral photoelectric sensitivity curves of all sam-
ples are quite similar, with a maximum in the region of 0.8/i to
o.9ju. From this it would appear that this photoelectric property
is one of degree rather than one of quality. The fact that the
bands at 1.02/* and i.8/j occur together, and that the 0.85/* band
may occur alone suggests the possibility that they are character-
istic bands of spectral photoelectric sensitivity of different sulphur
compounds of molybdenum.Using frequency instead of wave length to indicate the spectral
position of the radiations which cause the maximum change in
electrical conductivity, it is found that in some instances there is a
constant difference of the wave numbers analogous to the series
relations of spectral lines.
The time required for recovery of equilibrium in electrical
conductivity is close to twice the time of exposure.
Mechanical working of the material appears to lower the photo-
electric sensitivity.
There appears to be no close connection between photoelectric
sensitivity and current rectification in molybdenite.
Measurements of reflecting power show that molybdenite has a
high reflectivity in the violet, which decreases to a uniform value
beyond 1/1. Similarly, the transmission is high and uniform
beyond ijtx in the infra-red. Using these data refractive indices
were computed, indicating a value of n = 3 for wave lengths greater
than ifx.
The greatest photoelectrical activity occurs in the region of the
spectrum, where there is a rapid decrease in spectral absorption.
APPENDIX
Appendix 1.—PHOTOELECTRIC ACTIVITY INDUCED IN UNILLUMINATEDPARTS OF A CRYSTAL
It was shown by Brown and Sieg 39 that light falling upon one part of a crystal of
selenium produced a change in conductivity throughout the crystal. In one sample
this effect was produced by illuminating the crystal at a distance of 8 to 10 mm from
the point of contact of the electrodes. Subsequent tests by Brown 40 did not disclose
whether this light action is transmitted as a result of change in crystalline structure,
elastic vibration, or merely by diffusion.
This observation of a change in conductivity in portions of a crystal not directly
illuminated has been tested also on cuprous oxide, by Pfund. 41 He found that if
cuprous oxide shows this transmitted effect at all, it is infinitesimal in comparison
with that observed in selenium.
It was of interest, therefore, to determine whether one part of a crystal of molyb-
denite undergoes a change in conductivity when another part of this same crystal is
exposed to radiation. This test is best performed by illuminating a portion of the
crystal which extends beyond the point of contact of the electrodes. In one test a
platinum wire touching the surface of the molybdenite was used for one of the elec-
trodes. When this platinum point was placed so that the exciting light fell between
the two electrodes, the sample of molybdenite changed in conductivity, as indicated
by the sound in the radiophone. On placing this platinum point so that the exciting
light fell outside of these two electrodes no sound was produced in the radiophone.
Various tests showed that illuminating one portion of a sensitive sample of molyb-
denite does not induce a change in conductivity in an unilluminated (but equally
sensitive) portion of this same crystal. In other words, no change in conductivity
appears to be produced by diffusion, internal reflection, etc., in molybdenite.
Appendix 2.—POLARIZATION BY REFLECTION FROM MOLYBDENITE
Pfund ^ has shown that a selenium mirror provides an excellent means for pro-
ducing polarized radiations. In view of the fact that molybdenite has a higher
reflecting power than selenium, it was of interest to determine its polarizing proper-
ties. For this purpose two thin plates of molybdenite were mounted upon glass
plates, as already described in the reflectivity measurements. The one was used as
a polarizer and the other as an analyzer. These two mirrors were placed in an appa-
ratus which permitted rotation of the analyzer. The source of (undispersed) radiation
was a Nernst glower. The intensities were measured with a thermopile and gal-
vanometer. *
The galvanometer deflections were noted (i) when the planes of the polarizer andanalyzer were parallel and (2) when they were crossed. Using mirrors of selenium,
the ratio of the galvanometer deflections for these two positions (parallel: crossed)
was of the order of 800:1; for maximum polarization.
39 Brown and Sieg, Phil. Mag. (6), 28, p. 497; 1914. « Pfund, Phys. Rev. (2), 7, p. 296; 1916.
40 Brown, Phys. Rev. (2), 5, p. 404; 1915. i2 Pfund, Astrophys, Jr., 24, p. 19; 1906.
161
*62 Scientific Papers oj the Bureau of Standards [Voi.15
Using mirrors of molybdenite for maximum polarization, the ratio of the galva-
nometer deflections for these two positions (parallel: crossed) was only about 8:1.
Evidently molybdenite is not suitable for producing plane polarized light.
- In view of the high reflecting power of molybdenite it was of interest to determine
whether it transforms plane into elliptically polarized light, as is true of a metal.
The test was made with plane polarized radiations from a selenium mirror, which
were reflected from the molybdenite mirror in the manner described by Pfund.
Preliminary tests with radiations transmitted by red glass showed that, for the
spectral region from 1 to 4/*, calcite reflects vitreously (i. e., does not transform plane
into elliptically polarized light), as previously observed.
Similar tests on molybdenite, MoS2 , showed that plane polarized radiations (X=iju
to 4fi) are elliptically polarized, the ellipticity (ratio of axes) being about 3:1. Simi-
larly, a very flat cleavage surfaceof stibnite, Sb 2S3 ,produced an ellipticity of about 12:1.
These ratios are of course not very accurate, but they are consistent in that molybde-
nite is more metallic (judged by its elliptic polarization) than stibnite; also in having
a higher reflecting power and especially a higher absorption coefficient. An investi-
gation of the optical properties of substances like the above, which lie on the border-
land between metals and nonmetals, would no doubt prove profitable.
Washington, December 18, 191 8.


![Compressibility and thermal expansion of petroleum …nvlpubs.nist.gov/nistpubs/jres/5/jresv5n5p985_A2b.pdf · Jessup] CompressibilityofOils 987 mountedbehindthecapillaryUtube,gh.Theentireapparatus](https://static.fdocuments.in/doc/165x107/5aa76b257f8b9a294b8c0aae/compressibility-and-thermal-expansion-of-petroleum-compressibilityofoils-987.jpg)


