Electrochemical analysis: studies of acids, bases, and...
112
onal Bureau 01 avauuo*" jibrary, N.W. Bldg NBS 400 ELECTROCHEMICAL ANALYSIS: STUDIES OF ACIDS, BASES, AND SALTS BY EMF, CONDUCTANCE, OPTICAL, AND KINETIC METHODS JULY 1965 TO JUNE 1966 : 1 I t +** ° F *oA Edited by Roger G. Bates *<">cau of ' U.S. DEPARTMENT OF COMMERCE National Bureau of Standards I IBS Hi '.:::.:
Transcript of Electrochemical analysis: studies of acids, bases, and...
onal Bureau 01 avauuo*"
jibrary, N.W. Bldg
NBS
400
ELECTROCHEMICAL ANALYSIS:
STUDIES OF ACIDS, BASES, ANDSALTS BY EMF, CONDUCTANCE,OPTICAL, AND KINETIC METHODSJULY 1965 TO JUNE 1966
:
1I
t+** °F
*oA
Edited by Roger G. Bates
*<">cau of'
U.S. DEPARTMENT OF COMMERCENational Bureau of Standards
IIBSHi'.:::.:
THE NATIONAL BUREAU OF STANDARDS
The National Bureau of Standards is a principal focal point in the Federal Government for assur-
ing maximum application of the physical and engineering sciences to the advancement of technology
in industry and commerce. Its responsibilities include development and maintenance of the national
standards of measurement, and the provisions of means for making measurements consistent with
those standards; determination of physical constants and properties of materials; development of
methods for testing materials, mechanisms, and structures, and making such tests as may be neces-
sary, particularly for government agencies; cooperation in the establishment of standard practices
for incorporation in codes and specifications; advisory service to government agencies on scientific
and technical problems; invention and development of devices to serve special needs of the Govern-
ment; assistance to industry, business, and consumers in the development and acceptance of com-mercial standards and simplified trade practice recommendations; administration of programs in
cooperation with United States business groups and standards organizations for the development
of international standards of practice; and maintenance of a clearinghouse for the collection anddissemination of scientific, technical, and engineering information. The scope of the Bureau's
activities is suggested in the following listing of its three Institutes and their organizational units.
Institute for Basic Standards. Applied Mathematics. Electricity. Metrology. Mechanics. Heat.
Atomic Physics. Physical Chemistry. Laboratory Astrophysics.* Radiation Physics. Radio Standards
Laboratory:* Radio Standards Physics; Radio Standards Engineering. Office of Standard Reference
Data.
Institute for Materials Research. Analytical Chemistry. Polymers. Metallurgy. Inorganic Mate-
rials. Reactor Radiations. Cryogenics.* Materials Evaluation Laboratory. Office of Standard Refer-
ence Materials.
Institute for Applied Technology. Building Research. Information Technology. PerformanceTest Development. Electronic Instrumentation. Textile and Apparel Technology Center. Technical
Analysis. Office of Weights and Measures. Office of Engineering Standards. Office of Invention andInnovation. Office of Technical Resources. Clearinghouse for Federal Scientific and Technical
Information.**
Located at Boulder, Colorado, 80302.** Located at 5285 Port Royal Road, Springfield, Virginia, 22151.
UNITED STATES DEPARTMENT OF COMMERCE • John T. Connor, Secretary
NATIONAL BUREAU OF STANDARDS • A. V. Astin, Director
NBS TECHNICAL NOTE 400Issued September 6, 1966
ELECTROCHEMICAL ANALYSIS: STUDIES OF
ACIDS, BASES, AND SALTS BY EMF, CONDUCTANCE,
OPTICAL, AND KINETIC METHODSJULY 1965 TO JUNE 1966
Edited by Roger G. Bates
Electrochemical Analysis Section
Analytical Chemistry Division
Institute for Materials Research
NBS Technical Notes are designed to supplement the
Bureau's regular publications program. They provide a
means for making available scientific data that are of
transient or limited interest. Technical Notes may be
listed or referred to in the open literature.
For sale by the Superintendent of Documents, U.S. Government Printing Office
Washington, D.C., 20402 - Price 55 cents

FOREWORD
The Analytical Chemistry Division was established as
a separate division at the National Bureau of Standards on
September 1, 196j>, and became part of the Institute for
Materials Research in the February 1, 1964, reorganization.
It consists at present of nine sections and about 100 tech-
nical personnel encompassing some 45 different analytical
competences from activation analysis and atomic absorption
to vacuum fusion and X-ray spectroscopy. These competences,
and in turn the sections which they comprise, are charged
with research at the forefront of analysis as well as aware-
ness of the practical sample, be it standard reference
material or service analysis. In addition it is their
responsibility to inform others of their efforts.
Formal publication in scientific periodicals is highly
important. In addition, however, it has been our experi-
ence that informal, annual summaries of progress describing
efforts of the past year can be very valuable in disseminat-
ing information. At the National Bureau of Standards such
publications fit logically into the category of a Technical
Note. In 1966 we plan to issue these summaries for all of
our sections. The following is the second annual report on
progress of the Electrochemical Analysis Section.
W. Wayne Meinke, ChiefAnalytical Chemistry Division
ii
PREFACE
This is the second in a series of annual progress
reports of the Electrochemical Analysis Section of the
Analytical Chemistry Division. The report covers the
fiscal year 1966, which "began on July 1, 1965, and ended
on June 30, 1966.
Many of the processes and reactions of analytical
interest take place in solutions, and a large fraction of
these involve ionized solutes. If the research programs
of the Electrochemical Analysis Section were to "be placed
in a single broad category, undoubtedly "Solution Electro-
chemistry" would "be a. fair choice, with primary emphasis
on acid-base phenomena, solvent effects on the behavior of
electrolytes, and potentiometry with reversible electrodes.
Competence in polarography and coulometry exists elsewhere
in the Analytical Chemistry Division] hence, these areas
are not a part of the research activity of the Electro-
chemical Analysis Section. In line with a uniform policy
of the Division, the Section's programs have both research
and sample aspects. During the fiscal year Just ending,
about 70 percent of the total effort was devoted to re-
search, while 20 percent was devoted to programs on Standard
Reference Materials and 10 percent to Other-Agency programs.
The outstanding event of the present year was the long-
awaited move to the excellent new facility at Gaithersburg,
Md. The move and the attendant loss of time during re-
settlement have inevitably left their mark on the Section's
activity* More serious, however, has been a shortage of
personnel. Two project leaders, Dr. Robert Gary and Dr.
Richard K. Wolford, were chosen as Science and Technology
Fellows and were assigned elsewhere in the Department of
Commerce for 10 months of the reporting period.
iii
A third, Dr. Marion M. Davis, retired from the Section on
December J51, 1965. On the other hand, Dr. Paul W. Schindler
spent nine months in the Section as a guest worker supported
by the Swiss National Foundation.
The purpose of this report is to summarize the broad
program of the Electrochemical Analysis Section and to
convey also the manner in which the individual projects
contribute to the whole. An attempt is made to set forth
in a rather complete way the entire year's activity of the
Section and to reveal the ways in which this specialized
group contributes to the missions of the Division and
Institute of which it is a part.
In order to specify adequately the procedures, it has
been necessary occasionally to identify commercial materi-
als and equipment in this report In no case does such
identification imply recommendation or endorsement by the
National Bureau of Standards, nor does it imply that the
material or equipment identified is necessarily the best
available for the purpose.
The assistance of Mrs. Rosemary Maddock and Mrs.
Marguerite Rauderibush in the preparation of this report
is gratefully acknowledged.
Roger G. Bates, Chief
Electrochemical Analysis Section
Washington, D.C.
June , 1966
IV
TABLE OF CONTENTS
PAGE
1. FACILITIES AND EQUIPMENT 1
The Gaithersburg Laboratories ........ 1
Plans and Needs 5
2. MEASUREMENT OF ACIDITY 5
Concepts and Program 5
pH Standards 10
Redetermination of the pH of PotassiumHydrogen Phthalate, Primary pH Standard 10
Method ..... 10
Procedures 11
Results 11
Certification of a New Lot of PotassiumDihydrogen Phosphate ..... 1^
Sodium Hydrogen Succinate, a New StandardReference Material for pH Measurements . 15
Standard pH Values for 4-Aminopyridine Buffersin 50 Percent Methanol 17
Standards for a pD Scale in Deuterium Oxide. . 19
A Scale of Acid Strengths in Benzene 21
Experimental 21
Discussion 22
3. SOLVENT EFFECTS ON ACID-BASE PROCESSES .... 25
Dissociation of Positively-Charged Acidsin Methanol-Water Solvents 25
Ammonium Ion 28
Tris (hydroxymethyl )methylammoniumIon 30
Solubility Studies of the MediumEffect ^2
Parameters for the Solvent Effect. . 35
Isotope Effects on the Dissociation ofAcetic Acid in Water and Deuterium Oxide . . 59
v
PAGE
Acid-Base Behavior in Organic Solvents withLow Dielectric Constants . . 45
Spectrophotometry Studies of the Dissociationof Phenols 46
4. EQUILIBRIUM STUDIES OP SYSTEMS OF ANALYTICALINTEREST 48
Thermodynamics of the Dissociation ofMorpholinium Ion in Water ......... 48
Ionization Constant of Deuterium Oxidefrom 5 to 50 °C 51
Response of the Glass Electrode inHeavy Water 56
5. THERMODYNAMIC STUDIES OF AQUEOUS SOLUTIONSOF MIXED SALTS . . . 60
6. CONDUCTOMETRIC DETERMINATION OF TRACES OFWATER 63
Objectives and Principle of Method ...... 63
Modification of Apparatus 63
Calibration with Water 68
Analysis of Errors ..... 71
Status of the Project ...... 73
7. KINETIC TECHNIQUES IN TRACE ANALYSIS 74
8. STANDARD REFERENCE MATERIALS FOR ACIDIMETRY. . 76
Homogeneity Tests of Potassium HydrogenPhthalate 84h 76
Certification of Potassium Hydrogen Phthalate84h as an Acidimetric Standard 78
Status of Certification Procedures forStandard Reference Materials . 82
9. FOREIGN-CURRENCY PROGRAMS 84
10. PERSONNEL 85
VI
PAGE
11. COMMITTEE MEMBERSHIPS 86
12. PUBLICATIONS AND MANUSCRIPTS,JULY 1965 TO JUNE 1966 88
13. TALKS, JULY I965 TO JUNE 1966 91
14. LIST OF REFERENCES 94
vll
LIST OF FIGURES
FIGURE NO. PAGE
1. Equipment for the emf measurements onwhich pH standards in aqueous solutionare "based . 16
2. Relative acidic strengths in benzene andwater at 25 °C . The strength inbenzene is expressed as the value oflog K for 1:1 association of the acid(HA) with 1, 3-dlphenylguanidine (DPG) . 24
3. pK values for acids of two charge typesin methanol-water solvents at 25 °C . . 27
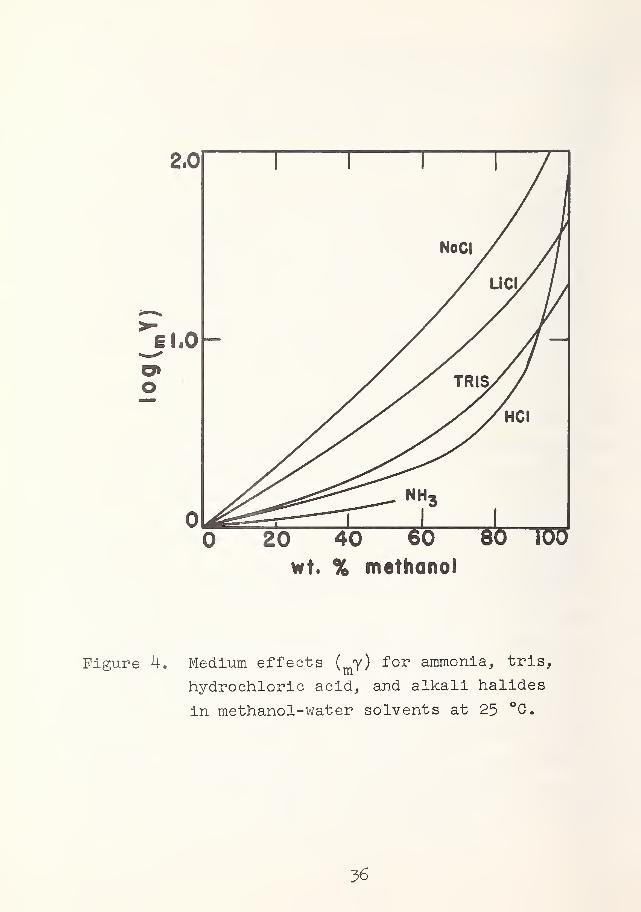
4. Medium effects(my) for ammonia, tris,
hydrochloric acid, and alkali halidesin methanol-water solvents at 25 °C . . 36
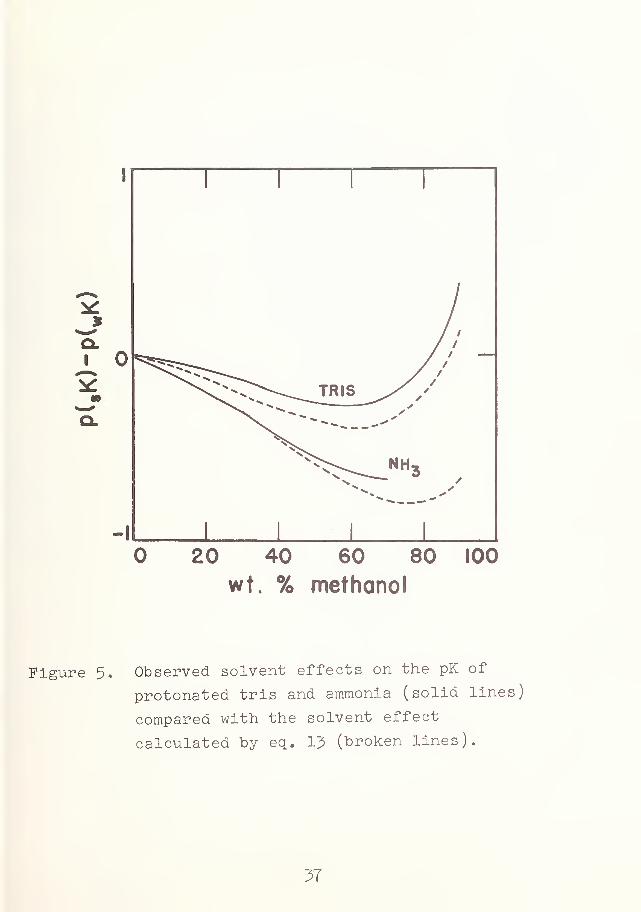
5. Observed solvent effects on the pK ofprotonated tris and ammonia (solidlines) compared with the solvent effectcalculated "by eq. ~LJ> (broken lines) . . 37
6. pK 1 in morpholine-morpholinium chloride"BtLffer solutions as a function of ionicstrength (m
1) at 0, 25, and 50 °C . . . 49
7. Apparatus for the electrolytic productionof the sodium amalgam used to preparethe standard solution of NaOD 53
8. Equipment for a direct comparison of* thedeuterium gas electrode and the glasselectrode in deuterium oxide. ..... 58
9. Variation of activity coefficients («y)
with composition in an aqueous mixtureof calcium chloride (B) and magnesiumchloride (o) of total molality 4 . . . 62
10. Conductance cell and circulation systemfor the determination of traces ofwater 65
11. Schematic wiring diagram for conductancebridge .... ....... 66
12. Recorder trace of calibrations byresistance steps and by additionsof water 70
vili
LIST OF FIGURES (con't)
FIGURE NO* PAGE
l^. Comparison of calibration methods .... 72
14. End point determination in a typicalcoulometric titration . 80
LIST OF TABLES
TABLE NO. PAGE
1. Standard pH values of 0.05 m potassiumhydrogen phthalate 12
2. Comparison of standard pH values, pH(s) ,
for present phosphates with thosefor the newly certified materials ... 1^
3. Values of pH*(s) for buffer solutionscomposed of 4-aminopyridiniumchloride (m) and 4-aminopyridine (m)in 50 percent methanol . • 19
4. pap values of the buffer solutions 0.05 macetic acid, 0.05m sodium acetatein heavy water 20
5. Acidic dissociation constant of ammoniumion in methanol-water solvents at25 °C 29
6. pa^ for buffer solutions of ammonia andammonium chloride (each at molality m)in methanol-water solvents at 25 °C . . 29
7. pK for the dissociation of protonatedtris(hydroxymethyl)aminomethane inmethanol-water solvents at 25 °C.The solvent effect 32
8. Medium effects for tris(hydroxymethyl)-aminomethane in methanol-water solvents,obtained from solubility measurements . jk
9. Thermodynamic quantities for the dissoci-ation of acetic acid and deuterioacetlcacid in water and deuterium oxideat 25 °C . 43
ix
LIST OF TABLES (con't)
TABLE NO. PAGE
10. Increase in pK for six substitutedphenols resulting from a change ofsolvent composition from pure water (w)to 50 wt . percent methanol at 25 °C , . 47
11. Thermodynamic quantities for the disso-ciation of morphollnium, piperidinium,and pyrrolidinium ions in waterat 25 °C 51
12. Comparison of the ionization constantsof deuterium oxide and water ..... 55
13. Comparison of the changes in enthalpy,entropy, and heat capacity for theionization of deuterium oxide and waterat 25 °C (molal scale) ........ 56
14. Assay of potassium hydrogen phthalate84h for homogeneity ........... 77
15. Assay of potassium hydrogen phthalate84h for certification as a standardfor acidimetry ............ 8l
x
ELECTROCHEMICAL ANALYSIS: STUDIES OF ACIDS, BASES,
AND SALTS BY EMF, CONDUCTANCE, OPTICAL, AND
KINETIC METHODS. JULY I965 TO JUNE 1966
Edited by Roger G. Bates
ABSTRACT
This survey of the activities of the Electrochemical
Analysis Section, Analytical Chemistry Division, covers the
period July 1965 to June 1966. An attempt is made to sum-
marize a year's progress on the technical projects of the
Section in such a way as to stress the program and capabili-
ties of the organizational unit as a whole. A description
of facilities and equipment is presented and the directions
of new programs are indicated. Brief summaries of the
several lines of work now under way are given. The main
areas include the study of acidity measurement in water,
deuterium oxide, and methanol-water solvents, along with
the development and certification of standard reference
materials with which acidity scales in these media can be
defined. Solvent effects and isotope effects are being
studied, and equilibrium data for certain systems of analyt-
ical interest have been, obtained. Progress on a conducto-
metric method for determining traces of water is reported,
and the thermodynamic properties of some salt mixtures have
been measured by a vapor pressure method. Kinetic methods
for trace analysis have been examined, and a new lot of
potassium hydrogen phthalate (Standard Reference Material
84h) has been certified for use as an acidimetric standard.
The survey concludes with lists of the members of the
Section staff, publications and manuscripts produced during
the year, talks given by the staff, and committee assign-
ments.
xi

1. FACILITIES AND EQUIPMENT
A. The Gaithersburg Laboratories
On March 23, 1966, the Electrochemical Analysis Section
began the move to Its assigned quarters at the Bureau's
Gaithersburg site. By the end of the same month most of the
equipment had been moved and the job of reconstructing
apparatus and of adapting to the new surroundings had begun.
The Section was assigned space on a single corridor of
the Chemistry Building, one of the seven general-purpose
laboratory buildings. Twelve modules of general laboratory
space and seven smaller modules (with north light) devoted
to offices and limited laboratories fell to the Section.
The total area provided for the Section was a little more
than 3,600 square feet of which slightly less than 300
square feet were given over to the activities of the Section
Office.
Pour of the larger laboratory modules are temperature-
controlled, nominally to ± 1 °F. In these laboratories
will be carried out those measurements where precise tem-
perature control (to ± 0.001 °C) will be required. All
other offices and laboratories are controlled nominally
to ±2 °F.
The Section has more hood space at the new site than
at the old. Against three hoods at the old quarters in
Washington, the Section now has seven hoods, with provision
for three elephant-trunk hoods in the larger general-purpose
modules. The elephant-trunk hoods are expected to be sus-
pended over oil thermostats which may be operated at high
temperatures
.
The equipment available for use in conductometric,
spectrophotometric, isopiestic, and potentiometric measure-
ments remains essentially the same as that described in
last year's progress report [1]. The equipment for the pre-
cise measurement of emf has, however, been augmented by the
addition of a Radiometer pH M4 high-impedance electrometer.
Furthermore, the constant-temperature baths used on the
three emf assemblies are being replaced by new ones. These
are of stainless-steel construction with built-in refrigera-
tion. Temperature control is provided by external elec-
tronic controllers of the proportional type, provided with
thermistor sensors.
It is anticipated that a fourth emf assembly will be
added to the inventory of the Section. The new instruments
will be devoted principally to the study of the behavior of
electrolytes dissolved in mixed media consisting of water
and organic solvents,
(V. E. Bower)
B. Plans and Needs
The measurement of acidity has been a major activity
of the Section for many years, and it is here that the
Section's competence has been developed to the highest level,
However, the concept of a practical acidity scale for par-
tially aqueous and nonaqueous solvents has only recently
been developed, despite the fact that techniques for acidity
measurements are critically needed for many media of fixed
composition. It is hoped therefore to continue and ac-
celerate this aspect of the program. With the acquisition
of new constant-temperature baths, the facilities for
studies with hydrogen and deuterium electrodes are excellent,
Research with the glass electrode, to which little attention
has been given in the past, should be expanded, and for this
purpose a precision high-impedance electrometer of the
vibrating-reed or dynamic-condenser types is needed. Meas-
urements in sea water have taken on a new significance with
the recent emphasis on oceanographic research, and studies
of acid-base behavior in this medium will shortly be initi-
ated.
The establishment of a new acidity scale and the selec-
tion of reference materials needed to define it require an
extensive series of emf measurements over a range of solute
concentrations, solvent compositions, and temperatures.
A completely automated system which would program the tem-
perature changes, monitor the approach of the cells to
equilibrium, and record all of the essential data has been
designed. It was described in the annual progress report
for 1964-65 [1]. As the broad program of acidity studies
takes form, this type of facility will prove indispensable
and should be constructed soon.
3
The need for accurate pH measurements at high tempera-
tures and. pressures is increasingly being felt. No standards
of reference are at present available for temperatures above
95 °C . The construction of equipment for precise emf measure-
ments of solutions under pressure in the range 100 to 200 °C
should be undertaken in the Section in the near future.
The Section now has competence in thermodynamic studies
of solution equilibria, in the conductance of electrolytic
solutions, and in the study of the rates of homogeneous
reactions in solution. There is a need to supplement these
studies with direct calorimetric measurements of the en-
thalpies of solution reactions. Furthermore, calorimetric
measurements are assuming a role of increased importance in
analytical chemistry. The Division would, for example,
benefit from the development of competence in enthalpimetric
titrimetry. Furthermore, the new technique of microcalorl-
metry is revealing exciting new possibilities in rapid
analysis and in the investigation of reactions in biological
systems for which conventional methods of analysis are com-
pletely unsuitable. To begin work in this new area, we
should acquire equipment for microcalorimetric studies in
the near future.
(R. G. Bates)
4
2. MEASUREMENT OP ACIDITY
A. Concepts and Program
Studies performed in the Section over a period of more
than two decades have led to the establishment of the NBS
conventional activity scale of pH. This scale has five
fixed points represented by aqueous solutions of the standard
reference materials issued by the National Bureau of Standards
The development of this pH scale has been described in detail
elsewhere [ 2]
.
In establishing a useful pH scale, one comes face to
face with the dilemma that the experimental methods for
acidity measurement do not yield quantities of exact physical
definition, whereas the hydrogen ion concentration and other
exactly defined quantities cannot be measured accurately In
solutions of unknown composition. The emf cell with hydrogen
electrode and a calomel reference electrode, or the modern
counterpart of this cell, the glass electrode pH meter,
develops an emf that is a function of the acidity of the
solution. This hydrogen ion response depends on the activi-
ties of the substances In the solution but is not clearly
related to the activity of the hydrogen ion. Indeed, the
activity of a single ionic species is not uniquely defined
by thermodynamics. It is still possible, however, to estab-
lish a conventional scale of hydrogen ion activity through
the arbitrary choice of a numerical scale for the activity
coefficient of a single species of ions.
The NBS pH scale, which is gaining favor gradually
throughout the world, has its experimental base in accurate
emf measurements of cells without liquid junction of the
type
H2(g. 1 atm), Buffer soln., Cl", AgCljAg
The standard emf of this cell is known accurately from
to 60 °C and with reduced accuracy to 95 °C; other measure-
ments have extended as high as 270 °C . By the strict ap-
plication of thermodynamics, therefore, it is possible to
determine the acidity function p(cUjYrin ) in buffer-chloride
solutions and, by an extrapolation procedure, in the
chloride-free buffer solution, if need be. The standard
values of the hydrogen ion activity (pa^) are easily derived
by the relationship
paH= p(aHYcl ) + log yc1
(l)
provided an estimate of yri can be made. This is accom-
plished through the adoption of a non-thermodynamic conven-
tion. For this purpose, representatives of the British and
American groups engaged in pH standardization have agreed
to accept a particular form of the Debye-Huckel equation
relating y-,, to the ionic strength, I [J>]:
AT 1/2"log YC1 = 1/2 (2)
where A is a constant of the Debye-Huckel theory and p has
the value 1.5 in water at 25 °C.
It must be recognized that, in theory, there is no
single scale of hydrogen ion activity. An arbitrary or
conventional scale defined in this way will, however, meet
all of the practical requirements. Coupled with the scale
of single-ion activity coefficients fixed by the convention
adopted above (eq. 2), experimental pH values determined
under ideal conditions are completely consistent with ion-
ization constants and other thermodynamic data for the
acid-base systems which fix the pH. It is evidently of
primary importance that the same conventional scale be
adopted by everyone who measures and records pH values.
For this reason, it is imperative that procedures for pH
standardization be recommended by a national standardizing
body such as the National Bureau of Standards or by an
authoritative international standards group such as the
International Standards Organization (ISO) or the Inter-
national Union of Pure and Applied Chemistry (IUPAC). The
NBS approach to a standard scale of pH has received the
endorsement of the IUPAC and of the American Society for
Testing Materials (ASTM)
.
There is a persistent demand on the part of science
and industry for practical scales of acidity in nonaqueous
solvents and in mixtures of water and organic solvents.
During the past few years, some effort has been directed by
the Section's staff to providing a useful experimental
scale for acidity in alcohol-water media and in heavy water.
The glass electrode has been found to respond satisfactorily
to deuterium ions in heavy water and to hydrogen Ions in
aqueous methanol and aqueous ethanol, at least in solvents
containing no more than 90 wt . percent of the organic
component. It remained to show that the liquid- junction
potential between an aqueous calomel reference electrode
and a nonaqueous or partly aqueous buffer solution was not
a function of the acidity of the latter. Satisfactory
evidence of the constancy of the liquid Junction was obtain-
ed for methanol-water mixtures containing as much as 70 wt
.
percent methanol [4].
These studies made it clear that the glass electrode
pH meter is capable of yielding values for the relative
hydrogen ion activity of two solutions both of which have
the same solvent composition. To set up a scale, therefore,
one or more reference points are needed. For practical
reasons, the pH unit pag was chosen. This quantity is
defined as follows:
7
pa* = -log m^^D)
where m is molality and y„ is the molal activity coef-
ficient based on the standard state in the nonaqueous or
partly aqueous solution (s); in other words, yv becomesS XI
equal to unity at infinite dilution in each particular
solvent or solvent mixture in question. The procedures
used for the establishment of standard values of pH can be
easily extended to yield standard values of pH*. To do so,
the convention which furnishes numerical values of yni is
entirely similar to that used for y„-. in aqueous solutions,
namely eq. 2. Appropriate changes in the constants A and pare made to reflect the different dielectric constants and
densities of the solvents.
Thus far the solvents selected for study have been
chosen because of their practical importance and freedom
from undesirable side reactions with the hydrogen electrode
or the silver-silver chloride electrode which would impair
the accuracy of the measurements. It is planned to extend
the work to other alcohol-water mixtures and to aqueous
ketones and aqueous amides in the order of the importance
of these solvents in acid-base studies. Attention will
then be directed to certain acidic or basic solvents such
as acetic acid and ethylenediamine. The procedures will
become more laborious when an attempt is made to study
solvents with dielectric constants below the range 30 to 40.
Under these circumstances, supplementary measurements,
possibly by conductance methods, of ion-pair association
constants will be necessary.
8
These procedures are most likely to be successful
when the solvents are amphlprotlc . At the present time
It seems unlikely that methods based on emf measurements
will succeed with aprotic (inert) media, where the dielec-
tric constant is usually low and ionization is slight.
Nevertheless, the measurement of acidity in media of this
sort is of very real practical importance. At the present
time it appears that a different approach to the establish-
ment of acidity scales in aprotic media will have to be
found
.
(R. G. Bates)
9
B. pH Standards
1. Redetermination of the pH of Potassium Hydrogen
Phthalate, Primary pH Standard .
a. Method . The assignment of standard values of
pH to the NBS primary standard buffers consists essentially
of four steps. The first of these is the determination of
the acidity function p^^y-,-, ) by measurement of the emf
of hydrogen-silver, silver chloride cells without liquid
junction, containing the buffer solution and three or more
different concentrations of soluble chloride. This function
is calculated by
t \( E - E °) F
n ,uyPla^Tm ) = — + log nu-. (4)n U1 RT In 10
U1
in which a is activity, y the molal ionic activity coef-
ficient, E the measured emf, E° standard emf of the cell,
F the faraday, and m molality. These values of p(a„Yp-, )
are then extrapolated to zero chloride concentration to
obtain the quantity p(a~yYrfi ) . The pa^ is then computed
by the relationship
paH = p(aHYcl)° + log ycl (5)
The Bates-Guggenheim convention is used to evaluate log Ynn
(see eq. 2, section 2. A). Finally, the standard reference
value pH(s) is identified with the conventional pa^ value
of the buffer.
10
b. Procedures . Except for a few changes in
technique, the usual procedures for emf measurements were
followed. As is the usual practice, hydrogen electrodes
coated with palladium "black were used to avoid reduction
of the phthalate by hydrogen in the presence of platinum
black. Several different palladium solutions were used,
including one prepared from palladium of exceptionally
high purity. No differences in behavior were observed
among electrodes prepared from the different solutions.
The potassium hydrogen phthalate used was NBS Standard
Reference Material l85d.
The cells were measured first at 25 °C, then from
to 35 °C at five-degree intervals in one series. A dif-
ferent set of cells was then measured at 25 °C and from 40
to 60 °C. Final checks were always made at 25 °C . All of
the cells contained 0.05 ni potassium acid phthalate and
either 0.005, 0.010, or 0.015 m potassium chloride.
c. Results . The linear extrapolation of values
of p ( a-rrYp -, ) to obtain the quantity p(a,/Yp-| ) at each tem-
perature was carried out by the method of least squares.
The ionic strengths, I, were computed from table 2 of the
paper of Hamer, Pinching, and Acree [5]. The values of
pH(S) obtained as described were fitted by the method of
least squares to an equation of the form
pH(S) = ~ + B + CT + DT2
(6)
with A = 2042.45, B = -1^.0228, C = 0.044210, D = -3.3761-5
x 10 . The standard deviation o
at the 13 temperatures is 0.0010.
-5x 10 . The standard deviation of the calculated values
11
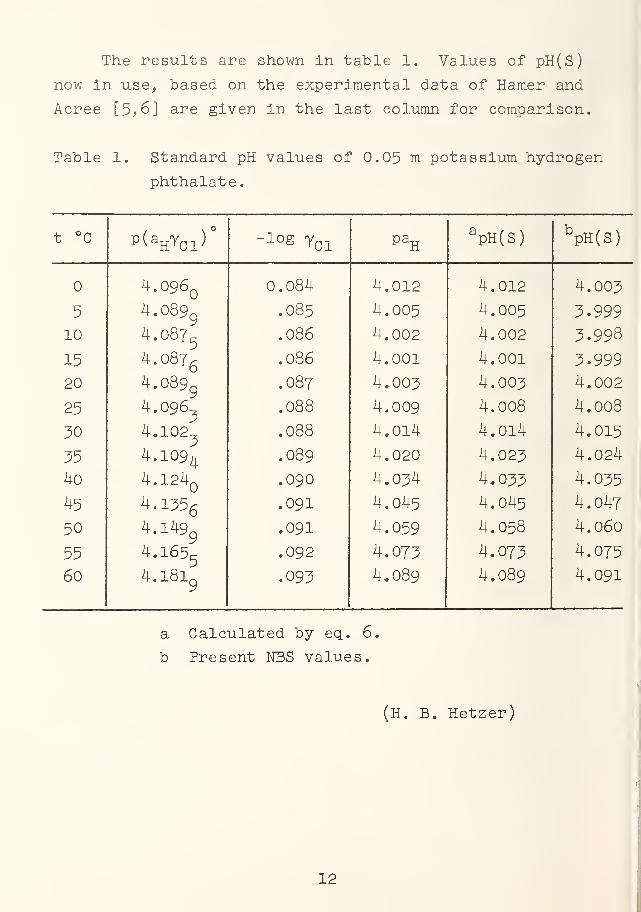
The results are shown In table 1. Values of pH(S)
now In use, based on the experimental data of Hamer and
Acree [5,6] are given in the last column for comparison.
Table 1. Standard pH values of 0.05 m potassium hydrogen
phthalate.
t °c p(aHYcl)° -log yc1
paHapH(S) V(s)
4.096Q
0.084 4.012 4.012 4.003
5 4.0899
.085 4.005 4.005 3.999
10 4.0875
.086 4.002 4.002 3.998
15 4.0876
.086 4.001 4.001 3.999
20 4.0899
.087 4.003 4.003 4.002
25 4.096 .088 4.009 4.008 4.008
30 4.102
4.1094
.088 4.014 4.014 4.015
35 .089 4.020 4.023 4.024
40 4.124 .090 4.034 4.033 4.035
45 4.1356
.091 4.045 4.045 4.047
50 4.1499
.091 4.059 4.058 4.060
55 4.1655
.092 4.073 4.073 4.075
60 4.l8l9
.093 4.089 4.089 4.091
a Calculated by eq. 6
b Present NBS values.
(H. B. Hetzer)
12
2. Certification of a New Lot of Potassium
Dihydrogen Phosphate
For acid-base studies, the equimolal aqueous mixture
of potassium dihydrogen phosphate and disodium hydrogen
phosphate provides a most useful reference solution. These
two salts, packaged separately, are distributed as Standard
Reference Materials by the National Bureau of Standards.
A standard buffer solution prepared according to the direc-
tions on the- certificate accompanying these materials pro-
vides an accurately defined reference point near the middle
of the pH scale.
The chemicals which are used for these reference
materials are analytical reagents of high grade, certified
only for the pH value they yield when mixed and prepared
according to directions. Because these salts are bought
in rather large lots by the Bureau, recertification is only
occasionally required. The high quality of these salts is
an assurance that the pH value will change very little with
change of lot. Nonetheless, because the pH standards are
certified to the highest precision that present techniques
and theory permit, minor variations in pH between lots
occur, and a detailed restudy is required for certification
of each new lot.
During the last year such a study was undertaken be-
cause a new lot of potassium dihydrogen phosphate had been
acquired. The study shows that standard buffers prepared
with the new lot will have a lower pH, by a few thousandths
of a unit, than buffers made with the old material. The
tentative results listed in table 2 show the change of pH
that has been observed. The values given relate to the
solution containing the two phosphates, each at molality
of 0.025.
13
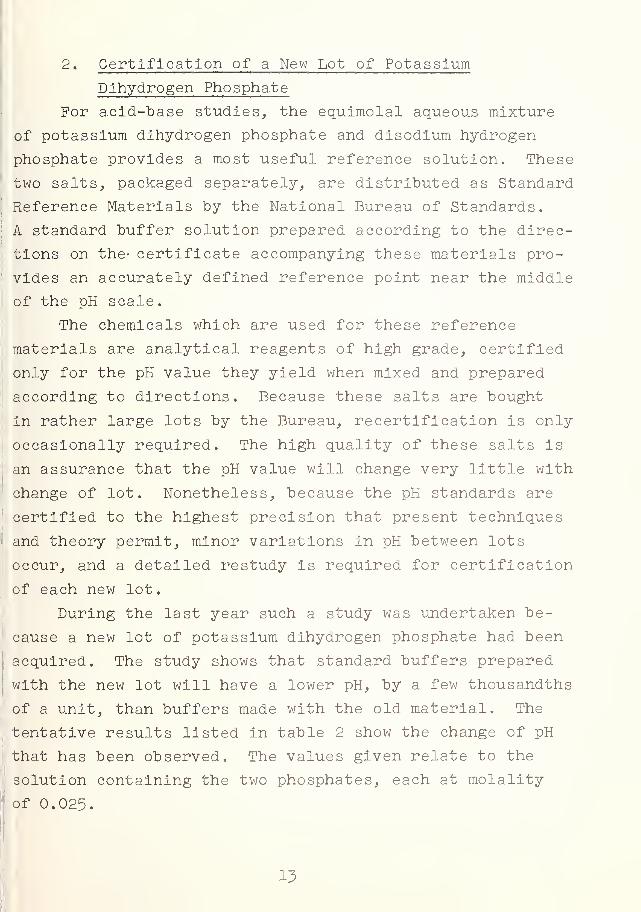
Confirmatory measurements are now under way, and the final
results will be listed in the certificate issued with the
new lot of potassium dihydrogen phosphate.
Table 2. Comparison of standard pH values, pH(S), for
present phosphates with those for the newly
certified materials.
t °c PH(S), present materials Tentative pH(S), new lot
6.984 6.982
5 6.951 6.949
10 6.923 6.922
15 6.900 6.897
20 6.881 6.876
25 6.865 6.862
30 6.853 6.849
35 6.844 6.840
40 6.838 6.834
45 6.834 6.831
50 6.833 6.831
(V. E. Bower)
14
5. Sodium Hydrogen Succinate, a New Standard Reference
Material for pH Measurements
Sodium hydrogen succinate in aqueous solution provides
useful buffer solutions with pH near 4.7. Mixed with either
succinic acid or dlsodlum succinate, it can be used to make
buffers whose pH varies, according to the mixing propor-
tions, from about 3.5 to about 6.0. The relative ease of
purification of these three compounds and the pH range which
they cover has led to their widespread use as reference
buffers for the determination of the dissociation constants
of weak acids.
For the standardization of the glass electrode in the
slightly acid pH range, potassium hydrogen phthalate solu-
tions (pH about 4) are very often used and are indeed among
the most reliable standard buffers available. However, as
a buffer medium in the spectrophotometric determination of
dissociation constants or in spectrophotometric analysis,
potassium hydrogen phthalate is of limited usefulness be-
cause it absorbs strongly in the ultraviolet region of the
spectrum. Furthermore, potassium hydrogen phthalate is
unstable in contact with the platinum-hydrogen electrode.
Solutions of sodium hydrogen succinate have pH values
not greatly different from those of potassium hydrogen
phthalate, yet they have the great advantage of stability
in contact with hydrogen and finely-divided platinum.
Inasmuch as succinate buffers are free of the difficulties
outlined above, it was considered desirable to add this
new pH standard to those which define the NBS conventional
pH standard scale.
Samples of sodium hydrogen succinate were prepared and
measurements begun this year. Preliminary results point to
a stable well-behaved system capable of precise measurement.
15
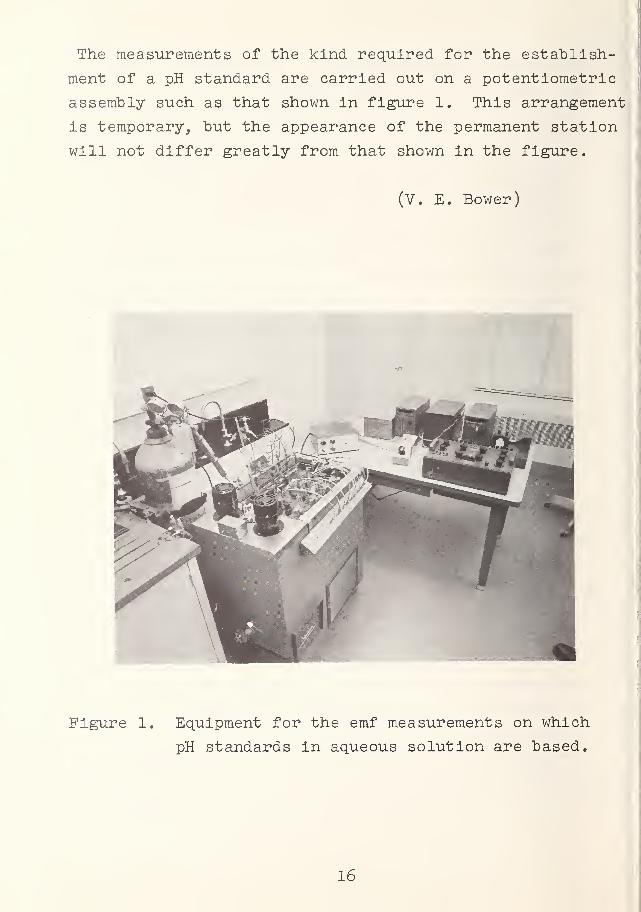
The measurements of the kind required for the establish-
ment of a pH standard are carried out on a potentlometric
assembly such as that shown in figure 1. This arrangement
is temporary, but the appearance of the permanent station
will not differ greatly from that shown in the figure.
(V. E. Bower)
Figure 1. Equipment for the emf measurements on which
pH standards in aqueous solution are based.
16
C . Standard pH* Values for 4-Aminopyridine Buffers in
30 Percent Methanol
As a continuation of the development and standardiza-
tion of an acidity scale for amphlprotic media, pa^t values
In 50 percent methanol were determined for a fifth buffer
In this series, namely for a mixture of 4-aminopyridine
and Its hydrochloride. This "buffer has found use In the
pH range 8.5 - 9.5 In place of the borax buffer when the
latter has undesirable side reactions. 4-Aminopyridine Is
a solid base which can easily be purified. It is moderately
soluble in a variety of solvents such as water, alcohol,
benzene, toluene, and chloroform. It has also been proposed
as a primary acidimetric standard.
A method for determining standard values for pH meas-
urements in aqueous buffer solutions has been developed in
this laboratory, and the same general procedure was followed
in 50 percent methanol medium for the five buffer systems
that have been studied.
The 4-aminopyridine was the same material used for
determining the dissociation constant of this base in water
in this laboratory [7]. A stock solution of the 4-amino-
pyridine and standard hydrochloric acid was prepared in
50 percent methanol. This was diluted further with water
and methanol to yield buffer mixtures with a total ionic
strength varying from 0.1 to 0.01. The acidity function
p (attT^-, ) was measured over a temperature range from 10
to 40 °C with the aid of the cell
Pt;H? (g.,
1 atm.), Buffer in 50 percent methanol,
AgClj Ag
17
It was calculated from the emf of this cell and the
standard emf of the hydrogen-silver chloride cell in
50 percent methanol "by the use of the eq. 4 of section
2.B.I. The standard emf, E°, in 50 wt. percent methanol
has already been determined and the results published
[8], By using a convention for evaluation of the single-
ion activity coefficient, Ypv analogous to that used in
water (eq. 2 of section 2. A), the pa* values were obtained
from the experimental acidity functions by the relationship
paH= P s(
aH^Cl) + l0gB (*VC1 ) (?)
These pa|t values are given in table ~5t where they
are identified with pH*(S), the standard reference values
in the operational definition of the pH* for alcohol-water
solvents. These values can be used for practical measure-
ments of pH* in 50 percent methanol by standardizing the
pH meter with a reference solution of the same solvent
composition as that of the test solution. This procedure
avoids to some degree the variation of the asymmetry po-
tential of the glass electrode due to changes in solvent
composition when the electrode is transferred from one
solution to another of different water content.
(M. Paabo)
18
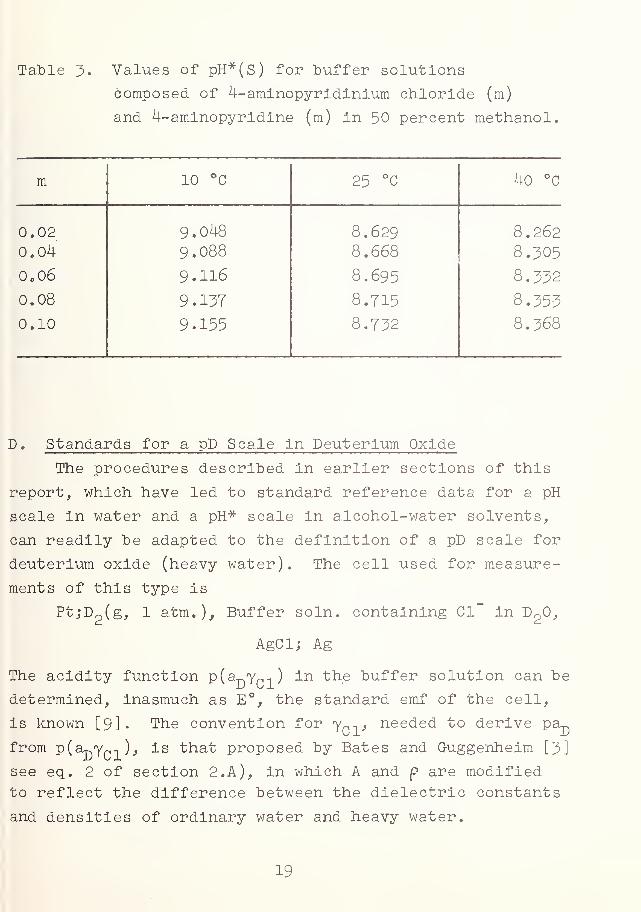
Table 3. Values of pH*(S) for buffer solutions
composed of 4-aminopyridinium chloride (m)
and 4-aminopyridine (m) in 50 percent methanol.
m 10 °c 25 °C 40 °C
0.02 9.048 8.629 8.2620.04 9.088 8.668 8.305
o 06 9.116 8.695 8.332
0.08 9.157 8.715 8.353
0.10 9.155 8.732 8.368
D. Standards for a pD Scale In Deuterium Oxide
The procedures described in earlier sections of this
report, which have led to standard reference data for a pH
scale in water and a pH* scale in alcohol-water solvents,
can readily be adapted to the definition of a pD scale for
deuterium oxide (heavy water). The cell used for measure-
ments of this type is
Pfc;D2 (g,
1 atm.), Buffer soln. containing 01 in DpO,
AgGlj Ag
The acidity function p(aT)Yr
,
]) in the buffer solution can be
determined, inasmuch as E°, the standard emf of the cell,
is known [93- The convention for Yp-i, needed to derive pa~
from p(aT)Yp-| )t is "that proposed by Bates and Guggenheim [3]
see eq. 2 of section 2. A), in which A and p are modified
to reflect the difference between the dielectric constants
and densities of ordinary water and heavy water.
19
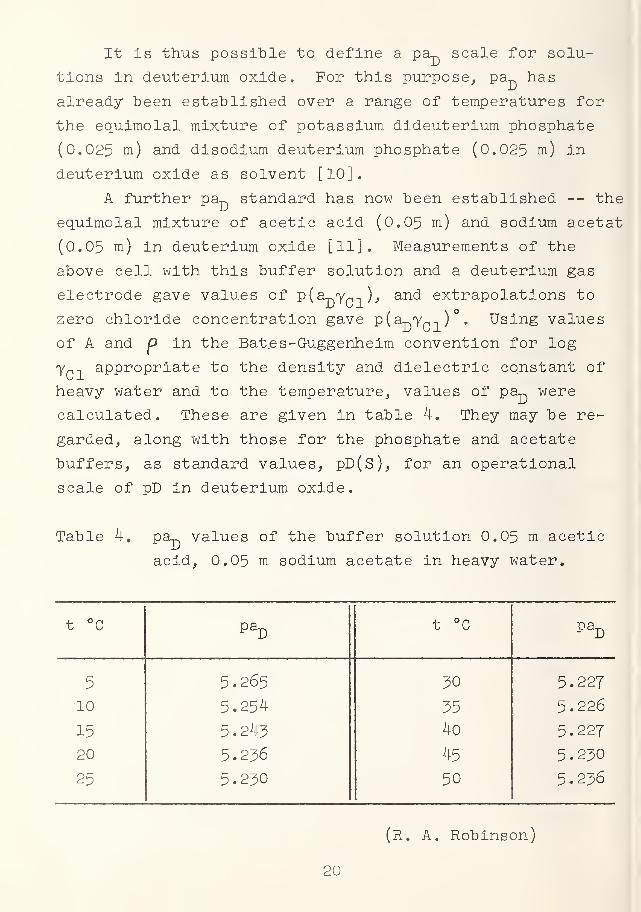
It is thus possible to define a pa— scale for solu-
tions in deuterium oxide. For this purpose, pa„ has
already been established over a range of temperatures for
the equimolal mixture of potassium dideuterium phosphate
(0.025 tn) and disodium deuterium phosphate (0.025 rn ) in
deuterium oxide as solvent [10].
A further pa^ standard has now been established -- the
equimolal mixture of acetic acid (0.05 m) and sodium acetat
(0.05 m) in deuterium oxide [11]. Measurements of the
above cell with this buffer solution and a deuterium gas
electrode gave values of p(a-nyr
,
1) , and extrapolations to
zero chloride concentration gave p(a-nYr
,-)
) . Using values
of A and P in the Bates-Guggenheim convention for log
Ypi appropriate to the density and dielectric constant of
heavy water and to the temperature, values of pa~ were
calculated. These are given in table 4, They may be re-
garded, along with those for the phosphate and acetate
buffers, as standard values, pD(s), for an operational
scale of pD in deuterium oxide.
Table 4, pa- values of the buffer solution 0.05m acetic
acid, 0.05 m sodium acetate in heavy water.
t °c pa^ t °C paD
5 5.265 30 5.227
10 5.254 35 5.226
15 5.243 40 5.227
20 5.236 45 5.230
25 5.230 50 5.236
(R. A. Robinson)
20
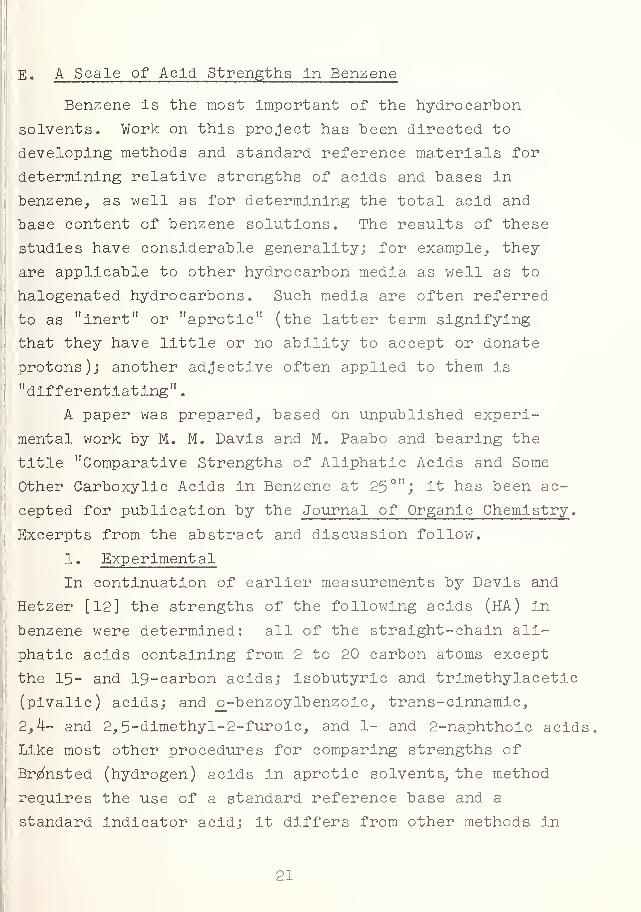
E. A Scale of Acid Strengths in Benzene
Benzene is the most important of the hydrocarbon
solvents. Work on this project has been directed to
developing methods and standard reference materials for
determining relative strengths of acids and bases in
benzene, as well as for determining the total acid and
base content of benzene solutions. The results of these
studies have considerable generality; for example,, they
are applicable to other hydrocarbon media as well as to
halogenated hydrocarbons. Such media are often referred
to as "inert" or "aprotic" (the latter term signifying
that they have little or no ability to accept or donate
protons); another adjective often applied to them is
"differentiating"
.
A paper was prepared, based on unpublished experi-
mental work by M. M. Davis and M. Paabo and bearing the
title "Comparative Strengths of Aliphatic Acids and Some
Other Carboxylic Acids in Benzene at 25°"; it has been ac-
cepted for publication by the Journal of Organic Chemistry .
Excerpts from the abstract and discussion follow.
1. Experimental
In continuation of earlier measurements by Davis and
Hetzer [12] the strengths of the following acids (HA) in
benzene were determined: all of the straight-chain ali-
phatic acids containing from 2 to 20 carbon atoms except
the 15- and 19- carbon acids; isobutyric and trimethylacetic
(pivalic) acids; and o_-benzoylbenzoic, trans-cinnamic,
2,4- and 2, 5-dimethyl-2-furoic, and 1- and 2-naphthoic acids
Like most other procedures for comparing strengths of
Brizfasted (hydrogen) acids in aprotic solvents, the method
requires the use of a standard reference base and a
standard indicator acid; it differs from other methods in
21
the choice of reference base and reference acid and also
in the treatment of data.
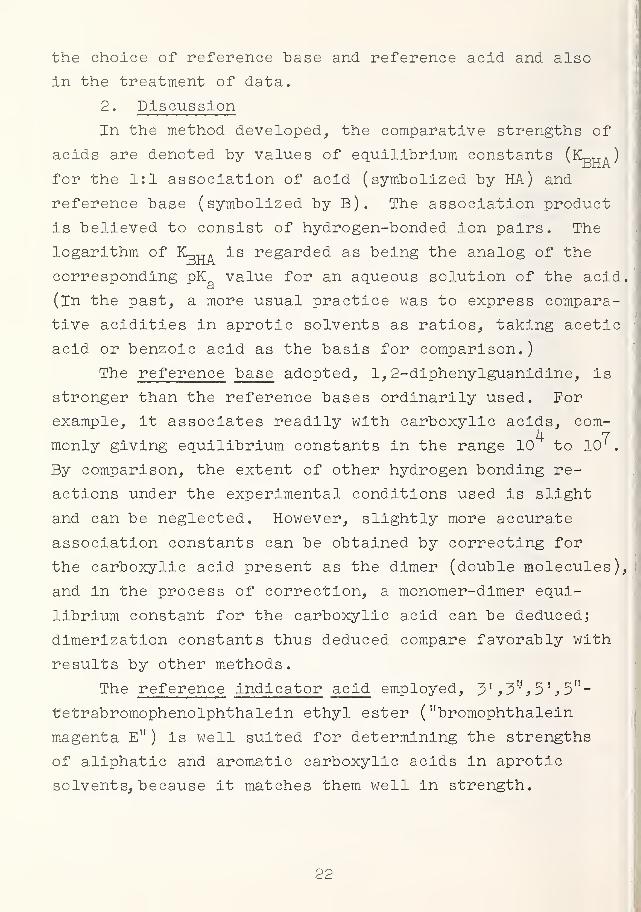
2. Discussion
In the method developed, the comparative strengths of
acids are denoted by values of equilibrium constants (KRTTA )
for the 1:1 association of acid (symbolized by HA) and
reference base (symbolized by B). The association product
is believed to consist of hydrogen-bonded ion pairs. The
logarithm of &„,, is regarded as being the analog of the
corresponding pK value for an aqueous solution of the acid.
(in the past, a more usual practice was to express compara-
tive acidities in aprotic solvents as ratios, taking acetic
acid or benzoic acid as the basis for comparison.
)
The reference base adopted, 1, 2-diphenylguanidine, is
stronger than the reference bases ordinarily used. For
example, it associates readily with carboxylic acids, com-4 7monly giving equilibrium constants in the range 10 to 10.
By comparison, the extent of other hydrogen bonding re-
actions under the experimental conditions used is slight
and can be neglected. However, slightly more accurate
association constants can be obtained by correcting for
the carboxylic acid present as the dimer (double molecules),
and in the process of correction, a monomer-dimer equi-
librium constant for the carboxylic acid can be deduced;
dimerization constants thus deduced compare favorably with
results by other methods.
The reference indicator acid employed, ~$ l
,j5"
, 5'
, 5n -
tetrabromophenolphthalein ethyl ester ( "bromophthalein
magenta E" ) is well suited for determining the strengths
of aliphatic and aromatic carboxylic acids in aprotic
solvents, because it matches them well in strength.
22
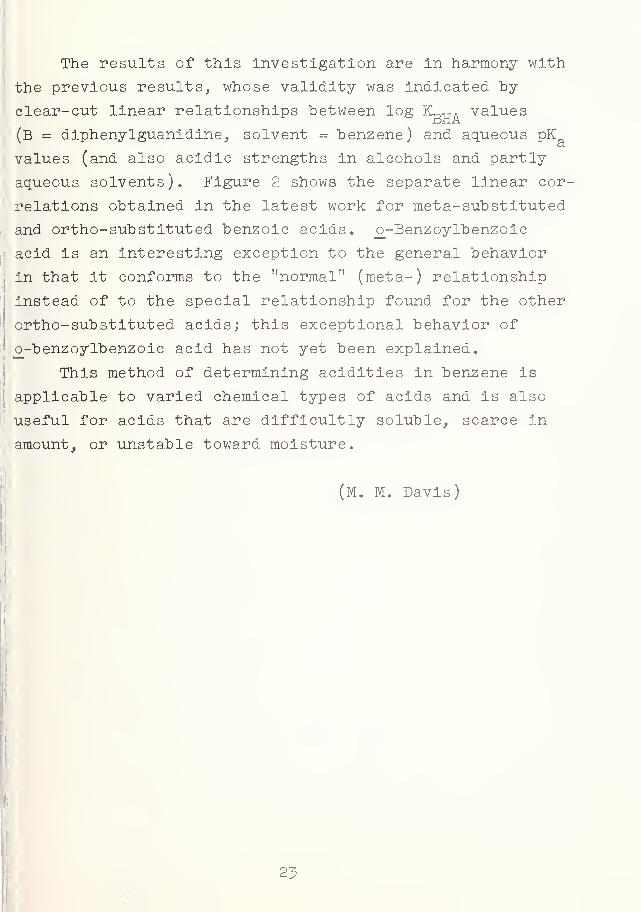
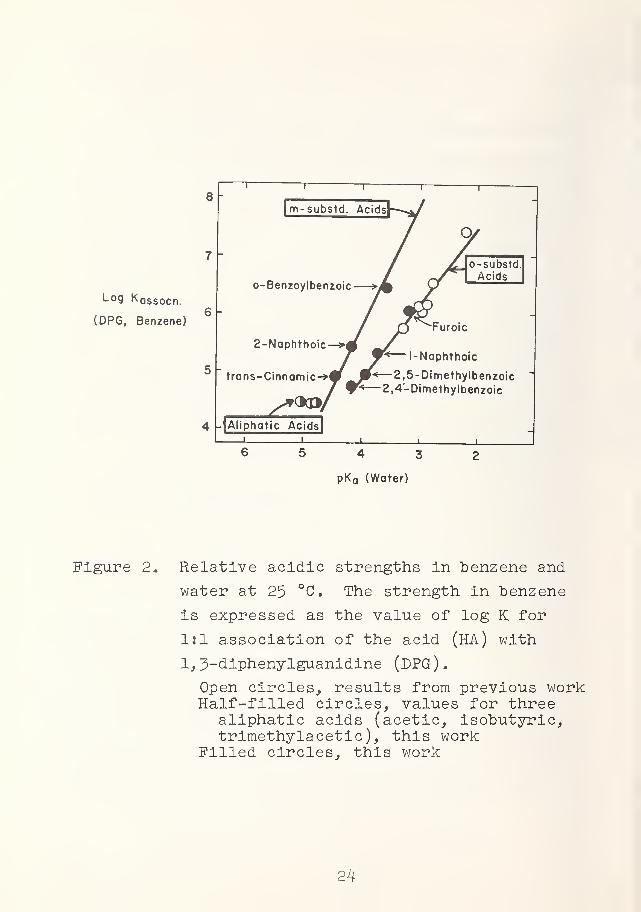
The results of this Investigation are In harmony with
the previous results, whose validity was Indicated by
clear-cut linear relationships between log K^tta values
(B = diphenylguanidine, solvent = benzene) and aqueous pK
values (and also acidic strengths in alcohols and partly
aqueous solvents). Figure 2 shows the separate linear cor-
relations obtained in the latest work for meta- substituted
and ortho-substituted benzoic acids. o_-Benzoylbenzoic
acid is an interesting exception to the general behavior
in that it conforms to the "normal" (meta-) relationship
instead of to the special relationship found for the other
ortho-substituted acids; this exceptional behavior of
jo-benzoylbenzoic acid has not yet been explained.
This method of determining acidities in benzene Is
applicable to varied chemical types of acids and is also
useful for acids that are difficultly soluble, scarce In
amount, or unstable toward moisture.
(M. M. Davis)
23
Log K assocn
(DPG, Benzene)
5 -
m-su
o-Benzoylbe
2-Naphthoi<
trans-Cinnamic-*
^CJCPj
4 L |Aliphotic Acids—i i__
substdAcids
enzoic
benzoic
5 4 3
pK a (Water)
Figure 2. Relative acidic strengths in benzene and
water at 25 °C. The strength in "benzene
is expressed as the value of log K for
1:1 association of the acid (HA) with
1, >-diphenylguanidine (DPG).
Open circles, results from previous workHalf-filled circles, values for three
aliphatic acids (acetic, isobutyric,trimethylacetic), this work
Filled circles, this work
24
3. SOLVENT EFFECTS ON ACID-BASE PROCESSES
A. Dissociation of Positively-Charged Acids in Methanol-
Water Solvents
The process by which a cationic weak acid dissociates
is one of particular interest. A positively charged acid
such as ammonium ion dissociates into an uncharged conju-
gate "base and a solvated proton by a reaction that can be
written in general terms as follows
BH+ + SH = SH2+ + B (8)
where SH represents an amphiprotic solvent. From the
electrostatic point of view, this reaction is a simple
one, as there is no net change in the number of ions. The
electrostatic contribution to the energy of dissociation
should be rather small, and this type of process is there-
fore well suited to a study of the parameters necessary to
account for the observed solvent effects on the dissocia-
tion. To do this, the electrostatic effect must be estimat-
ed in order to demonstrate whether it alone is sufficient
to explain the changes in dissociation constant actually
found.
For the past few years the solvent effect of methanol
on the dissociation of cation acids has been a subject of
interest in this laboratory. A detailed study of the dis-
sociation of the protonated form of tris(hydroxymethyl)-
aminomethane (tris, THAM) in 50 wt. percent methanol from
10 to 40 °C was recently published [13]. Further work on
this acid in solvents containing 30, 70, and 90 wt. percent
methanol at temperatures of 15, 25, and 35 °C has now been
completed. In addition, the dissociation of ammonium ion
in five methanol-water solvents at 25 °C has been studied.
25
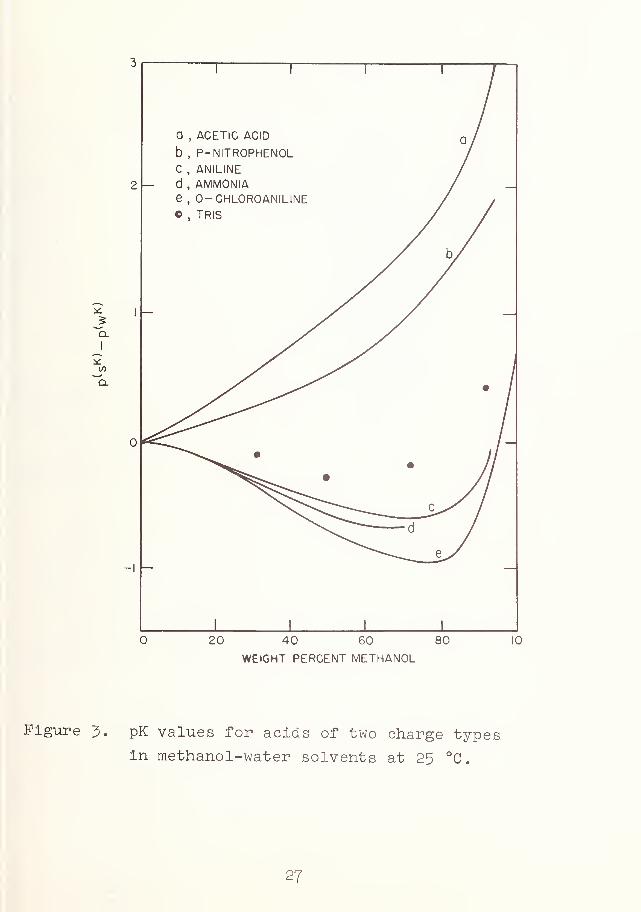
The typical pattern for the solvent effect of methanol
on the dissociation of a positively charged weak acid is
represented by the curves at the bottom of figure 3.
Methanol causes a decrease in the pK until a. minimum is
reached at a concentration of 60 to 80 percent methanol,
after which the pK rises sharply and may exceed that in
pure water. This behavior is in marked contrast to that
shown by uncharged weak acids such as acetic acid and the
phenols, represented by the curves at the top of the figure.
It has long been recognized that the contrasting be-
havior shown by the two types of curves of figure 3 can be
explained qualitatively on electrostatic grounds „ Thus
the large increase in pK produced by adding methanol to an
aqueous solution of an uncharged weak acid reflects the
increased difficulty in separating the oppositely charged
ions (hydrogen and the anion base) in the medium of lowered
dielectric constant produced by addition of the organic
constituent. The minimum in the pK curves for cationic
acids cannot be explained, however, on simple electrostatic
grounds alone. Recent efforts in this laboratory have been
directed toward an identification of the other parameters
which, together with the dielectric constant, can explain
in a fairly satisfactory way the existence of a minimum
and the course of the pK curve. Analyses of data for both
uncharged and positively charged acids have led to the
suggestion that the solvent effect on both types reflects
a "basicity effect", namely, an increase in the total basic-
ity of the solvent molecules represented by SH in eq. 8.
26
J:Q.
40 60
WEIGHT PERCENT METHANOL
Figure 3. pK values for acids of two charge types
in methanol-water solvents at 25 °C.
27
Reasonably concordant values for the magnitude of this
"basicity effect have "been obtained from the analysis of
data for the dissociation of weak acids of the two types.
The nature of this basicity effect and the identification
of the other parameters on which the solvent effect de-
pends are still being investigated.
(R. G. Bates)
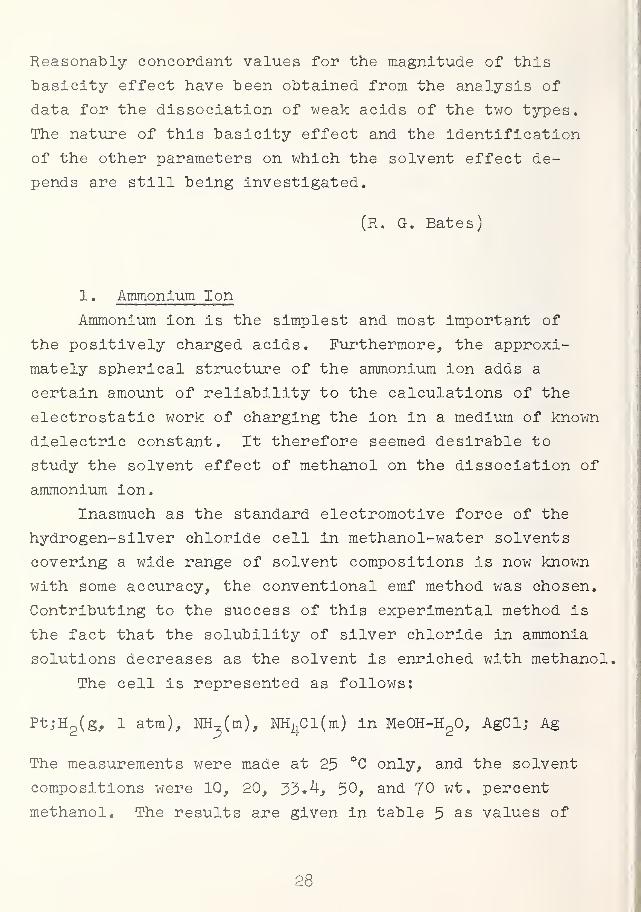
1. Ammonium Ion
Ammonium ion is the simplest and most important of
the positively charged acids. Furthermore, the approxi-
mately spherical structure of the ammonium ion adds a
certain amount of reliability to the calculations of the
electrostatic work of charging the ion in a medium of known
dielectric constant. It therefore seemed desirable to
study the solvent effect of methanol on the dissociation of
ammonium ion.
Inasmuch as the standard electromotive force of the
hydrogen- silver chloride cell in methanol-water solvents
covering a wide range of solvent compositions is now known
with some accuracy, the conventional emf method was chosen.
Contributing to the success of this experimental method is
the fact that the solubility of silver chloride in ammonia
solutions decreases as the solvent is enriched with methanol.
The cell is represented as follows;
Pt;H2 (g,
1 atm), NH,(m), NHi|_Cl(m) in MeOH-H
20, AgCl; Ag
The measurements were made at 25 °C only, and the solvent
compositions were 10, 20, y^.h, 50, and 70 wt. percent
methanol. The results are given in table 5 as values of
28
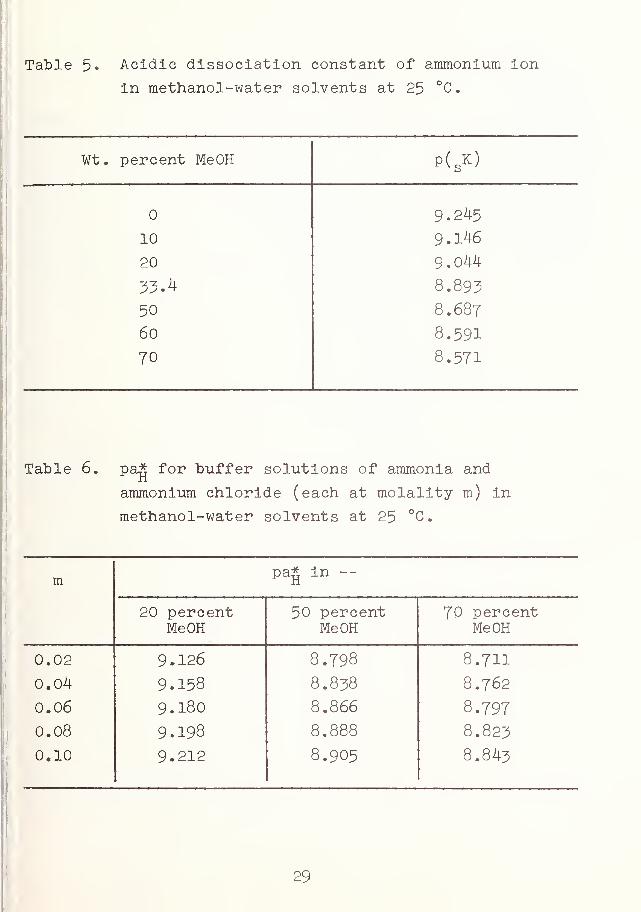
Table 5. Acidic dissociation constant of ammonium ion
in methanol-water solvents at 25 °C.
wt. percent MeOH P( SK)
9.245
10 9.146
20 9.044
33.4 8.893
50 8.687
60 8.591
70 8.571
Table 6. pa* for buffer solutions of ammonia and
ammonium chloride (each at molality m) in
methanol-water solvents at 25 °C
m pa* in ~
20 percentMeOH
50 percentMeOH
70 percentMeOH
0.02 9.126 8.798 8.711
0.04 9.158 8.838 8.762
0.06 9.180 8.866 8.797
0.08 9.198 8.888 8.823
0.10 9.212 8.905 8.843
29
p( K)j the subscript s signifies that the activity coef-
ficients in the equilibrium expression are based on a
standard state in the methanol-water medium, becoming unity
at infinite dilution in that medium. The pa.* values given
in table 6 were calculated as described in section 2.C.
These acidity functions may be regarded as reference data
useful in the study of the dissociation of other acid-base
systems in methanol-water solvents. In view of the dif-
ficulty of preparing the buffer solutions, however, these
values are not recommended as reference standards for pH*
measurements. This work has already been published [14],
(R. G. Bates)
2. Tris (hydroxymethyl ) methylammonium Ion
Tris(hydroxymethyl)aminomethane is a solid, crystal-
line base obtainable in a state of high purity. It is
moderately soluble both in water and in methanol and is
widely used as a standard reference material in acidimetry
as well as for pH control. Like ammonium ion, protonated
tris is presumably a roughly spherical ion whose electro-
static energy can be estimated by the Born calculation.
All of these considerations have led us to choose this base
for the study of the methanol solvent effect on acidic
dissociation.
The conventional emf method, which has been used ex-
tensively in this laboratory, was inapplicable to a de-
termination of the pK values at temperatures other than 25
°C, for the standard emf of the hydrogen- silver chloride
cell is known only at 25 °C in several of the methanol-water
solvents included in the study, It was, however, desired
to include other temperatures in order to obtain information
30
on the enthalpies and entropies of dissociation. A titra-
tion method was therefore devised, utilizing a cell without
liquid junction consisting of a glass electrode and a silver-
silver chloride electrode. As in earlier work [15], con-
centrations were adjusted so that the titration was perform-
ed in a medium of essentially unchanging ionic strength,
constant chloride ion concentration, and, of course, fixed
solvent composition. In essence, data for the following
two cells were obtained:
1) Glass IjHClO^m), NaCl(m), AgCl; Ag
and
2) GlassIIHClOj, (m), Tris, NaCl(m), AgCl; Ag
where the composition of the methanol-water solvent was
uniform throughout and the ionic strength was 2m.
The difference in the emf of these two cells may be
expressed in terms of the pK of protonated tris (TH ) as
follows:
PK - ^ + log^ +log ^H+^C1>2 (9)
2.3026RT/P m-nvp (VlM^Cl)!
The last term of this expression is a combination of acti-
vity coefficients which, under the conditions of the ex-
periments, should be small. Experience showed that this
was indeed the case and that this term could be ignored
for the low concentrations of electrolytes used. The values
of pK found in 30, 70, and 90 wt . percent methanol at 25 °C
are compared in table 7 with the pK in water [16,17] and in
50 percent methanol [13]. The last column gives the solventeffect, defined as p( K)-p( K)
.
(P. W. Schindler and R. G. Bates)
31
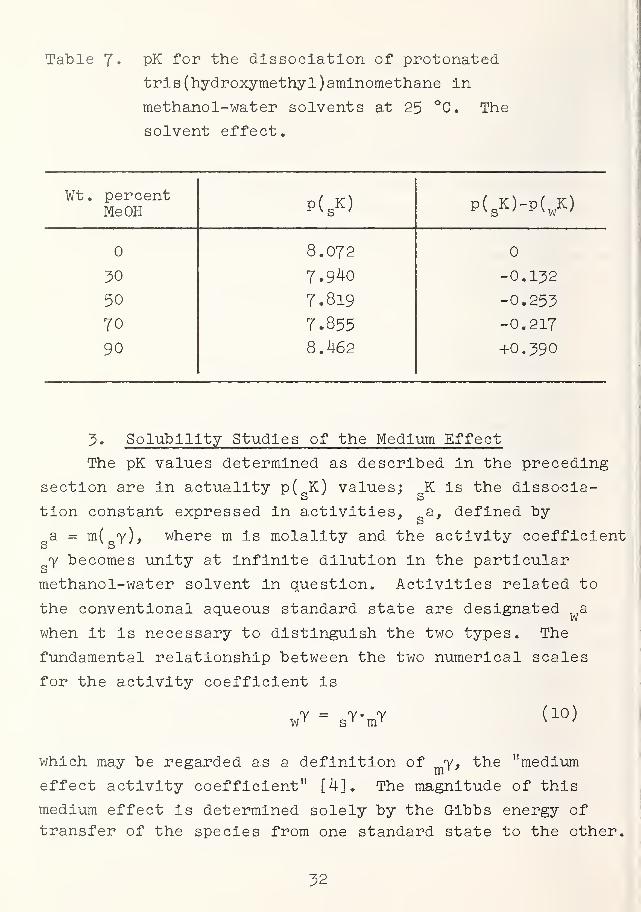
Table J, pK for the dissociation of protonated
tris(hydroxymethyl)aminomethane in
methanol-water solvents at 25 °C. The
solvent effect.
Wt. percentMe OH P( S
K) P( SK)~P(WK)
8.072
30 7.940 -0.1^2
50 7.819 -0.253
70 7.855 -0.217
90 8.462 +0.390
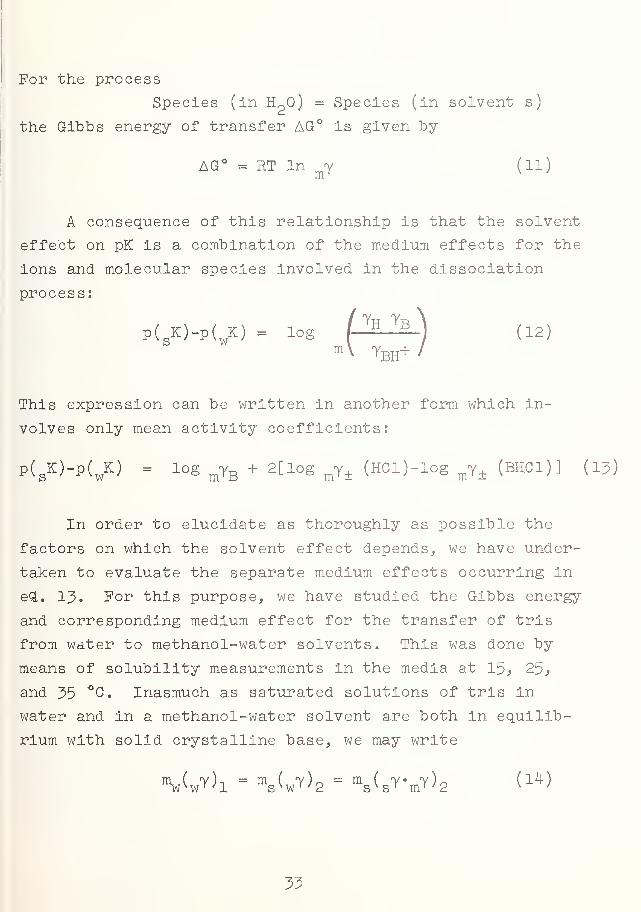
3. Solubility Studies of the Medium Effect
The pK values determined as described in the preceding
section are in actuality p( K) values; K is the dissocia-
tion constant expressed in activities, a, defined by
a = m( y), where m is molality and the activity coefficients s
y becomes unity at infinite dilution in the particulars
methanol-water solvent in question. Activities related to
the conventional aqueous standard state are designated aw
when it is necessary to distinguish the two types. The
fundamental relationship between the two numerical scales
for the activity coefficient is
y = y. y (lO)w' s r m r v
'
which may be regarded as a definition of y, the "medium
effect activity coefficient" [4]. The magnitude of this
medium effect is determined solely by the Gibbs energy of
transfer of the species from one standard state to the other.
32
For the process
Species (in H?0)
= Species (in solvent s)
the Gibbs energy of transfer AG° is given "by
AG° = RT In y (ll)
A consequence of this relationship is that the solvent
effect on pK is a combination of the medium effects for the
ions and molecular species involved in the dissociation
process:
f( K)-p(K) = log f-^lS-j
m\ TBH+
This expression can be written in another form which in-
volves only mean activity coefficients:
p( sK)-p(
wK) = log
myB+ 2 [log mY± (HCl)-log my±
(BHCl)] (l?)
In order to elucidate as thoroughly as possible the
factors on which the solvent effect depends, we have under-
taken to evaluate the separate medium effects occurring in
eq. l^. For this purpose, we have studied the Gibbs energy
and corresponding medium effect for the transfer of tris
from water to methanol-water solvents. This was done by
means of solubility measurements in the media at 15, 25,
and 35 °C. Inasmuch as saturated solutions of tris in
water and in a methanol-water solvent are both in equilib-
rium with solid crystalline base, we may write
%^1 = ms(w^2 = Vs^m^ <14 )
33
where 1 represents the saturated aqueous solution and 2
represents the saturated solution in the methanol-water
solvent. From this relationship,
m
mTt= w ( y)v w '
' 1mw
m ( SY)(15)
m
Thus the ratio of solubilities yields an approximate value
for the medium effect of tris base (T)j a more accurate
value could be obtained by correcting for the difference in
the "salt effect activity coefficients" (,/yh and ( ay)W _L S i—
derived from independent measurements. The approximate
values of ym for tris are adequate for the present studiesm 'T
of the solvent effect. They are summarized in table 8.
(P. W. Schindler and R. G. Bates)
Table 8. Medium effects for tris (hydroxymethyl)aminomethane
in methanol-water solvents, obtained from
solubility measurements.
Wt. percentMeOH
logrn^T
(15 °C)
log Ym& m rrji
(25 °c)
log mYT(35 °C)
10 0.067 0.055 0.045
20 0.135 0.114 O.095
30 0.208 0.180 0.154
40 0.285 0.254 0.221
50 0.379 0.343 0.303
60 0.499 0.459 0.412
70 0.653 0.604 0.549
80 0.8^4 0.791 0.729
90 1.094 1.032 0.935
100 1.322 1.297 1.231
34
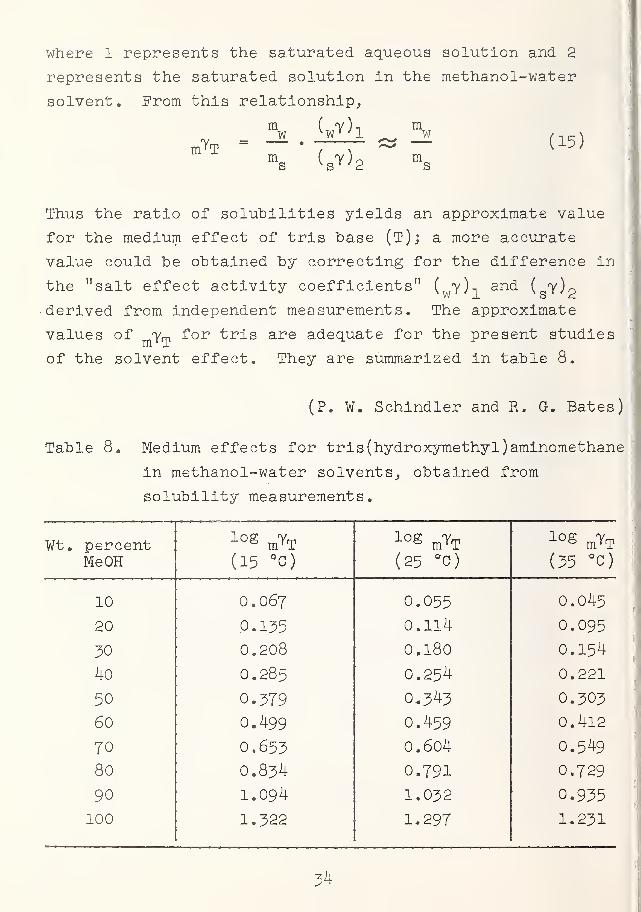
4. Parameters for the Solvent Effect
With a. knowledge of the medium effect for trls base,
it is possible to make some interesting comparisons between
the predicted solvent effect and that actually observed
„
The medium effect for the transfer of hydrochloric acid can
be derived readily from the standard electromotive force
for the hydrogen-silver chloride cell [18,19] containing
hydrochloric acid in methanol-water solvents. The medium
effect for tris hydrochloride has unfortunately not been
determined. Data for sodium chloride and lithium chloride
are, however, available from the work of Akerlof [20].
The values for these three electrolytes are compared with
those for undissociated tris and ammonia in figure 4. It
is evident that the medium effects for the two alkali
halides do not differ greatly and show a. continuous, nearly
linear, rise with the weight percentage of methanol. On
the other hand, the medium effect for hydrochloric acid
remains low at all water-rich solvent compositions and does
not rise rapidly until the solvent composition has reached
60 percent methanol.
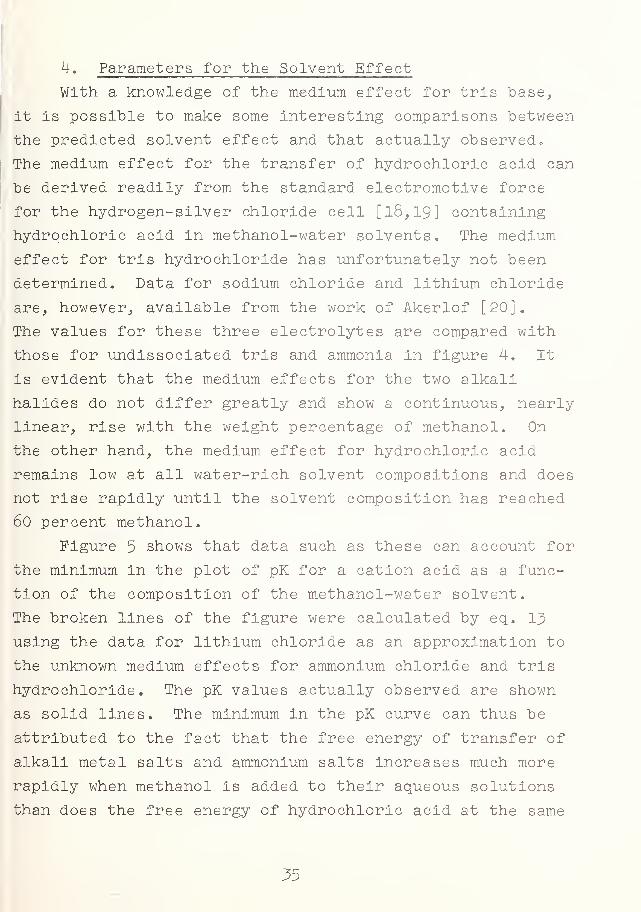
Figure 5 shows that data such as these can account for
the minimum in the plot of pK for a cation acid as a func-
tion of the composition of the methanol-water solvent.
The broken lines of the figure were calculated by eq. 13
using the data for lithium chloride as an approximation to
the unknown medium effects for ammonium chloride and tris
hydrochloride. The pK values actually observed are shown
as solid lines. The minimum in the pK curve can thus be
attributed to the fact that the free energy of transfer of
alkali metal salts and ammonium salts increases much more
rapidly when methanol is added to their aqueous solutions
than does the free energy of hydrochloric acid at the same
35
o
El.O-
20 40 Wwt. % methanol
Figure 4. Medium effects ( y) for ammonia, tris,
hydrochloric acid, and alkali halides
in methanol-water solvents at 25 °C
36
20 40 60 80 100
wt. % methanol
Figure 5. Observed solvent effects on the pK of
protonated tris and ammonia (solid lines)
compared with the solvent effect
calculated by eq. 13 (broken lines).
37
solvent compositions. One can only speculate as to the
cause of this behavior. If normal behavior is represented
by the course of the curves for the alkali metal salts
shown in figure h, it must be concluded that at low methanol
concentrations the escaping tendency for hydrochloric acid
from the methanol-water media is unexpectedly low. This is
just another way of expressing the "basicity effect" earlier
postulated [21]. An increase in basicity as methanol is
added could indeed be attributed to a breakdown in the
structure of the water. It would appear that the proton
is solvated primarily by water molecules in solvents con-
taining less than 60 wt . percent methanol and that the rapid
rise in methanol-rich solvents reflects the increased escap-
ing tendency of protons solvated by the relatively weakly
basic methanol molecules.
(R. G. Bates)
38
B. Isotope Effects on the Dissociation of Acetic Acid
In Water and Deuterium Oxide
The dissociation of "ordinary" acetic acid, CH^COOH,
in "ordinary" water, Hp0:
CH^COOH ?= H+ + CH^COO" (l6)3 3
is a process about which much quantitative information has
been available for many years. Thus, in 1932 Maclnnes and
Shedlovsky [22] measured the dissociation constant,
K = "^H4"mCH^COO- TH+ YCH^COOH /
17n
mCH^COOH ^CH-.COOH3 3
at 25 °C by a conductance method. At the same time,
Harned and Ehlers [23], using an emf method, determined
the dissociation constant from to 60 °C . The concordance
between the two results at 25 °C is excellent, and for this
temperature we can write pK-. = 4.756 with confidence.
Acetic acid, however, can be dissolved in heavy water
(deuterium oxide, D?0), and there is good reason to believe
that there is exchange between deuterium and the hydrogen
of the carboxyl group in acetic acid but no exchange with
the hydrogen atoms in the methyl radical. Thus "ordinary"
acetic acid in deuterium oxide forms the molecule CH^COOD,3
and this in turn dissociates according to the process
CH COOD £=^D+ + CH^COO" ( l8
)
39
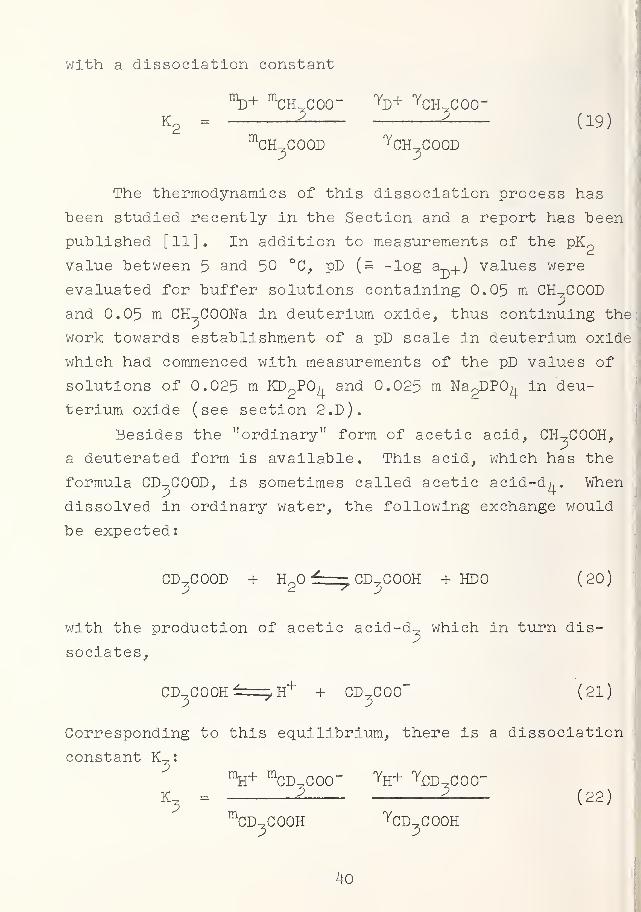
with a dissociation constant
"%+ mCH^COO- YD+ 7CH,C00-
"2KQ = 2 ^— (19)mCH^COOD YCH^COOD
The thermodynamics of this dissociation process has
"been studied recently in the Section and a report has been
published [11]. In addition to measurements of the pKpvalue between 5 and 50 °C, pD (= -log a^) values were
evaluated for buffer solutions containing 0.05 ni CH-,C00D
and 0.05 m CH-^COONa in deuterium oxide, thus continuing the
work towards establishment of a pD scale in deuterium oxide
which had commenced with measurements of the pD values of
solutions of 0.025 m KD2P0^ and 0.025 m Na
2DP0^ in deu-
terium oxide (see section 2.D).
Besides the "ordinary" form of acetic acid, CH^COOH,
a deuterated form is available. This acid, which has the
formula CD-^COOD, is sometimes called acetic acid-dh. When
dissolved in ordinary water, the following exchange would
be expected:
CD^COOD + Ho0£r==.CD^C00H + HDO (20)
with the production of acetic acid-d^ which in turn dis-
sociates,
CD^C00H^=yH+ + CD^COO" (2l)
Corresponding to this equilibrium, there is a dissociation
constant K^tmH+ "^CD^COO
- TH+ ^UD^COO"K^ = 2 2
( 22 )
mCD,C00H YCD^C00H
40
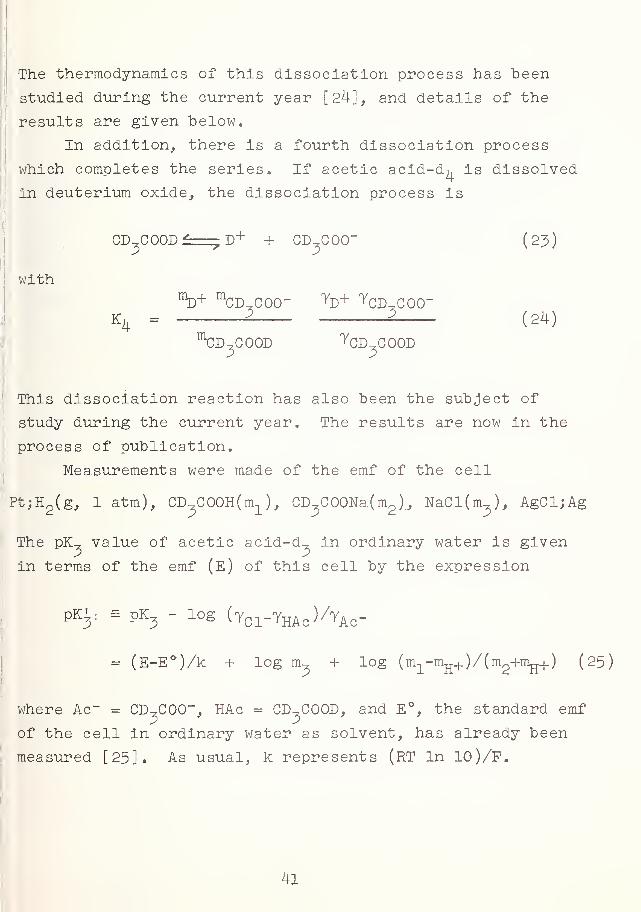
The thermodynamics of this dissociation process has "been
studied during the current year [24], and details of the
results are given below.
In addition, there is a fourth dissociation process
which completes the series. If acetic acid-d^ is dissolved
in deuterium oxide, the dissociation process is
CD3C00D±zz^D+ + CD^COO" {2J>)
withmD+ m
CD^COO~ YD+ YCD,COCTK, = -^ ^— (24)
mCD^COOD ^CD^COOD
This dissociation reaction has also "been the subject of
study during the current year. The results are now in the
process of publication.
Measurements were made of the emf of the celli
Pt;H2 (g,
1 atm), CD3C00H(m
1 ), CD,C00Na(m2 )., NaCl(nO, AgCljAg
The pK-, value of acetic acid-d^ in ordinary water is given
in terms of the emf (E) of this cell by the expression
j
pK^ ; = PK3
- log (Yd-THAc^^Ac-
= (E-E°)/k + log nu + log (m1-mH+ )/(m2+mH+ ) (25)
where Ac" = CD^COO" HAc = CD^COOD, and E°, the standard emf
of the cell in ordinary water as solvent, has already been
measured [25]. As usual, k represents (RT In 10)/F.
41
It would be anticipated that the term log
(Ypi-YwAc^/Vac- would he small, and this proved to be true.
Almost horizontal, straight-line plots of pK' against the
ionic strength gave extrapolated values of pK., at 10 tem-
peratures from 5 to 50 °C.
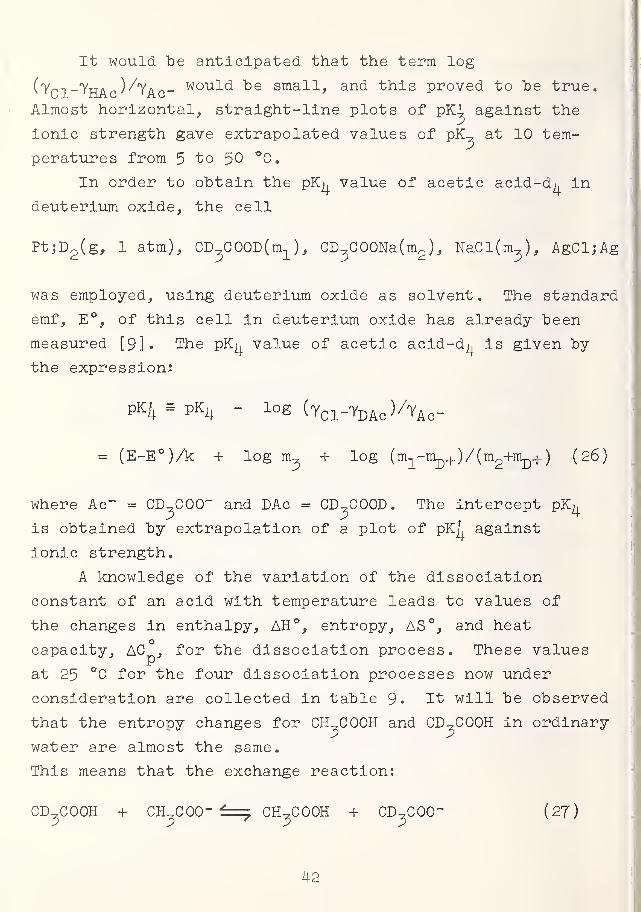
In order to obtain the pKj, value of acetic acid-dr in
deuterium oxide, the cell
Pt;D2 (g,
1 atm), CD^COOD^), CD3C00Na(m
2 ), NaCl(nw), AgCljAg
was employed, using deuterium oxide as solvent. The standard
emf, E°, of this cell in deuterium oxide has already been
measured [9K The pK^ value of acetic acid-dh is given by
the expression:
PK4 a PK4 - log (Ycl-YDAc )/YAc -
= (E-E°)/k + log rru + log (m1-mD+ )/(m2+mD+ ) (26)
where Ac" = CD^COO" and DAc = CD^COOD. The intercept pK^
is obtained by extrapolation of a plot of pK/, against
ionic strength.
A knowledge of the variation of the dissociation
constant of an acid with temperature leads to values of
the changes in enthalpy, AH°, entropy, AS°, and heat
capacity, AC , for the dissociation process. These values
at 25 °C for the four dissociation processes now under
consideration are collected in table 9- It will be observed
that the entropy changes for CH^COOH and CD^COOH in ordinary
water are almost the same.
This means that the exchange reaction:
CD^COOH + CHUC00- i=^ CH^COOH + CD^COCT (27)
42
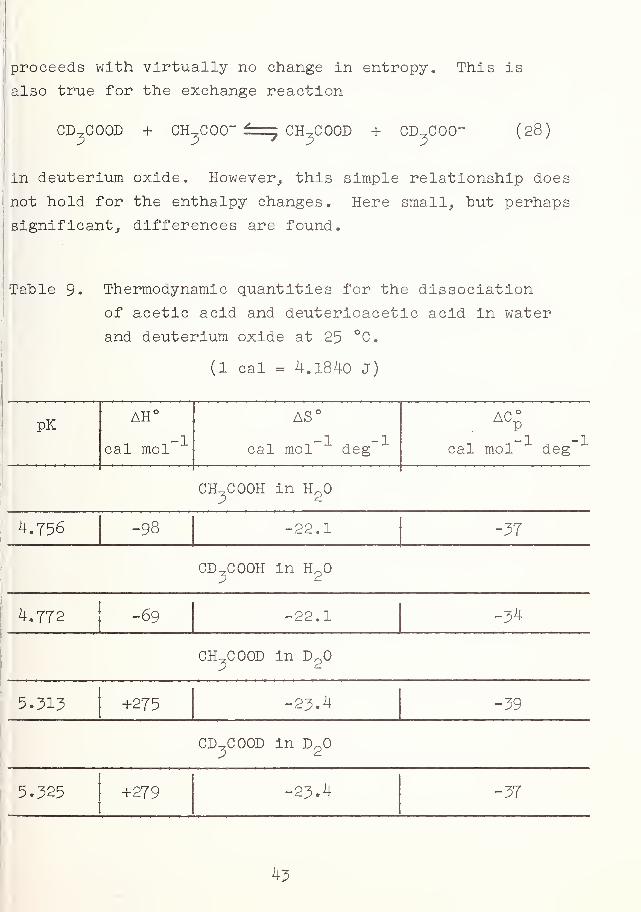
proceeds with virtually no change in entropy. This is
also true for the exchange reaction
CD,COOD + CH^COO"3 3
CH^COOD + CD^COO-3 3
(28)
in deuterium oxide. However, this simple relationship does
not hold for the enthalpy changes. Here small, but perhaps
significant, differences are found.
Table 9« Thermodynamic quantities for the dissociation
of acetic acid and deuterioacetic acid in water
and deuterium oxide at 25 °C.
(1 cal = 4.1840 J)
pK AH°
cal mol"
AS°
cal mol deg
ac;
cal mol, -1deg
CH^COOH in Ho3 2
4.756 -98 -22.1 -37
CD^COOH in Ho3 2
4.772 -69 -22.1 -34
CH^COOD in Do3 2
5.313 +275 -23.4 -39
CD^COOD in Do3 2
5.325 +279 -23.4 -37
43
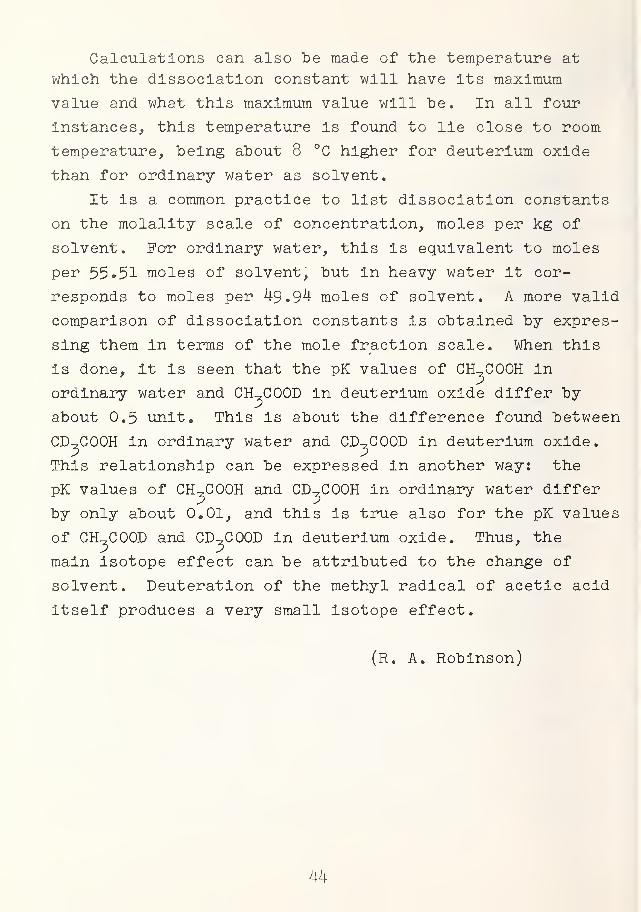
Calculations can also be made of the temperature at
which the dissociation constant will have its maximum
value and what this maximum value will be. In all four
instances, this temperature is found to lie close to room
temperature, being about 8 °C higher for deuterium oxide
than for ordinary water as solvent.
It is a common practice to list dissociation constants
on the molality scale of concentration, moles per kg of
solvent. For ordinary water, this is equivalent to moles
per 55»51 moles of solvent, but in heavy water it cor-
responds to moles per 49,94 moles of solvent. A more valid
comparison of dissociation constants is obtained by expres-
sing them in terms of the mole fraction scale. When this
is done, it is seen that the pK values of CH_,COOH in
ordinary water and CH^COOD in deuterium oxide differ by
about 0.5 unit. This is about the difference found between
CTuCOOH in ordinary water and CTUC00D in deuterium oxide.
This relationship can be expressed in another way: the
pK values of CH,C00H and CD,C00H in ordinary water differ
by only about 0.01, and this is true also for the pK values
of CH^COOD and CD-,C00D in deuterium oxide. Thus, the
main isotope effect can be attributed to the change of
solvent. Deuteration of the methyl radical of acetic acid
itself produces a very small isotope effect.
(R. A. Robinson)
44
C. Acid-Base Behavior in Organic Solvents with Low
Dielectric Constants
A definitive monograph with the above title is being
prepared for publication by the Analytical Chemistry
Division; it is also to be published by Academic Press
(possibly in a condensed version) as a chapter in one of
a series of volumes on "The Chemistry of Non-Aqueous
Solvents", edited by Dr. J. J. Lagowski of the University
of Texas. The main topics to be covered (in the sequence
indicated) are as follows: I. Introduction. II. Acid-
Base Concepts. III. Classification of Organic Solvents.
IV. The Role of Hydrogen Bonding in Aprotic Media.
V. Quantitative Aspects of Acid-Base Behavior in Aprotic
Solvents.
The longest section will be Section IV, which will
deal with the following sub-topics: A. Self-association
of nitrogen- containing bases. B. Self-association of
acids (for example, phenols, carboxylic acids, nitric
acid, phosphorus-containing organic acids). C. Hydrogen-
bonded ion pairs. D. Conjugate Ions. E. Solute-solvent
interactions. F. Theoretical aspects of hydrogen bonding,
The discussion In the various sub-sections is based on
varied kinds of experimental evidence, principally from
measurements of conductance, dielectric polarization,
colligative properties, and absorption spectroscopy
(electronic, infrared, NMR).
As of May 1966, the literature research for the mono-
graph was at least 95 percent complete. The writing of
Section IV was about two-thirds completed. There were
about 140 typed pages of manuscript, 18 figures, and
41 tables.
(M. M. Davis)
45
D. Spectrophotometric Studies of the Dissociation of
Phenols
The Section has devoted considerable attention to
acid-base effects in 50 wt. percent water-methanol as
solvent. The acids studied have been mainly of the A+B
charge type such as ammonium ion, the protonated form of
tris (hydroxymethyl)aminomethane, and 4-aminopyridinium ion.
The pK values of acids of this type are lower in 50 percent
methanol than they are in water, and this difference is a
measure of the "solvent effect," which is, in turn, a com-
bination of the medium effects for the individual species
involved in the dissociation process (see section 3. A. J>)
.
It is known that the solvent effect is of the opposite
sign for acids of the charge type A°B~. This is true for
aliphatic acids such as acetic acid and for aromatic acids
like benzoic acid. Here the pK value is higher in 50 percent
methanol than it is in water.
Measurements have now been made with a number of acids
of the A°B~ type derived from phenol. A' spectrophotometric
method was used, together with buffer solutions whose pa*
values in 50 percent methanol have been determined in
earlier emf studies. In all cases, the pK value in 50
percent methanol was found to be greater than in water.
The differences observed between the pK value in 50 percent
methanol and in water at 25 °C are listed in table 10. The
solvent effect is seen to amount to about 0.6 in pK, but it
is clear that there is a considerable dependence on the
nature of the substituent groups in the phenol. The work
is now being prepared for publication.
(B. J. Steel and R. A. Robinson)
46
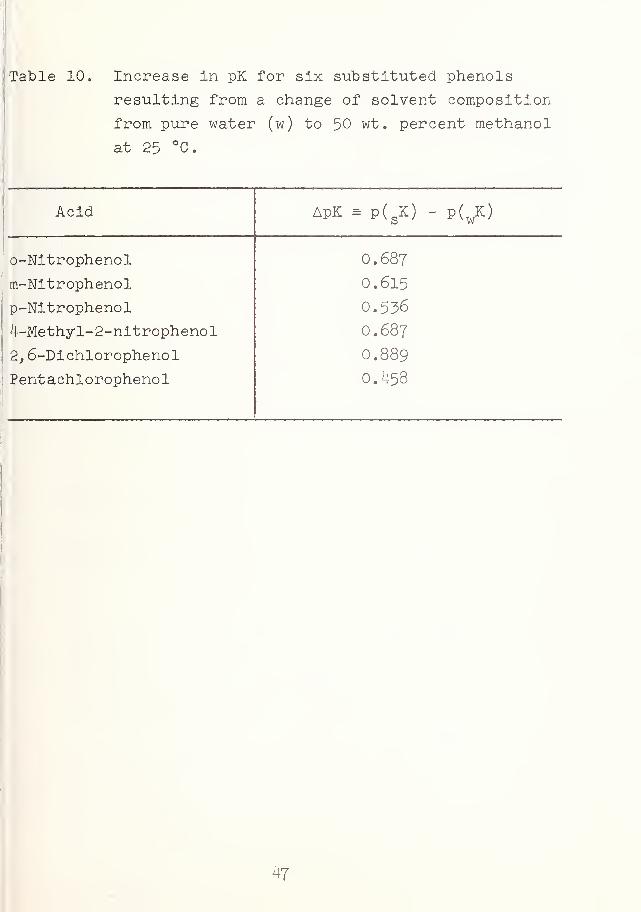
Table 10. Increase In pK for six substituted phenols
resulting from a change of solvent composition
from pure water (w) to 50 wt. percent methanol
at 25 °C.
Acid ApK = p( sK) P(wK )
o-Nitrophenol
m-Nitrophenol
p-Nitrophenol
4-Methyl-2-nitrophenol
2, 6-Dichlorophenol
Pentachlorophenol
0.687
0.615
0.536
0.687
O.889
0.458
47
4. EQUILIBRIUM STUDIES OF SYSTEMS OF ANALYTICAL INTEREST
A. Thermodynamics of the Dissociation of Morpholinlum
Ion in Water
The aqueous dissociation constants of a number of
nitrogenous bases over a temperature range have been measur-
ed previously in this laboratory by the emf method. Earlier
studies of the three ethanolamines [see reference 26] and
of the series of aminoalcohols derived from t-butylamine [27]
made possible comparisons of the basicities and other thermo-
dynamic properties of -these structurally related compounds.
It was therefore of Interest to compare the heterocyclic
amine, morpholine, with the cyclic aliphatic amines piperi-
dine [28] and pyrrolidine [29] studied earlier. The three
compounds have the following structures:
Piperidine Pyrrolidine Morpholine
Morpholine is of industrial Importance in organic chemical
reactions, as a solvent, and as a corrosion inhibitor In
steam boilers.
The dissociation constant was determined from to
50 °C by the measurement of the emf of hydrogen-silver,
silver chloride cells without liquid junction containing
buffer solutions composed of morpholine and Its hydro-
chloride. Details of the work are contained in a report
now in the process of publication.
Electromotive force measurements of cells of the type
PtjH2 (g,
1 atm), |(CH2 ) 2
0(CH2 ) 2
NH2Cl( mi ), |(CH
2 ) 20(CH
2 ) 2NH (m
2 ).
AgCl; Ag
48
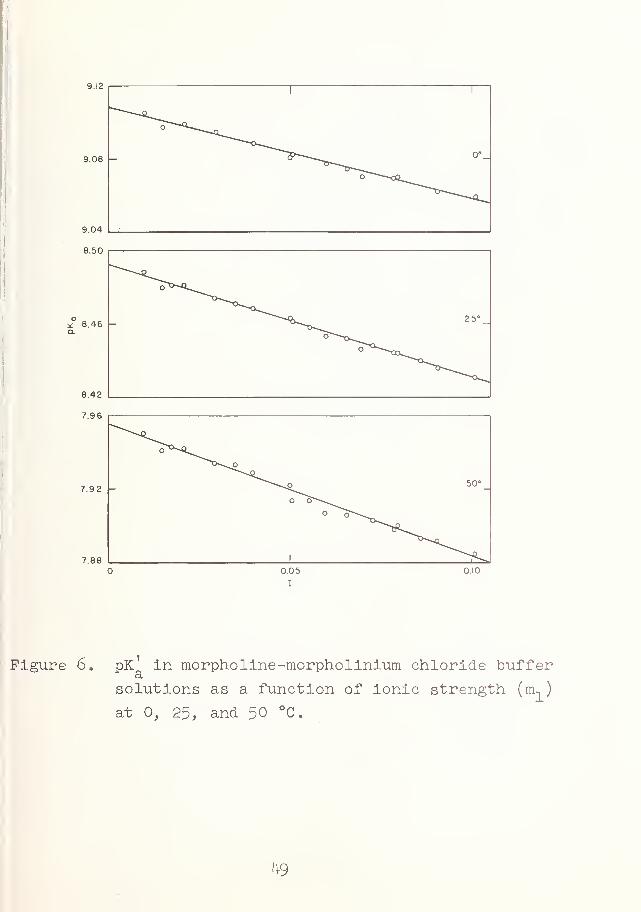
9.12
* 8.46 -
7.92
Figure 6. pK In morpholine-morpholinium chloride buffer
solutions as a function of ionic strength (m-, )
at 0, 25, and 50 °C
.
49
where m-, and m?represent the molalities of the salt and
of the free amine, respectively, were made at 11 tempera-
tures from to 50 °C. An expression for calculating the
"apparent" dissociation constant (K' ) from the emf data
was obtained by substitution of the acidity function
p( axjYri-| ) into the expression for the dissociation constant
of the protonated base. These values of the apparent dis-
sociation constant were calculated from the measured emf
E (corrected to 1 atm of dry hydrogen) by the equation
pK^ = (E-E°)/k + log (m^/m2 ) - 2Am];
/2(29)
in which E° is the standard emf, k is (RT In 10)/F, and
A is the Debye-Hiickel constant on the molal scale. Straight-
line plots of pK* against m, , positioned by least squares,
gave limiting values of pK at 1, =0 with a standard devia-a. _l
tion of 0.001 pK unit. Representative extrapolation lines
are shown in figure 6. The pK^ values were expressed as a
function of temperature (T) in °K by an equation of the
Harned-Robinson form
1663.29pK = + 4.1724 - 0.0042239T (30)
Values of the enthalpy, entropy, and heat capacity
changes for the dissociation process were calculated by
the application of the standard thermodynamic formulas to
eq. 30. The thermodynamic data for the dissociation of
morpholinium ion and the two related substances at 25 °C
are summarized in table 11. It may be noted that the
introduction of an oxygen atom into the pyrrolidine ring
decreases the basicity more than 2.8 pK units at 25 °C,
(H. B. Hetzer)
50
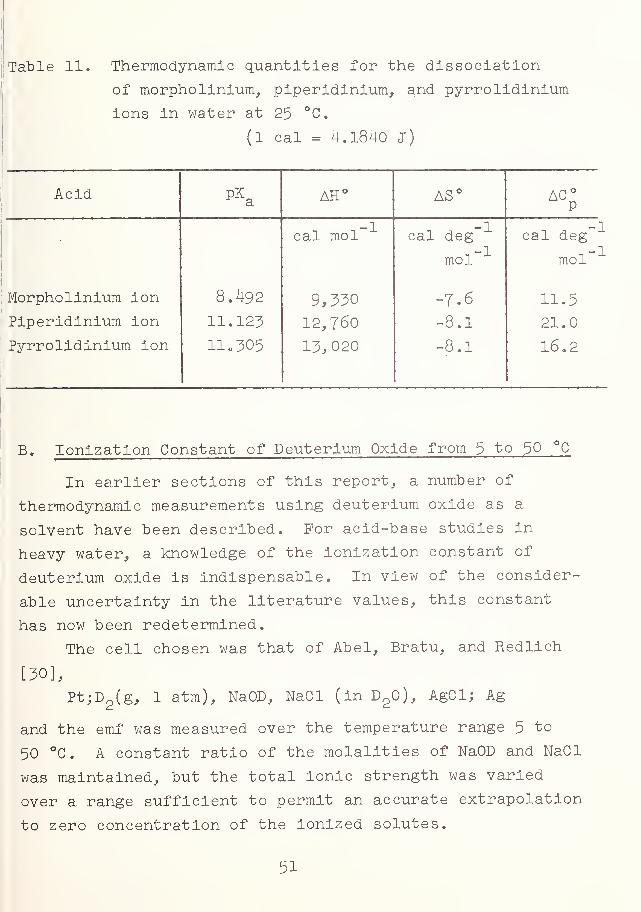
Table 11. Thermodynamic quantities for the dissociation
of morpholiniurn, piperidinium, and pyrrolidinium
ions in water at 25 °C(1 cal = 4.1840 J)
Acid pK^ a AH° AS° AC°P
cal mol cal deg
mol
cal deg-,-1
mol
Morpholiniurn ion 8.492 9,330 -7.6 11.5
Piperidinium ion 11.123 12,760 -8.1 21.0
Pyrrolidinium ion 11.305 13,020 -8.1 16.2
B. Ionization Constant of Deuterium Oxide from 5 to 50 °C
In earlier sections of this report, a number of
thermodynamic measurements using deuterium oxide as a
solvent have been described. For acid-base studies in
heavy water, a knowledge of the ionization constant of
deuterium oxide is indispensable. In view of the consider-
able uncertainty in the literature values, this constant
has now been redetermined.
The cell chosen was that of Abel, Bratu, and Redlich
[30],
Pt;D2 (g,
1 atm), NaOD, NaCl (in D20),
AgCl; Ag
and the emf was measured over the temperature range 5 to
50 °C. A constant ratio of the molalities of NaOD and NaCl
was maintained, but the total ionic strength was varied
over a range sufficient to permit an accurate extrapolation
to zero concentration of the ionized solutes.
51
A solution of sodium hydroxide (NaOD) in heavy water
was prepared by an adaptation of the method of Marsh and
Stokes [31], using the apparatus shown in figure J. The
separatory funnel of 1000 ml capacity contained 500 ml of
triply-distilled mercury and 400 ml of a 30 wt. percent
solution of sodium hydroxide in deuterium oxide. Electroly-
sis was carried out for 3 hr at a current of 4 A using a2
platinum anode 2 cm in area. Stirring of the mercury was
necessary to prevent solidification of the amalgam at the
mercury-solution interface. At the conclusion of the
electrolysis the amalgam was allowed to run into the flask
containing 600 ml of deuterium oxide through which C0p-
free, dry nitrogen had been bubbled for some hours , The
reaction between sodium amalgam and water is very slow at
room temperature. However, when the flask was maintained
at a temperature of 80 to 90 °C on a hot plate for eight
hr, sufficient reaction took place to yield a solution
about 0.5M in NaOD.
The ionization constant of deuterium oxide on the
molal (m) scale is defined by the equation
Km = m
D+'m0D-^D+^0D- / a
D2
^l)
Values of pK were calculated from the equation:^ m
pKm
S pKm " l0S ^C1-^0D- " lo% aD2
= (E-E°)/k + log mcl--/maD- , (32)
where k is written for (RT In 10)/F. Values of E* have been
determined earlier [9]. The pK 1 varies little with ionic
strength (i), even with changes in m^., ../m^- ratio; this is
to be expected since both the activity coefficient term
YCl'TOD" an<^ aDo0 are c l° se to unity.
52
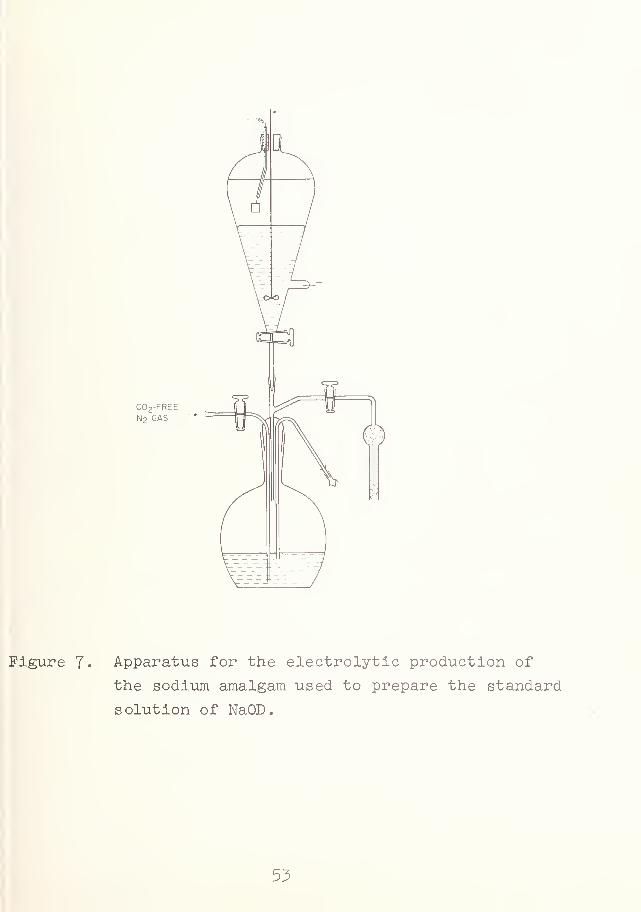
C0 2-FREE
N 2 GAS
Figure J. Apparatus for the electrolytic production of
the sodium amalgam used to prepare the standard
solution of NaOD.
53
The values of pK' were fitted, to equations linear in
I by the method of least squares, and the intercepts (pK )
at zero ionic strength were determined in this way. The
values of pK on the molal scale (pK ), the molarity scale
(pK ), and the mole fraction scale (pK^) are summarized in
table 12 and compared with the corresponding quantities for
the self-dissociation of ordinary water [32]. Values of
the ratio K(HpO)/K(D?0)
on the molal scale are also given.
The pK from 5 to 50 °C is given as a function of T, the
temperature in °K, by the equation
4913.14pK = - 7.5H7 + 0.0200854T (33)
The difference between the experimental value and that
calculated by eq. 33 did not exceed 0.001 in pK at any
temperature. The thermodynamic quantities AH°_, AS ,
and AC° for the ionization of deuterium oxide have been
calculated with the use of eq. 33. They are compared with
similar data at 25 °C for ordinary water in table 13.
The results for Hp
have been recomputed to the basis
°C = 273.15 °K.
The value of pK = 14.869 at 25 °C is in good agree-
ment with 14.86 found by Gold and Lowe [33]. The work of
Wynne-Jones [34] is not inconsistent with these two values
if one of his points is discarded. Other discordant re-
sults recorded in the literature are based on extrapola-
tions to pure DpO of data for DpO-HpO mixtures and involve
considerable uncertainty.
(A. K. Covington)
54
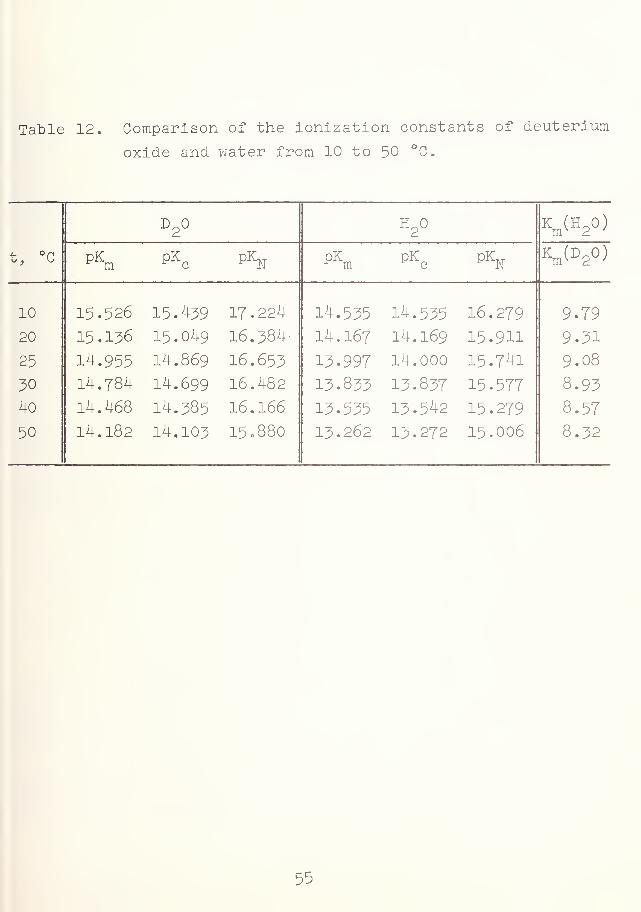
Table 12. Comparison of the Ionization constants of deuterium
oxide and water from 10 to 50 °C.
D2
H2
Km(H 20)
t, °c pK pK pK,,^ m c ^ N pK pK pK, T^ m ^ c ^ NKm (D
20)
10
20
25
30
40
50
15.526 15.439 17.224
15.136 15.049 16.384
14.955 14.869 16.653
14.784 14.699 16.482
14.468 14.385 16.166
14.182 14.103 15.880
14.535 14.535 16.279
14.167 14.169 15.9H
13.997 14.000 15.741
13.833 13.837 15.577
13.535 13.542 15.279
13.262 13.272 15.006
9.79
9.31
9.08
8.93
8.57
8.32
55
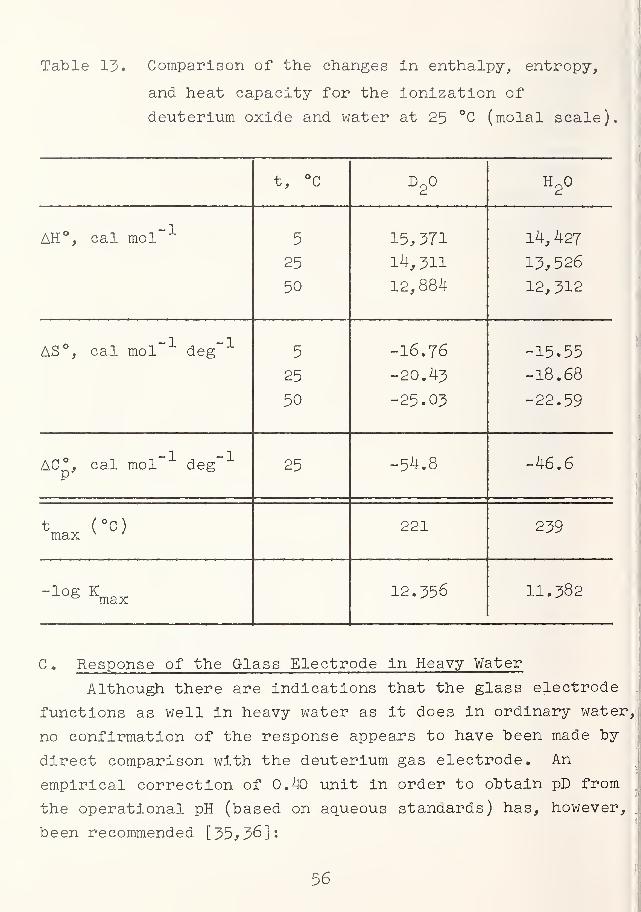
Table 13. Comparison of the changes In enthalpy, entropy,
and heat capacity for the ionization of
deuterium oxide and water at 25 °C (molal scale).
t, °G D2
H2°
AH°, cal mol" 5
25
50
15,371
14,311
12,884
14, 427
13,526
12,312
-1 -1AS°, cal mol deg 5
25
50
-16.76
-20.43
-25.03
-15.55
-18.68
-22.59
AC°, cal mol" deg" 25 -54.8 -46.6
t (°C)max v '
221 239
-log K° max 12.356 11.382
C. Response of the Glass Electrode in Heavy Water
Although there are indications that the glass electrode
functions as well in heavy water as it does in ordinary water,
no confirmation of the response appears to have "been made by
direct comparison with the deuterium gas electrode. An
empirical correction of 0.40 unit in order to obtain pD from
the operational pH (based on aqueous standards) has, however,
been recommended [35,36]:
56
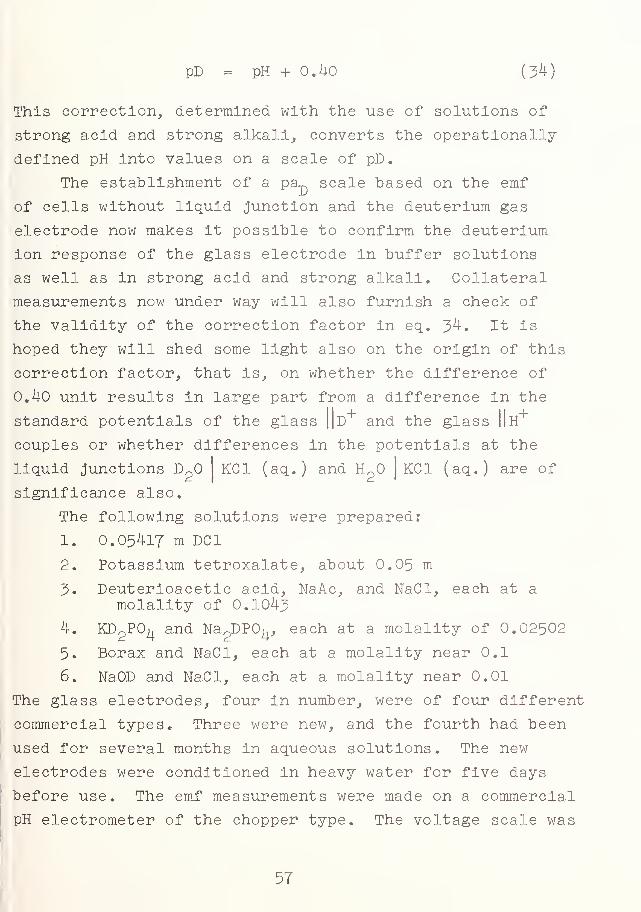
pD = pH + 0.40 (24)
This correction, determined with the use of solutions of
strong acid and strong alkali, converts the operationally-
defined pH into values on a scale of pD.
The esta.blishment of a pa^ scale "based on the emf
of cells without liquid junction and the deuterium gas
electrode now makes it possible to confirm the deuterium
ion response of the glass electrode in buffer solutions
as well as in strong acid and strong alkali. Collateral
measurements now under way will also furnish a check of
the validity of the correction factor in eq. J>k . It is
hoped they will shed some light also on the origin of this
correction factor, that is, on whether the difference of
0.40 unit results in large part from a difference in the
standard potentials of the glass ||D and the glass IIH
couples or whether differences in the potentials at the
liquid junctions DpO KC1 (aq.) and Hp | KC1 (aq.) are of
significance also.
The following solutions were prepared*
1. 0.05417 m DC1
2. Potassium tetroxalate, about 0.05m
5. Deuterioacetic acid, NaAc, and NaCl, each at amolality of 0.104^
4. KD2?0^
and Na^DPO^, each at a molality of 0.02502
5. Borax and NaCl, each at a molality near 0.1
6. NaOD and NaCl, each at a molality near 0.01
The glass electrodes, four in number, were of four different
commercial types. Three were new, and the fourth had been
used for several months in aqueous solutions. The new
electrodes were conditioned in heavy water for five days
before use. The emf measurements were made on a commercial
pH electrometer of the chopper type. The voltage scale was
57
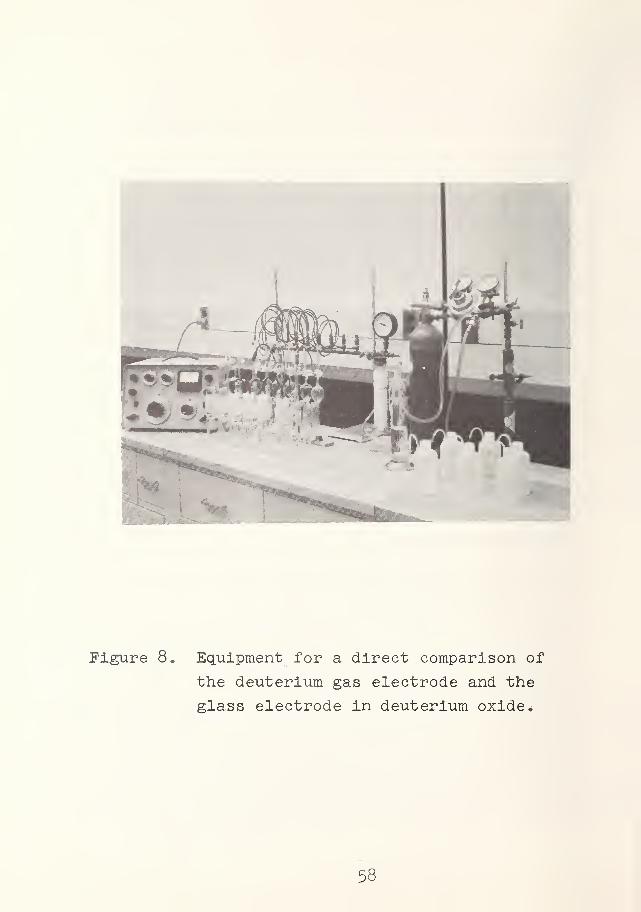
Figure 8. Equipment for a direct comparison of
the deuterium gas electrode and the
glass electrode in deuterium oxide*
58
calibrated against a. precise potentiometer and was con-
sidered reliable to 0.2 raV.
Measurements of the cell
Ptj D2 (g), Soln in D
2j|glass
were made at 25 °C . The deuterium gas electrodes were al-
lowed two hours to reach equilibrium. Each glass electrode
was placed successively in each of the six cells containing
the six test solutions, with intermediate rinsing by the
next solution before transfer. As a check, each electrode
was returned to the first solution at the end of the series.
The arrangement of cells and electrodes is shown in figure 8.
All of the glass electrodes followed the potential of
the deuterium gas electrode within 0.5 mV in the first four
solutions. In solutions 5 and 6 (pH 9.2 and 12.4, respect-
ively), there was evidence that the alkaline error is larger
than would be expected for electrodes at the same pH in
ordinary water. Drifts of the electrodes on transfer from
one solution to the next were slight, but those electrodes
which had been conditioned in heavy water and used only in
this medium performed best.
(A. K. Covington and R. G. Bates)
59
5. THERMODYNAMIC STUDIES OF AQUEOUS SOLUTIONS
OF MIXED SALTS
The program for investigating the thermodynamic
properties of solutions containing two dissolved salts is
being carried out in cooperation with the Office of Saline
Water of the U. S. Department of the Interior.
The research utilizes the isopiestic method of measur-
ing the aqueous vapor pressure of a solution. The immediate
result of an Isopiestic experiment is, therefore, a knowl-
edge of the vapor pressure of the solutions, which can also
be expressed in terms of the water activity, a , of the
solution or the osmotic coefficient, (L . Further calcula-
tions lead to a knowledge of the activity coefficients and
chemical potentials of each of the salts in the solution.
Work on the system water- sodium chloride-barium
chloride was described in last year's report [1] and has
been published [37]. In the current year, work on the
three systems:
water-potassium chloride-barium chloride
water-calcium chloride-magnesium chloridea water-sodium chloride-calcium chloride
has been completed. A paper on the first of these systems
has been published [38]* an(^ manuscripts describing work
on the other two are in press.
Data are also available for the system water-potassium
chloride-calcium chloride, and the analysis of these re-
sults is under way. A paper has also been published on
the thermodynamics of the system water-potassium chlorlde-
glycine [39]. Another paper, already published, describes
the extent to which the vapor pressure lowering of a solu-
tion of two salts can be calculated from the vapor pressure
lowerings of the separate, single salt solutions [40].
60
It has been found that the activity coefficients of
two salts B and C in a mixed solution of constant total
ionic strength can be represented by the equations
log yn = log y£ - oc m (35)'B ° rB B"T5
and
log yc= log y° - ^
cmB (36)
Here y° is the activity coefficient of a salt in its own
solution in the absence of the other salt. For example,
in the system water-calcium chloride (B)-magnesium chloride
(C) at (mB+mc ) = 4, -K^ = -O.O373 and oC
Q= O.O371. The
activity coefficient of calcium chloride in its own solution
at 4m is 2.93 and, hence, its activity coefficient in a
solution containing 2m calcium chloride and 2m magnesium
chloride is 3*48. Thus the activity coefficient of calcium
chloride is considerably higher in the mixed salt than in
a solution of the same total molality consisting only of
calcium chloride and water.
Similarly, the activity coefficient of magnesium
chloride in its own solution at 4m is 5.53, and it is 4.67
in a solution containing 2m calcium chloride and 2m magnes-
ium chloride. Thus the activity coefficient of magnesium
chloride is considerably lower in the mixed salt solution.tr tr
Trace activity coefficients, yb and yc , can also
be calculated. These are the activity coefficients of one
salt when its concentration is reduced to trace amounts,
m-p. —> or rru —> 0. Thus the trace activity coefficient
of calcium chloride as rru —> 0, m~ —> 4 is 4.13, and that
of magnesium chloride as m-, —'? 4, m^ —> is 3*93*
61
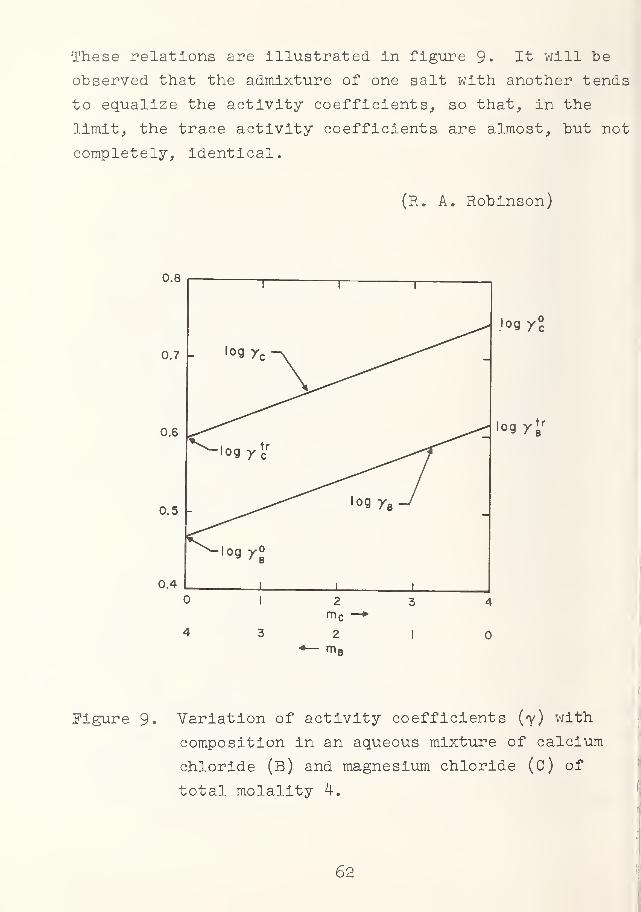
These relations are illustrated in figure 9. It will "be
observed that the admixture of one salt with another tends
to equalize the activity coefficients, so that, in the
limit, the trace activity coefficients are almost, "but not.
completely, identical.
(R. A. Robinson)
0.8
0.7 -
0.6
0.5 -
0.4
iog/2
log 7* r
Figure 9„ Variation of activity coefficients (y) with
composition in an aqueous mixture of calcium
chloride (b) and magnesium chloride (C) of
total molality 4.
62
6. CONDUCTOMETRIC DETERMINATION OP TRACES OP WATER
A. Objectives and Principle of Method
Work has continued on the development of an Instrument
for the determination of water In amounts of 0.5 to 5 nig.
The water Is to be determined in a few hundred cc of a gas
stream, such as the combustion product obtained in the
microanalysis of organic compounds for hydrogen. The princi-
ple of the instrument is based on the large effect of water
upon the conductance of 0.2M solution of sulfuric acid in a
propionic acid solvent. The specific conductance, K , of
this system at 25 °C is well represented by the empirical
equation:
105 X = (0.012705 + 9.785W)/(1.12860 - 130. 85W) (57)
where W is the weight fraction of water in the solution.
Thus, the addition of 0.1 percent of water nearly doubles
the conductance.
B. Modification of Apparatus
New conductance cells, circulation system, and
Wheatstone bridge were constructed to reduce the working
volume of solution, to eliminate several sources of leakage
and contamination, and to improve the electrical measure-
ment s
.
Electrodes were made of platinum foil silver-soldered
to nickel plates for rigidity and were separated by an
annular gasket, 1/^2 in. thick, of poly-(tetrafluoroethylene),
designated PTPE. The electrolyte cavity of the cell was
38 mm in diameter and 0.8 mm wide. This provided about the
same cell constant as the previous cell but only one-fourth
the volume. External tubing was replaced by l/l6 in. PTPE
tubing with Luer fittings, and the 4-way stopcock of the
previous apparatus was replaced by a. PTPE plug valve
.
63
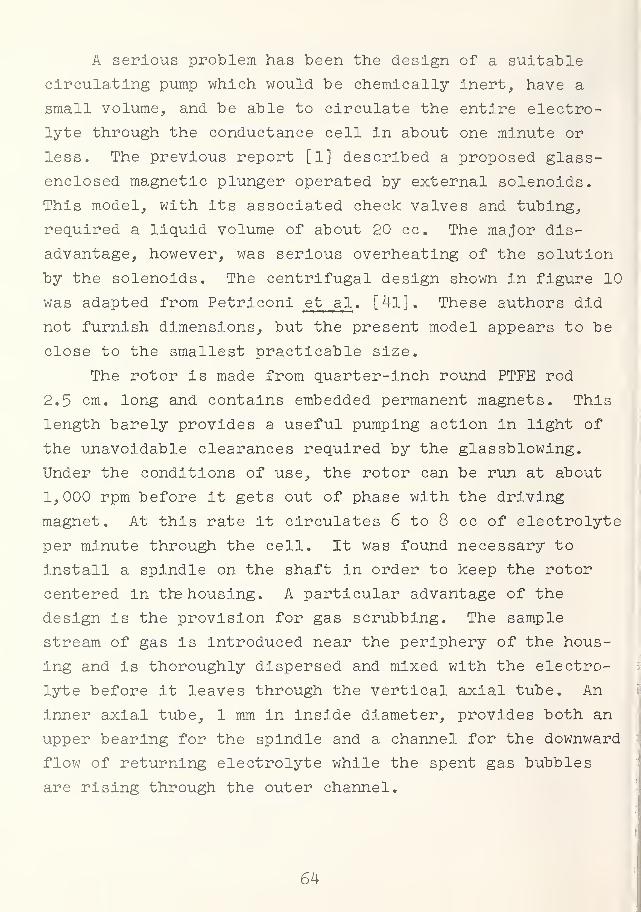
A serious problem has been the design of a suitable
circulating pump which would be chemically inert, have a
small volume, and be able to circulate the entire electro-
lyte through the conductance cell in about one minute or
less. The previous report [l] described a proposed glass-
enclosed magnetic plunger operated by external solenoids.
This model, with its associated check valves and tubing,
required a liquid volume of about 20 cc. The major dis-
advantage, however, was serious overheating of the solution
by the solenoids. The centrifugal design shown in figure 10
was adapted from Petriconi et al . [4l]. These authors did
not furnish dimensions, but the present model appears to be
close to the smallest practicable size.
The rotor is made from quarter-inch round PTFE rod
2.5 cm. long and contains embedded permanent magnets. This
length barely provides a useful pumping action in light of
the unavoidable clearances required by the glassblowing.
Under the conditions of use, the rotor can be run at about
1,000 rpm before it gets out of phase with the driving
magnet. At this rate it circulates 6 to 8 cc of electrolyte
per minute through the cell. It was found necessary to
install a spindle on the shaft in order to keep the rotor
centered in the housing. A particular advantage of the
design is the provision for gas scrubbing. The sample
stream of gas is introduced near the periphery of the hous-
ing and is thoroughly dispersed and mixed with the electro-
lyte before it leaves through the vertical axial tube. An
inner axial tube, 1 mm in inside diameter, provides both an
upper bearing for the spindle and a channel for the downward
flow of returning electrolyte while the spent gas bubbles
are rising through the outer channel.
64
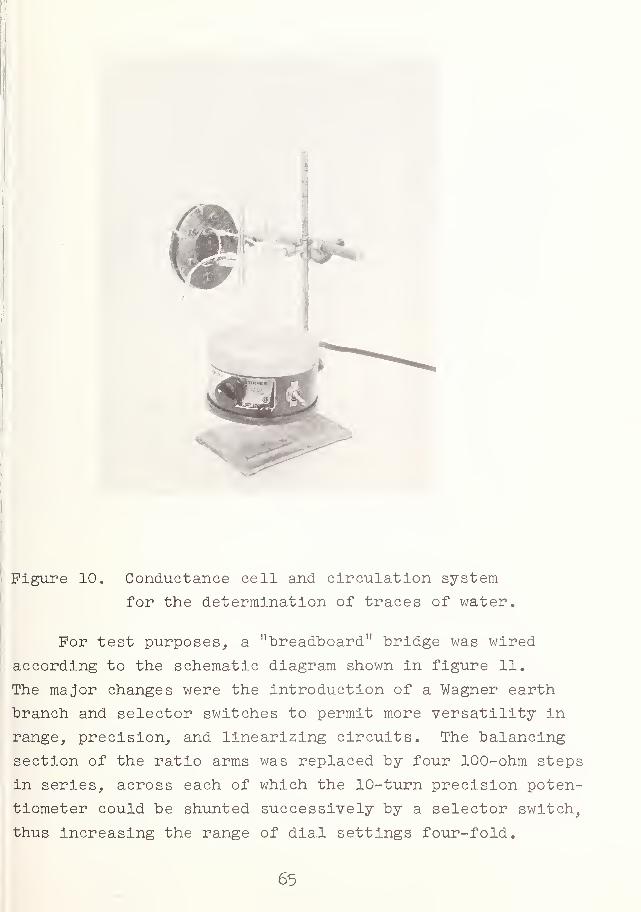
Figure 10. Conductance cell and circulation system
for the determination of traces of water.
For test purposes, a "breadboard" bridge was wired
according to the schematic diagram shown in figure 11.
The major changes were the introduction of a Wagner earth
branch and selector switches to permit more versatility in
range, precision, and linearizing circuits. The balancing
section of the ratio arms was replaced by four 100-ohm steps
in series, across each of which the 10-turn precision poten-
tiometer could be shunted successively by a. selector switch,
thus increasing the range of dial settings four-fold.
65
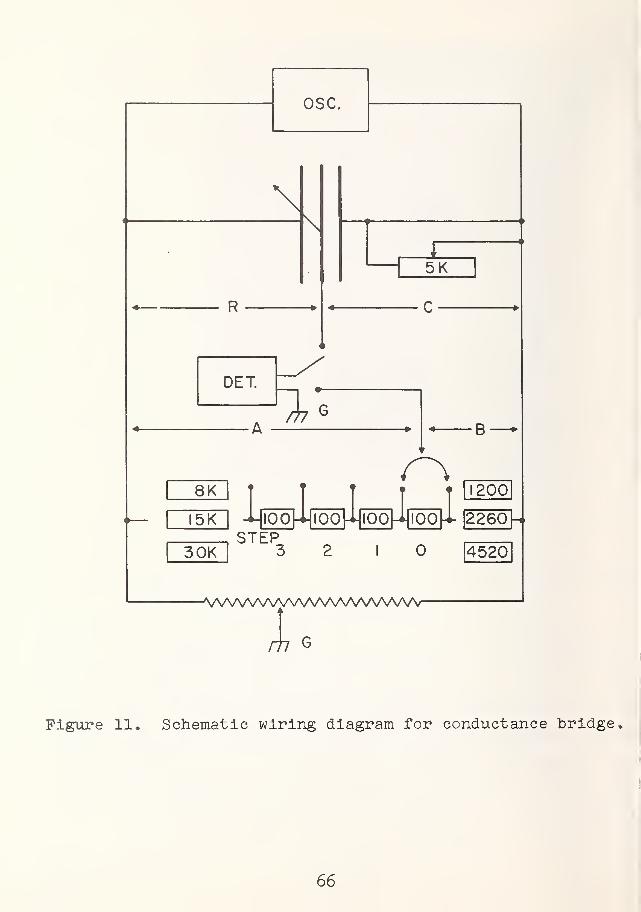
R
5K
r\8K <
Lioo-i-iooJLlOO^lOO^
t 1 1200
I5K L 2260STEP
3 2 103 OK 4520
AAM/WWNMAAAAAA/WW
rh G
Figure 11. Schematic wiring diagram for conductance bridge.
66
It was originally planned that the fixed reference arm,
in parallel with the variable shunt C, would be a closely
similar conductance cell, as indicated in figure 11. This
cell, filled with the starting electrolyte solution, would
provide automatic compensation for the initial conductance
of the solution, polarization, and any temperature changes.
Because of various erratic effects and drifting of the
initial balance, described further below, this reference
cell was replaced by a fixed 5000-ohm resistor during most
of the tests. Provision was made for plug-in capacitors
in parallel with either ratio arm or with the Wagner earth,
as required for balance.
The previous report [1] described a bridge circuit
which approximately compensated for the non-linear con-
ductance function (eq. 37). Further analysis has shown
that a. bridge with unequal arms can be designed which will
provide either an unbalance signal, or a dial reading at
null balance, which is directly proportional to the water
concentration of the electrolyte.
Equation 37 can be rearranged to the equivalent form
W = a(l - r)/(c + br) (38)
where a = 0.143^ b = 110.43, c = 16.624, and r is the
specific resistance of the solution relative to that of the
anhydrous solvent. For a simple Wheatstone bridge, it can
be shown that the ratio (e) of the output signal to the
input signal is given by
e = (SC-R)/[(1 + B)(C + R)] (39)
where S is the ratio of ratio arms, A/B; C is the equivalent
resistance of the reference arm, and R is the resistance of
the unknown arm. If it is required that e = kW, where k is
a proportionality constant, then a comparison of the equa-
67

tions reveals the conditions:
SC = 1 (40a)
(1 - S)S = kc/a (40b)and
(1 +S) = kb/a (40c)
with the result that S = b/c, C = c/b, and k = bc/[a(b+c)],
in terms of the parameters of the conductance formula set
forth in eq. ;>8; S is 6.64 and k has about half the maximum
value of de/dW for an equal-arm bridge. This loss of
sensitivity is the price of a linear response.
A corresponding treatment in terms of the change in
resistance ratio required to bring the bridge to null
balance gave a corresponding value of k and, further, de-
fined absolute values for the fixed resistors in A and B
such that the 400 ohms available for dial settings should
correspond to any desired concentration range of water.
Three such ranges were provided in the bridge.
C. Calibration with Water
Calibration of the system by means of weighed additions
of water from a micropipet have, in general, confirmed the
response of the electrolyte system and the circuitry as
derived from the conductance equation. The precision of
these measurements, however, was very disappointing. When
fresh electrolyte was put in the clean, dry instrument,
the initial balance condition fluctuated erratically, but
somewhat cyclically, for an hour or two, eventually set-
tling down to a steady drift toward increasing conductance.
When the apparatus stood idle for several days at a time,
there was little change, but as soon as circulation of the
solution was resumed the same drift was observed; hence the
calibrations had to be made against the background of chang-
ing reference and conductance. It seemed improbable that
68
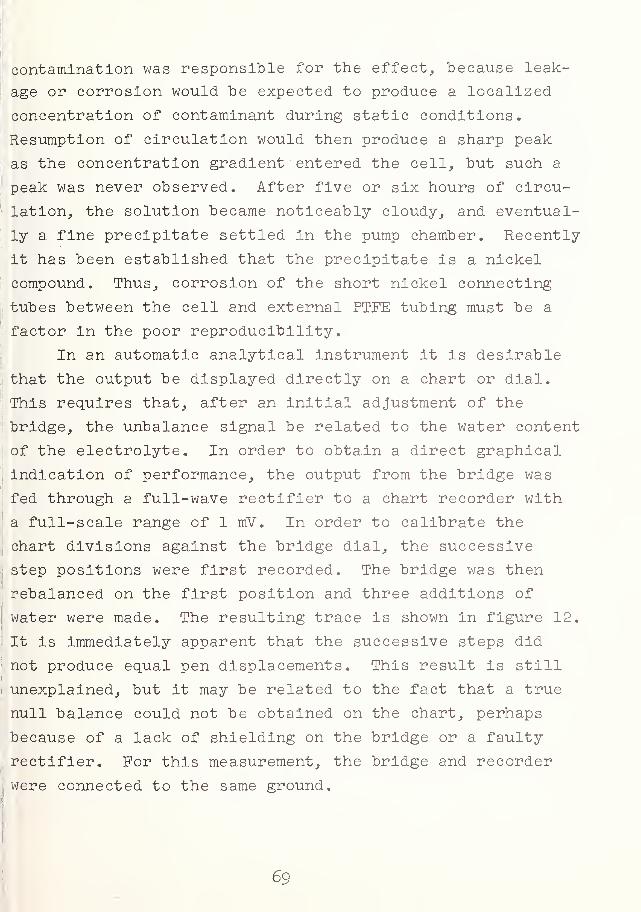
contamination was responsible for the effect, because leak-
age or corrosion would be expected to produce a localized
concentration of contaminant during static conditions.
Resumption of circulation would then produce a sharp peak
as the concentration gradient entered the cell, but such a
peak was never observed. After five or six hours of circu-
lation, the solution became noticeably cloudy, and eventual-
ly a fine precipitate settled in the pump chamber. Recently
it has been established that the precipitate is a nickel
compound. Thus, corrosion of the short nickel connecting
tubes between the cell and external PTFE tubing must be a
factor in the poor reproducibility.
In an automatic analytical instrument it is desirable
that the output be displayed directly on a chart or dial.
This requires that, after an initial adjustment of the
bridge, the unbalance signal be related to the water content
of the electrolyte. In order to obtain a direct graphical
indication of performance, the output from the bridge was
fed through a. full-wave rectifier to a chart recorder with
a full-scale range of 1 mV. In order to calibrate the
chart divisions against the bridge dial, the successive
step positions were first recorded. The bridge was then
rebalanced on the first position and three additions of
water were made. The resulting trace is shown in figure 12.
It is immediately apparent that the successive steps did
not produce equal pen displacements. This result is still
unexplained, but it may be related to the fact that a true
null balance could not be obtained on the chart, perhaps
because of a lack of shielding on the bridge or a faulty
rectifier. For this measurement, the bridge and recorder
were connected to the same ground.
69
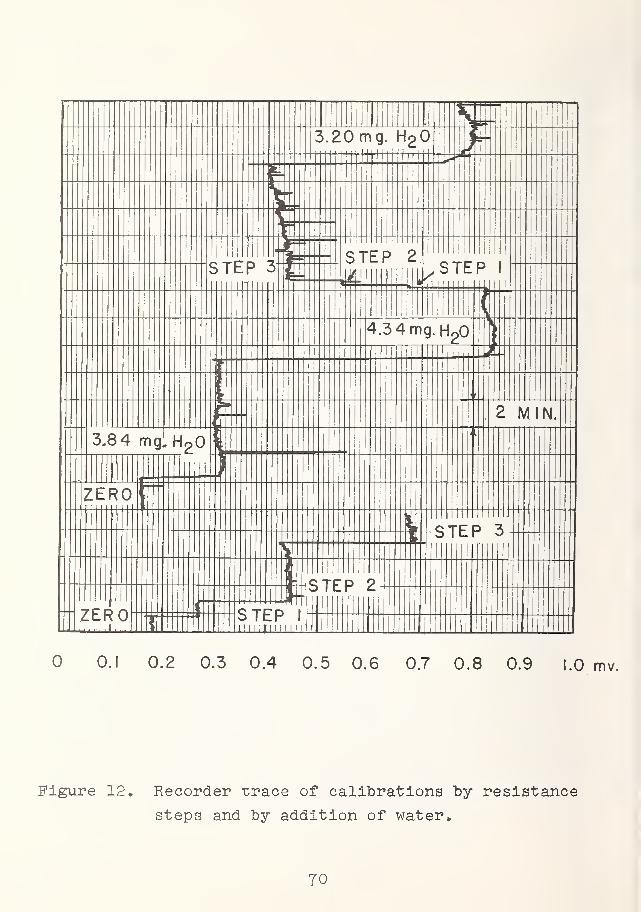
0.1 0.2 0.3 0.4 0.5 0.6 0.7 0.8 0.9 1.0 mv.
Figure 12. Recorder trace of calibrations by resistance
steps and by addition of water,
70
Although It is less obvious, the chart record for
water additions Is also nonlinear. In curve I of figure 1J>,
"equivalent" step positions, as derived by an admittedly
crude Interpolation of the chart calibration, are plotted
against the water additions. The system contained 13.224 g
of electrolyte, so the final point represents nearly 0.1
percent water. The chart shows a very rapid response after
the addition, of water, but there seems to be a small cyclic
change with a period of 5 min as complete mixing takes
place. Despite the rather noisy record, it is evident that
0.2 mg of water is detectable in the more sensitive region
of the chart
.
For a more careful calibration, the output of the
bridge was connected to a tuned amplifier-null detector
combination, and the bridge was rebalanced after each ad-
dition of water. The result of one such calibration is
shown in curve II of figure 13 . The difference in slopes
of curves I and II Is due to different' positions of the
range switch. The expected slope of curve II is 0.0573
while the observed value is 0.05^5.
D. Analysis of Errors
Consideration has been given to the ultimate precision
which might be obtainable. For observation of the bridge
unbalance signal, the relation between W and signal, as-2
outlined in section 6.B, is dW/de = 1 x 10 . It is doubt-
ful that a digital a.c. voltmeter costing under $3,000
could measure the signal with an error much less than 0.1
percent. Thus, the probable error in W would be 1 x 10 ,
corresponding to 0.1 mg of water in 10 g of electrolyte.
As related to the microanalysis of organic compounds, this
uncertainty corresponds to about 0.01 mg of hydrogen, or
1 percent absolute on a sample weighing 1 mg. The method
71
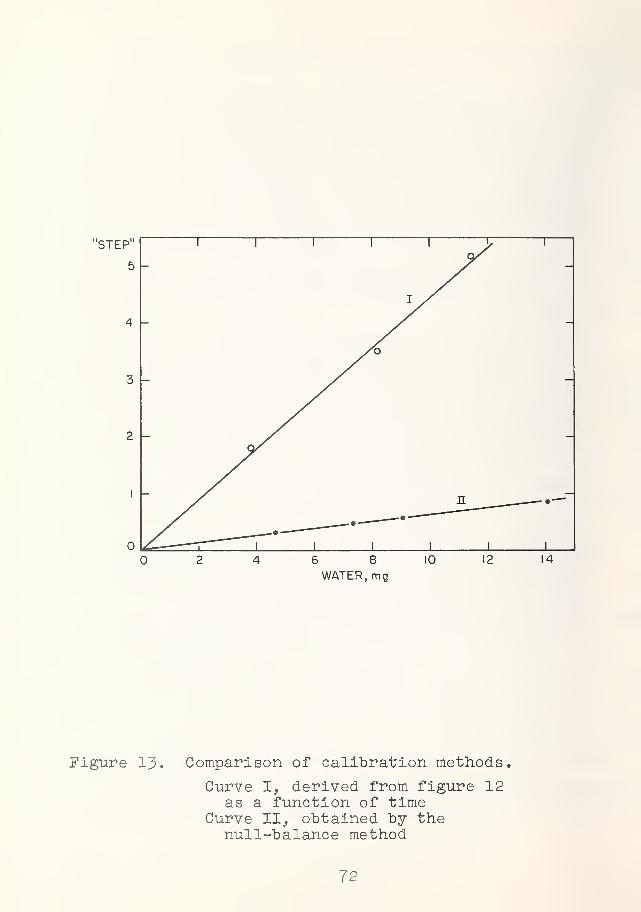
6 8
WATER, mg10
Figure 13. Comparison of calibration methods.
Curve I, derived from figure 12as a function of time
Curve II, obtained by thenull-balance method
72
would thus be suitable only for routine or uncritical
applications. The null-detector balance method of opera-
tion places less stringent requirements on the detector
but is limited by the accuracy of the potentiometer (0.1
percent). The corresponding analysis indicates that the
probable error in W would be an order of magnitude less,
permitting the determination of hydrogen in a 1 mg sample
with an absolute error of 0.1 percent. To extend the
accuracy further would require precision conductance tech-
niques and several decades of precision resistors in the
bridge. This entire analysis is based on the application
of eq. 37 for the conductance of the electrolyte system.
It is unlikely that this empirical relationship is accurate
to better than 0.5 percent over the working range, and there-
fore a careful calibration will be required.
E. Status of the Project
Steps which are called for immediately are the re-
placement of nickel in the cell and the provision of better
shielding and placement of the bridge components. There is
room for further improvement in the absorption- circulation
system in the direction of reducing the volume and the time
required to reach a steady value of the conductance.
(T. B. Hoover)
73
7. KINETIC TECHNIQUES IN TRACE ANALYSIS
The principal investigator was on assignment to the
Coast and Geodetic Survey as a Science and Technology
Fellow during most of the year. For this reason, there is
very little progress on this project to report
During the early months of the reporting year, however,
a summary describing the use of reaction rate methods in
analytical chemistry was written. This summary was prepared
for internal use as an aid to the Division and Section in
formulating future plans for work in this area. Reaction
rate methods were subdivided Into three general classes,
namely catalytic methods, enzyme-catalyzed reactions, and
differential rate methods.
Catalytic methods take advantage of the susceptibility
of certain reactions to catalysis by substances present in
trace amounts, and are, therefore, directly applicable to
problems in trace analysis. Nearly 90 different reactions
which have been successfully employed for this purpose were
identified In the literature. The summary contains a table
which lists 32 elements that have been determined by the
catalytic method, summarizes the concentration range or
sensitivity, and notes any serious interferences that have
been studied. The transition metals constitute most of
the group of 32 elements.
The current status of enzyme-catalyzed reaction methods
was discussed, although the literature search was not as
exhaustive as It was for the catalytic methods.
74
Quantitative methods "based on the use of differential
reaction rates depend on the fact that two or more related
compounds in a mixture may undergo the same type of reaction
at different rates- These methods are generally applicable
to binary and often to ternary mixtures of organic compounds
such as homologs or isomers containing the same functional
group. The summary lists all of the binary and ternary
mixtures for which special procedures have been established
and reported in the literature.
(R. K. Wolford)
75
8. STANDARD REFERENCE MATERIALS FOR ACIDIMETRY
A. Homogeneity Tests of Potassium Hydrogen Phthalate 84h
The purpose of this work was to determine if the
commercial "candidate" lot of potassium hydrogen phthalate
was of sufficient uniformity and purity to warrant analysis
and certification as an NBS acidlmetric standard.
The material was analyzed "by weight titration with
aqueous carbonate-free alkali standardized against NBS
potassium hydrogen phthalate 84d. The value: of 99.98o
percent purity, obtained by Bates and Wichers [92] by
differential titration with the hydrogen electrode, was
used for sample 84d. The procedure was essentially that
suggested on the NBS certificate for the use of this
material as an acidimetric standard, except that larger
samples (approximately 2 g) were titrated. The base was
added from an enlarged weight buret delivering approximately]
120 g of solution.
The end point at pH 8.7, the inflection point obtained
experimentally by Bates and Wichers, was detected by means
of a glass electrode. The change in pH per drop of base
was recorded for several drops below and the one immediately
above pH 8.7. The buret was then weighed. From the known
weight of one drop of base, the weight which would have
changed the pH to 8.7 was interpolated. Results of analyses
of samples taken from the top, middle, and bottom of each
of the seven containers are given in table 14. The assay
values are given in percent.
With the three sets of duplicates averaged, the
standard deviation for the variability of the results is
0.0073. The conclusion from the analysis of variance was
that, since the differences from container to container
76
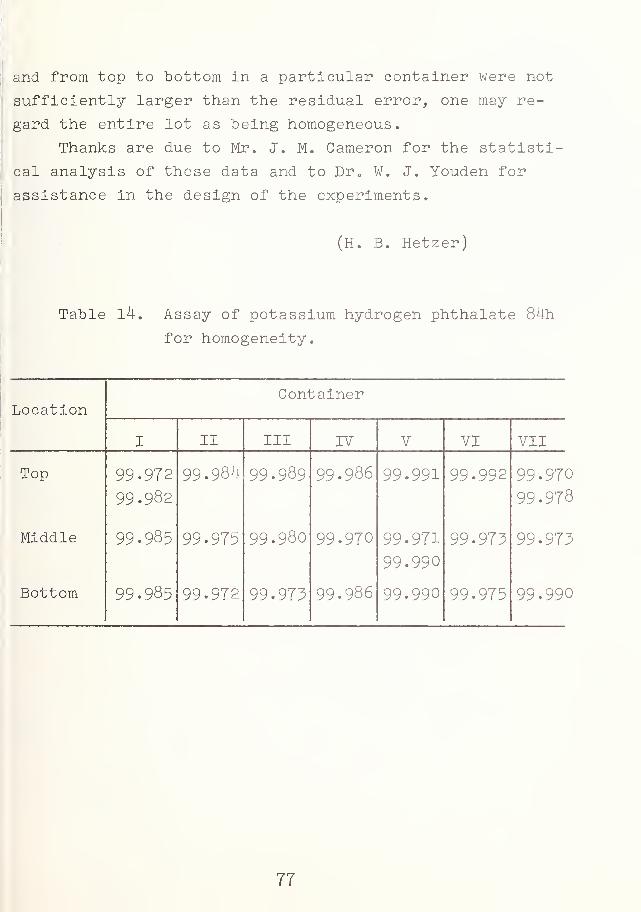
and from top to bottom in a particular container were not
sufficiently larger than the residual error, one may re-
gard the entire lot as being homogeneous.
Thanks are due to Mr. J. M. Cameron for the statisti-
cal analysis of these data and to Dr D W. J. Youden for
assistance in the design of the experiments.
(H. B. Hetzer)
Table 14. Assay of potassium hydrogen phthalate 84h
for homogeneity.
LocationContainer
I II III IV V VI VII
Top
Middle
Bottom
99-972
99.982
99.985
99.985
99.984
99.975
99.972
99.989
99.980
99.973
99.986
99.970
99.986
99.991
99.971
99.990
99.990
99.992
99.973
99.975
99.970
99.978
99.973
99.990
77
B. Certification of Potassium Hydrogen Phthalate 84h
as an Acidimetric Standard
The constant-current coulometric method was chosen
for the determination of the assay of a new lot of potas-
sium hydrogen phthalate, to be issued as a Standard
Reference Material for acidimetry. This method has the
advantage over other conventional methods of analysis that
it involves the titration of the sample with a measured
quantity of electricity. The results are therefore refer-
red to fundamental physical constants such as the volt,
ohm, and second, all of which can be easily and accurately
measured.
By combining Faraday's law of electrolysis with Ohm's
law, one can calculate the amount of electrochemical re-
action during electrolysis by means of the equation
iAt(no. of equivalents) = (4l)
where i is the current in amperes, At' is the elapsed time
in seconds, and F is the faraday. The latest value for
the faraday is 96,487.0 C equiv" . Thus in a hydrogen
coulometer the quantity of hydroxyl ions produced as the
titrating reagent can be determined with a high degree of
accuracy and precision from the known magnitude of the
current passed and the time elapsed.
The technique for precise coulometric titration of
acids and bases has been worked out previously by Taylor
and Smith [43]. The facilities used in this work were part
of the equipment of the Micro chemical Analysis Section and
have been described and illustrated in the annual report
of that section for the year 1965 [44]. Acknowledgment is
made to George Marinenko for instruction in the use of
the equipment
,
78
In general, the experimental procedures developed by
Taylor and Smith were followed. From the seven containers
of potassium hydrogen phthalate, the homogeneity of which
had been studied by H. B. Hetzer (see section 8.A), six
samples were taken at random for coulometric study. Two-
gram samples were ground gently, dried at 120 °C for two hr,
and titrated by passing a known amount of current through
a cell consisting of a platinum cathode and a silver anode,
with a 1 M solution of potassium chloride as the supporting
electrolyte. The titration was performed under a nitrogen
atmosphere, and the end point of the titration was determin-
ed by noting the pH changes, indicated by a glass-calomel
combination electrode, as the last 0.05 percent of the total
current was passed in small increments through the solution.
A typical end point determination is shown in figure 14.
Curve a represents the pH indicated by the glass electrode
as a function of time. Curve b is the differential plot
from which the inflection point of the titration curve was
determined. An error of 0.005 percent in the total assay
is represented by 25 seconds on the plot.
The results obtained for 17 titrations of the new lot
are given in table 15. The values in curly brackets indi-
cate duplicate titrations of the same grind. The data were
analyzed by Mr. J. M. Cameron, and the purity of the sample
was found to be 99.9921 percent, with a standard deviation
of O.OO65 for a. single determination. The analysis of
variance supports the statement, with approximately 95
percent confidence, that 99 percent of all samples have
assay values lying in the interval 99.9921 ± 0.0288.
(M. Paabo)
79
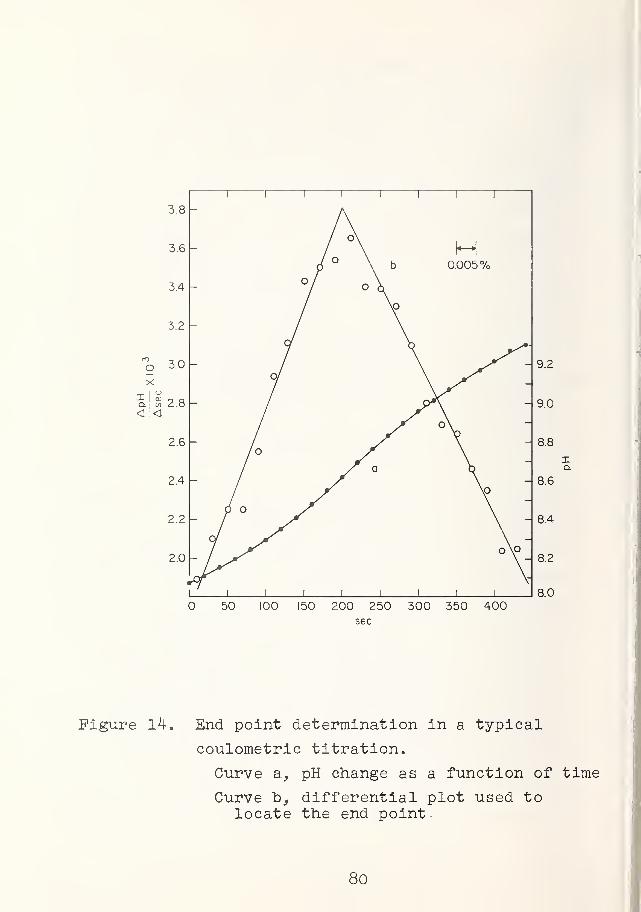
3.8
1 r i r
H0.005%
50 100 150 200 250 300 350 400sec
Figure 14. End point determination in a typical
coulometric titration.
Curve a, pH change as a function of time
Curve b, differential plot used tolocate the end point
80
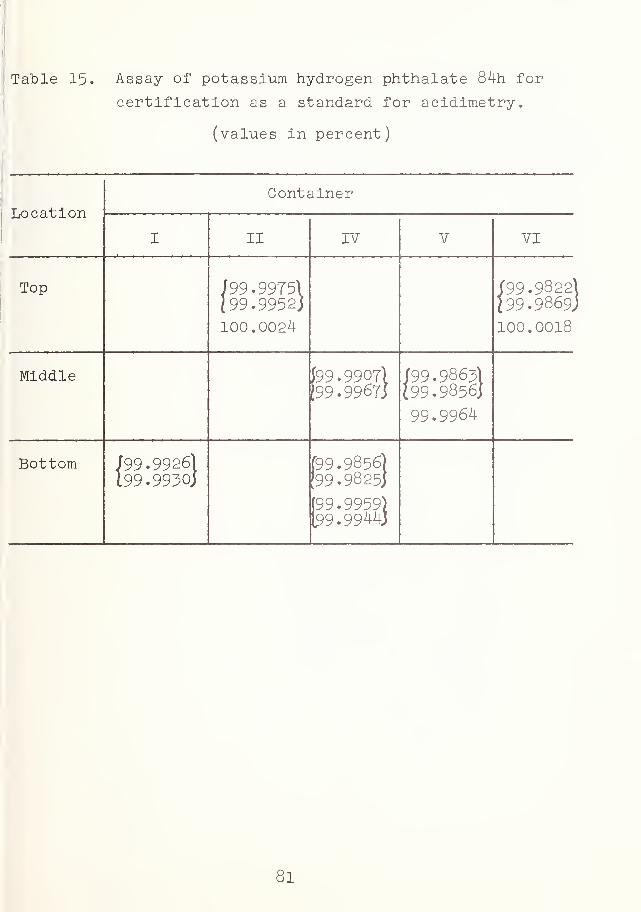
!
Table 15. Assay of potassium hydrogen phthalate 84h for
certification as a. standard for acldlmetry.
(values In percent)
LocationContainer
I II rv V VI
Top /99. 99751(99.9952)
100.0024
(99.98221
1 99. 9869J
100.0018
Middle 199.9907)[99.9967]
(99.9863)199.9856]
99.9964
Bottom i99. 99261l99.99!50j
(99.9856)!99.9825j
(99.9959)(99.99443
81
C . Status of Certification Procedures for Standard
Reference Materials
Precise acidimetry has always presented an unrelenting
challenge. Coulometric titrations and differential poten-
tioraetric titrations with the hydrogen electrode have shown
themselves capable of sensitivities of a few thousandths of
one percent in the assay of standard materials for acidimetry.
As conducted here, these methods are providing accuracy which
we believe is not exceeded elsewhere. The statistical ex-
amination of the data, for potassium hydrogen phthalate 84h
suggests strongly that the accuracy of the analysis surpas-
ses the degree of homogeneity now attainable on a large lot
of material. The sensitivities of these refined methods
are likewise so great that distinctions between the inflec-
tion point of the titration curve and the true equivalence
point may have to be made. These differences are not clear-
ly understood, and studies of end points may have to be
undertaken.
Somewhat different problems are encountered in the
certification of reference standards for pH measurements.
The experimental emf measurements which lead unambiguously
to values of the acidity function p(aHYr,-,) have been de-
veloped to a high level of precision in our laboratory.
An accuracy of 0.002 pH unit is attainable in water and in
the other media we have studied, over most of the experi-
mental temperature range. However, the assigned pH(s) is
derived from this well-defined acidity function by intro-
duction of an arbitrary convention whose "accuracy" cannot
be assessed. Furthermore, the instruments used almost
universally in the measurement of pH utilize a cell with
liquid junction. The vagaries of the liquid-junction
potential are such that the experimental pH values can
82
rarely be considered reproducible to better than 0.01 unit
regardless of the refinements in the standard values for
the reference materials with which the assembly is standard-
ized. There remains always the challenge to reduce the
variance in the assigned pH(s)j an even greater challenge
is presented by the prospect of designing an improved
instrument for practical pH measurements.
(R. G. Bates)
83
9. FOREIGN-CURRENCY PROGRAMS
Two projects being conducted at universities in India
and financed through the provisions of Public Law 480 are
sponsored by the Electrochemical Analysis Section. A brief
description of these programs follows.
A project entitled "Properties of Electrolytes in
Nonaqueous Media" is being conducted at Jadavpur University
in Calcutta under the supervision of Dr. M. N. Das and
Dr. K. K. Kundu. At the present time Dr. Das and Dr. Kundu
are studying the properties of weak electrolytes in glycol-
water solvents over a. range of temperatures. Work has been
done on the standard emf of the hydrogen-silver chloride
cell in glycol-water media, and similar studies of the
hydrogen -silver bromide cell have been initiated. Data.
for the pK values of monoethanolammonium ion and diethanol-a
ammonium ion have also been obtained in these solvents.
A project entitled "Physicochemical Studies in Non-
aqueous Solvents" is being pursued at Panjab University,
Chandigarh, under the supervision of Professor Ram Chand
Paul. Professor Paul's current interests include the
behavior of Lewis acids in molten acetamide solvents.
Conductometric methods have been used, and several solvates
have been isolated and identified. The work is being
extended to studies of the solvation of electrolytes in
general, including protonic acids, in amide solvents.
Dissociation constants of weak electrolytes will be de-
termined, and an investigation of ion-pair formation in
these media is planned.
(R. G. Bates)
84
10. PERSONNEL
Roger G. Bates, Section Chief
R. A. Robinson, Assistant Section Chief
Marguerite Raudenbush, Section Secretary
Electromotive Force andOptical Measurements of Acidity
V. E. Bower
A. K. Covington, On leave from the Universityof Newcastle upon Tyne, England.
R. Gary
Hannah B. Hetzer
Maya Paabo
R. A. Robinson
Barry J. Steel, On leave from the University ofAdelaide, South Australia.
Conductance Measurements
T. B. Hoover
Dielectric Measurements
C. G. Malmberg
Acid-Base Studies in Inert Solvents
Marion M. Davis
Isopiestic Vapor Pressure Measurements
V. E. Bower
R. A. Robinson
Kinetic Studies
R. K. Wolford
Solubility Studies
P. W. Schindler, Guest worker of the SwissNational Foundation, on leavefrom the University of Bern.
85
11. COMMITTEE MEMBERSHIPS
Roger G. Bates
Member, Subcommittee on Hydrogen Ion Determinations,ASTM Committee E-l, Sub. 22.
Councilor, American Chemical Society, Washington Section.
Member, NRC Committee on Symbols, Units, and Terminologyfor the Physical Sciences (U.S. National Committee forISO/TC-12).
Member, U.S. National Committee for IUPAC
.
Member, Commission on Electrochemistry, IUPAC.
Member, Commission on Symbols, Terminology, and Units,IUPAC
.
Associate Member, Commission on ElectroanalyticalChemistry, IUPAC.
Member, Subcommittee on Physiocochemical Symbols andTerminology, Committee on Physical Chemistry, NRC.
Member, Advisory Board, Analytical Chemistry .
Member, Board of Editorial Advisors, Analytica ChimicaActa .
Member, Board of U.S. Civil Service Examiners(Chemistry Panel).
Member, Washington Editorial Review Board (NBS).
Member, Committee on Units and Usage (NBS).
Member, Museum Committee (NBS).
Marion M. Davis
Member, American Association of University WomenEducational Foundation, Committee on Fellowshipsto American Women.
Member, Committee on Long-range Planning,Chemical Society of Washington.
Member, Board of U.S. Civil Service Examiners(Chemistry Panel).
36
Robert Gary
Treasurer, Society of The Sigma Xi, D.C. Chapter.
R. A. Robinson
Secretary, Commission on Electroanalytical Chemistry,IUPAC
.
8T
12. PUBLICATIONS AND MANUSCRIPTS, JULY I965 TO JUNE I966
1. Paabo, M., Bates, R.G., Robinson, R.A.Standardization of Analytical Data Obtained with Silver-Silver Chloride Electrodes in Methanol-Water Solvents.Anal. Chem. 37, 462-464 (1965).
2. Bower, V.E., Robinson, R.A.Thermodynamics of the Ternary System: Water-Glycine-Potassium Chloride at 25 °C from Vapor PressureMeasurements
.
J. Res. Natl. Bur. Std. 69A, 131-135 (1965).
3- Robinson, R.A., Bower, V.E.An Additivity Rule for the Vapor Pressure Lowering ofAqueous Solutions.J. Res. Natl. Bur. Std. 69A , 365-367 (1965).
4. Robinson, R.A., Bower, V.E.Osmotic and Activity Coefficients ofTris(hydroxymethyl)aminomethane and its Hydrochloridein Aqueous Solutions at 25 °CJ. Chem. and Eng. Data 10, 246-247 (1965).
5. Gary, R., Bates, R.G., Robinson, R.A.Dissociation Constant of Acetic Acid in DeuteriumOxide from 5 to 50°. Reference Points for a pD Scale.J. Phys. Chem. 69, 2750-53 (1965).
6. Woodhead, M., Paabo, M., Robinson, R.A., Bates, R.G.Buffer Solutions of Tris(hydroxymethyl)aminomethanefor pH Control in 50 Wt . % Methanol from 10 to 40 °C
.
Anal. Chem. 37, 1291 (1965).
7. Robinson, R.A., Bower, V.E.Properties of Aqueous Mixtures of Pure Salts:Thermodynamics of the Ternary System Water-PotassiumChloride-Barium Chloride at 25 °C.J. Res. Natl. Bur. Std. 69A, 439-448 (1965).
8. Bates, R.G. (Ed.)Electrochemical Analysis: Studies of Acids, Bases,and Salts by EMP, Conductance, Optical, and KineticMethods.NBS Technical Note 271 (September 6, 1965).
9. Davies, J.M., McQue, B., Hoover, T.B.Heat Transferred by Decomposition Products fromCotton Fabrics Exposed to Intense Thermal Radiation.Textile Res. J. 35, 757-769 (1965).
88
10. Bates, R.G.Book Review - "Acid-Base Equilibria" by E. J. King,Anal. Chem. 37, 57A (1965).
11. Paabo, M., Bates, R.G., Robinson, R.A.Dissociation of Ammonium Ion in Methanol-Water Solvents.J. Phys. Chem. 70, 247-251 (1966).
12. Paabo, M., Bates, R.G., Robinson, R.A.Dissociation of Acetic Acid-d^ in Aqueous Solutionand Related Isotope Effects from to 50°.J. Phys. Chem. 70, 540-543 (1966).
13. Davis, M.M., Hetzer, H.B.Titrimetric and Equilibrium Studies Using IndicatorsRelated to Nile Blue A.Anal. Chem. 38, 451-461 (1966).
14. Bates, R.G., Robinson, R.A.Acid-Base Behavior in Methanol-Water Solvents.Chemical Physics of Ionic Solutions, Chapter 12,pp. 211-235, John Wiley and Sons, Inc., New York, N.Y.1966.
15. Bates, R.G.Electrometric Methods of pH Determination.Chapter 26 in "Standard Methods of Chemical Analysis",6th ed., IIIA, pp. 521-532, P. J. Welcher, Ed.D. Van Nostrand Co., Inc., Princeton, N.J., 1966.
16. Bates, R.G.Acids, Bases, and Buffers, in "Current Concepts of Acid-Base Measurements", Ann. N.Y. Acad. Sci. 133, 25-33 (1966)
17. Davis, M.M., Paabo, M.Comparative Strengths of Aliphatic Acids and SomeOther Carboxylic Acids in Benzene at 25°.J. Organic Chemistry 31, 1804-1810 (1966).
18. Bates, R.G.pK Determination.Encyclopedia of Industrial Chemical Analysis, Vol. III.Interscience Publishers, New York. (in Press).
19. Bates, R.G.Acidity Functions for Amphiprotic MediaChapter for Chemistry of Non-Aqueous Solutions.Academic Press, New York. (in Press).
20. Bates, R.G.Proposal for the Practical Measurement of pH inAmphiprotic and Mixed Solvents.Pure and Appl. Chem. (in Press),
89
21. Stokes, R.H., Robinson, R.A.Interactions In Aqueous Nonelectrolyte Solutions.I. Solute-Solvent Equilibria.J. Phys. Chem. (in Press).
22. Hetzer, H.B., Bates, R.G., Robinson, R.A.Dissociation Constant of Morpholinium Ion andRelated Thermodynamic Quantities from to 50°.J. Phys. Chem. (in Press).
23>. Robinson, R.A., Bower, V.E.Properties of Aqueous Mixtures of Pure Salts.Thermodynamics of the Ternary System: Water-CalciumChloride-Magnesium Chloride at 25 °C
.
J. Res. Natl. Bur. Std. (in Press).
24. Paabo, M., Bates, R.G., Robinson, R.A.Dissociation of Acetic Acid-d4 in Deuterium Oxidefrom 5 to 50° and Related Isotope Effects.J. Phys. Chem. (in Press).
25. Robinson, R.A., Bower, V.E.Properties of Aqueous Mixtures of Pure Salts:Thermodynamics of the Ternary System Water-SodiumChloride-Calcium Chloride at 25 °C
.
J. Res. Natl. Bur. Std. (in Press).
26. Bates, R.G., Covington, A.K.Behavior of the Glass Electrode and OtherpH-Responsive Electrodes in Biological Media.Ann. N.Y. Acad. Sci. (in Press).
27. Covington, A.K., Robinson, R.A., Bates, R.G.The Ionization Constant of Deuterium Oxidefrom 5 to 50°.J. Phys. Chem. (in Press).
28. Schindler, P.W.Heterogeneous Equilibria Involving Oxides, Hydroxides,.Carbonates and Hydroxide Carbonates.Advances in Chemistry. (in Press).
29. Robinson, R.A., Bates, R.G.The Dissociation of Some Substituted Phenols in50-Percent Aqueous Methanol as Solvent.J. Res. Natl. Bur. Std. (in Press).
30. Paabo, M., Robinson, R.A., Bates, R.G.Dissociation of 4-Aminopyridinium Ion in 50 per centMethanol-Water and Related Acidity Functions from10 to 40°C.
Anal. Chem. (in Press).
90
13. TALKS, JULY 1965 TO JUNE 1966
1. Bates, R.G., "Nonaqueous pH Measurements", AnalyticalChemistry Group, American Chemical Society,Pittsburgh Section, Mellon Institute,Pittsburgh, Pennsylvania. October 8, 1965.
2. Bates, R.G., "Solvent Effects on Acidity in NonaqueousMedia", The Electrochemical Society, Buffalo, N.Y.October 11, 1965.
3. Bates, R.G., "Solvent Role in Acidity", American ChemicalSociety, Susquehanna Valley Section, King's College,Wilkes-Barre, Pennsylvania. October 20, 1965.
4. Bates, R.G., "Acid-Base Processes in Alcohol-Water Solvents",Chemistry Seminar, Michigan State University,East Lansing, Michigan. November 16, 1965.
5. Bates, R.G., "Acid-Base Behavior in Water-Like Solvents",Wabash Valley Section, American Chemical Society,Terre Haute, Indiana. January 11, 1966
.
6. Bates, R.G., "pH Numbers -- their Measurement and Meaning",Combined Student Group, Rose Polytechnic Institute andIndiana State University, Terre Haute, Indiana.January 12, 1966.
7. Bates, R.G., "Acid-Base Behavior in Alcohol-Water Solvents",Chemistry Seminar, Indiana University, Bloomington,Indiana. January 12, 1966.
8. Bates, R.G., "Dissociation of Ammonium Ion in Methanol-WaterSolvents", American Chemical Society, National Meeting,Phoenix, Arizona. January 20, 1966.
9. Covington, A.K., "Dissociation of Moderately Strong Acids",Department of Chemistry, Carnegie Institute of Technology,Pittsburgh, Pennsylvania. February 21, 1966.
-0. Covington, A.K., "Dissociation of Moderately Strong Acids",Reactor Chemistry and Chemistry Division, Oak RidgeNational Laboratory, Oak Ridge. Tennessee.March J, 1966.
LI. Covington, A.K., "Dissociation of Moderately Strong Acids",Brookhaven National Laboratory, Upton, Long Island,New York. March 14, 1966.
91
12. Covington, A.K., "The Hydrogen-ion Response of theGlass Electrode", Department of Chemistry, BrownUniversity, Providence, Rhode Island. March 16, 1966.
13. Covington, A.K., "Dissociation of Moderately Strong Acids",Department of Chemistry, Rensselaer Polytechnic Institute,Troy, New York. March 17, 1966
.
14. Bates, R.C., "Solvent Effects on Acid-Base Behavior inAmphiprotic Media", Chemistry Colloquium, Pennsylvania.State University, University Park, Pennsylvania.March 17, 1966
.
15. Covington, A.K., "The Hydrogen-ion Response of the GlassElectrode", Exploratory Chemistry Research Department,Corning Glass Works, Corning, New York. March 18, 1966.
16. Schindler, P.W., "Heterogenous Equilibria Involving Oxides,Hydroxides, Carbonates and Hydroxide Carbonates",American Chemical Society, National Meeting,Pittsburgh, Pennsylvania. March 24, 1966.
17. Bates, R.G., "Potentiometric Measurements and pH Standards",Course in Advanced Laboratory Instrumentat ion,Walter Reed Army Institute of Research, Washington, D.C.March 25, 1966.
18. Covington, A.K., "The Hydrogen-ion Response of the GlassElectrode", The Electrochemical Society, NationalCapital Section, Reiss Science Center, GeorgetownUniversity, Washington, D.C. April 7, 1966
.
19. Covington, A.K., "Dissociation of Moderately Strong Acids",Clarkson College - St. Lawrence University Sigma Xi Club,Clarkson College, Potsdam, New York. April 11, 1966.
20. Bates, R.G., "Role of the Solvent in Acid-Base Behavior",Chemistry Seminar, Bucknell University,Lewisburg, Pennsylvania. April 11, 1966.
21. Bates, R.G., "pH: Its Meaning and Measurement",Physical Chemistry Class, Bucknell University,Lewisburg, Pennsylvania. April 12, 1966.
22. Covington, A.K., "Dissociation of Moderately Strong Acids",Department of Chemistry, McGill University,Montreal, Canada. April 13, 1966,
92
Bates, R.G., "Solvent Effects on Acid-Base Behavior",Chemistry Seminar, University of the State of New Yorkat Buffalo, Buffalo, New York. April 20, 1966.
Bates, R.G., "Acid-Base Chemistry of Partially AqueousMedia", Chemistry Seminar, George Washington University,Washington, D.C. April 29, 1966.
Covington, A.K., "Dissociation of Moderately Strong Acids",Rockefeller University, New York, New York. May 5, 1966
.
Bates, R.G., "Behavior of the Glass Electrode andOther pH-Responsive Electrodes in Biological Media",Conference on Bioelectrodes, New York Academy ofSciences, Woldorf-Astoria Hotel, New York, New York.June 6, 1966.
93
14. LIST OF REFERENCES
[1] Electrochemical Analysis: Studies of Acids, Bases, andSalts by Emf, Conductance, Optical, and Kinetic Methods .
July 1964 to June 1965 . (R.G. Bates, Ed. ),NBS Technical Note 271 (September 6, 1965).
[2] Bates, R.G.Determination of pH , Chap. 3 and 4.John Wiley and Sons, Inc., New York, 1964.
[3] Bates, R.G. and Guggenheim, E.A.Pure Appl. Chem., JL, 163 (i960).
[4] Bates, R.G., Paabo, M., and Robinson, R.A.J. Phys. Chem., 67, 1833 (196^).
[5] Hamer, W.J., Pinching, G.D., and Acree, S.F.J. Res. Natl. Bur. Std., 36, 47 (1946).
[6] Hamer, W.J. and Acree, S.F.J. Res. Natl. Bur. Std., ^2, 215 (1944).
[7] Bates, R.G., and Hetzer, H.B.J. Res. Natl. Bur. Std., 64A, 427 (i960).
[8] Paabo, M., Robinson, R.A., and Bates, R.G.J. Chem. Eng. Data, 9, Jjk (1964).
[9] Gary, R., Bates, R.G., and Robinson, R.A.J. Phys. Chem., 68, 1186 (1964).
[10] Gary, R., Bates, R.G., and Robinson, R.A.J. Phys. Chem., 68, 3806 (1964).
[11] Gary, R., Bates, R.G., and Robinson, R.A.J. Phys. Chem., 69, 2750 (1965).
[12] Davis, M.M. and Hetzer, H.B.J. Res. Natl. Bur. Std., 60, 569 (1958).
[13] Woodhead, M., Paabo, M., Robinson, R.A., and Bates, R.G.J. Res. Natl. Bur. Std., 69A , 26^ (1965).
[14] Paabo, M., Bates, R.G., and Robinson, R.A.J. Phys. Chem., 70, 247 (1966).
94
[15] Bates, R.G., Siegel, G.L., and Acree, S.F.J. Res. Natl. Bur. Std., 30, 347 (1943).
[16] Bates , R.G. and Hetzer, H.B.J. Phys. Chem., 65, 667 (I96l).
[17] Datta, S.P., Grzybowski, A.K., and Wilson, B.A.J. Chem. Soc. (London), 792 (1963).
[18] Paabo, M., Bates, R.G., and Robinson, R.A.Anal. Chem., 37, 462 (1965).
[19] Olwa, I.T.Scl. Rpts. Tohoku Univ., Ser. 1, 41, 47 (1957).
[20] Akerlof, G.J. Am. Chem. Soc, 52, 2353 (1930).
[21] Bates, R.G. and Robinson, R.A.Chap. 12 in "Chemical Physics of Ionic Solutions"(B. E. Conway and R. G. Barradas, Eds.), pp. 211-235John Wiley and Sons, Inc., New York, 1966.
[22] Shedlovsky, T. and Maclnnes, D.A.J. Am. Chem. Soc, 54, 1429 (1932).
[23] Harned, H.S. and Ehlers, R.W.J. Am. Chem. Soc, 54, 1350 (1932); 55, 652 (1933).
[24] Paabo, M., Bates, R.G., and Robinson, R.A.J. Phys. Chem., 70, 540 (1966).
[25] Bates, R.G. and Bower, V.E.J. Res. Natl. Bur. Std., 53, 283 (1954).
[26] Bates, R.G. and Allen, G.F.J. Res. Natl. Bur. Std., 64A , 343 (i960).
[27] Hetzer, H.B., Robinson, R.A., and Bates, R.G.J. Phys. Chem., 66, 2696 (1962).
[28] Bates, R.G. and Bower, V.E.J. Res. Natl. Bur. Std., 57, 153 (1956).
[29] Hetzer, H.B., Bates, R.G., and Robinson, R.A.J. Phys. Chem., 67, 1124 (1963).
95
30] Abel, E., Bratu, E., and Redlich, 0.Z. Physik. Chem., A173, 353 (1935).
31] Marsh, K.N. and Stokes, R.H.Aust. J. Chem., 17, 740 (1964).
32] Harned, H.S. and Robinson, R.A.Trans. Faraday Soc, 36, 973 (1940).
33] Gold, V. and Lowe, B.M.Proc. Chem. Soc. (London), 140 (1963).
34] Wynne-Jones, W.F.K.Trans. Faraday Soc, 32, 1397 (1936).
35] Glasoe, P.K. and Long, F.A.J. Phys. Chem., 64, 188 (i960).
36] Sa.lomaa, P., Schaleger, L.L., and Long, F.A.J. Am. Chem. Soc, 86, 1 (1964).
37] Robinson, R.A. and Bower, V.E.J. Res. Natl. Bur. Std., 69A, 19 (1965).
38] Robinson, R.A. and Bower, V.E.J. Res. Natl. Bur. Std., 69A , 4^9 ( 1965 )
.
39] Bower, V.E. and Robinson, R.A.J. Res. Natl. Bur. Std., 69A , 131 (1965).
40] Robinson, R.A. and Bower, V.E.J. Res. Natl. Bur. Std., 69A , 365 (1965).
4l] Petriconi, G.L., Montefinale, A.C., and Papee, H.M.J. Sci. Instruments, 42, 662 (1965).
42] Bates, R.G. and Wichers, E.J. Res. Natl. Bur. Std., 59, 9 (1957).
43] Taylor, J.K. and Smith, S.W.J. Res. Natl. Bur. Std., 63A, 153 (1959).
44] Analysis and Purification Section: Summary of ActivitiesJuly 1964 to June 1965 (J. K. Taylor, Ed. J.
NBS Technical Note 273 (October 1, 1965), PP. 14-16.
»U.S. GOVERNMENT PRINTING OFFICE: 1966— 251-018/13
96


U.S. DEPARTMENT OF COMMERCEWASHINGTON, D.C. 20230
POSTAGE AND FEES PAID
U.S. DEPARTMENT OF COMI
OFFICIAL BUSINESS


![Compressibility and thermal expansion of petroleum …nvlpubs.nist.gov/nistpubs/jres/5/jresv5n5p985_A2b.pdf · Jessup] CompressibilityofOils 987 mountedbehindthecapillaryUtube,gh.Theentireapparatus](https://static.fdocuments.in/doc/165x107/5aa76b257f8b9a294b8c0aae/compressibility-and-thermal-expansion-of-petroleum-compressibilityofoils-987.jpg)