Infrared spectroscopy of carbohydrates: a review of the...
38
iihrary, E-01 Admin. BIdg. JUN 2 1 t968 NBS MONOGRAPH 110 Infrared Spectroscopy Of Carbohydrates A Review of the Literature U.S. DEPARTMENT OF COMMERCE NATIONAL BUREAU OF STANDARDS
-
Upload
dangkhuong -
Category
Documents
-
view
215 -
download
0
Transcript of Infrared spectroscopy of carbohydrates: a review of the...
iihrary, E-01 Admin. BIdg.
JUN 2 1 t968
NBS MONOGRAPH 110
Infrared Spectroscopy
Of Carbohydrates
A Review of the Literature
U.S. DEPARTMENT OF COMMERCE
NATIONAL BUREAU OF STANDARDS
THE NATIONAL BUREAU OF STANDARDS
The National Bureau of Standards^ provides measurement and technical information services
essential to the efficiency and effectiveness of the work of the Nation's scientists and engineers. TheBureau serves also as a focal point in the Federal Government for assuring maximum application of
the physical and engineering sciences to the advancement of technology in industry and commerce. Toaccomplish this mission, the Bureau is organized into three institutes covering broad program areas of
research and services:
THE INSTITUTE FOR BASIC STANDARDS . . . provides the central basis within the United
States for a complete and consistent system of physical measurements, coordinates that system with the
measurement systems of other nations, and furnishes essential services leading to accurate and uniformphysical measurements throughout the Nation's scientific community, industry, and commerce. This
Institute comprises a series of divisions, each serving a classical subject matter area:
—Applied Mathematics—Electricity—Metrology—Mechanics—Heat—Atomic Physics—Physical
Chemistry—Radiation Physics—Laboratory Astrophysics^-—Radio Standards Laboratory,^ whichincludes Radio Standards Physics and Radio Standards Engineering—Office of Standard Refer-
ence Data.
THE INSTITUTE FOR MATERIALS RESEARCH . . . conducts materials research and provides
associated materials services including mainly reference materials and data on the properties of ma-terials. Beyond its direct interest to the Nation's scientists and engineers, this Institute yields services
which are essential to the advancement of technology in industry and commerce. This Institute is or-
ganized primarily by technical fields:
—Analytical Chemistry—Metallurgy—Reactor Radiations—Polymers—Inorganic Materials—Cry-
ogenics^—Office of Standard Reference Materials.
THE INSTITUTE FOR APPLIED TECHNOLOGY . . . provides technical services to promote the
use of available technology and to facilitate technological innovation in industry and government. Theprincipal elements of this Institute are:
—Building Research—Electronic Instrumentation—Technical Analysis—Center for Computer Sci-
ences and Technology—Textile and Apparel Technology Center—Office of Weights and Measures
—Office of Engineering Standards Services—Office of Invention and Innovation—Office of Vehicle
Systems Research—Clearinghouse for Federal Scientific and Technical Information^—Materials
Evaluation Laboratory—NBS/GSA Testing Laboratory.
^ Headquarters and Laboratories at Gaithersburg, Maryland, unless otherwise noted; mailing address Washington, D. C.
20234.
- Located at Boulder, Colorado 80302.
3 Located at 5285 Port Royal Road, Springfield, Virginia 22151.

UNITED STATES DEPARTMENT OF COMMERCEC. R. Smith, Secretary
NATIONAL BUREAU OF STANDARDS • A. V. Astin, Director
Infrared Spectroscopy
of Carbohydrates
A Review of the Literature
R. Stuart Tipson
Institute for Materials Research
National Bureau of Standards
Washington, D.C. 20234
National Bureau of Standards Monograph 110
Issued June 1968
For sale by the Superintendent of Documents, U.S. Government Printing Office
Washington, D.C. 20402 - Price 30 cents
1
Library of Congress Catalog Card Number: 68-60029
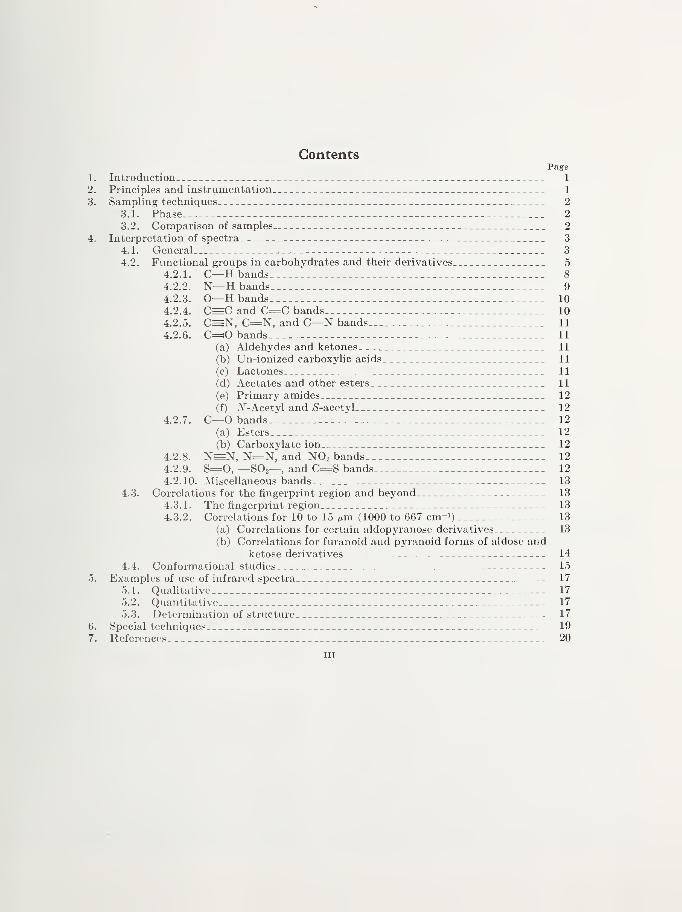
ContentsPage
1. Introduction 1
2. Principles and instrumentation 1
3. Sampling techniques 2
3.1. Phase 2
3.2. Comparison of samples 2
4. Interpretation of spectra 3
4.1. General 3
4.2. Functional groups in carbohydrates and their derivatives 5
4.2.1. C—H bands 8
4.2.2. N—H bands 9
4.2.3. 0—H bands 10
4.2.4. C=C and C=C bands 10
4.2.5. C=N, C=N, and C—N bands 11
4.2.6. C=sO bands-.-- 11
(a) Aldehydes and ketones 11
(b) Un-ionized carboxylic acids 11
(c) Lactones 11
(d) Acetates and other esters 11
(e) Primary amides 12
(f) iV-Acetyl and -S-acetyl 12
4.2.7. C—O bands 12
(a) Esters 12
(b) Carboxylate ion 12
4.2.8. N=N, N=N, and NO2 bands 12
4.2.9. S==0, —SO2— , and C=S bands, 12
4.2.10. Miscellaneous bands 13
4.3. Correlations for the fingerprint region and beyond 13
4.3.1. The fingerprint region 13
4.3.2. Correlations for 10 to 15 jum (1000 to 667 cm-i) 13
(a) Correlations for certain aldopyranose derivatives 13
(b) Correlations for furanoid and pyranoid forms of aldose andketose derivatives 14
4.4. Conformational studies 15
.3. Examples of use of infrared spectra 17
5.1. Qualitative 17
5.2. Quantitative 17
5.3. Determination of structure 17
6. Special techniques 19
7. References 20
III
Infrared Spectroscopy of Carbohydrates
A Review of the Literature
R. Stuart Tipson ^
A survey has been made of the literature on the infrared spectroscopy of carbohydrates,in order to assemble and systematize information in this field. The Monograph discussesprinciples and instrumentation, sampling techniques, comparison of samples, and the inter-
pretation of the spectra, particularly as regards functional groups of carbohydrates and theirderivatives, correlations for the fingerprint region and beyond, and conformational studies.
In addition, examples are discussed of the use of infrared spectra for qualitative and quanti-tative purposes and in the determination of structure. Special techniques are briefly de-scribed, including use of plane-polarized radiation, the technique of attenuated total reflection,
and Raman spectra.Key Words: Analysis, carbohydrates, conformations, infrared spectra, spectrometry,
structure.
1. Introduction
Although a large number of books on the in-
frared spectroscopy of organic compounds havebeen written [1],^ detailed attention has not beenaccorded in them to carbohydrates and their
derivatives. Several books contain chapters on thesubject, but these chapters are no longer up to
date, and contain certain statements that are open
2. Principles and
A molecule can exist in a number of energylevels, and a change from one level to anothercan result from absorption, or in emission, of
energy, if selection rules permit this. Of the threekinds of molecular spectra, namely, electronic,
rotational, and vibrational, the last kind are ob-tained when absorption of radiant energy causeschanges in the energy of molecular \abration.
Most of the vibrational absorption bands [1] arefound in the range ^ from 2 to 100 (5000 to
100 cm"'); but, as the spectrometers usuallyavailable to the organic chemist cover the range
' The author thanks Frank S. Parker, of the Department of Biochemisti-y,New York Medical College, New York, and James E. Stewart, of BeckmanInstruments, Inc., FuUerton, California, for a number of helpful suggestions.This Monograph is, in part, an outgrowth of a comprehensive investigationof the infrared absorption spectra of sugars and sugar derivatives begun at theNational Bureau of Standards in 1949. The early work, sponsored by theOtTice of Naval Research, was conducted by E. C. Creitz, II. L. Frush, H. S.Isbcll. J. D. Moyer. F. A. Smith. J. E. Stewart, and R. S. Tipson.
- Figures in brackets indicate the literature references at the end of thisMonograph.
' The position of a band in this region of the spectrum is expressed in twoways: (a) as the wavelength (X) in ;jm [micrometers: 1 iim = 10-^m, commonlycalled microns (p.)], or (b) as the wavenumber (•-) in reciprocal centimeters(kaysers). The velocity of light (c, in cms-') is equal to the wavelength ofone vibration times the number of vibrations per second; that is, c=Xi'. Thewavenumber is the reciprocal of the wavelength; thus, >- (in cm-i) = l/X (in
cm), or V (in cm-') = 10</X (in pm). Wavenumbers have the advantage ofbeing directly proportional to energy. As instruments are now availablethat record linearly either in wavelength or wavenumber, bands will beexpressed in both ways in this Monograph.
to misinterpretation. Consequently, it was decided
that a detailed survey should be made of the
hterature on the infrared spectroscopy of the
carbohydrates and their derivatives, and that the
information should be assembled in a readily
available form.
Instrumentation
of 2 to 40 Atm (5000 to 250 cm"'), discussion of
infrared spectra vnh be confined to this rangeThe range of most interest to the carbohydratechemist is 2 to 15 (5000 to 667 cm"').
Accurate recordings of spectra may be obtainedwith a recording, double-beam, infrared spectro-
photometer equipped ^^'ith. a prism [e.g., of sodiumchloride for the range of 2 to 15 ixm (5000 to 667cm"')] or a grating. In such instruments, the
sample is exposed to infrared radiation, and that
radiation passing through the sample is resolved
^\'ith the prism or grating; the spectrum is then
scanned, and the values (bands) at which radiation
is absorbed are recorded, pro\ading an infrared
absorjition spectrt)gram. For measurement of
bands in the region of 2.7 to 3.6 /xm (3700 to 2780cm~'), the higher dispersion given by a lithium
fluoride [msm or a comi)arable grating is an asset.
Instead of a suitable grating, a prism of potassium
bromide may be used for the range of 2 to 25 /im.
(5000 to 400 cm"') , and a prism of cesium bromidefor 15 to 40 Mm (667 to 250 cm"').
For rapid, routine recording of useful but less
accurate spectra, smaller (and cheaper) prism
instruments are available as an analytical tool.
In the range of 10 to 15 ^im (1000 to 667 cm"').
1
such an instrument can routinely give wavenum-bers accurate to ±2 cm~^ In the range of 2.5 to
10 nm (4000 to 1000 cm~^), the inaccuracy is
increasingly greater with increasing wavenumber
;
nevertheless, the reproducibility is satisfactory.
3. Sampling Techniques
3.1. Phase
For recording the infrared spectrum, a carbo-hydrate or derivative may be prepared as (a) athin layer of an anhydrous syrup mountedbetween windows that are transparent to theinfrared radiation; (b) a mull with a hydrocarbon011 (Nujol or an appropriate perhalogenatedhydrocarbon, mounted in the same way; (c) apellet made with an alkali-metal halide; or (d) asolution in an organic solvent or water (in asuitable, water-insoluble cell). Recording is usu-ally done with the sample at room temperature,but bands may be sharper at lower temperatures.The spectrum of a compound may be different
for different physical states. For example, in thesolid state, polymorphs of a compound, examinedin the same way, may show differences in a fewfeatures of their spectra. An example is 7V-benzoyl-2,3,4,6-tetra-0-benzoyl-/3-D-glucosylamine ; this
exists in a form of mp 113-115 °C which,when heated to 117-120 °C and allowed to crys-
tallize from the melt, gives a form of mp 184 °Chaving a somewhat different spectrum (Nujolmull). Also, different crystal habits (same mp) of acompound (residting, for example, from crystal-
lization of samples from different solvents) maygive somewhat different spectra, particularly if
examined as mulls (where but little pressure is
applied) . Shifts of up to 20 cm~^ for certain bandshave been noted [3] for crystalline and amorphousforms of some carbohydrates. However, in all
such instances, samples of each of the forms,measured after dissolution in the same solvent,
or as molten material, give identical spectra.
The spectra of crystalline materials often showmore bands than the same compounds in solution
Band positions may be shifted, or band inten-
sities altered, if the compound forms hydrogenbonds with the solvent. In solution, molecules of
a compound may associate through formation of
intermolecular hydrogen bonds. If the concentra-tion is below 0.005 M, intermolecular hydrogen-bonding is negligible for solutions in carbontetrachloride and similar solvents [5, 6]; this
effect has been used in studying intramolecularhydrogen-bonding in model compounds related
to sugars [7].
Pelleting of certain free sugars with an alkali
halide changes a crystalline sample to an amor-phous form [8, 9]. Moreover, some sugars (for
example, a-D-glucose) may form a complex with
Mention of a commercial product in tliis article does not constitute endorse-ment by the National Bureau of Standards.
traces of sodium bromide or sodium iodide presentin pellets of the corresponding potassium halide[9]. If the pelleting halide is not dry [10], oracquires moisture, the sugar may mutarotate orform a hydrate should the pellet be stored [11].
Consequently, such spectra should always becompared with those obtained for a Nujol mull of
the compound, or the pellets should not be stored.However, even though examined immediatelyafter preparation of the pellets, eight of 24aldopyranosides [12] showed interaction with thepelleting halide, and six of 27 free sugars [13]
gave spectrograms that were different in Nujoland in potassium iodide.
3.2. Comparison of Samples
As a result of recording and comparing theinfrared spectra of a large number of organiccompounds, it has been found that every com-pound having a unique structure gives a uniquespectrum. Consequently, for an enantiomorphicpair, every detail of whose structure is identical
(but in mirror image), the spectra of the solids,
in the same polymorphic modification, are identi-
cal [3]. The spectra may differ slightly because of
polymorphism, but, for the gaseous or liquid (melt,
or solution) phases, the spectra are identical.
Also, for a large molecule, a slight change in
structure may change the spectrum only slightly.
Thus, proceeding up a series of oligosaccharides
containing the same anomeric form of the samemonosaccharide residue only, the spectra for thetetraose, pentaose, hexaose, etc., become moreand more alike [14].
Consequently, with these exceptions, purecompounds can be identified unequivocally bytheir infrared spectra. For a carbohydrate, the
infrared spectrum is usually a much more specific
and characteristic property than the ultraviolet
spectrum, melting point, boiling point, density, or
refractive index. Thus, although the anomers of a
sugar or glycoside differ only in the orientation at
one carbon atom, their spectra are quite different
[14]. Also, the spectrum of the furanoid form of a
sugar derivative differs from that of the pyranoidform in the same anomeric modification, as withmethyl /3-D-ribofuranoside and /3-D-ribopyranoside
[15].
Hence, the simplest use of infrared spectra is
for the identification of a compound. The spectrumof a sample to be identified is compared with the
spectra of pure compounds of known structure,
measured with the same sampling technique. In
this use, it is not necessary that the spectra be
analyzed for characteristic absorption bands.
However, availability of reference spectra [16-20]
of related, ])ure compounds is essential.
Another use is the precise identification of
spectra already in the literature, where the com-pound studied had been inadequately described.
For example, in 1950, Kuhn [14] recorded the
spectra of 10 of the- crystalline sugars, each in a
2
Nujol mvill; but, except for one (a-D-glucose) , hedid not mention which anomer had been employed.Similarly, Urbanski et al. [21] recorded the spectra
of six sugars, without specifying the anomericform. These have since been identified [13] bycomparison with, the spectra of authentic anomericforms of those sugars.
In another application, infrared spectra can beused for checking the purity of a sample. Com-monly, a crude material may shoAV a band that is
not present in the spectrum of the pure compound;
thus, commercial D-mannitol showed a band at
12.80 nm (781 cm~^), due to D-glucitol, removableby recrystallization from aqueous ethanol [22].
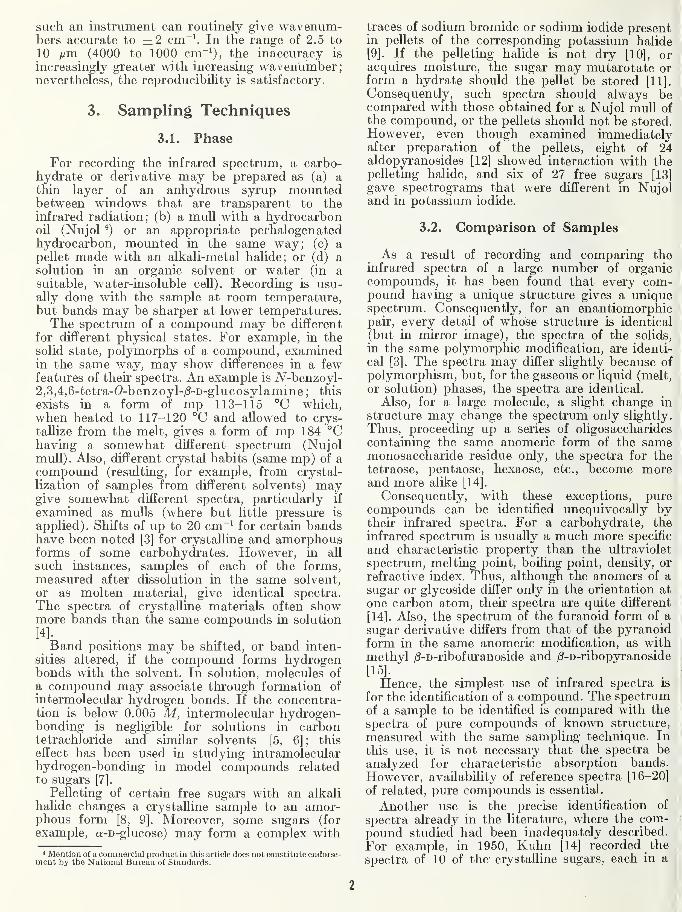
In contrast, figure 1 shows the spectrum of purecrystalline ;8-D-ribose [13] and that of a commercialspecimen. The spectrum of the commercial mat-erial does not display a band at 7.82 /um (1279cm~^) that is present in the spectrum of the puresugar, presumably because presence of impuritycauses poor growth of the crystals, resulting in
scattering.
The same figure also serves to Ulustrate thatthe spectra may be used in following the isolation
or purification of a desired product obtained, for
example, by distillation or chromatography. It is
not necessary to know what the compound is
(nor, initially, to have an infrared spectrum of thepure compound) ; the concentration or purification
procedure can be followed by observing somecharacteristic infrared band. For example, byrecrystallizing /S-D-ribose untU the band at 7.82^^m (1279 cm~^) appears and remains of constantintensity, a sample that is "pure" (by infrared
spectroscopy) is obtained, without any knowledgeof the actual significance of this band. However,the minimum detectable amount of impurity(which may, of course, contribute bands absentfrom the spectrum of the pure material) variesenormously from one compound to another.
4. Interpretation of Spectra
4.1. General
A more sophisticated use of infrared spectra
permits qualitative analysis for groups of atoms.The motions constantly undergone by the atomsand bonds of a molecule may be examined with a
model consisting of springs and balls. A diatomicmolecule A—B may be represented by two balls,
each of a mass proportional to those of atoms Aand B, respectively, connected by a spring of
strength proportional to the force binding atomsA and B. Molecule A—B can undergo a stretching
vibration only along the bond between atoms Aand B; this vibration occurs in the model if the
.spring is compressed and then the assemblage is
permitted to relax on its own. If the resulting,
periodic oscillation is moderate, the system follows
Hooke's law approximately, and the frequency(v) of the stretching vibration is given by theequation for simple harmonic vibrations namelyv=(f/fiy^^/2irc, where / is the force constant of the
bond, c is the velocity of light, and m is the reducedmass, defined as iJ.=mfjn-Rl {mf^-\-mQ) , whereand rriB are the masses of atoms A and B, resjjec-
tively. (The equation for v applies only to the
example considered.)
For a polyatomic molecule, there are manyways in which pairs of atoms may bend, rock,
twist, or vibrate, relative to each other and to
other pairs, or larger groups, of atoms. Although a
mathematical treatment of the infrared spectrumof any pure compound could provide informationon the structure through checking of consistencywith possible models, the degree of difficulty of
such a calculation is a function of the number of
atoms and of the symmetry of their geometricalarrangement. Thus, for most sugars, such a
treatment would be very difficult, particularly in
3
5000 4000 3000
iiiiliiiil II 1 1 1
1,1
WAVE NUMBER, Cm-l
1400 1200 1000 950
J I
,
IlIIIIIIIiIiiI I III I I I I I I I I I I I
I
I II I I I I I I I . I I I
9 10
WAVELENGTH,/xm
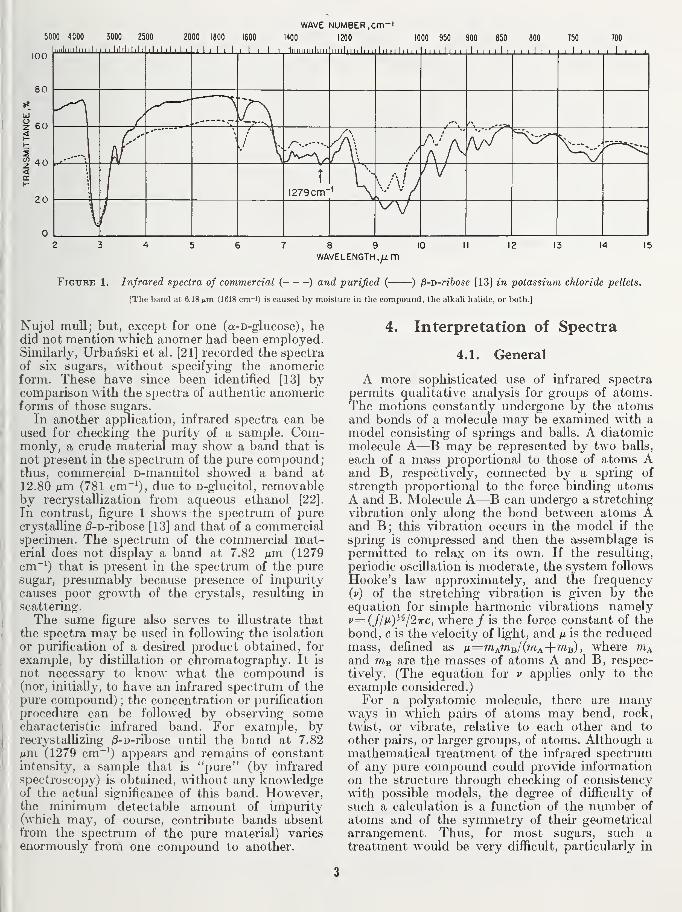
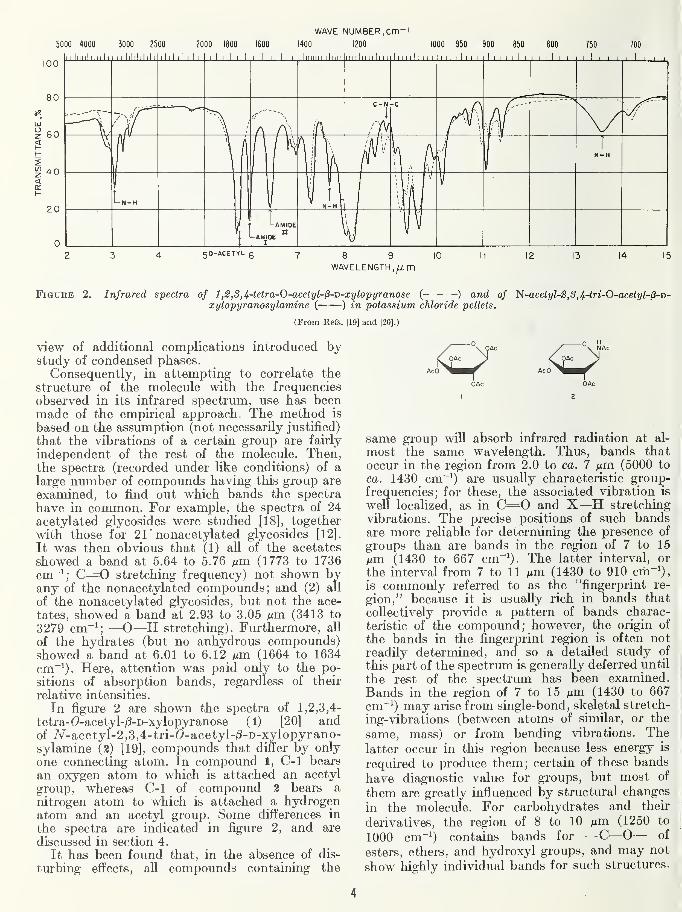
Figure 2. Infrared spectra of 1,2,8,4-tetra-0-acetyl-l3-D-xylopyranose (- - -) and of ^-acetyl-2, 3, 4-tri-O-acetyl-^-vi-xylopyranosylamine ( ) in potassium chloride pellets.
(From Refs. [19] and [20].)
view of additional complications introduced bystudy of condensed phases.
Consequently, in attempting to correlate the
structure of the molecule with the frequencies
observed in its infrared spectrum, use has beenmade of the empirical approach. The method is
based on the assumption (not necessarily justified)
that the vibrations of a certain group are fairly
independent of the rest of the molecule. Then,the spectra (recorded under like conditions) of a
large number of compounds having this group are
examined, to find out which bands the spectra
have in common. For example, the spectra of 24
acetylated glycosides were studied [18], together
with those for 21" nonacetylated glycosides [12].
It was then obvious that (1) all of the acetates
showed a band at 5.64 to 5.76 Mm (1773 to 1736
cm~^; C=0 stretching frequency) not shown byany of the nonacetylated compounds; and (2) all
of the nonacetylated glycosides, but not the ace-
tates, showed a band at 2.93 to 3.05 tJ.m (3413 to
3279 cm~^; •—O—H stretching). Furthermore, all
of the hydrates (but no anhydrous compounds)showed a band at 6.01 to 6.12 ^ni (1664 to 1634
cm~^). Here, attention was paid only to the po-
sitions of absorption bands, regardless of their
relative intensities.
In figure 2 are shown the spectra of 1,2,3,4-
tetra-(?-acetyl-j3-D-xylopyranose (l) [20] andof /v-acetyl-2,3,4-tri-C-acetyl-/3-D-xylopyrano-sylamine (2) [19], compounds that differ by only
one connecting atom. In compound 1, C-1 bears
an oxygen atom to which is attached an acetyl
group, whereas C-1 of compound 2 bears a
nitrogen atom to which is attached a hydrogenatom and an acetyl group. Some differences in
the spectra are indicated in figure 2, and are
discussed in section 4.
It has been found that, in the absence of dis-
turbing effects, all compounds containing the
same group will absorb infrared radiation at al-
most the same wavelength. Thus, bands that
occur in the region from 2.0 to ca. 7 fim (5000 to
ca. 1430 cm~^) are usually characteristic group-frequencies; for these, the associated vibration is
weU localized, as in C=0 and X—H stretching
vibrations. The precise positions of such bandsare more reliable for determining the presence of
groups than are bands in the region of 7 to 15
Mm (1430 to 667 cm"^^). The latter interval, or
the interval from 7 to 11 Mm (1430 to 910 cm-^),
is commonly referred to as the "fingerprint re-
gion," because it is usually rich in bands that
collectively provide a pattern of bands charac-
teristic of the compound; however, the origin of
the bands in the fingerprint region is often not
readily determined, and so a detailed study of
this part of the spectrum is generally deferred until
the rest of the spectrum has been examined.
Bands in the region of 7 to 15 Mm (1430 to 667
cm~') may arise from single-bond, skeletal stretch-
ing-vibrations (between atoms of similar, or the
same, mass) or from bending vibrations. Thelatter occur in this region because less energy is
required to produce them; certain of these bands
have diagnostic value for groups, but most of
them are greatly influenced by structural changes
in the molecule. For carbohydrates and their
derivatives, the region of 8 to 10 Mm (1250 to
1000 cm~^) contains bands for —C—O— of
esters, ethers, and hydroxyl groups, and may not
show highly individual bands for such structures.
4
Some group absorptions may be qmte different
in intensity from one compoimd to another, even
though the wavelength of the absorption is about
the same. However, for small molecules, the bandsfor carbonyl groups are nearly always very strong.
If a spectrum has only a weak band in the region
of 5.88 nm (1700 cm~^), (a) this band is probably
not due to carbonyl, (b) the molecule is probably
very large and has, perhaps, only one carbonyl
group, or (c) a carbonyl compound is possibly
present as an impurity. Because of the possibility
of interference by other absorptions, the presence
of a band at a position expected for a certain
group is not conclusive evidence that that group
is present in the compound. However, provided
that effects (such as hydrogen bonding) that
could shift or even remove the band are not
operative, the absence of a group absorption
usually indicates absence of that group from thesample.
4.2. Functional Groups in Carbohydratesand Their Derivatives
Except when electrical (hydrogen bonding,ionization, etc.) or steric effects are operative,
every organic compound that possesses a particu-
lar group will show the corresponding, character-
istic group-frequency in its spectrum, and manycompilations of such group-frequencies are avail-
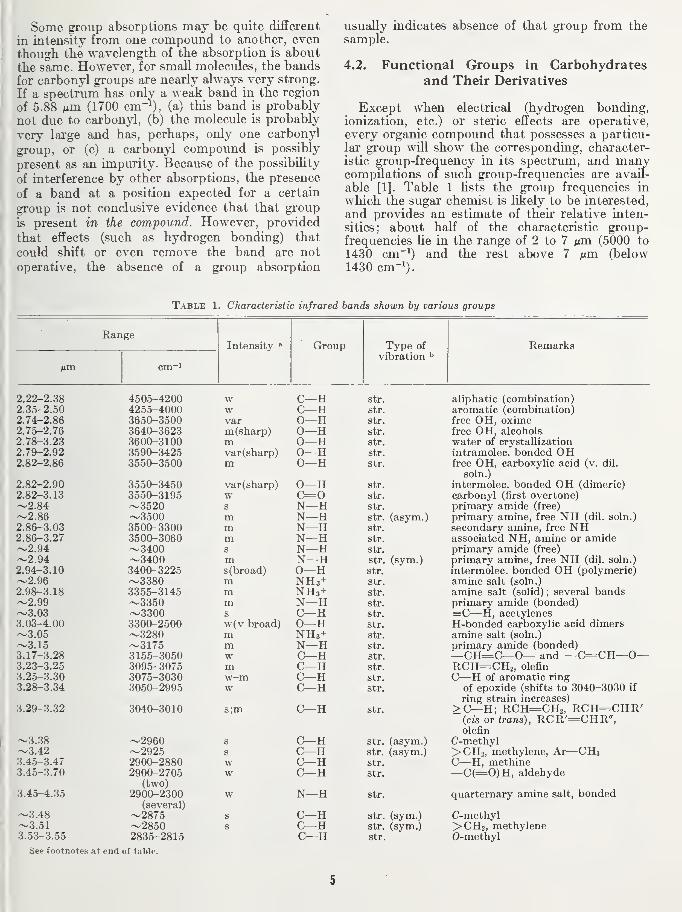
able [1]. Table 1 lists the group frequencies in
which the sugar chemist is likely to be interested,
and provides an estimate of their relative inten-
sities; about half of the characteristic group-frequencies he in the range of 2 to 7 nm (5000 to
1430 cm~^) and the rest above 7 nm (below1430 cm-i).
Table 1. Characteristic infrared bands shown by various groups
RangeIntensity » Group Type of
vibration ^Remarks
fim. cm~'
2.22-2.38 4505-4200 w C—
H
2.35-2.50 4255-4000 w C—
H
2.74-2.86 3650-3500 var 0—
H
2.75-2.76 3640-3623 m(sharp) 0—
H
2.78-3.23 3600-3100 m 0—
H
2.79-2.92 3o90-3425 var (sharp) O—
H
2.82-2.86 3550-3500 m V 7 XI
2.82-2.90 3550-3450 var(sharp) 0—
H
2.82-3.13 3550-3195 w C=0~2.84 ~3520 s N—
H
~2.86 ~3500 m N—
H
2.86-3.03 3500-3300 m N—
H
2.86-3.27 3500-3060 m N—
H
~2.94 ~3400 s N—
H
~2.94 ~3400 m N—
H
2.94^3.10 3400-3225 s (broad) 0—
H
~2.96 ~3380 m NH3+2.98-3.18 3355-3145 m NH3+~2.99 ~3350 m N—
H
~3.03 ~3300 s C—
H
3.03-4.00 3300-2500 w(v broad) 0—
H
~3.05 ~3280 m NH3+~3.15 ~3175 m N—
H
3.17-3.28 3155-3050 w C—
H
3.23-3.25 3095-3075 m C—
H
3.25-3.30 3075-3030 w-m C—
H
3.28-3.34 3050-2995 w C—
H
3.29-3.32 3040-3010 s;m C—
H
~3.38 ~2960 s C—
H
~3.42 ~2925 s C—
H
3.45-3.47 2900-2880 w C—
H
3.45-3.70 2900-2705 w C—
H
(two)3.4.5-4.35 2900-2300 w N—
H
(several)~3.48 ~2875 s C—
H
~3.51 ~2850 s C—
H
3.53-3.55 2835-2815 C—
H
See footnotes at end of table.
str. aliphatic (combination)str. aromatic (combination)str. free OH, oximestr. free OH, alcoholsstr. water of crystallization
str. intramolec. bonded OHstr. free OH, carboxylic acid (v. dil.
soln.)
str. intermolec. bonded OH (dimeric)str. c5.rbonyl (first overtone)str. primary amide (free)
str. (asym.) primary amine, free NH (dil. soln.)
str. secondary amine, free NHstr. associated NH, amine or amidestr. primary amide (free)
str. (sym.) primary amine, free NH (dil. soln.)
str. intermolec. bonded OH (polymeric)str. amine salt (soln.)
str. amine salt (solid); several bandsstr. primary amide (bonded)str. =C—H, acetylenesstr. H-bonded carboxylic acid dimersstr. amine salt (soln.)
str. primary amide (bonded)str. —CH=C—O— and —C=CH—0—str. RCH=CH2, olefin
str. C—H of aromatic ring
str. of epoxide (shifts to 3040-3030 if
ring strain increases)
str. >C—H; RCH=CH2, RCH=CHR'{cis or trans), RCR'=CHR",olefin
str. (asym.) C-methylstr. (asym.) >CH2, methylene, Ar—CH3str. C—H, methinestr. —C(=0)H, aldehyde
str. quarternary amine salt, bonded
str. (sym.) C-methylstr. (sym.) >CH2, methylenestr. 0-methyl
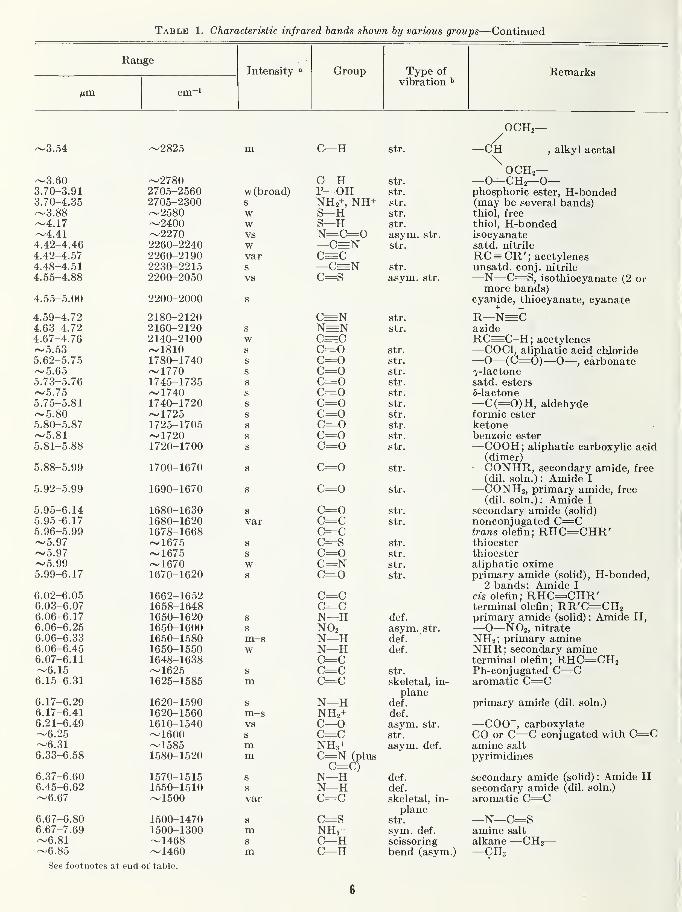
Table 1. Characteristic infrared bands shown by various groups—Continued
RangeIntensity Group Type of
vibration ^Remarks
cm~
~3.54 ~2825
~o.du ^ ,07Cf\~Z/8UQ rrn Q ft 1 07nFc oi^Aft
Q TO—/! Qc;0. 1 U—"l.OO ii t UO—ZciUU~o.oo ^ZOOU
1 7 ^^Z4UU^ ,/1 /I 1 ,oo7n/I /1 0 A Aft ooftn_09yinzzou—^^4UA AO A ^1 oofin 0 1 ftozzdu—ziyu4.48—4.01 OOQA 001zzoU—^iilO4.00—4.80 //uu—ZUOU
4.00—O.UU oonn onnnzzuu—^uuu
4.59-4.72 2180-21204.63-4.72 2160-21204.67-4.76 2140-2100~5.53 ~18105.62-.5.75 1780-1740~5.65 ~17705.73-5.76 1745-1735~5.75 ~17405.75-5.81 1740-1720~5.80 ~17255.80-5.87 1725-1705-^5.81 ~17205.81-5.88 1720-1700
1 700-1 fi70-1- 1 \J\) \ \J
5.92-5.99 iftqfl_ift7n
5 05-6 14 1680-16305.95 -6.17
5 96-5 99 1 678-1 fi68
~5.97 ~1675~5.97 ~1675~5.99 ~ 16705 QQ-fi 17
6 02-6 05 1fifi2-1fi52
6.03-6.07 1658-16486!06-6!l7 1650-16206.06-6.25 1650-16006 06-6 33 Ifitjfti coo
6 06-6 45 1650-1 5506.07-6.11 1648-1638~6.15 ~1625fi 1.5-fi 31 1 (^9'^-^ "iS^ii-U^U i.O<JO
6.17-6.296.17-6!41 1620-15606.21-6.49 1610-1540~6.25 ~1600~6.31 ~15856.33-6.58 1580-1520
6.37-6.60 1570-15156.45-6.62 1550-1510~6.67 ~1500
6.67-6.80 1500-14706.67-7.69 1500-1300-^e.si ~1468~6.85 ~1460
See footnotes at end of table.
m C—
H
str.
Kj Jtl str.
w( broad) r—U±l str.
s IN -tl2I
-tl str.
w B Jtl str.
w C! TT10 Jtl str.
vs IN
—
Kj—\j asym. str.
w str.
vars — \j IN str.
vs Kj ft asym. str.
s
C=N str.
s N=N str.
w C=Cs c=o str.
s c=o str.
s c=o str.
g c=o str.
s c=o str.
s c=o str.
s c=o str.
s c=o str.
s c=o str.
s c=o str.
g c=o str.
s c=o str.
g c=o str.
var c=c str.
c=cg c=s str.
g c=o str.
w C=Ng c=o str
c=cc=c
g N H def.
g N02 asym. str.
m—
s
N jj def.
w N H def.
c=cg c=c str.
] [ j c=c drfilAtQl in—OJ^dCUCtlj 111"
planeg N—
H
def.
m-s NH2+ def.
vs C—
0
asym. str.
s C=C str.
m NH3+ asym. def.
m C=N (plusC=C)
s N—
H
def.
s N—
H
def.
var C=C skeletal, in-
planes c==s str.
m NH3+ sym. def.
s C—
H
scissoringm C—
H
bend (asym.)
0CH2—/—CH
,alkyl acetal
^0CH2——O—CH2—0—phosphoric ester, H-bonded(may be several bands)thiol, free
thiol, H-bondedisocyanatesatd. nitrile
RC=CR'; acetylenesunsatd. conj. nitrile
—N—C=S, isothiocyanate (2 ormore bands)
cyanide, thiocyanate, cyanate
R—N=CazideRC=C-H; acetylenes—COCl, aliphatic acid chloride—O—(C=0)—O— , carbonate7-lactonesatd. esters5-lactone—C(=0)H, aldehydeformic esterketonebenzoic ester—COOH; aliphatic carboxylic acid
(dimer)—CONHR, secondary amide, free
(dil. soln.) : Amide I
—CONH2, primary amide, free(dil. soln.) : Amide I
secondary amide (solid)
nonconjugated C=Ctrans olefin; RHC=CHR'thioesterthioesteraliphatic oximeprimary amide (solid), H-bonded,
2 bands: Amide I
cis olefin; RHC=CHR'terminal olefin; RR'C=CH2primary amide (solid) : Amide II,—0—NO2, nitrateNH2; primary amineNHR; secondary amineterminal olefin; RHC=CH2Ph-conjugated C=Caromatic C=C
primary amide (dil. soln.)
—C00~, carboxylateCO or C=C conjugated with C=Camine salt
pyrimidines
secondary amide (solid) : Amide II
secondary amide (dil. soln.)
aromatic C=C
—N—C=Samine salt
alkane —CH2
—
—CH3
6
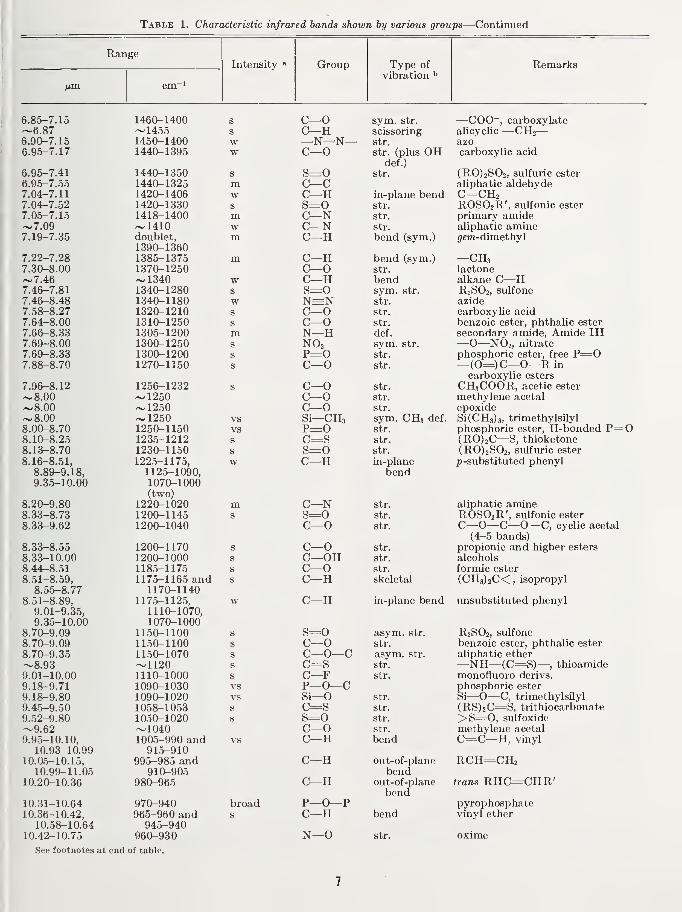
Table 1. Characteristic infrared bands shown by various groups—Continued
RangeIntensity » Group Type of Remarks
vibration
6.85-7.15 1460-1400 g C—
0
sym. str. —C00~, carboxylate1 ,^ e c~l455 s C—
H
scissoring alicyclic —CH2
—
6.90-7.15 1450-1400 w —N=N
—
str. azoz* n e TIT6.95—7.17 t A A n 1 OA e1440—1395 w C—
0
str. (plus OH earboxylic aciddef.)
0.95-7.41 t A A n 10CA1440—1350 s s=o str. (RO)2S02, sulfuric ester6.95-7.55 1440-1325 m C—
c
aliphatic aldehyde7.04-7.11 1 A OA 1 A Ai?1420-1406 w C—
H
in-plane bend C=CH27.04-7.52 t A OA 1 O O
A
1420-1330 s s=o str. ROSO2R', sulfonic ester7.05—7.15 1 >l 1 O 1 /i AA1418—1400 m C—
N
str. primary amide~7.09 ~ 1410 w C—
N
str. aliphatic amineT 1 r» 'TOE7.19-7.d5 doublet,
1 OAA 1 0£?A1390-1360m C—
H
bend (sym.) ^em-dimethyl
T OO OOl.^Z—T.zo 1385-1375 m C—
H
bend (sym.) —CH37.d0-o.00 137U-lz50 C—
0
str. lactone~7.46 /^1340 w C—
H
bend alkane C—
H
7.4d—7.»1 lo4U— l-ioU s S=0 sym. str. R2SO2, sulfone7.46-8.48 1340-1180 w N=N str. azide7.58-8.27 1320-1210 s C—
0
str. earboxylic acid/ .04—o.UU 1 1? 1 fL 1 OKA s C—
0
str. benzoic ester, phthalic ester7.66-8.33 1 Or\ C 1 OAA1305-1200 m N—
H
def. secondary amide. Amide III7.69-8.00 1 OAA 1 O C A1300-1250 s NO2 sym. str. —0—NO2, nitrate^ £> /*» o o o7.69-8.33 1 OAA 1 OAA1300-1200 s P=0 str. phosphoric ester, free P=0/.OO—o. /U 1 OVA 1 1 CA12/U—1150 s C—
0
str. —(0=)C—0—R in
earboxylic esters
7.96-8.12 lOE/? 10001256-1232 s C—
0
str. CH3COOR, acetic esterO AA~O.0U 1 o eA~ 1250 C—
0
str. methylene acetal1 OKA~ 1Z5U C—
0
str. epoxideQ f\f\~o.00 1 OCA
'->-' 1250 vs Si—CH3 sym. CH3 def. Si(CH3)3, trimethylsilyl8.00-8.70 1250-1150 vs P=0 str. phosphoric ester, H-bonded P=0O. iU—o.^O 1 9"? 1 91 9 s c=s str. (R0)2C=S, thioketoneo.io—O. / U 1 OOA 1 1 KA s s=o str. (RO)2S02, sulfuric esterO 1 C O C 18.1D-0.51, 100C 11'7C1225—1175, w C—
H
in-plane p-substituted phenyl8.89-9.18, 1125-1090, bendQ QC in AA lU/ 1>—lUUU
(two)O OA A OAO.2U-9.80 1 OOA "f AOA1220-1020 m C—
N
str. aliphatic amineROSO2R', sulfonic esterO OO O 'TO8.33-8.73 1 OAA 1 t A C1200-1145 s s=o str.
8.33—y.62 1 OAA 1 r\A Ai2Ul>—1U4U C—
0
str. C—0—C—0—C, cyclic acetal
(4-5 bands)O OO o c c8.33—8.55 1 OAA 1 1 'TA1200-1170 s C—
0
str. propionic and higher estersO O O 1 A AA8.33-10.00 1 OAA 1 AAA1200-1000 s C—OH str. alcohols8.44r-8.51 1185-1175 s C—
0
str. formic ester
8.51-8.59, 1175-1165 and s C—
H
skeletal (CH3)2C<C, isopropylo e c o TT8.55-8.77 1170-1140
8.51-8.89, 1175-1125, w C—
H
in-plane bend unsubstituted phenyl9.01-9.35, 1 1 1 A 1 A'7A1110-1070,9.35-10.00
"1 ATA "1 AAA1070-10008.70-9.09 1 1 C A 1 i AAlloO-llOU s s=o asym. str. R2SO2, sulfone8.70-9.09 1 1 C A 11 AA1150-llOU s C—
0
str. benzoic ester, phthalic ester
8.70-9.35 1 1 Cr A 1 ATA1150-1070 s C—0—
C
asym. str. aliphatic ether~8.93 ~1120 s c=s str. —NH—(C=S)— , thioamide
monofluoro derivs.y.Ul-lU.OU 1 1 1 A 1 AAAIIIO-IOUU s C—
F
str.
y. 18-9.71 1 AAA 1 AOA1090-1031) vs P—0—
C
phosphoric ester
9.18-9.80 1 AAA 1 AOA1090-1020 vs Si—
0
str. Si—0—C, trimethylsilyl
9.4.5-9.50 10.d8-10o3 s c=s str. (RS)2C=S, trithiocarbonate9.52-9.80 1050-1020 s S=0 str. >S=0, sulfoxide~9.62 ~1040 C—
0
str. methylene acetal
9.95-10.10, 1005-990 and vs C—
H
bend C=C—H, vinyl10.93-10.99 915—910
10.05-10.15, AA C AOC „ . _3995-985 and C—
H
out-of-plane RCH=CH210.99-11.05 A 1 A A ACT910-905 bend
.70'-' C—
H
out-of-planebend
trans RHC=CHR'
10.31-10.64 970-940 broad P—0—
P
pyrophosphate10.36-10.42, 965-960 and s C—
H
bend vinyl ether10.58-10.64 945-940
10.42-10.75 960-930 N—
0
str. oxime
See footnotes at end of table.
7
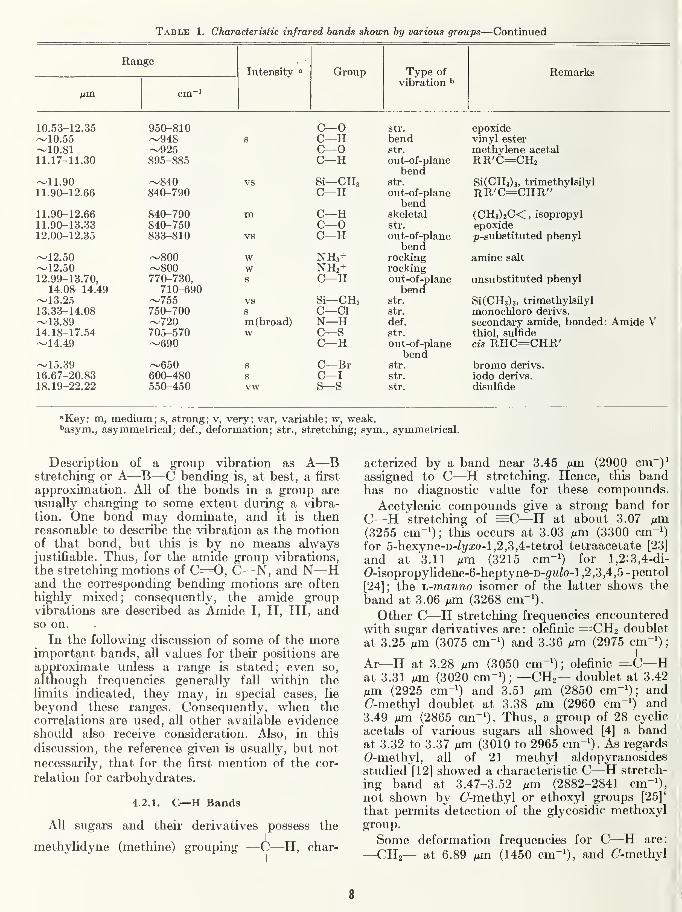
Table 1. Characteristic infrared bands shown by various groups—Continued
RangeIntensity » Group Type of Remarks
vibration *>
cm~'
10.53-12.35 950-810 C—
0
str. epoxide~10.55 ~948 s C—
H
bend vinyl ester~10.81 ~925 C—
0
str. methylene acetal11.17-11.30 895-885 C—
H
out-of-planebend
RR'C=CIl2
~11.90 ~840 vs Si—CHg str. Si(CH3)3, trimethylsilyl11.90-12.66 840-790 C—
H
out-of-planebend
RR'C=CHR"
11.90-12.66 840-790 m C—
H
skeletal (CH3)2C< ,isopropyl
11.90-13.33 840-750 C—
0
str. epoxide12.00-12.35 833-810 vs C—
H
out-of-plane p-substituted phenylbend
~12.50 ~800 w NH3+ rocking amine salt
~12.50 ~800 w NH2+ rocking12.99-13.70, 770-730, s C—
H
out-of-plane unsubstituted phenyl14.08-14.49 710-690 bend
~13.25 ~755 vs Si—CH3 str. Si(CH3)3, trimethylsilyl13.33-14.08 750-700 s C—CI str. monochloro derivs.
~13.89 ~720 m (broad) N—
H
def. secondary amide, bonded: Amide V14.18-17.54 705-570 w c—
s
str. thiol, sulfide~14.49 ~690 C—
H
out-of-planebend
cis RHC=CHR'
~15.39 ~650 s C—Br str. bromo derivs.
16.67-20.83 600-480 s C—
I
str. iodo derivs.
18.19-22.22 550-450 vw s—
s
str. disulfide
"Key: m, medium; s, strong; v, very; var, variable; w, weak.''asym., asymmetrical; def., deformation; str., stretching; sym., symmetrical.
Description of a group vibration as A—
B
stretching or A—B—C bending is, at best, a first
approximation. All of the bonds in a group are
usually changing to some extent during a vibra-
tion. One bond may dominate, and it is thenreasonable to describe the vibration as the motionof that bond, but this is by no means alwaysjustifiable. Thus, for the amide group vibrations,
the stretching motions of C=0, C—N, and N—
H
and the corresponding bending motions are often
highly mixed; consequently, the amide groupvibrations are described as Amide I, II, III, andso on.
In the following discussion of some of the moreimportant bands, all values for their positions are
approximate unless a range is stated; even so,
although frequencies generally fall within thelimits indicated, they may, in special cases, lie
beyond these ranges. Consequently, when the
correlations are used, all other available evidenceshould also receive consideration. Also, in this
discussion, the reference given is usually, but not
necessarily, that for the first mention of the cor-
relation for carbohydrates.
4.2.1. C—H Bands
All sugars and their derivatives possess the
methylidyne (methine) grouping —C—H, char-I
acterized by a band near 3.45 nm (2900 cm~)^assigned to C—H stretching. Hence, this bandhas no diagnostic value for these compounds.
Acetylenic compounds give a strong band for
C—H stretching of =C—H at about 3.07 tixn
(3255 cm-i); this occurs at 3.03 mhi (3300 cm"')
for 5-hexyne-D-/t/a;o-l,2,3,4-tetrol tetraacetate [23]
and at 3.11 Mm (3215 cm-i) for l,2:3,4-di-
(?-isopropylidene-6-heptyne-D-^ufo-l,2,3,4,5-pentol
[24]; the i^-manno isomer of the latter shows the
band at 3.06 tim. (3268 cm-^-
Other C—H stretching frequencies encounteredwith sugar derivatives are : olefinic =CH2 doublet
at 3.25 MHi (3075 cm->) and 3.36 nm (2975 cm-')
;
Ar—H at 3.28 Mm (3050 cm"'); olefinic =C—
H
at 3.31 Mm (3020 cm-'); —CH2— doublet at 3.42
Mm (2925 cm-') and 3.51 Mm (2850 cm"'); andC-methyl doublet at 3.38 Mm (2960 cm"') and3.49 Mm (2865 cm"'). Thus, a group of 28 cychcacetals of various sugars all showed [4] a bandat 3.32 to 3.37 Mm (3010 to 2965 cm"'). As regards
0-methyl, all of 21 methyl aldopyranosides
studied [12] showed a characteristic C—H stretch-
ing band at 3.47-3.52 Mm (2882-2841 cm"'),
not shown by C-methyl or ethoxyl groups [25]'
that permits detection of the glycosidic methoxylgroup.
Some deformation frequencies for C—H are:
—CH2— at 6.89 Mm (1450 cm"'), and C-methyl
8
at 7.27 Mm (1375 cm-i). The C-methyls of theI isopropyl group show bands at 7.25 and 7.30
nm (1380 and 1370 cm~^) that are particularly
useful for indicatmg the presence of the iso-
propylidene acetal structure.
Weak bands for C—H in-plane deformations of
the unsubstituted phenyl group are found at
8.51 to 8.89 Mm (1175 to 1125 cm"'), 9.01 to 9.35 Mm(1110 to 1070 cm-i), and 9.35 to 10.00 Mm (1070to 1000 cm~^); strong bands for C—H out-of-
plane deformations occur at 12.99 to 13.70 Mm(770 to 730 cm-i) and 14.08 to 14.49 Mm (710 to
690 cm-^).
For substituted phenyl groups, the bands for
C—H in-plane and out-of-plane deformationdiffer according to the position and degree of
substitution. For the ^-substituted phenyl group,most commonly encountered in sugar chemistry,weak bands (in-plane deformations) are found at
8.17 to 8.51 Mm (1225 to 1175 cm-^), 8.89 to 9.17
Mm (1125 to 1090 cm-i), and 9.35 to 10.00 Mm(1070 to 1000 cm~^), and a strong band (out-of-
plane deformation) at 11.63 to 12.50 Mm (860 to
800 cm~'). Thus, the p-substituted phenyl groupof p-toluenesulfonic esters of alditols [26] andsugars [27] shows a hydrogen out-of-plane de-
formation at 12.05 to 12.35 Mm (830 to 810 cm'^),not shown by methanesulfonates.
For the olefins, CHR=CH2 shows a weak bandat 7.04 to 7.09 Mm (1420 to 1410 cm-^), a band at
7.69 to 7.75 Mm (1300 to 1290 cm"'), a medium-strength band at 10.05 and 10.15 Mm (995 to 985cm"'), and a strong band at 10.93 to 11.05 Mm(915 to 905 cm~0. A cis double bond shows a
weak band at 7.04 to 7.14 Mm (1420 to 1400 cm"')and a strong band at 13.70 to 15.04 Mm (730 to
665 cm"') ; a trans double bond shows a weak bandat 7.55 to 7.75 Mm (1325 to 1290 cm"') and a
strong band at 10.20 to 10.42 Mm (980 to 960 cm"').For example, fran.s-3-hexene-D-f/i,reo-l,2,5,6-tetrol
[28] shows bands at 7.55 and 10.25 Mm (1325 and976 cm"') ; its 1,2 :5,6-di-(?-isopropylidene deriva-tive shows bands at 7.65 Mm (1307 cm"') and10.30 Mm (971 cm"').
Whiffen et al. [29] have succeeded in identifying
the C—H deformation vibrations at the anomericcarbon atom of various aldoses by replacingthe hydrogen atom on C-1 with deuterium. Forexample, to prepare a-n-glucopyranose-i-C-rf, theydissolved n-glucono-l ,5-lactone in deuterium oxide,
reduced the carbonyl group to —C—D(OD) with
sodium amalgam in deuterium oxide, and thenconverted the OD groups into OH groups by3 times dissolving in water and evaporating;the C—D bond at C-1 remained unchanged. Thespectrum of the a-D-glucopyranose-i-C-(Z was then
compared with that of a-n-glucopyranose. Now,by theory, if 'H is replaced by D (^H), the 'Hdeformation frequencies are approximately V2times the corresponding deuterium frequencies
(in cm ') if the deformation corresponds to apure bending or stretching mode. They foundC-1—H at 7.28 Mm (1375 cm"') and C-1—D at9.13 Mm (1095 cm"') (frequency ratio 1.26); andC-1—H at 7.79 Mm (1284 cm"') and C-1—
D
at 10.36 Mm (965 cm"') (ratio 1.33), as comparedto the theoretical ratio of 1.414. Similar assign-
ments were made for the 13 anomer and for thetwo anomers of other sugars.
4.2,2. N—H Bands
In dilute solution in a nonpolar solvent, primary-amines show two bands in the region of 2.86 to
3.03 Mm (3500 to 3300 cm"') due to stretchingvibrations of the NH2 group. If hydrogen bondingoccurs, or if the solid is examined, the range is
shifted to 2.86 to 3.23 Mm (3500 to 3100 cm"').Secondary amines in dilute solution show onlyone N—H stretching band, at 2.94 to 3.03 Mm(3400 to 3300 cm"').
An N—H deformation frequency is shown byprimary amines at 6.08 to 6.45 Mm (1645 to 1550cm"')
;thus, D-glucosylamine shows a band at
6.17 Mm (1621 cm"'), and 2-amino-2-deoxy-D-glucopyranose at 6.25 Mm (1600 cm"') [3]. A bandat 6.33 to 6.62 Mm (1580 to 1510 cm"') is shownby—NH—
.
The NH2 deformation frequency of primaryamides occurs at 6.06 to 6.17 Mm (1650 to 1620cm"') for the solid, and at 6.17 to 6.29 Mm (1620to 1590 cm"') for solutions; it is called the AmideII band. Secondary amides, having an NH group,show the Amide II band at 6.37 to 6.60 Mm(1570 to 1515 cm"') for the solid, and at 6.45 to
6.62 Mm (1550 to 1510 cm"') for solutions. Hydro-gen-bonded secondary amides show an NH defor-
mation mode near 13.89 Mm (720 cm"'), called
the Amide V band.
The spectra of 16 1-acetamido derivatives of
sugars [19] showed at least one band at 2.98 to3.09 Mm (3356 to 3236 cm"'), attributed to N—
H
stretching; and, at 6.35 to 6.49 Mm (1575 to 1541cm"'), the Amide II band. In a study of thespectra of 60 1-acylamido derivatives of aldofur-anoid, aldopyranoid, and acyclic sugars [2], all of
the compounds were secondary amides, and all
of them showed at least one band at 2.89 to 3.10
Mm (3460 to 3226 cm"') due to N—H stretching;in this region, completely esterified compoundscould not be distinguished from those having free
hydroxyl groups that would show O—H stretching
in the same region. All of the compounds showeda band at 6.35 to 6.65 Mm (1575 to 1504 cm"';
Amide II)
.
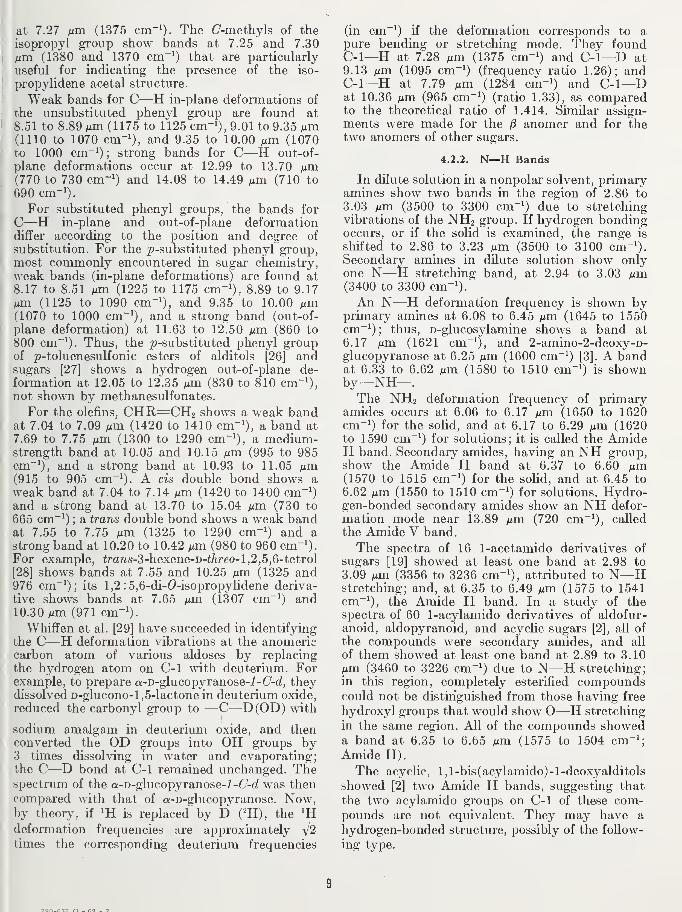
The acyclic, l,l-bis(acylamido)-l-deoxyalditols
showed [2] two Amide II bands, suggesting that
the two acylamido groups on C-1 of these com-pounds are not equivalent. They may have a
hydrogen-bonded structure, possibly of the follow-
ing type.
jCHINJHCR
^CHOR'
CHI
where R is Me, Et, or Ph; and R' is H, Ac, EtCO,or Bz.
4.2,3. O—H Bands
Compounds having a free hydroxyl group showa band for O—H stretching at 2.68 to 2.84
(3730 to 3520 cm-^). The O—H bond is weakenedif the hydroxyl group is hydrogen-bonded, andthe band is broadened, mth a shift to longerwavelength, 2.84 to 3.22 (3520 to 3100 cm-i).
The band for O—H deformation lies at 9.26 to
9.71 Mm (1080 to 1030 cm-^). For sugars, differ-
entiation of primary from anomeric and secondaryhydroxyl groups by OH frequencies is not feasible,
because of frequency shifts caused by hydrogenbonding.
Infrared spectra may be used for the detection
of hydrogen bonding, which may be between onemolecule and another (intermolecular) or in onemolecule (intramolecular) . For compounds soluble
in carbon tetrachloride, intermolecular hydrogen-bonding is negligible at concentrations below0.005 M, and absorptions at ca. 2.79 nm (ca.
3585 cm"') and ca. 2.76 nm (ca. 3625 cm~') maybe associated with bonded and free hydroxylgroups, respectively [5]. In this way, the extent of
intramolecular hydrogen bonding may be de-
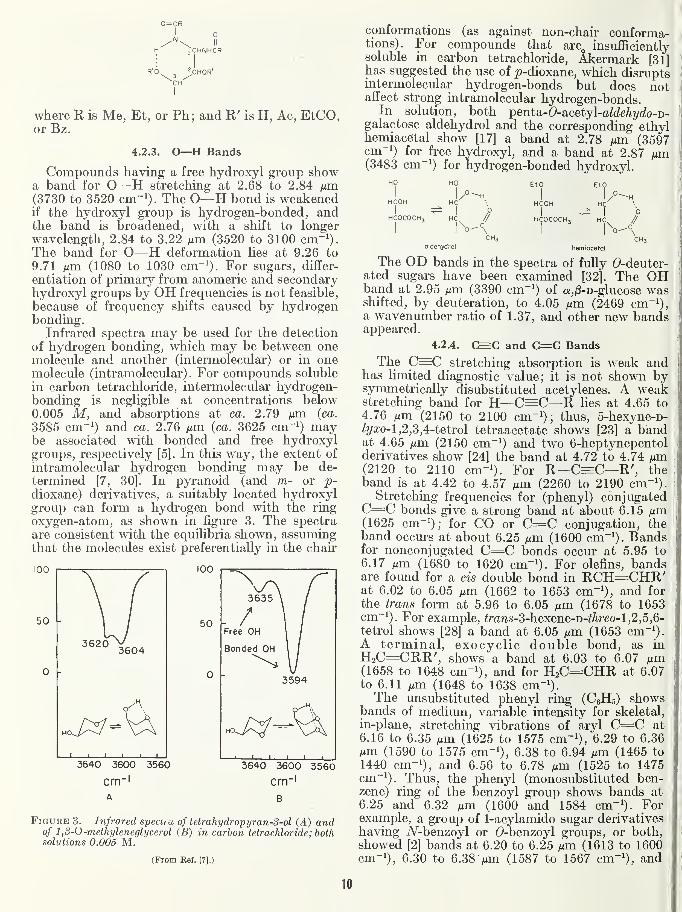
termined [7, 30]. In pyranoid (and m- or p-dioxane) derivatives, a suitably located hydroxylgroup can form a hydrogen bond with the ring
oxygen-atom, as shown in figure 3. The spectra
are consistent with the equilibria shown, assumingthat the molecules exist preferentially in the chair
100 100
50
0 -
3640 3600 3560
cm"i
A
3635 \
- / \
Free OH
Bonded OH
5594
1 1 1 1 1
3640 3600 3560
cm"i
B
Figure 3. Infrared spect, a of tetrahydropyran-3-ol (A) andof 1,3-0-methyleneglycerol (B) in carbon tetrachloride ; bothsolutions 0.005 M.
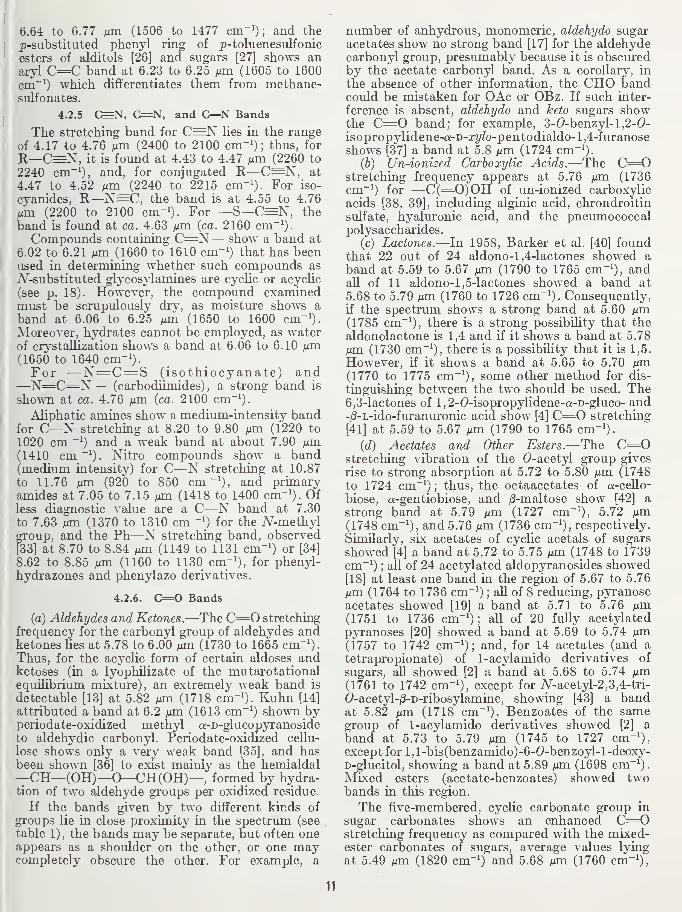
(From Ref. [7].)
conformations (as against non-chair conforma-tions). For compounds that are„ insufficientlysoluble in carbon tetrachloride, Akermark [31]has suggested the use of |)-dioxane, which disruptsintermolecular hydrogen-bonds but does notaffect strong intramolecular hydrogen-bonds.
In solution, both penta-(9-acetyl-aMe%(^o-D-galactose aldehydrol and the corresponding ethylhemiacetal show [17] a band at 2.78 urn (3597cm~^) for free hydroxyl, and a band at 2.87(3483 cm"') for hydrogen-bonded hydroxyl.
HO HO
HCOH HC~~-H
0HCOCOCH, HC
1 To//
\CH,
oldehydrol
Etc EtO
HCOH ^ HC~-H
i
HCOCOCHj
1
0'
hemiacetal
b//
,C
\h3
The OD bands in the spectra of fuUy 0-deuter-ated sugars have been examined [32]. The OHband at 2.95 ixm (3390 cm"') of Q;,|8-D-glucose wasshifted, by deuteration, to 4.05 /zm (2469 cm"'),a wavenumber ratio of 1.37, and other new bandsappeared.
4.2.4. C=C and C=C Bands
The C=C stretching absorption is weak andhas limited diagnostic value; it is not shown bysymmetrically disubstituted acetylenes. A weakstretching band for H—C=C—R lies at 4.65 to
4.76 ixm (2150 to 2100 cm"'); thus, 5-hexyne-D-Z?/a;o-l,2,3,4-tetrol tetraacetate shows [23] a bandat 4.65 urn. (2150 cm"') and two 6-heptynepentolderivatives show [24] the band at 4.72 to 4.74 nm(2120 to 2110 cm-'). For R—C=C—R', theband is at 4.42 to 4.57 fMia (2260 to 2190 cm"').
Stretching frequencies for (phenyl) conjugatedC=C bonds give a strong band at about 6.15 ixm(1625 cm"'); for CO or C=C conjugation, theband occurs at about 6.25 nm (1600 cm"'). Bandsfor nonconjugated C=C bonds occur at 5.95 to
6.17 fim (1680 to 1620 cm"'). For olefins, bandsare found for a cis double bond in RCH=CHR'at 6.02 to 6.05 fim (1662 to 1653 cm"'), and for
the trans form at 5.96 to 6.05 ixm (1678 to 1653cm"'). For example, trans-^-hexene-'D-threo-l,2,5,Q-
tetrol shows [28] a band at 6.05 nm (1653 cm"').A terminal, exocyclic double bond, as in
H2C=CRR', shows a band at 6.03 to 6.07 ^m(1658 to 1648 cm-'), and for H2C=CHR at 6.07to 6.11 iim (1648 to 1638 cm-').The unsubstituted phenyl ring (CeHs) shows
bands of medium, variable intensity for skeletal,
in-plane, stretching vibrations of aryl C=C at
6.16 to 6.35 Mm (1625 to 1575 cm"i), 6.29 to 6.36
Mm (1590 to 1575 cm"'), 6.38 to 6.94 Mm (1465 to
1440 cm-'), and 6.56 to 6.78 Mm (1525 to 1475cm"'). Thus, the phenyl (monosubstituted ben-zene) ring of the benzoyl grouo shows bands at
6.25 and 6.32 Mm (1600 and 1584 cm"'). Forexample, a group of 1-acylamido sugar derivativeshaving A^-benzoyl or 0-benzoyl groups, or both,showed [2] bands at 6.20 to 6.25 Mm (1613 to 1600cm-'), 6.30 to 6.38 Mm (1587 to 1567 cm-'), and
10
ll
6.64 to 6.77 fim (1506 to 1477 cm-i); and the
I ^-substituted phenyl rmg of p-toluenesulfonic
esters of alditols [26] and sugars [27] shows anaryl C=C band at 6.23 to 6.25 txva (1605 to 1600
\
cm~^) Avhich differentiates them from methane-sulfonates.
4.2.5 C^N, C=N, and C—N Bands
The stretching band for C^N lies in the rangeof 4.17 to 4.76 Mm (2400 to 2100 cm-^)
;thus, for
R—C=N, it is foimd at 4.43 to 4.47 /xm (2260 to
2240 cm~^), and, for conjugated R-—C=N, at
4.47 to 4.52 Mm (2240 to 2215 cm-^). For iso-
cyanides, R—N=C, the band is at 4.55 to 4.76
Mm (2200 to 2100 cm-i). For —S—C=N, the
band is found at ca. 4.63 Mm {ca. 2160 cm~^).
Compounds containing C=N— show a band at
6.02 to 6.21 Mm (1660 to 1610 cm-^ that has beenused in determining whether such compounds as
A^-substituted glycosylamines are cyclic or acycUc(see p. 18). However, the compound examinedmust be scrupulously dry, as moisture shows a
band at 6.06 to 6.25 Mm (1650 to 1600 cm-^).
Moreover, hydrates cannot be employed, as waterof crystallization shows a band at 6.06 to 6.10 Mm(1650 to 1640 cm-i).
For —N=C=S (isothiocyanate) and—N=C=N — (carbodiimides) , a strong band is
shouTi at ca. 4.76 Mm {ca. 2100 cm~^).
Aliphatic amines show a medium-intensity bandfor C—N stretchmg at 8.20 to 9.80 Mm (1220 to
1020 cm and a weak band at about 7.90 Mm(1410 cm ~^). Nitro compounds show a band(medium intensity) for C—N stretching at 10.87
to 11.76 Mm (920 to 850 cm "^), and primaryamides at 7.05 to 7.15 Mm (1418 to 1400 cm-^). Ofless diagnostic value are a C—N band at 7.30
to 7.63 Mm (1370 to 1310 cm for the iV-methylgroup, and the Ph—N stretching band, observed
[33] at 8.70 to 8.84 Mm (1149 to 1131 cm-^) or [34]
8.62 to 8.85 Mm (1160 to 1130 cm-^), for phenyl-hydrazones and phenylazo derivatives.
4.2.6. C=0 Bands
(a) Aldehydes and Ketones.—The C=0 stretching
frequency for the carbonyl group of aldehydes andketones lies at 5.78 to 6.00 Mm (1730 to 1665 cm-^).
Thus, for the acyclic form of certain aldoses andketoses (in a lyophilizate of the mutarotationalequilibrium mixture), an extremely weak band is
detectable [13] at 5.82 Mm (1718 cm"'). Kuhn [14]
attributed a band at 6.2 Mm (1613 cm~') shown byperiodate-oxidized methyl a-D-glucopyranosideto aldehydic carbonyl. Periodate-oxidized cellu-
lose shows only a very weak band [35], and hasbeen shown [36] to exist mainly as the hemialdal—CH—(OH)—O—CH(OH)— , formed by hydra-tion of two aldehyde groups per oxidized residue.
If the bands given by two different kinds of
groups lie in close proximity in the spectrum (see
table 1), the bands may be separate, but often oneappears as a shoulder on the other, or one maycompletely obscure the other. For example, a
number of anhydrous, monomeric, aldehydo sugaracetates show no strong band [17] for the aldehydecarbonyl group, presumably because it is obscuredby the acetate carbonyl band. As a coroUary, in
the absence of other information, the CHO bandcould be mistaken for OAc or OBz. If such inter-
ference is absent, aldehydo and keto sugars showthe C=0 band; for example, 3-0-benzyl-l,2-0-isopropylidene-a-D-a;^^o-pentodialdo-l,4-furanoseshows [37] a band at 5.8 Mm (1724 cm^^).
(6) Un-ionized Carboxylic Acids.—The C=0stretching frequency appears at 5.76 Mm (1736cm~^) for —C(=0)OH of un-ionized carboxylicacids [38, 39], including alginic acid, chrondroitinsulfate, hyaluronic acid, and the pneumococcalpolysaccharides.
(c) Lactones.—In 1958, Barker et al. [40] foundthat 22 out of 24 aldono-l,4-lactones showed a
band at 5.59 to 5.67 Mm (1790 to 1765 cm-^), andall of 11 aldono-l,5-lactones showed a band at
5.68 to 5.79 Mm (1760 to 1726 cm"'). Consequently,if the spectrum shows a strong band at 5.60 Mm(1785 cm~^), there is a strong possibility that the
aldonolactone is 1,4 and if it shows a band at 5.78
Mm (1730 cm~^), there is a possibility that it is 1,5.
However, if it shows a band at 5.65 to 5.70 Mm(1770 to 1775 cm~^), some other method for dis-
tinguishing between the two should be used. The6,3-lactones of l,2-0-isopropylidene-Q:-D-gluco- and-iS-L-ido-fiu-anuronic acid show [4] C=0 stretching
[41] at 5.59 to 5.67 Mm (1790 to 1765 cm-i).
(d) Acetates and Other Esters.—The C=0stretching vibration of the 0-acetyl group gives
rise to strong absorption at 5.72 to 5.80 Mm (1748
to 1724 cm~^);thus, the octaacetates of a-ceUo-
biose, a-gentiobiose, and j3-maltose show [42] a
strong band at 5.79 Mm (1727 cm-^), 5.72 Mm(1748 cm~^), and 5.76 Mm (1736 cm"^), respectively.
Similarly, six acetates of cyclic acetals of sugars
showed [4] a band at 5.72 to 5.75 Mm (1748 to 1739cm~^) ; aU of 24 acetylated aldopyranosides showed[18] at least one band in the region of 5.67 to 5.76
Mm (1764 to 1736 cm~0 ; all of 8 reducing, pyranoseacetates showed [19] a band at 5.71 to 5.76 Mm(1751 to 1736 cm-i); all of 20 fully acetylated
pyranoses [20] showed a band at 5.69 to 5.74 Mm(1757 to 1742 cm~^); and, for 14 acetates^ (and a
tetrapropionate) of 1-acylamido derivatives of
sugars, all showed [2] a band at 5.68 to 5.74 Mm(1761 to 1742 cm-i), except for iy-acetyl-2,3,4-tri-
6>-acetyl-j3-D-ribosylamine, showing [43] a bandat 5.82 Mm (1718 cm"0- Benzoates of the samegroup of 1-acylamido derivatives showed [2] a
band at 5.73 to 5.79 Mm (1745 to 1727 cm"^),
except for 1 , 1 -bis(benzamido) -6-(5-benzoyl-l-deoxy-D-glucitol, showing a band at 5.89 Mm (1698 cm~^).
Mixed esters (acetate-benzoates) showed twobands in this region.
The five-membered, cyclic carbonate group in
sugar carbonates shows an enhanced C=0stretching frequency as compared with the mixed-ester carbonates of sugars, average values lying
at 5.49 Mm (1820 cm-^) and 5.68 Mm (1760 cm-^),
11
respectively [44]. If the cyclic carbonate is trans-
fused in sugar derivatives, a strongC=0 stretching
band is shown [45] at 5.43 ixm (1842 cm~^) ; the
band is not shown by cis-fused carbonates.
(e) Primary Amides.-—The C=0 stretching fre-
quency for —C(=0)NH2 lies near 6.06 fj.m
(1650 cm~^) for solids, and near 5.92 (1690cm~^) for dilute solutions. It is known as the
Amide I band, and is also shown by secondaryand tertiary amides. Three glycopyranuronamidederivatives showed [19] this band at 6.00 to 6.02
/xm (1667 to 1661 cm.-').
(/) N-Acetyl and 8-Acetyl.-—The Amide I bandfor the monosubstituted amide group, as in
—NH—(C=0)—CH3, occurs at ca. 6.04 (1655
cm"^) for solids, and at 5.88 to 5.99 /xm (1700 to
1670 cm~i) for dilute solutions. Thus, the anomersof 2-acetamido-2-deoxy-D-glucop3T:anose and their
tetraacetates show [46] the band at 5.97 to 6.19
Mm (1675 to 1616 cm-^). For aU of 16 1-acetamidoderivatives of sugars, the band is shown [19] at
5.85 to 6.02 Mm (1709 to 1661 cm-^). Hydratesshowed bands at 6.01 to 6.09 Mm (1664 to 1642cm~^) that overlapped, somewhat obscured, or
were obscured by. Amide I bands in the sameregion. Of 60 1-acylamido derivatives of sugars,
aU showed [2] a band at 5.95 to 6.15 Mm (1681 to
1626 cm~^). The Amide I band occurs near 6.07
Mm (1648 cm"^) for such polysaccharides as
chitin [47], but at 6.18 Mm (1618 cm-^) for 2-
acetamido-2-deoxy-a:-D-glucopyranose, and at 6.01
Mm (1665 cm~^) for its tetraacetate, probablybecause of differences in the hydrogen bondingbetween the C=0 group and OH and NH groups
[3]. Because an ionized carboxyl group mil absorbin this region, the spectra of such polysaccharides
as chrondroitin sulfate should be recorded for
films cast from an acid solution.
The carbonyl group in the S'-acetyl group,
_S—(C=0)—CH3, shows [48] a band near 5.95
Mm (1680 cm"^). Thus, this group can be dis-
tinguished from the 0-acetyl group, absorbing
near 5.75 Mm (1740 cm~^) and the A^-acetyl group,
absorbing near 6.10 Mm (1640 cm"^).
4.2.7. C—O Bands
(a) Esters.-—Strong bands for the C—O stretch-
ing vibrations are shown by esters; for example,
by acetates at 8.00 to 8.13 Mm (1250 to 1230 cm-i),
formates at 8.33 to 8.48 Mm (1200 to 1180 cm-^),
and propionates at 8.33 to 8.55 Mm (1200 to 1170cm~^). Esters of aromatic acids shows +w'o strong
bands for C—O stretching, at 7.69 to 8.00 Mm(1300 to 1250 cm-i) and 8.70 to 9.09 Mm (1150 to
1100 cm-i).
(6) Carboxylate Ion.—Salts of carboxylic acids,
such as the lithium and barium salts of 1,2-0-
isopropylidene-a-D-glucofuranuronic acid, show [4]
a carbon—oxygen stretching band (strong) at
6.11 to 6.25 Mm (1637 to 1600 cm-i) that dis-
tinguishes carboxylate anions from the C=0
stretching band of esters, and a band (mediumstrength) at 7.04 to 7.69 Mm (1420 to 1300 cm-i).
4.2.8. N^N, N=N, and NO2 Bands
The N=N stretching vibration of azides givesa strong band at 4.63 to 4.72 Mm (2160 to 2120 ^
cm~^) and a weak band at 7.46 to 8.48 Mm (1340to 1180 cm~^). The N=N group in aromaticdiazo compounds gives bands at 6.31 to 6.37 Mm(1585 to 1570 cm-i) and at 7.04 to 7.24 Mm(1420 to 1381 cm~^). According to Bassignanaand Cogrossi [34], the bands lie at 6.32 to 6.42 Mm(1582 to 1558 cm-i) and 6.95 to 7.25 Mm (1439to 1379 cm-i).
Nitric esters of sugars show [27] strong bands for
asymmetric NO2 stretching at 6.00 to 6.20 Mm(1667 to 1613 cm~^) and for symmetric NO2stretching at 7.78 to 7.89 Mm (1285 to 1267 cm.-'); '
a broad band (for O—NO2 stretching) at 11.48 to
12.08 Mm (871 to 828 cm-^) is useful only for
confirmation as it occurs in a region that contains
bands (Types 2a, 2c, and C) for sugars and the
C—H out-of-plane deformation of the p-substi-
tuted phenyl group.
4.2.9. S=0, —SO2— , and C=S BandsIj
Esters of sulfuric acid, such as the 6-sulfates of|
D-glucose, D-galactose, and 2-acetamido-2-deoxy-j
D-glucose, show [49] an intense band at 8.07 Mm(1240 cm~^), due to S—O stretching vibrations.
The position of a band at 11.76 to 12.19 Mm (850
to 820 cm~^) for the C—O^—S frequency of the
sidfate group has been correlated with its attach-
ment (primary or secondary) and with the axial
or equatorial disposition if secondary (see page
16).
Sulfones show strong bands at 7.38 to 7.64
Mm (1355 to 1310 cm^^) and 8.62 to 9.01 Mm(1160 to 1110 cm-i) for S=0 stretching; thus,
the monosulfone obtained by oxidizing penta-0-SLcetjl-aldehydo-D-glucose dibenzyl dithioacetal
shows a band at 7.66 Mm (1305 cm-') [22].
p-Toluenesulfonic esters of alditols [26] show-
bands at 7.3 to 7.4 Mm (1370 to 1350 cm-') andat 8.4 to 8.5 Mm (1190 to 1175 cm-') for the asym-metrical and symmetrical stretching modes of
the —SO2— group [50, 51]. Sulfonic esters of
sugars usually show two bands in each region [27].
Bands for C—O—S at 11.8 to 11.9 Mm (848 to
840 cm-i) and 11.2 to 11.4 Mm (893 to 877 cm;')
have been correlated with the axial or equatorial
disposition of the sulfonic ester group (see page
16).
The C=S group of thionocarbonates shows [52]
bands at 7.52 Mm (1330 cm"') and at 7.65 Mm(1307 cm-'); a band at 8.40 Mm (1190 cm"') is
also found [51].
Dimethylthiocarbamates of sugars show, for
0C(=S)NMe2, a strong band [53] at 6.5 to 6.6
Mm (1540 to 1515 cm-'). iV,7V-Dimethyldithio-
carbamates show, for —SC(=S)NMe2, a strong
band at 6.71 to 6.80 Mm (1490 to 1470 cm-').
12
4.2.10. Miscellaneous Bands
I
The follo^^ing bands are useful. (1) Polystyrene
(for calibration): 3.51 ixm (2851 cm~^), 6.24 ixm
(1602 cm-'), and 11.03 Mm (907 cvar^). (2) Nujol:
I
3.43 Mm (2918 qtot^), 3.50 Mm (2861 cm-^), 6.86
I
Mm (1458 cm-i), and 7.26 Mm (1378 cm-^) [and ai weak band at 13.89 Mm (720 cm-')]. (3) Water as
moisture: 2.92 Mm (3430 cm-') and 6.06-6.25 Mm(1650 to 1600 cm-i).
Spurious bands may be introduced by a variety
of causes, including sUicone grease used on stop-
cocks, polyethylene powder from laboratory ware,
and phthalic anhydride from the plasticizer in
plastic tubing. About 35 spurious bands havebeen listed [54].
jj
4.3. Correlations for the Fingerprint Regionand Beyond
4.3.1. The Fingerprint Region
Whereas the spectra of stiiicturally similar
compounds may be quite similar in the range of
2 to 7 Mm (5000 to 1430 cm"'), significant spectral
differences are foimd in the fingerprint region
from 7 to 11 Mm (1430 to 910 cm-'), because herethe bands are due both to certain stretching vi-
brations and bending vibrations. As a result,
smaU differences in structure appear as large
spectral effects. Consequently, the region is valu-able for identification of a compound, and for
differentiating between isomers, including anomers.On the other hand, the fingerprint region is
often less usefiil for recognizing the presence of
particular organic groups than the region below7 Mm (above 1430 cm-'), where the presence or
absence of bands may give valuable, reliable evi-
dence for characteristic groups. For example, the
characteristic group-frequencies for a-{x> or l)-
glucopyranose are essentially the same as those for
i3-(D or L)-glucopyranose, and hence their spectra
below 7 Mm (above 1430 cm~') are similar; but,
for crystals in which the molecules have the
favored chair conformation, the interactions of
the hydroxyl group at C-1 with the ring-oxygenatom of a neighboring molecule can be expectedto be different for the axially attached group ofthe a-(D or l) anomer and the equatorially at-tached group of the jS-(d or l) anomer, andtherefore their spectra in the fingerprint regioncan be expected to differ. In the hydrogen-bonded structure proposed [55] for crystallinea-D-glucopyranose, the bonding between the C-1hydroxyl group of one molecule and the ringoxygen atom of a neighbor would be differentfrom that for the crystalline /3-d anomer. Analysisof such differences by a combination of x-raycrystal-structure analysis, broad-line nuclear mag-netic resonance spectroscopy, and infrared spec-troscopy should eventually lead to improvedinterpretation of the bands in the fingerprintregion and beyond, but this goal has not yetbeen reached.
4.3.2. Correlations for 10 to 15 Mm (1000 to 667 cm-i)
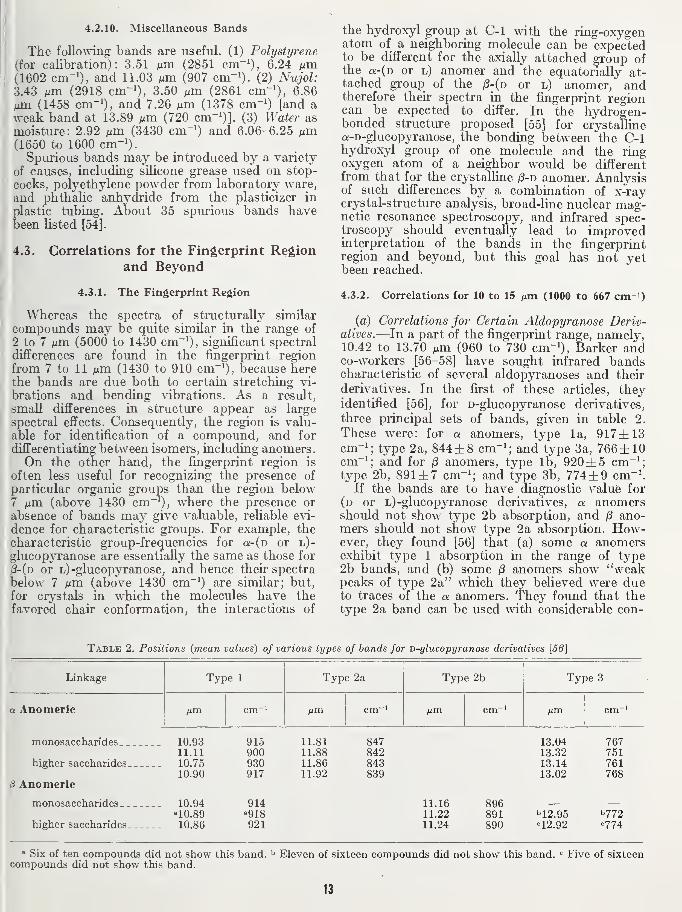
{a) Correlations for Certain Aldopyranose Deriv-atives.—In a part of the fingerprint range, namely,10.42 to 13.70 Mm (960 to 730 cm-'). Barker andco-workers [56-58] have sought infrared bandscharacteristic of several aldopyranoses and their
derivatives. In the first of these articles, theyidentified [56], for n-glucopyranose derivatives,
three principal sets of bands, given in table 2.
These were: for a anomers, type la, 917±13cm-'; type 2a, 844±8 cm-'; and type 3a, 766±10cm-'; and for j8 anomers, type lb, 920±5 cm"';type 2b, 891 ±7 cm"'; and type 3b, 774 ±9 cm-'.
If the bands are to have diagnostic value for
(d or L)-glucopyranose derivatives, a anomersshould not show type 2b absorption, and /3 ano-mers should not show type 2a absorption. How-ever, they found [56] that (a) some a anomersexhibit type 1 absorption in the range of type2b bands, and (b) some /3 anomers show "weakpeaks of type 2a" which they believed were dueto traces of the a anomers. They found that thetype 2a band can be used with considerable con-
Table 2. Positions {mean values) of various types of bands for D-glucopyranose derivatives [66]
Linkage Type 1 Type 2a Type 2b Type 3
a Anomerlc Mm cm~' cm^' pim cm~' ^m cm~i
monosaccharides 10.93 915 11.81 847 13.04 76711.11 900 11.88 842 13.32 751
higher saccharides 10.75 930 11.86 843 13.14 76110.90 917 11.92 839 13.02 768
8 Anomerlc
monosaccharides _ 10.94 914 11.16 896«10.89 «918 11.22 891 bl2.95 b772
higher saccharides 10.86 921 11.24 890 '^12.92 <^774
» Six of ten compounds did not show this band. Eleven of sixteen compounds did not show this band. Five of sixteencompounds did not show this band.
13
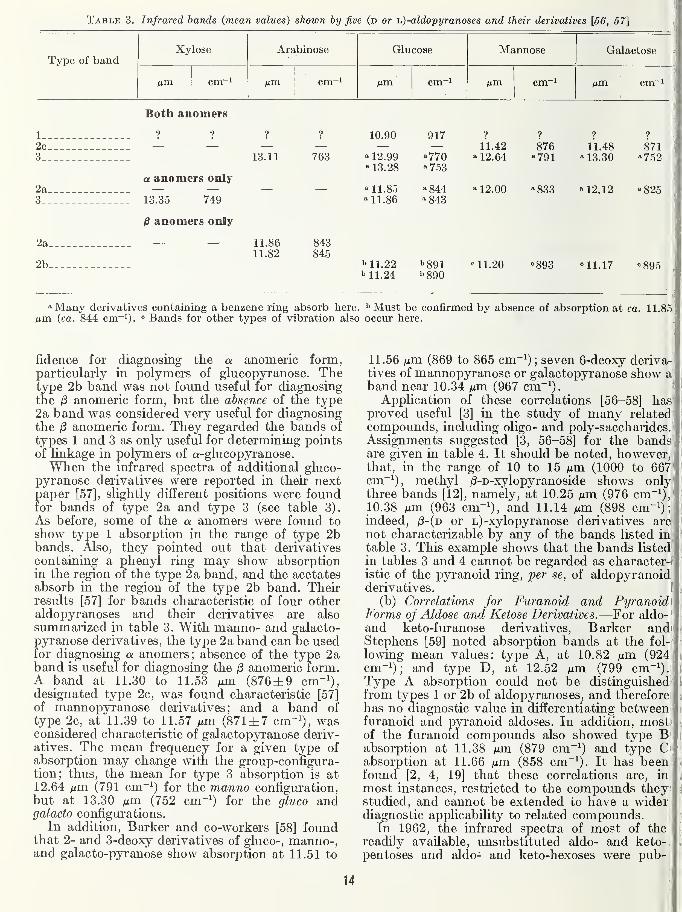
Table 3. Infrared bands {mean values) shown by five (d or ij)-aldopyranoses and their derivatives [56, 57]
Type of bandXylose Arabinose Glucose Mannose Galactose
cm~' cm~i yum Aim cm~i
Both anomers
1 ? ? ? ? 10.90 917 ? ? ? ?
2c_ 11.42 876 11.48 8713 13.11 763 - 12.99 -770 -12.64 -791 -13.30 -752
* 13. ZO " 753a anomers only
2a —
.
— » 11.85 -844 - 12.00 -833 -12.12 -8253 13.35 749 « 11.86 -843
^ anomers only
za 11.86 84311.82 845
2b b 11.22 ''891 ni.20 =893 =11.17 =895''11.24 b890
-Many derivatives containing a benzene ring absorb here. ^Must be confirmed by absence of absorption at ca. 11.85Mm (ca. 844 cm~i). <= Bands for other types of vibration also occur here.
fidence for diagnosing the a anomeric form,particularly in polymers of glucopyranose. Thetype 2b band was not found useful for diagnosingthe /S anomeric form, but the absence of the type2a band was considered very useful for diagnosingthe i8 anomeric form. They regarded the bands of
types 1 and 3 as only useful for determining pointsof linkage in polymers of a-glucopyranose.When the infrared spectra of additional gluco-
pyranose derivatives were reported in their nextpaper [57], slightly different positions were foundfor bands of type 2a and type 3 (see table 3).
As before, some of the a. anomers were found to
show type 1 absorption in the range of type 2bbands. Also, they pointed out that derivativescontaining a phenyl ring may show absorptionin the region of the type 2a band, and the acetatesabsorb in the region of the type 2b band. Theirresults [57] for bands characteristic of four otheraldopyranoses and their derivatives are also
summarized in table 3. With manno- and galacto-pyranose derivatives, the type 2a band can be usedfor diagnosing a anomers; absence of the type 2aband is useful for diagnosing the /3 anomeric form.A band at 11.30 to 11.53 Mm (876±9 cm-^),designated type 2c, was found characteristic [57]
of mannopyranose derivatives; and a band of
type_2c, at 11.39 to 11.57 nm (871 ±7 cm^^), wasconsidered characteristic of galactopyranose deriv-atives. The mean frequency for a given type of
absorption may change witli the group-configura-tion; thus, the mean for type 3 absorption is at12.64 Aim (791 cm~^) for the manno configuration,but at 13.30 ixm (752 cm"^) for the gluco andgalacto configurations.
In addition. Barker and co-workers [58] foundthat 2- and 3-deoxy derivatives of gluco-, manno-,and galacto-pyranose show absorption at 11.51 to
11.56 iJLxn (869 to 865 cm ; seven 6-deoxy deriva-tives of mannopyranose or galactopyranose show aband near 10.34 Mm (967 cm"'). i
Application of these correlations [56-58] has'
proved useful [3] in the study of many related-
compounds, including oligo- and poly-saccharides.
'
Assignments suggested [3, 56-58] for the bands!are given in table 4. It should be noted, however,ithat, in the range of 10 to 15 Mm (1000 to 667:' '
cm~^), methyl /3-D-xylopyranoside shows onlyf '
three bands [12], namely, at 10.25 Mm (976 cm~^),f '
10.38 Mm (963 cm"!), and 11.14 Mm (898 cm-^) ;'
indeed, /3-(d or L)-xylopyranose derivatives are '
not characterizable by any of the bands listed in! i
table 3. This example shows that the bands listed' '
in tables 3 and 4 cannot be regarded as character-f I
istic of the pyranoid ring, per se, of aldopyranoidderivatives. I t
(b) Correlations for Furanoid and Pyranoidii;
Forms of Aldose and Ketose Derivatives.—For aldo- >ll
and keto-furanose derivatives. Barker andi t
Stephens [59] noted absorption bands at the fol-' r
lowing mean values: type A, at 10.82 Mm (924i i
cm-i); and type D, at 12.52 Mm (799 cm"').Type A absorption could not be distinguished*from types 1 or 2b of aldopyranoses, and therefore s
has no diagnostic value in differentiating between c
furanoid and pyranoid aldoses. In addition, most; i
of the furanoid compounds also showed type B'(]
absorption at 11.38 Mm (879 cm~') and type C' i
absorption at 11.66 Mm (858 cm~^). It has been w
found [2, 4, 19] that these correlations are, in »
most instances, restricted to the compounds they si
studied, and cannot be extended to have a widerdiagnostic applicability to related compounds.
\
In 1962, the infrared spectra of most of thei
readily available, unsubstituted aldo- and keto-i
pentoses and aldo- and keto-hexoses were pub-
14
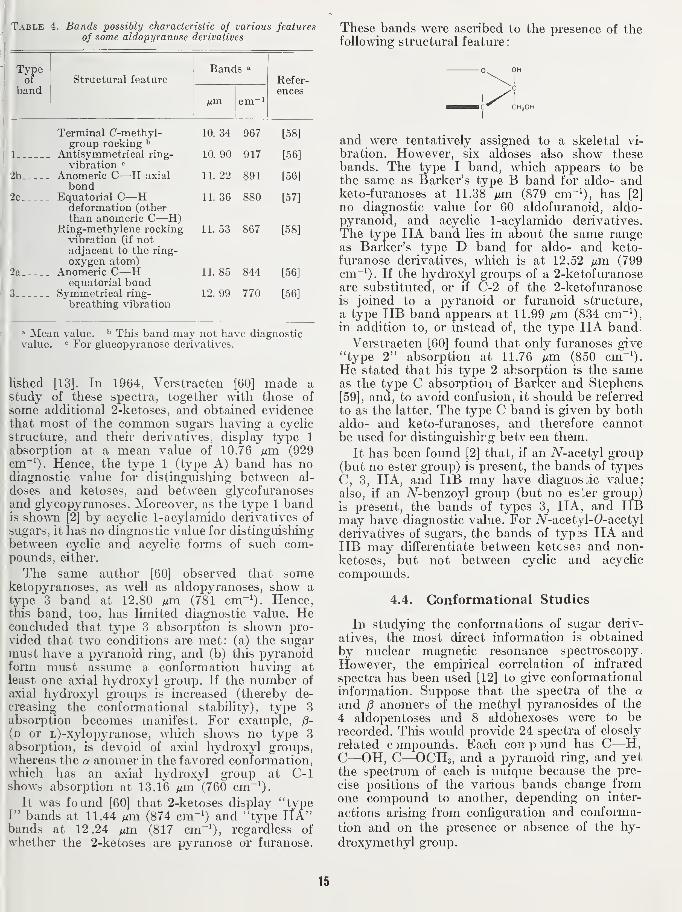
Table 4. Bands possibly characteristic of various features
of some aldopyranuse derivatives
lype Bands »
of Structural feature Refer-band
cm~'ences
Terminal C-methyl- 10. 34 967 [58]group rocking ^
1 Antisymmetrical ring-vibration <^
10. 90 917 [56]
2b Anomeric C—H axial 11. 22 891 [56]bona
2c 11/quatorial C—
H
deformation (otherthan anomeric C—H)
11. 36 880 [57]
Rmg-methylene rocking 11. 53 867 [58]vibration (if notadjacent to the ring-
2a Anomeric C—
H
11. 85 844 [56]equatorial bond
3 Symmetrical ring-
breathing vibration12. 99 770 [56]
^ Mean value. ^ This band may not have diagnosticvalue. " For glucopyranosc derivatives.
lislied [13]. In 1964, Verstraeten [60] made astudy of these spectra, together with those of
some additional 2-ketoses, and obtained evidencethat most of the common sugars having a cyclic
structure, and their derivatives, display type 1
absorption at a mean value of 10.76 nm (929cm"'). Hence, the type 1 (type A) band has nodiagnostic value for distinguishing between al-
doses and ketoses, and between glycofuranosesand glycopyranoses. Moreover, as the type 1 bandis shown [2] by acyclic 1-acylamido derivatives of
sugars, it has no diagnostic value for distinguishing
between cyclic and acyclic forms of such com-pounds, either.
The same author [60] observed that someketopyranoses, as well as aldopyranoses, show atype 3 band at 12.80 fim (781 cm"'). Hence,this band, too, has limited diagnostic value. Heconcluded that type 3 absorption is shown pro-
vided that two conditions are met: (a) the sugarmust have a pyranoid ring, and (b) this pyranoidform must assume a conformation having at
least one axial hydroxy] group. If the number of
axial hydroxy] groups is increased (thereby de-creasing the conformational stability), type 3
absorption becomes manifest. For example, ^-
(d or L)-xylopyranose, which shows no type 3absorption, is devoid of axial hydroxy] groups,whereas the a anomer in the favored conformation,which has an axial hydroxyl group at C-1shows absorption at 13.16 fim (760 cm"').
It was found [60] that 2-ketoses display "typeI" bands at 11.44 Mm (874 cm"') and "type IIA"bands at 12.24 fxm (817 cm"'), regardless of
whether the 2-ketoses are pyranose or furanose.
These bands were ascribed to the presence of thefollowing structural feature
:
and were tentatively assigned to a skeletal vi-
bration. However, six aldoses also show thesebands. The type I band, which appears to bethe same as Barker's type B band for aldo- andketo-furanoses at 11.38 fim (879 cm"'), has [2]
no diagnostic value for 60 aldofuranoid, aldo-
pyranoid, and acyclic 1-acylamido derivatives.
The type IIA band lies in about the same rangeas Barker's type D band for aldo- and keto-furanose derivatives, which is at 12.52 fj.m (799cm"'). If the hydroxyl groups of a 2-ketofuranoseare substituted, or if C-2 of the 2-ketofuranoseis joined to a pyranoid or furanoid structure,
a type IIB band appears at 11.99 Mm (834 cm"'),in addition to, or instead of, the type IIA band.
Verstraeten [60] found that only furanoses give
"type 2" absorption at 11.76 Mm (850 cm"').
He stated that his type 2 absorption is the sameas the type C absorption of Barker and Stephens
[59], and, to avoid confusion, it should be referred
to as the latter. The type C band is given by bothaldo- and keto-furanoses, and therefore cannotbe used for distinguishirg betv een them.
It has been found [2] that, if an A^-acetyl group(but no ester group) is present, the bands of types
C, 3, IIA, and liB may have diagnostic value;
also, if an A^-benzoyl group (but no es'^er group)is present, the bands of types 3, IIA, and IIBmay have diagnostic value. For A^-acetyl-O-acetyl
derivatives of sugars, the bands of typ3s IIA andIIB may differentiate between ketcses and non-ketoses, but not between cyclic and acyclic
compounds.
4.4. Conformational Studies
In studying the conformations of sugar deriv-
atives, the most direct information is obtainedby nuclear magnetic resonance spectroscopy.
However, the empirical correlation of infrared
spectra has been used [12] to give conformationalinformation. Suppose that the spectra of the aand (3 anomers of the methyl pyranosides of the
4 aldopentoses and 8 aldohexoses were to berecorded. This would provide 24 spectra of closely
related compounds. Each conpjund has C—H,C—OH, C—OCH3, and a pyranoid ring, and yet
the spectrum of each is unique because the pre-
cise positions of the various bands change fromone compound to another, depending on inter-
actions arising from configuration and conforma-
tion and on the presence or absence of the hy-
droxymethyl group.
15
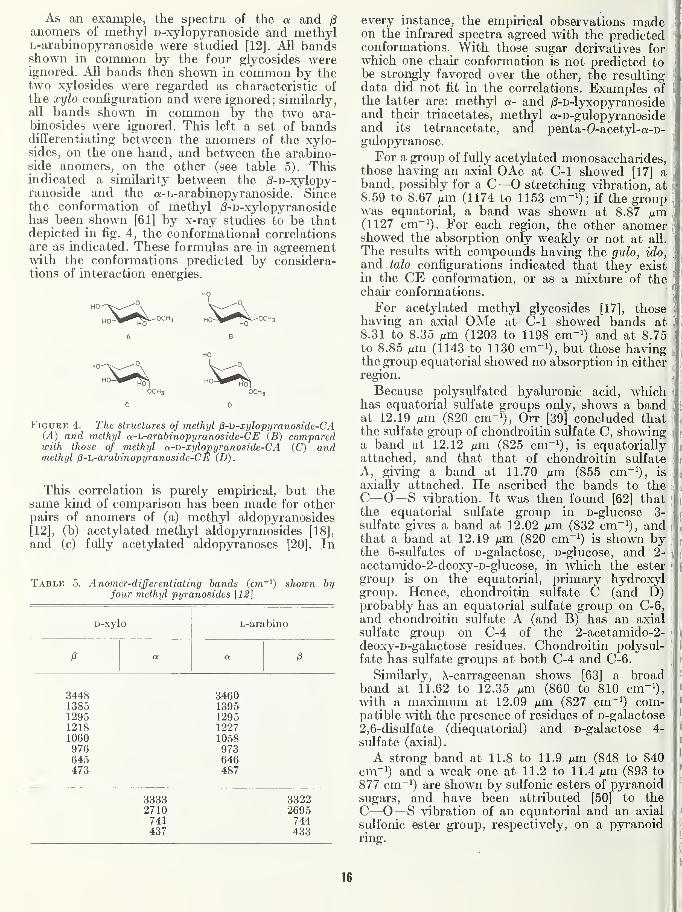
As an example, the spectra of the a and /S
anomers of methyl D-xylopyranoside and methylL-arabinopyranoside were studied [12]. All bandsshown in common by the four glycosides wereignored. All bands then shown in common by thetwo xylosides were regarded as characteristic of
the xylo configuration and were ignored; similarly,all bands shown in common by the two ara-binosides were ignored. This left a set of bandsdifferentiating between the anomers of the xylo-sides, on the one hand, and between the arabino-side anomers, on the other (see table 5). Thisindicated a similarity between the /3-D-xylopy-ranoside and the a-L-arabinopyranoside. Sincethe conformation of methyl /3-D-xylopyranosidehas been shown [61] by x-ray studies to be thatdepicted in fig. 4, the conformational correlationsare as indicated. These formulas are in agreementwith the conformations predicted by considera-tions of interaction energies.
HO
A B
HO
Figure 4. The structures of methyl 0-D-xylopyranoside-CA(A) and methyl a-i^-arabinopyranoside-CE (B) comparedwith those of methyl a-D-zylopyranoside-CA (C) andmethyl p-h-arahinopyranoside-CE (D).
This correlation is purely empirical, but thesame kind of comparison has been made for otherpairs of anomers of (a) methyl aldopyranosides
[12], (b) acetylated methyl aldopyranosides [18],
and (c) fully acetylated aldopyranoses [20]. In
Table .5. Anomer-differentiating bands (cm~^) shown byfour methyl pyranosides [12]
D-xyl 0 L-arabino
a a
3448 34601385 13951295 12951218 12271060 1058976 973645 646473 487
3333 33222710 2695741 744437 433
every instance, the empirical observations madeon the infrared spectra agreed with the predictedconformations. With those sugar derivatives forwhich one chair conformation is not predicted tobe strongly favored over the other, the resultingdata did not fit in the correlations. Examples ofthe latter are: methyl a- and (8-D-lyxopyranosideand their triacetates, methyl a-n-gulopyranosideand its tetraacetate, and penta-O-acetyl-a-D-gulopyranose.
For a group of fully acetylated monosaccharides,those having an axial OAc at C-1 showed [17] aband, possibly for a C—O stretching vibration, at8.59 to 8.67 Mm (1174 to 1153 cm-^) ; if the groupwas equatorial, a band was shown at 8.87 fim(1127 cm~i). For each region, the other anomershowed the absorption only weakly or not at all.
The results with compounds having the gulo, ido,
and talo configurations indicated that they exist
in the CE conformation, or as a mixture of thechair conformations.
For acetylated methyl glycosides [17], thosehaving an axial OMe at C-1 showed bands at8.31 to 8.35 (1203 to 1198 cm-^) and at 8.75to 8.85 MHi (1143 to 1130 cm~^), but those havingthe group equatorial showed no absorption in eitherregion.
Because polysulfated hyaluronic acid, whichhas equatorial sulfate groups only, shows a bandat 12.19 Mm (820 cm-^), Orr [39] concluded thatthe sulfate group of chondroitin sulfate C, showinga band at 12.12 ^m (825 cm~^), is equatoriallyattached, and that that of chondroitin sulfate
A, giving a band at 11.70 Mm (855 cm~'), is
axially attached. He ascribed the bands to theC—0—S vibration. It was then found [62] thatthe equatorial sulfate group in o-glucose 3-
sulfate gives a band at 12.02 Mm (832 cm~^), andthat a band at 12.19 Mm (820 cm~^) is shown bythe 6-sulfates of D-galactose, n-glucose, and 2-
acetamido-2-deoxy-D-glucose, in which the ester
grouj) is on the equatorial, primary hydroxylgroup. Hence, chondroitin sulfate C (and D)probably has an equatorial sulfate group on C-6,
and chondroitin sulfate A (and B) has an axial
sulfate group on C-4 of the 2-acetamido-2-deoxy-D-galactose residues. Chondroitin polysul-
fate has sulfate groups at both C-4 and C-6.
Similarly, X-carrageenan shows [63] a broadband at 11.62 to 12.35 Mm (860 to 810 cm-^),with a maximum at 12.09 Mm (827 cm"^) com-patible with the presence of residues of D-galactose
2,6-disulfate (diequatorial) and D-galactose 4-
sulfate (axial).
A strong band at 11.8 to 11.9 Mm (848 to 840cm~^) and a weak one at 11.2 to 11.4 Mm (893 to
877 cm"^) are shown by sulfonic esters of pyranoidsugars, and have been attributed [50] to the
C—O—S vibration of an equatorial and an axial
sulfonic ester group, respectively, on a pyranoidring.
S
16
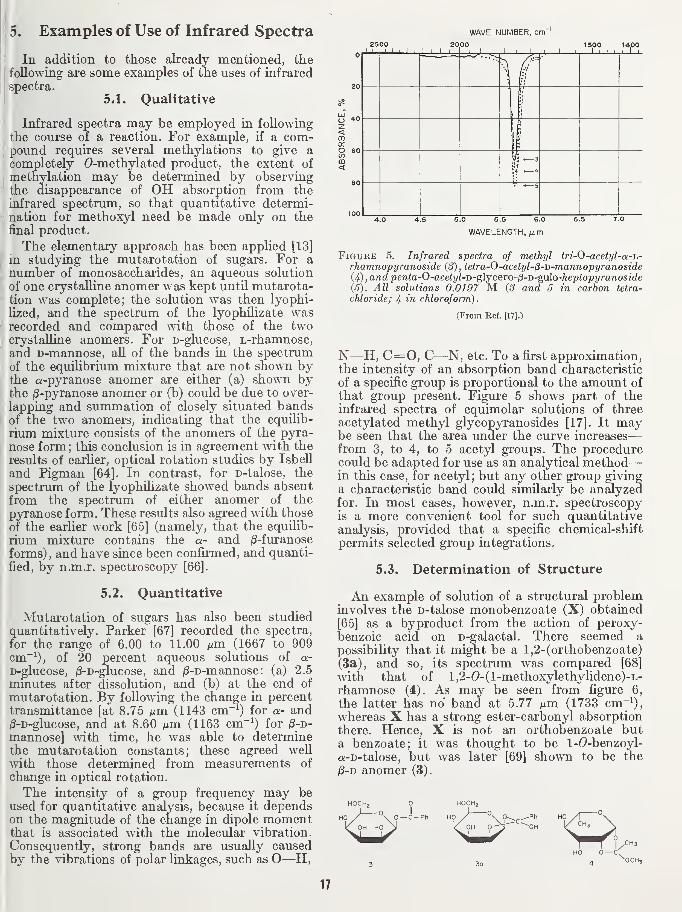
5. Examples of Use of Infrared Spectra
In addition to those already mentioned, thefollowing are some examples of the uses of infrared
spectra.
5A. Qualitative
Infrared spectra may be employed in foUowrngthe course of a reaction. For example, if a com-pound requires several methylations to give a
completely 0-methylated product, the extent of
metnylation may be determined by observingthe disappearance of OH absorption from therafrared spectrum, so that quantitative determi-nation for methoxyl need be made only on thefinal product.
The elementary approach has been applied [13]
in studying the mutarotation of sugars. For a
number of monosaccharides, an aqueous solution
of one crystalline anomer was kept untU mutarota-tion was complete; the solution was then lyophi-
lized, and the spectrum of the lyophilizate wasrecorded and compared with those of the twocrystalline anomers. For n-glucose, L-rhamnose,and D-mannose, aU of the bands in the spectrumof the equilibrium mixture that are not shown bythe a-pyranose anomer are either (a) shown bythe jS-pyranose anomer or (b) could be due to over-
lapping and summation of closely situated bandsof the two anomers, indicating that the equUib-rium mixture consists of the anomers of the pyra-
nose form; this conclusion is in agreement Avith the
results of earUer, optical rotation studies by Isbell
and Pigman [64]. In contrast, for n-talose, the
spectrum of the lyophilizate showed bands absentfrom the spectrum of either anomer of the
pyranose form. These results also agreed with those
of the earlier work [65] (namely, that the equilib-
rium mixture contains the a- and /S-furanose
forms), and have since been confirmed, and quanti-
fied, by n.m.r. spectroscopy [66].
5.2. Quantitative
Mutarotation of sugars has also been studied
quantitatively. Parker [67] recorded the spectra,
for the range of 6.00 to 11.00 Mm (1667 to 909cm~^), of 20 percent aqueous solutions of a-
D-glucose, /3-D-glucose, and ;8-D-mannose : (a) 2.5
minutes after dissolution, and (b) at the end of
mutarotation. By following the change in percent
transmittance [at 8.75 Mm (1143 cm~^) for a- and;8-D-glucose, and at 8.60 Mm (1163 cm~^) for ^S-d-
mannose] with, time, he was able to determinethe mutarotation constants; these agreed well
with those determined from measurements of
change in optical rotation.
The intensity of a group frequency may beused for quantitative analysis, because it dependson the magnitude of the change in dipole momentthat is associated with the molecular vibration.
Consequently, strong bands are usually causedby the vibrations of polar linkages, such as O—H,
WAVE NUMBER, cm"
I""' I I 'I I 1 1
4.0 4.5 S.O S.5 6.0 6.5 7.0
WAVELENGTH, /J.
m
Figure 5. Infrared spectra of methyl tri-O-acetyl-a-h-rhamnopyranoside (S), tetra-O-acetyl-p-D-mannopyranoside{Jf),and penta-0-acetyl-i>-g\yceTO-i3-T>-gu\o-heptopyranoside
(S). All solutions 0.0197 M {3 and 5 in carbon tetra-
chloride; 4 in chloroform)
.
(From Ref. [17].)
N—H, C=0, C—N, etc. To a first approximation,the intensity of an absorption band characteristic
of a specific group is proportional to the amount of
that group present. Figure 5 shows part of theinfrared spectra of equimolar solutions of three
acetylated methyl glycopyranosides [17]. It maybe seen that the area under the curve increases
—
from 3, to 4, to 5 acetyl groups. The procedurecould be adapted for use as an analytical method
—
in this case, for acetyl; but any other groui^ givinga characteristic band could similarly be analyzedfor. In most cases, however, n.m.r. spectroscopyis a more convenient tool for such quantitative
analysis, provided that a specific chemical-shift
permits selected group integrations.
5.3. Determination of Structure
An example of solution of a structural probleminvolves the D-talose monobenzoate (X) obtained
[65] as a byproduct from the action of peroxy-
benzoic acid on o-galactal. There seemed a
possibility that it might be a l,2-(orthobenzoate)
(3a), and so, its spectrum was compared [68]
with that of l,2-(9-(l-methoxylethylidene)-L-
rhamnose (4). As may be seen from figure 6,
the latter has no' band at 5.77 Mm (1733 cm~^),
whereas X has a strong ester-carbonyl absorption
there. Hence, X is not an orthobenzoate buta benzoate; it was thought to be 1-0-benzoyl-
a-D-talose, but was later [69] shown to be the
jS-D anomer (3).
17
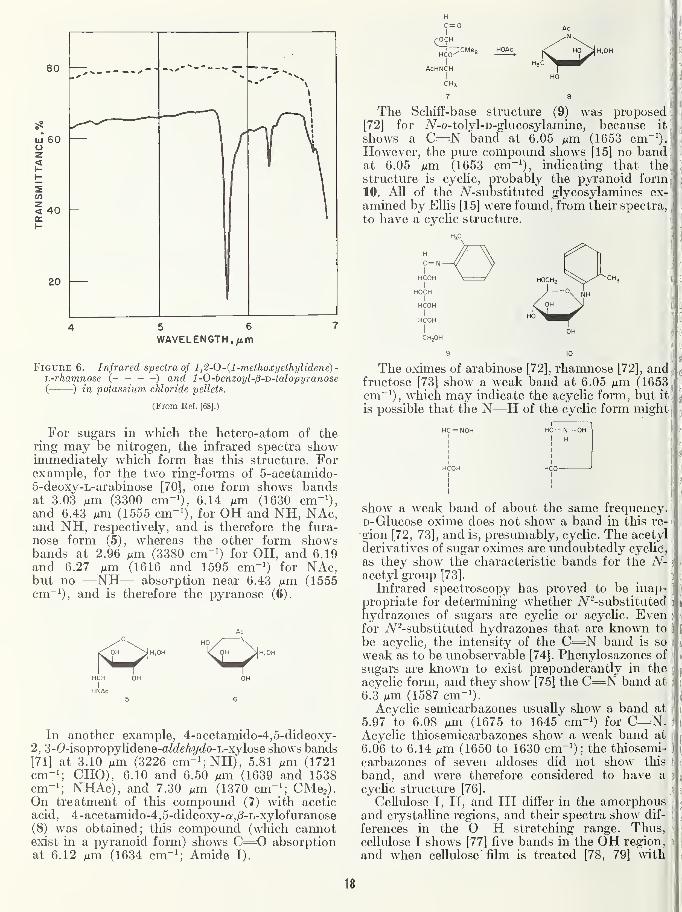
80
uj 60oz<I-
< 40q:
20
4 5 6
WAVELENGTH, /im
Figure 6. Infrared spectra of 1,2-0-il-methoxijelhylidene)-'L-rhamnose (----) and 1-0-benzoyl-p-D-talopyranose( ) in potassium chloride pellets.
(From Ref. [68].)
For sugars in which the hetero-atom of thering may be nitrogen, the infrared spectra showimmediately which form has this structure. Forexample, for the two ring-forms of 5-acetamido-5-deoxy-L-arabinose [70], one form shows bandsat 3.03 Mm (3300 cm-i), 6.14 (1630 cm-'),and 6.43 Mm (1555 cm"'), for OH and NH, NAc,and NH, respectively, and is therefore the fura-
nose form (5), whereas the other form showsbands at 2.96 Mm (3380 cm"') for OH, and 6.19
and 6.27 Mm (1616 and 1595 cm-^) for NAc,but no —NH— absorption near 6.43 Mm (1555cm"'), and is therefore the pyranose (6).
OH ^H,OH OH i^H.OH
HCH OHI
HNAc5
In another example, 4-acetamido-4,5-dideoxy-
2, 3-(9-isopropylidene-aMeA?/(Zo-L-xylose shows bands[71] at 3.10 Mm (3226 cm-';NH), 5.81 Mm (1721cm-i; CHO), 6.10 and 6.50 Mm (1639 and 1538cm-i; NHAc), and 7.30 Mm (1370 cm-^ CMca).On treatment of this compound (7) with acetic
acid, 4-acetamido-4,5-dideoxy-a,|S-L-xylofuranose
(8) was obtained; this compound (which cannotexist in a pyranoid form) shows C=0 absorptionat 6.12 Mm (1634 cm"'; Amide I).
i
The Schiff-base structure (9) was proposed[72] for A''-o-tolyl-D-glucosylamine, because it^
shows a C=N band at 6.05 Mm (1653 cm~^).|
However, the pure compound shows [15] no bandat 6.05 Mm (1653 cm"'), indicating that the
structure is cyclic, probably the pyranoid form10. All of the A^-substituted glycosylamines ex-
amined by Ellis [15] were found, from their spectra,
to have a cyclic structure.
) III
The oximes of arabinose [72], rhamnose [72], andfructose [73] show a weak band at 6.05 Mm (1653cm"^), which may indicate the acyclic form, but it
is i^ossible that the N—H of the cyclic form might
ti
HC— N— OHI H
show a Aveak band of about the same frequency.D-Glucose oxime does not show a band in this re-
gion [72, 73], and is, presumably, cyclic. The acetyl
derivatives of sugar oximes are undoubtedly cyclic,
as they show the characteristic bands for the A^-
acetyl group [73].
Infrared spectroscopy has proved to be inap-
propriate for determining whether A^^^-substituted
hydrazones of sugars are cyclic or acyclic. Evenfor A^^-substituted hydrazones that are known to
be acyclic, the intensity of the C=N band is so
weak as to be unobservable [74]. Phenylosazones of
sugars are known to exist preponderantly in the
acyclic form, and they show [75] the C=N band at
6.3 Mm (1587 cm-').Acyclic semicarbazones usually show a band at
5.97 to 6.08 Mm (1675 to 1645 cm-') for C=N.Acyclic thiosemicarbazones show a weak band at
6.06 to 6.14 Mm (1650 to 1630 cm"') ; the thiosemi-
carbazones of seven aldoses did not show this
band, and were therefore considered to have a
cyclic structure [76].
Cellulose I, II, and III differ in the amorphousand crystalline regions, and their spectra show dif-
ferences in the O—H stretching range. Thus,cellulose I shows [77] five bands in the OH region,
and when cellulose ' film is treated [78, 79] with
18
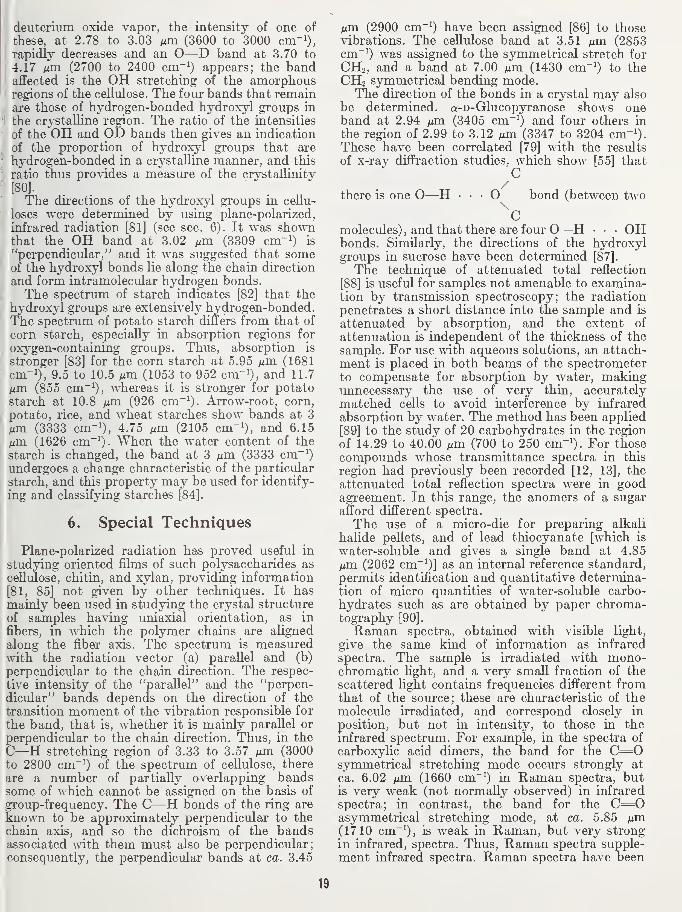
deuterium oxide vapor, the intensity of one of
these, at 2.78 to 3.03 Mm (3600 to 3000 cm-i),
rapidly decreases and an O—D band at 3.70 to
4.17 nm (2700 to 2400 cm~^) appears; the bandaffected is the OH stretching of the amorphousregions of the cellulose. The four bands that remainare those of hydrogen-bonded hydroxyl groups in
the crystalline region. The ratio of the intensities
of the OH and OD bands then gives an indication
of the proportion of hydroxyl groups that are
hydrogen-bonded in a crystalline manner, and this
ratio thus provides a measure of the crystaUinity
[80].
The directions of the hydroxyl groups in cellu-
loses were determined by using plane-polarized,
infrared radiation [81] (see sec. 6). It was shownthat the OH band at 3.02 fxm (3309 cm-^) is
"perpendicular," and it was suggested that someof the hydroxyl bonds lie along the chain direction
and form intramolecular hydrogen bonds.The spectrum of starch indicates [82] that the
hydroxyl groups are extensively hydrogen-bonded.The spectrum of potato starch differs from that of
corn starch, especially in absorption regions for
oxygen-containing groups. Thus, absorption is
stronger [83] for the corn starch at 5.95 nm (1681cm-i), 9.5 to 10.5 Atm (1053 to 952 cm-i), and 11.7
iim. (855 cm~'), whereas it is stronger for potatostarch at 10.8 fxva (926 cm~^). Arrow-root, corn,
potato, rice, and wheat starches show bands at 3
Mm (3333 cm-i), 4.75 Mm (2105 cm-^), and 6.15
Mm (1626 cm~'). When the water content of the
starch is changed, the band at 3 Mm (3333 cm~0undergoes a change characteristic of the particular
starch, and this property may be used for identify-
ing and classifying starches [84].
6. Special Techniques
Plane-polarized radiation has proved useful in
studying oriented film s of such polysaccharides as
ceUulose, chitin, and xylan, providing information
[81, 85] not given by other techniques. It hasmainly been used in studying the crystal structure
of samples having uniaxial orientation, as in
fibers, in which the polymer chains are aUgnedalong the fiber axis. The spectrum is measuredwith the radiation vector (a) parallel and (b)
perpendicular to the chain direction. The respec-
tive intensity of the "parallel" and the "perpen-dicular" bands depends on the direction of the
transition moment of the vibration responsible for
the band, that is, whether it is mainly parallel or
perpendicular to the chain direction. Thus, in the
C—H stretching region of 3.33 to 3.57 Mm (3000to 2800 cm~^) of the spectrum of ceUulose, there
are a number of partially overlapping bandssome of which cannot be assigned on the basis of
group-frequency. The C—H bonds of the ring are
known to be approximately perpendicular to the
chain axis, and so the dichroism of the bandsassociated with, them must also be perpendicular;consequently, the perpendicular bands at ca. 3.45
Mm (2900 cm~^) have been assigned [86] to thosevibrations. The cellulose band at 3.51 Mm (2853cm~^) was assigned to the symmetrical stretch for
CH2, and a band at 7.00 Mm (1430 cm"^) to theCH2 symmetrical bending mode.The direction of the bonds in a crystal may also
be determined. a-n-Glucopyranose shows oneband at 2.94 Mm (3405 cm~^) and four others in
the region of 2.99 to 3.12 Mm (3347 to 3204 cm-^).These have been correlated [79] with the results
of x-ray diffraction studies, which show [55] thatC
there is one O—H • • • O bond (between two\C
molecules), and that there are four 0—H • • OHbonds. Similarly, the directions of the hydroxylgroups in sucrose have been determined [87].
The technique of attenuated total reflection
[88] is useful for samples not amenable to examina-tion by transmission spectroscopy; the radiation
penetrates a short distance into the sample and is
attenuated by absorption, and the extent of
attenuation is independent of the thickness of the
sample. For use with aqueous solutions, an attach-
ment is placed in both beams of the spectrometerto compensate for absorption by water, makingunnecessary the use of very thin, accurately
matched cells to avoid interference by infrared
absorption by water. The method has been applied
[89] to the study of 20 carbohydrates in the region
of 14.29 to 40.00 Mm (700 to 250 cm-^). For those
compounds whose transmittance spectra in this
region had previously been recorded [12, 13], the
attenuated total reflection spectra were in goodagreement. In this range, the anomers of a sugarafford different spectra.
The use of a micro-die for preparing alkali
halide pellets, and of lead thiocyanate [which is
water-soluble and gives a single band at 4.85
Mm (2062 cm~^)] as an internal reference standard,permits identification and quantitative determina-tion of micro quantities of water-soluble carbo-hydrates such as are obtained by paper chroma-tography [90].
Raman spectra, obtained with visible light,
give the same kind of information as infrared
spectra. The sample is irradiated with mono-chromatic light, and a very smaU fraction of the
scattered light contains frequencies different fromthat of the source; these are characteristic of themolecule irradiated, and correspond closely in
position, but not in intensity, to those in theinfrared spectrum. For example, in the spectra of
carboxyHc acid duners, the band for the C=0symmetrical stretching mode occurs strongly at
ca. 6.02 Mm (1660 cm"') in Raman spectra, butis very weak (not normaUy observed) in infrared
spectra; in contrast, the band for the C=0asymmetrical stretching mode, at ca. 5.85 Mm(1710 cm"'), is weak in Raman, but very strongin infrared, spectra. Thus, Raman spectra supple-
ment infrared spectra. Raman spectra have been
19
studied for some 1,3-dioxolane compounds related
to sugar acetals [91]. Introduction of the techniqueof laser Raman spectroscopy may be expected to
lead to greater activity in this field.
7. References
[I] For extensive treatments of the theory and practiceof infrared spectroscopy, see: F. A. Miller, in
Organic Chemistry, An Advanced Treatise (H.Oilman, Ed.), Vol. 3, Chapter 2, Wiley, New York,1953; R. N. Jones and C. Sandorfy, in ChemicalApplications of Spectroscopy
;Technique of Organic
Chemistry (W. West, Ed.), Vol. 9, Chapter 4,
Interscience, New York, 1956; L. J. Bellamy, TheInfra-red Spectra of Complex Molecules, 2nd ed.,
Wiley, New York, 1958; G. K. T. Conn and D. G.Avery, Infrared Methods: Principles and Applica-tions, Academic Press, New York, 1960; K. Naka-nishi. Practical Infrared Absorption Spectroscopy,Holden-Day, San Francisco, 1962; W. Briigel, AnIntroduction to Infrared Spectroscopv (translatedfrom the German), Wiley, New Yorki^ 1962; W. J.
Potts, Jr., Chemical Infrared Spectroscopy, Wiley,New York, 1963; C. N. R. Rao, Chemical AppUca-tions of Infrared Spectroscopy, Academic Press,
New York, 1963; A. D. Cross, Introduction toPractical Infrared Spectroscopy, 2nd ed.. Butter-worth, Washington, D.C., 1964; R. G. White,Handbook of Industrial Infrared Analysis, PlenumPress, New York, 1964; N. B. Colthup, L. H. Daly,and S. E. Wiberly, Introduction to Infrared andRaman Spectroscopy, Academic Press, New York,1964; H. A. Szymanski, IR Theory and Practiceof Infrared Spectroscopy, Plenum Press, New York,1964; J. R. Dyer, Applications of AbsorptionSpectroscopy of Organic Compounds, Prentice-Hall, Englewood ChfFs, N.J., 1965.
[2] R. S. Tipson, A. S. Cerezo, V. Deulofeu, and A.Cohen, J. Research NBS 71A, 53 (1967).
[3] S. A. Barker, E. J. Bourne, and D. H. WhifJen,Methods Biochem. Anal. 3, 213 (1956).
[4] R. S. Tipson, H. S. IsbeU, and J. E. Stewart, J.
Research NBS 62, 257 (1959).[5] L. P. Kuhn, J. Am. Chem. Soc. 74, 2492 (1952) ; 76,
4323 (1954).
[6] A. R. H. Cole and P. R. Jefferies, J. Chem. Soc.1956, 4391.
[7] S. A. Barker, J. S. Brimacombe, A. B. Foster, D. H.WhifFen, and G. Zweifel, Tetrahedron 7, 10 (1959).
[8] V. C. Farmer, Spectrochim. Acta 8, 374 (1957).
[9] V. C. Farmer, Chem. Ind. (London) 1959, 1306.
[10] S. A. Barker, E. J. Bourne, H. Weigel, and D. H.Whiffen, Chem. Ind. (London) 1956, 318.
[II] S. A. Barker, E. J. Bourne, W. B. Neely, and D. H.Whiffen, Chem. Ind. (London) 1954, 1418.
[12] R. S. Tipson and H. S. IsbeU, J. Research NBS 64A,239 (1960).
[13] R. S. Tipson and H. S. IsbeU, J. Research NBS 66A,31 (1962).
[14] L. P. Kuhn, Anal. Chem. 33, 276 (1950).
[15] G. P. Ellis, J. Chem. Soc. (B) 1966, 572.
[16] American Petroleum Institute Project 44, InfraredAbsorption Spectra, Data Distribution Office,
Agricultural and Mechanical CoUege of Texas,College Station, Texas 77843 (2440 spectra);American Society for Testing and Materials, 1916Race St., Philadelphia, Pennsylvania 19103 (IBMcards; index to over 55,500 published spectra);The Documentation of Molecular Spectroscopy(DMS), Butterworth, Bethesda, Maryland 20014(almost 200 sugar derivatives); H. M. Hershenson,Infrared Absorption Spectra, Indices for 1945-1957,and 1958-1962, Academic Press, New York, 1959and 1964. National Research Council—NationalBureau of Standards Catalog of Infrared Spectra
and Bibliography, National Bureau of Standards,Washington, D.C. 20234 (punch cards), out ofprint; Ref. 2 [spectra of 23 A^'-glycosylacylamidesand 21 l,l-bis(acylamido)-l-deoxyalditols]; Ref. 4(28 cyclic acetals of sugars) ; Ref. 12 (24 aldo-pyranosides) ; Ref. 13 (6 anomeric pairs of sugarsand 12 single anomers) ; Ref. 14 (79 carbohydrates)
;
Sadtler Research Laboratories, 3316 Spring GardenSt., Philadelphia, Pennsylvania 19104 (about 200sugar derivatives); H. A. Szymanski, Infrared BandHandbook, Plenum Press, New York, Vol. 1 (1964),Supplements 1 and 2 (1964), Vol. 2 (1966), Supple-ments 3 and 4 (1966); R. L. Whistler and L. R.House, Anal Chem. 35, 1463 (1953) (35 monosac-charides); J. W. White, Jr., C. R. Eddy, J. Petty,and N. Hoban, Anal. Chem. 30, 506 (1958) (10disaccharides and their acetates)
.
[17] H. S. IsbeU, F. A. Smith, E. C. Creitz, H. L. Frush,J. D. Moyer, and J. E. Stewart, J. Research NBS59, 41 (1957); 56 sugar acetates.
[18] R. S. Tipson and H. S. IsbeU, J. Research NBS 64A,405 (1960); 24 acetylated aldopyranosides.
[19] R. S. Tipson and H. S. IsbeU, J. Research NBS65A, 31 (1961); 8 reducing pyranose acetates and11 iV-glycopyranosylacetamides.
[20] R. S. Tipson and H. S. IsbeU, J. Research NBS 65A,
'
249 (1961); 20 peracetylated pyranoses.[21] T. Urbanski, W. Hofmann, and M. Witanowski,
Bull. Acad. Polon. Sci. Ser. Chim. Geol. Geograph.7, 619 (1959). !
[22] D. H. Whiffen, Chem. Ind. (London) 1957, 129.
[23] C. D. Hurd and H. Jenkins, Carbohyd. Res. 3, 240(1966).
[24] D. Horton and J. M. J. Tronchet, Carbohyd. Res.'!
3, 315 (1966).'
[25] H. B. Henbest, G. D. Meakins, B. NichoUs, andA. A. Wagland, J. Chem. Soc. 1957, 1462.
[26] R. S. Tipson, J. Am. Chem. Soc. 74, 1354 (1952).
[27] R. D. Guthrie and H. Spedding, J. Chem. Soc.
1960, 953.
[28] R. S. Tipson and A. Cohen, Carbohyd. Res. 1, 338(1966).
[29] M. Stacev, R. H. Moore, S. A. Barker, H. Weigel,E. J. Bourne, and D. H. Whiffen, Proc. U.N.Intern. Conf. Peaceful Uses At. Energy, 2nd,Geneva, 1958, 30, 251.
[30] J. S. Brimacombe, A. B. Foster, M. Stacey, and!D. H. Whiffen, Tetrahedron 4, 351 (1958).
[31] B. Akermark, Acta Chem. Scand. 15, 985 (1961).
[32] R. S. Tipson, W. S. Layne, and A. Cohen, unpublishedresults (1962).
[33] R. Kubler, W. Liittke, and S. Weckberlin, Z. Elek-trochem. 64, 650 (1960); A. Rosenthal and M. R.S. Weir, J. Org. Chem. 38, 3025 (1963).
[34] P. Bassignana and C. Cogrossi, Tetrahedron 30,
2361 (1964).
[35] J. W. Rowen, F. H. Forziati, and R. E. Reeves, J.
Am. Chem. Soc. 73, 4484 (1951).
[36] H. Spedding, J. Chem. Soc. 1960, 3147.
[37] M. L. Wolfrom and S. Hanessian, J. Org. Chem. 37,1
1800 (1962).
[38] S. F. D. Orr, R. J. C. Harris, and B. Sylvan, Nature169, 544 (1952) ; H. J. R. Stevenson and S. Levine,
Science 116, 705 (1952); S. Levine, H. J. R.Stevenson, and P. W. Kabler, Arch. Biochem.Biophys. 45, 65 (1-953).
[39] S. F. D. Orr, Biochim. Biophys. Acta 14, 173 (1954).
[40] S. A. Barker, E. J. Bourne, R. M. Pinkard, and D. H.Whiffen, Chem. Ind. (London) 1958, 658.
[41] See also, Y. Nitta, J. Ide, A. Momose, and M.Kawada, Yakugaku Zasshi 83, 790 (1962); Chem.Abstr. 57, 14601 (1962).
[42] R. Stephens, Ph. D. Thesis, University of Birming-ham, England (1954). i
[43] R. S. Tipson, J. Org. Chem. 36, 2462 (1961).
[44] L. Hough, J. E. Priddle, R. S. Theobald, G. R.Barker, T. Douglas, and J. W. Spoors, Chem. Ind.
(London) 1960, 148.
20
1
[45] W. M. Doane, B. S. Shasha, E. I. Stout, C. R.Russell, and C. E. Rist, Abstr. Papers Am. Chem.
'l Soc. Meeting 153, 14c (1967).
il [46] F. Micheel, F. P. van de Kamp, and H. WulfF, Chem.:; Ber. 88, 2011 (1955).
I [47] S. E. Dannon and K. M. Rudall, Discussions Faraday) Soc. 9, 251 (1950).
[48] D. Horton and M. L. Wolfrom, J. Org. Chem. 27,1794 (1962).
I
[49] A. G. Llovd and K. S. Dodgson, Nature 184, 548' (1959).
"
. [50] K. Onodera, S. Hirano, and N. Kashimura, Carbohyd.! Res. 1, 208 (1965).' [51] E. Albano, D. Horton, and T. Tsuchiya, Carbohyd.i Res. 2, 349 (1966).
I[52] F. A. Carey, D. H. Ball, and L. Long, Jr., Carbohyd.
Res. 3, 205 (1966).
[53] D. Horton and H. S. Prihar, Carbohyd. Res. 4, 115(1967).
[54] P. J. Launer, Perkin-Elmer Instr. News 13 (3), 10(1962).
[55] T. R. R. McDonald and C. A. Beevers, Acta Cryst.
5, 654 (1952).
[56] S. A. Barker, E. J. Bourne, M. Stacey, and D. H.Whiffen, J. Chem. Soc. 1954, 171.
[57] S. A. Barker, E. J. Bourne, R. Stephens, and D. H.WhifiFen, J. Chem. Soc. 1954, 3468.
[58] S. A. Barker, E. J. Bourne, R. Stephens, and D. H.WhifiFen, J. Chem. Soc. 1954, 4211.
[59] S. A. Barker and R. Stephens, J. Chem. Soc. 1954,4550.
[60] L. M. J. Verstraeten, Anal. Chem. 36, 1040 (1964).See also, idem, Carbohyd. Res. 1, 481 (1966).
[61] C. J. Brown, Acta Cryst. 13, 1049 (I960).
[62] A. G. Llovd and K. S. Dodgson, Biochim. Biophys.Acta 46", 116 (1961).
[63] D. A. Rees, J. Chem. Soc. 1963, 1821.
[64] H. S. IsbeU and W. W. Pigman, J. Research NBS 18.141 (1937).
[65] W. W. Pigman and H. S. IsbeU, J. Research NBS 19.189 (1937).
[66] S. J. Angyal and V. A. Pickles, Carbohyd. Res. 4,269 (1967).
[67] F. S. Parker, Biochim. Biophvs. Acta 42, 513 (1960).
[68] H. S. Isbell, J. E. Stewart, H. L. Frush, J. D. Moyer,and F. A. Smith, J. Research NBS 57, 179 (1956).
[69] H. B. Wood, Jr., and H. G. Fletcher, Jr., J. Am.Chem. Soc. 79, 3234 (1957).
[70] J. K. N. Jones and J. C. Turner, J. Chem. Soc.1962, 4699.
[71] A. E. El-Ashmawy and D. Horton, Carbohyd. Res. 1,164 (1965). -
[72] F. Legay, Compt. Rend. 334, 1612 (1952).
[73] H. Bredereck, A. Wagner, D. Hummel, and H.Kreiselmeier, Chem. Ber. 89, 1532 (1956).
[74] J. Fabian and M. Legrand, Bull. Soc. Chim. France23, 1461 (1956); J. Fabian, M. Legrand, and P.Poirier, ibid. 23, 1499 (1956).
[75] W. Otting, Ann. 640, 44 (1961).
[76] J. R. Holker, cited in H. Spedding, Advan. Carbo-hydrate Chem. 19, 23 (1964) ; see p. 40 and footnote51 on p. 37.
[77] L. Brown, P. HoUiday, and I. F. Trotter, J. Chem.Soc. 1951, 1532.
[78] K. E. Almin, Svensk Papperstid. 55, 767 (1952).
[79] H. J. Marrinan and J. Mann, J. Appl. Chem. (Lon-don) 4, 204 (1954).
[80] J. Mann and H. J. Marrinan, Trans. Faraday Soc.
52, 481, 487, 492 (1956).
[81] J. Mann and H. J. Marrinan, J. Polymer Sci. 27, 595(1958); 32, 357 (1958); M. Tsuboi, ibid. 25, 159(1957).
[82] M. Samec, Starke 5, 105 (1953).
[83] M. Samec, J. Polymer Sci. 23, 801 (1957).
[84] O. Yovanovitch, Compt. Rend. 252, 2884 (1961).
[85] C. Y. Liang and R. H. Marchessault, J. Polymer Sci.
37, 385 (1959); 39, 269 (1959); 43,85 (1960); F. G.Pearson, R. H. Marchessault, and C. Y. Liang,ibid. 43, 101 (1960); R. H. Marchessault and C. Y.Liang, ibid. 43, 71 (1960); 59, 357 (1962); R. H.Marchessault, F. G. Pearson, and C. Y. Liang,Biochim. Biophys. Acta 45, 499 (1960).
[86] R. H. Marchessault, Pure Appl. Chem. (London) 5,
107 (1962).
[87] J. W. EUis and J. Bath, J. Chem. Phys. 6, 221 (1938).
[88] J. Fahrenfort, Spectrochim. Acta 17, 698 (1961).
[89] F. S. Parker and R. Ans, Appl. Spectry. 20, 384(1966).
[90] F. E. Resnik, L. S. Harrow, J. C. Holmes, M. E.Bill, and F. L. Greene, Anal. Chem. 29, 1874 (1957).
[91] S. A. Barker, E. J. Bourne, R. M. Pinkard, and D. H.WhifiFen, J. Chem. Soc. 1959, 802, 807.
21
U.S. GOVERNMENT PRINTING OFFICE : 1967—O-290-632

NBS TECHNICAL PUBLICATIONS
PERIODICALS
JOURNAL OF RESEARCH reports NationalBureau of Standards research and development in
physics, mathematics, chemistry, and engineering.
Comprehensive scientific papers give complete details
of the work, including laboratory data, experimentalprocedures, and theoretical and m.athematical analy-
ses. Illustrated with photographs, drawings, andcharts.
Published in three sections, available separately:
• Physics and Chemistry
Papers of interest primarily to scientists working in
these fields. This section covers a broad range of
physical and chemical research, with major emphasis
on standards of physical measurement, fundamentalconstants, and properties of matter. Issued six times
a year. Annual subscription: Domestic, 35.00; for-
eign, 36.00*.
• Mathematical Sciences
Studies and compilations designed mainly for the
mathematician and theoretical physicist. Topics in
mathematical statistics, theory of experiment design,
numerical analysis, theoretical physics and chemis-
try, logical design and programming of computers
and computer systems. Short numerical tables.
Issued quarterly. Annual subscription: Domestic,
32.25; foreign, 32.75*.
• Engineering and Instrumentation
Reporting results of interest chiefly to the engineer
and the applied scientist. This section includes manyof the new developments in instrumentation resulting
from the Bureau's work in physical measurement,
data processing, and development of test methods.
It will also cover some of the work in acoustics,
applied mechanics, building research, and cryogenic
engineering. Issued quarterly. Annual subscription:
Domestic, 32.75; foreign, 33.50*.
TECHNICAL NEWS BULLETIN
The best single source of information concerning
the Bureau's research, developmental, cooperative
and publication activities, this monthly publication
is designed for the industry-oriented individual whose
daily work involves intimate contact with science
and technology—/or engineers, chemists, physicists,
research managers, product-development managers, and
company executives. Annual subscription: Domestic,
31.50; foreign, 32.25*.
•Difference in price is due to extra cost of foreign mailing.
NONPERIODICALS
Applied Mathematics Series. Mathematicaltables, manuals, and studies.
Building Science Series. Research results, test
methods, and performance criteria of building ma-terials, components, systems, and structures.
Handbooks. Recommended codes of engineering
and industrial practice (including safety codes) de-
veloped in cooperation with interested industries,
professional organizations, and regulatory bodies.
Special Publications. Proceedings of NBS con-
ferences, bibliographies, annual reports, wall charts,
pamphlets, etc.
Monographs. Major contributions to the techni-
cal literature on various subjects related to the
Bureau's scientific and technical activities.
National Standard Reference Data Series.
NSRDS provides quantitative data on the physical
and chemical properties of materials, compiled fromthe world's literature and critically evaluated.
Product Standards. Provide requirements for
sizes, types, quality and methods for testing various
industrial products. These standards are developedcooperatively with interested Government and in-
dustry groups and provide the basis for commonunderstanding of product characteristics for both
buyers and sellers. Their use is voluntary.
Technical Notes. This series consists of com-munications and reports (covering both other agencyand NBS-sponsored work) of limited or transitory
interest.
CLEARINGHOUSE
The Clearinghouse for Federal Scientific andTechnical Information, operated by NBS, supplies
unclassified information related to Government-generated science and technology in defense, space,
atomic energy, and other national programs. For
further information on Clearinghouse services, write:
Clearinghouse
U.S. Department of CommerceSpringfield, Virginia 22151
Order NBS publications from:
Superintendent of DocumentsGovernment Printing Office
Washington, D.C. 20402
United States.
Government Printing OfficeDIVISION OF PUBLIC DOCUMENTS
Washington. D.C. 20402
U.S.
POSTAGE AND FEES PAIDGOVERNMENT PRINTING OFFICE
OFFICIAL BUSINESS


aiREYNOLDS
BINDERV, mC.