
Solutions · OUR RESULTS 2016 was a challenging year. Sales and earnings per share declined versus...
108
A World of Solutions 2016 ANNUAL REPORT
Transcript of Solutions · OUR RESULTS 2016 was a challenging year. Sales and earnings per share declined versus...

A World of
Solutions2016 ANNUAL REPORT

12 13 14 15
$265
$308
$230 $2
61 $282
1612 13 14 15
$4.3
8 $4.8
2
$5.1
8
$4.1
8
$3.8
0
1612 13 14 15
$6,5
79 $7,5
13
$7,8
90
$7,5
18
$7,3
36
16 12 13 14 15
$369
$445 $4
66
$374
$332
16
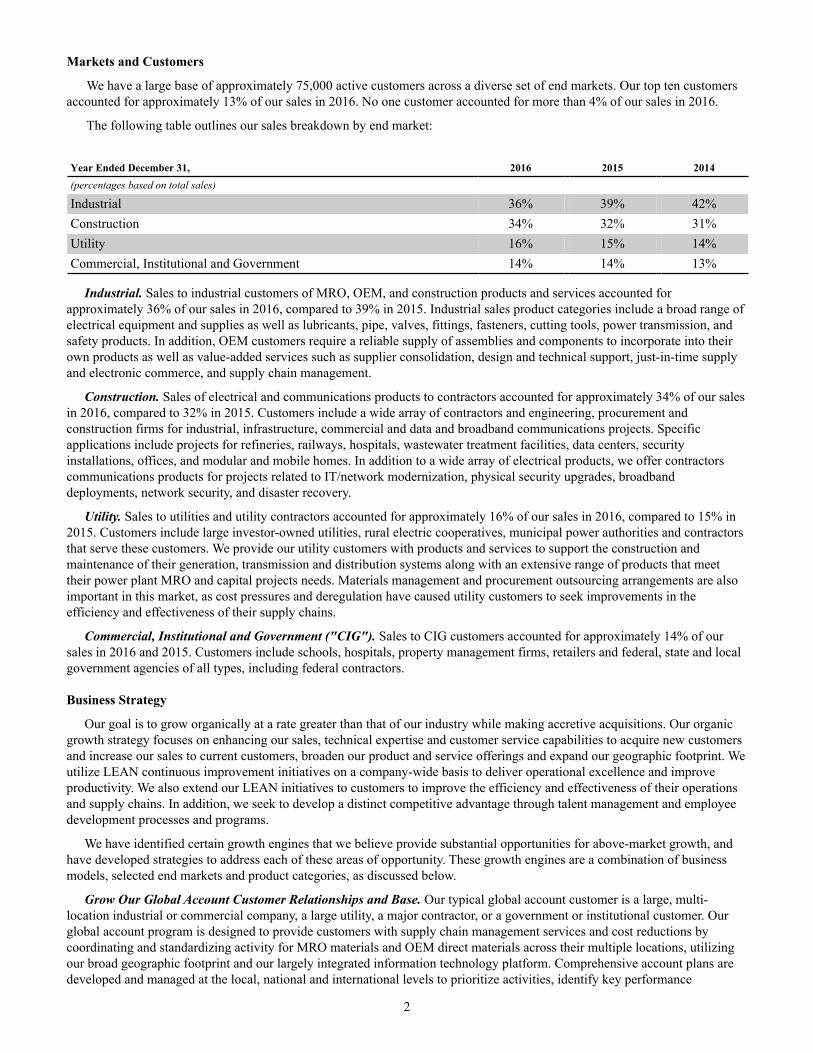
Net Sales (in millions)
Free Cash Flow1 (in millions)
Diluted EPS1 Income from Operations (EBIT)1
(in millions)
Year Ended December 31, 2012 2013 2014 2015 2016 (Dollars in millions except for diluted EPS, financial leverage ratio, and percentages)
Net sales $ 6,579 $ 7,513 $ 7,890 $ 7,518 $ 7,336Income from operations (EBIT) 1 369 445 466 374 332Net income attributable to WESCO International, Inc. 1 224 254 276 211 184Diluted EPS 1 4.38 4.82 5.18 4.18 3.80Diluted share count 51.1 52.7 53.3 50.4 48.3Free cash flow 1 265 308 230 261 282Free cash flow as a % of net income 1 118% 121% 84% 125% 154%Total debt, including debt discount and deferred financing fees 1,919 1,662 1,586 1,665 1,403Financial leverage ratio 2 4.7 3.2 3.0 3.8 3.5Stockholders’ equity 1 1,576 1,765 1,928 1,774 2,092ROIC 1 11.3% 9.9% 10.0% 7.8% 7.5%
1 Non-GAAP financial measures are defined and reconciled on pages 92 and 93. 2012 and 2013 exclude the impact of a litigation matter. 2016 excludes the loss related to the redemption of the 6.0% Convertible Senior Debentures due 2029.
2 Financial leverage ratio is calculated by dividing total debt, including debt discount and deferred financing fees, by earnings before interest, taxes, depreciation and amortization (EBITDA), excluding the impact of a litigation matter in 2012 and 2013.
Financial Highlights
Portfolio
■
■
■
United StatesCanadaRest of World
GEOGRAPHIES
77%
19%
4%8%
40%
15%14%
12%
11% PRODUCT CATEGORIES
■
■
■
■
■
■
General SuppliesCommunications & SecurityWire, Cable & ConduitLighting & SustainabilityElectrical Distribution & ControlsAutomation, Controls & Motors

You know WESCO as one of the world’s largest electrical distributors, efficiently and cost-effectively supplying one of the industry’s broadest product portfolios to approximately 75,000 customers. But we are much more than a typical distributor. We’re an industry-leading provider of supply chain solutions, bringing an extensive array of value-added services and technical capabilities to our customers every day. With our services and expertise, our customers can operate more efficiently, reduce their costs, and better plan and manage their projects.
Whether we’re helping our customers solve problems and identify opportunities, prescribing technical solutions, managing their inventory and logistics, performing kitting and product assembly, or providing turnkey supply chain outsourcing through our integrated supply model, our services and technical expertise drive the majority of our product sales. We enable customers to simplify and outsource parts of their supply chains, hold and manage less inventory, and reduce capital project management time and risks. We also help them save money, become safer and more energy-efficient, and learn about the latest technologies.
Our solutions create long-term alliances with our customers and a steady source of revenues and profits for WESCO. In 2016, for example, we achieved contract renewal rates of over 95% with our Global Accounts and Integrated Supply customers. This is proof of the value we bring and the lasting relationships it sustains. This is also the foundation of our One WESCO strategy: to expand our global customer base and relationships by integrating our portfolio of products, services, and suppliers into comprehensive supply chain solutions for our customers’ maintenance, repair, and operating (MRO) supplies, original equipment manufacturers (OEM) products, and capital project needs.
In 2017, we plan to continue expanding our service offerings and investing in technical resources and employee development. Our service capabilities are a key differentiator and competitive advantage, and we expect them to increase customer satisfaction and help drive profitable growth in the years to come.
A World of SolutionsBuilding Lasting Customer Relationships With Expansive Service Offerings
2016 Annual Report | A World of Solutions 1
OUR RESULTS
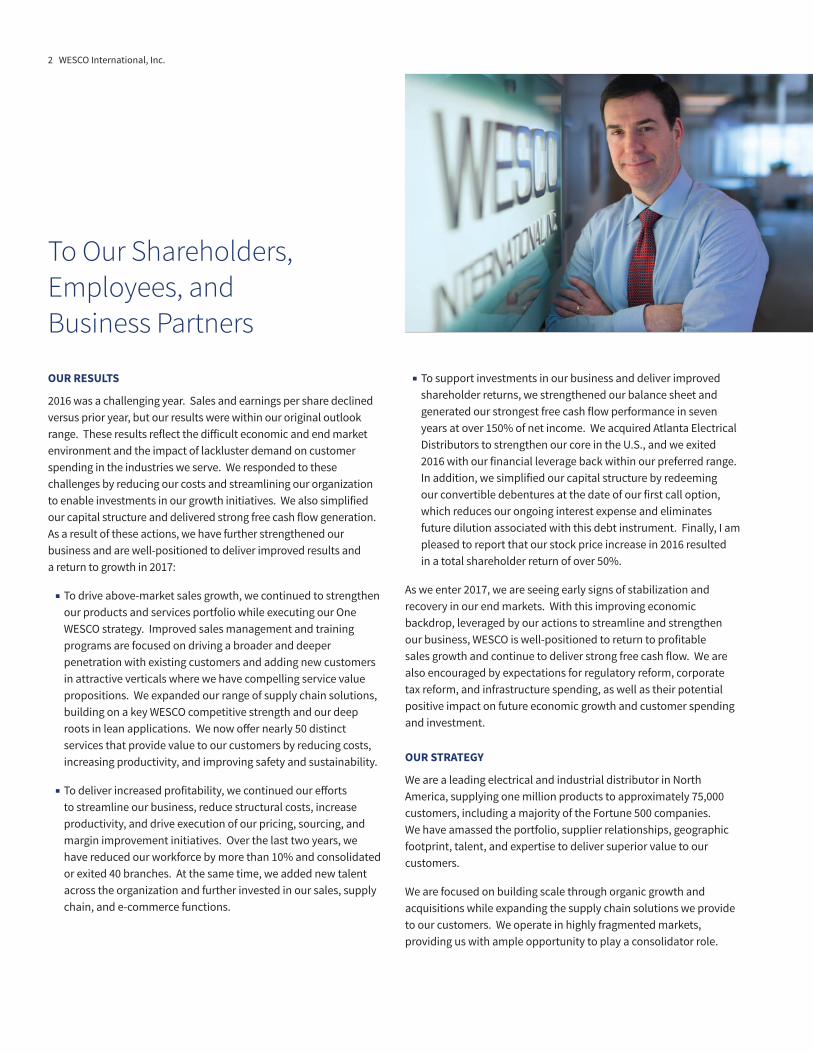
2016 was a challenging year. Sales and earnings per share declined versus prior year, but our results were within our original outlook range. These results reflect the difficult economic and end market environment and the impact of lackluster demand on customer spending in the industries we serve. We responded to these challenges by reducing our costs and streamlining our organization to enable investments in our growth initiatives. We also simplified our capital structure and delivered strong free cash flow generation. As a result of these actions, we have further strengthened our business and are well-positioned to deliver improved results and a return to growth in 2017:
To drive above-market sales growth, we continued to strengthen our products and services portfolio while executing our One WESCO strategy. Improved sales management and training programs are focused on driving a broader and deeper penetration with existing customers and adding new customers in attractive verticals where we have compelling service value propositions. We expanded our range of supply chain solutions, building on a key WESCO competitive strength and our deep roots in lean applications. We now offer nearly 50 distinct services that provide value to our customers by reducing costs, increasing productivity, and improving safety and sustainability.
To deliver increased profitability, we continued our efforts to streamline our business, reduce structural costs, increase productivity, and drive execution of our pricing, sourcing, and margin improvement initiatives. Over the last two years, we have reduced our workforce by more than 10% and consolidated or exited 40 branches. At the same time, we added new talent across the organization and further invested in our sales, supply chain, and e-commerce functions.
To support investments in our business and deliver improved shareholder returns, we strengthened our balance sheet and generated our strongest free cash flow performance in seven years at over 150% of net income. We acquired Atlanta Electrical Distributors to strengthen our core in the U.S., and we exited 2016 with our financial leverage back within our preferred range. In addition, we simplified our capital structure by redeeming our convertible debentures at the date of our first call option, which reduces our ongoing interest expense and eliminates future dilution associated with this debt instrument. Finally, I am pleased to report that our stock price increase in 2016 resulted in a total shareholder return of over 50%.
As we enter 2017, we are seeing early signs of stabilization and recovery in our end markets. With this improving economic backdrop, leveraged by our actions to streamline and strengthen our business, WESCO is well-positioned to return to profitable sales growth and continue to deliver strong free cash flow. We are also encouraged by expectations for regulatory reform, corporate tax reform, and infrastructure spending, as well as their potential positive impact on future economic growth and customer spending and investment.
OUR STRATEGY
We are a leading electrical and industrial distributor in North America, supplying one million products to approximately 75,000 customers, including a majority of the Fortune 500 companies. We have amassed the portfolio, supplier relationships, geographic footprint, talent, and expertise to deliver superior value to our customers.
We are focused on building scale through organic growth and acquisitions while expanding the supply chain solutions we provide to our customers. We operate in highly fragmented markets, providing us with ample opportunity to play a consolidator role.
To Our Shareholders, Employees, and Business Partners
2 WESCO International, Inc.

Increased scale brings stronger customer and supplier relationships and, consequently, greater profitability and the ability to invest for future growth.
Across the value chain, our customers are driving consolidation and outsourcing, while suppliers are looking for stronger channel partners to generate demand for their products. This will result in a smaller number of larger relationships on both ends of our value chain. WESCO is well-positioned to benefit from this trend.
OUR PEOPLE
At our core, we are a service company — a people business. We continue to invest in developing our workforce and have injected new talent into WESCO to run a more streamlined organization, increase the use of best-in-class processes and tools, and sharpen our focus on executing with excellence. With the addition of a new CFO, our first-ever CIO, and additional talent in our sales, supply chain, and e-commerce functions, our team is now stronger than ever.
We aspire to be the employer of choice in our industry — able to attract, develop, motivate, and retain top talent. In 2016, we continued our investments in mentoring, military veteran recruiting, and WESCO University training programs. We conducted our bi-annual Employee Engagement Survey and are addressing opportunities to make WESCO an even better place to work.
WESCO’s ranking in Fortune Magazine’s World’s Most Admired Companies again improved in 2016 to number two in our industry group. We also made positive progress on our diversity agenda as a third WESCO executive received the “Most Powerful and Influential Woman Award” from the Pennsylvania Diversity Council, and we were again recognized by the 2020 Women on Boards campaign.
OUR CULTURE
Lean continuous improvement is at the heart of WESCO’s culture and is the foundation of “how” we do business in all groups, in all functions, and in all locations. We have been on our lean journey for more than a decade and have made great progress, but we see even greater opportunities in the future to reduce waste, compress cycle times, and improve the efficiency and effectiveness of the distribution value chain.
Social and environmental responsibility is also an important part of WESCO’s culture. We met the energy-efficiency and waste reduction goals that we set for ourselves five years ago and plan to announce a new set of goals later this year. We are also helping our customers improve their operations in the areas of lighting, energy management, renewable energy, water and waste mitigation, and green procurement. Consistent with our lean principles, we will continue to measure our progress, seek improvement opportunities, and report on our performance.
OUR FUTURE
Our strong, capable, and committed management team and organization of 9,000 associates are focused on leveraging our extensive product and service portfolio, blue-chip customer and supplier relationships, and footprint to deliver superior results and create value for our shareholders. We expect to return to our legacy of consistent profitable growth as our markets improve, and we remain focused on what we can control — our strategy, our investments, and our execution.
IN APPRECIATION
Robert J. Tarr Jr. retired from the WESCO Board of Directors in May 2016 after 17 years of distinguished service. During his tenure, Bob served as the Chairman of the Audit Committee and a member of the Executive, Nominating and Governance, Audit, and Compensation committees. On behalf of the Board of Directors and the entire management team, we thank Bob for his outstanding leadership, dedication, counsel, and invaluable contributions to WESCO.
OUR COMMITMENTS
To our customers, thank you for your business. We are committed to creating value in your operations and supply chains to enable you to perform at the highest level. We plan on exceeding your expectations in 2017.
To our employees, thank you for your dedication, engagement, and extraordinary effort in providing outstanding service to our customers. You are the engine that drives WESCO and delivers our competitive advantage.
To our suppliers, thank you for your support and ongoing commitment. We are focused on combining our capabilities with yours to provide complete solutions for our customers. Together, we look forward to excelling in 2017.
To our shareholders, thank you for your continued investments and confidence. We are committed to continually strengthening our business and increasing shareholder value.
John Engel Chairman, President, and Chief Executive Officer
2016 Annual Report | A World of Solutions 3

Supply Chain SolutionsIn today’s challenging marketplace, companies are looking for ways to simplify their supply chains and reduce their costs. We work with our customers to understand their needs, and we design and implement customized solutions that meet their specific requirements. We offer customized sourcing, procurement, demand and inventory management, warehousing, and logistics solutions that remove waste, improve efficiencies, and provide tangible savings. In 2016, the number of plants outsourcing their MRO management and supply function to WESCO’s Integrated Supply business increased by 5%. We recently added a suite of WESCO e-commerce solutions, including next-generation inventory management and vending solutions, to deliver value to our customers.
WESCO IN ACTION
A customer’s factory lacked an efficient inventory control and tool tracking process to manage over 6,500 items in multiple equipment cribs. This led to excessive spending and production downtime across the factory. Management selected WESCO’s e-Crib solution for this and other factories, enabling them to quickly locate parts, track their usage, and better control expensive tooling. As a result, downtime and labor-related tool requests were reduced by up to 98%, resulting in significant efficiency gains. Additionally, more than a third of the 6,500 items were identified as surplus.
4 WESCO International, Inc.

Capital Project SolutionsWESCO has decades of experience providing electrical and instrumentation material and material management solutions for the non-residential construction, global energy, mining and materials, power, and infrastructure markets. We understand the importance of cost and schedule to our customers’ major projects.
With skilled labor at a premium, avoiding downtime and increasing productivity are always on the minds of our contractor customers. WESCO’s Lean Construction Processes provide solutions to help customers complete capital projects on time and within budget. We work with them to map out project activities, and we deliver exactly what will be needed on the jobsite each day. We also offer custom solutions, like cable management, kitting, pre-fabrication, and assembly, saving thousands of hours of on-site installation time for our contractor partners and enabling costly skilled labor to focus on more technical tasks.
WESCO’s materials management services provide significant savings by leveraging project spend, enabling global sourcing, reducing surplus material, and increasing craft productivity. WESCO’s proprietary material management software, called RPM, is a robust, centralized, web-based system that provides complete project visibility and transparency. We order, receive, organize, stage, store, and deliver materials to jobsites in support of the project schedule. We stock customized carts with the materials the electrician will need for each day’s work. Major materials are staged and stored at WESCO’s branches and distribution centers until they are needed at the jobsite.
WESCO IN ACTION
A major integrated oil company engaged WESCO to provide complete material management for a $750 million plant expansion. The project involves an EPC firm, a general contractor, and two electrical and instrumentation subcontractors. WESCO is providing complete material management services, including material take-offs, sourcing, local warehousing, kitting, and cable management, along with on-site trailers and personnel.
2016 Annual Report | A World of Solutions 5

Customized Product SolutionsHundreds of customers rely on WESCO to assemble electrical, wiring, and other components into kits, sub-assemblies, and products. This simplifies our customers’ operations and enables them to focus on their core capabilities. WESCO is a leading provider of electrical-based OEM products, leveraging our lean service models and blue-chip global supplier base. Our products and services enable our customers to reduce their costs and inventory levels, while simplifying and increasing the flexibility of their supply chains. In short, we help them to better compete in a global manufacturing world.
Our sales professionals work face-to-face with our customers to create customized solutions and build business advisory relationships on a foundation of credibility, respect, and trust. We create automation control systems that offer flexibility for meeting our customers’ unique requirements and incorporate products from preferred suppliers. Our customers benefit from leveraging WESCO’s cost structure and find value in using us to both assemble and distribute their products.
WESCO IN ACTION
An offshore crane manufacturer needed a source to develop and assemble electrical control boxes and kits to allow for quick assembly in the field. WESCO worked with the customer’s 50-year-old prints and was able to update those to enable an aftermarket upgrade solution. WESCO has the in-house capabilities to provide a complete design, build, and delivery solution.
6 WESCO International, Inc.

Technical Expert SolutionsFor many of our customers, WESCO is an extension of their engineering and manufacturing capabilities. We have technical experts in each of our major product categories who advise customers on the latest products and technologies and help them select the right solutions for their specific need.
Every day, our sales and technical experts help our customers identify opportunities and define, purchase, and implement the right solutions to make their operations or projects more cost-effective, efficient, and reliable. In 2015, we acquired Aelux and Lumigent to design energy-efficient lighting and controls retrofits for our commercial, industrial, and institutional customers across North America. We team up with our suppliers to bring the best-available new products and alternatives to our customers. We also offer a variety of training to keep our customers up-to-date on new concepts, new products, and new technologies.
WESCO’s Global Accounts team leverages our global footprint, key relationships with multi-national manufacturers, and best-cost regional sourcing to support our customers’ locations around the world. We offer a comprehensive set of supply chain solutions, including local inventory, staging of long lead items, ocean and air freight, customs clearance, and export/import compliance. Our integrated operating model allows WESCO to seamlessly implement agreements across multiple countries and provide customers with the opportunity to leverage their global spend, normalize key commercial terms, and drive product standardization.
WESCO IN ACTION
WESCO won a five-year Global Account contract to perform a national lighting upgrade and supply MRO materials for over 10 million square feet of customer space. We are providing a complete material supply program using third-party service partners and installers, and are utilizing advanced WESCO lighting and energy management capabilities. This multi-category win was made possible by our One WESCO strategy and our extensive product and service expertise.
2016 Annual Report | A World of Solutions 7

Approximately 500 locations around the worldGlobal Solutions
CANADA
U.S.A.
MEXICO
ECUADOR
PERU
CHILE
IRELAND
ANGOLA
SPAIN
ENGLAND
SCOTLAND
POLAND
UAE
BELGIUM
CHINA
SINGAPORE
THAILAND
WESCO IN ACTION
WESCO is providing data communications, security, and electrical material to a leading global technology company in 11 countries. We utilize an in-country and regional support structure that meets the customer’s need for rapid deployment, scalability, global sourcing, multi-currency transactions, and local inventory. This structure also provides standardized customer service support in the Americas, EMEA, and Asia-Pacific.
Corporate Profile / WESCO International, Inc. (NYSE: WCC), a publicly traded Fortune 500 holding company headquartered in Pittsburgh, Pennsylvania, is a leading provider of electrical, industrial, and communications maintenance, repair and operating (MRO) and original equipment manufacturers (OEM) products, construction materials, and advanced supply chain management and logistic services. 2016 annual sales were approximately $7.3 billion. The company employs approximately 9,000 people, maintains relationships with over 25,000 suppliers, and serves approximately 75,000 active customers worldwide. Customers include commercial and industrial businesses, contractors, government agencies, institutions, telecommunications providers, and utilities. WESCO operates nine fully automated distribution centers and approximately 500 full-service branches in North America and international markets, providing a local presence for customers and a global network to serve multi-location businesses and multi-national corporations.
8 WESCO International, Inc.

UNITED STATES SECURITIES AND EXCHANGE COMMISSIONWASHINGTON, D.C. 20549
FORM 10-K(Mark One)
ANNUAL REPORT PURSUANT TO SECTION 13 OR 15(d) OF THE SECURITIES EXCHANGE ACT OF1934For the fiscal year ended December 31, 2016
or
TRANSITION REPORT PURSUANT TO SECTION 13 OR 15(d) OF THE SECURITIES EXCHANGEACT OF 1934For the transition period from to
Commission file number 001-14989
WESCO International, Inc.(Exact name of registrant as specified in its charter)
Delaware(State or other jurisdiction ofincorporation or organization)
25-1723342(I.R.S. Employer
Identification No.)
225 West Station Square DriveSuite 700
Pittsburgh, Pennsylvania(Address of principal executive offices)
15219(Zip Code)
(412) 454-2200(Registrant’s telephone number, including area code)
SECURITIES REGISTERED PURSUANT TO SECTION 12(b) OF THE ACT:
Title of Class Name of Exchange on which registeredCommon Stock, par value $.01 per share New York Stock Exchange
SECURITIES REGISTERED PURSUANT TO SECTION 12(g) OF THE ACT: NoneIndicate by check mark if the registrant is a well-known seasoned issuer, as defined in Rule 405 of the Securities Act. Yes No Indicate by check mark if the registrant is not required to file reports pursuant to Section 13 or 15(d) of the Act. Yes No Indicate by check mark whether the registrant (1) has filed all reports required to be filed by Section 13 or 15(d) of the Securities Exchange
Act of 1934 during the preceding 12 months (or for such shorter period that the registrant was required to file such reports), and (2) has been subject to such filing requirements for at least the past 90 days. Yes No
Indicate by check mark if disclosure of delinquent filers pursuant to Item 405 of Regulation S-K is not contained herein, and will not be contained, to the best of registrant’s knowledge, in definitive proxy or information statements incorporated by reference in Part III of this Form 10-K or any amendment to this Form 10-K.
Indicate by check mark whether the registrant has submitted electronically and posted on its corporate Web site, if any, every Interactive Data File required to be submitted and posted pursuant to Rule 405 of Regulation S-T during the preceding 12 months (or for such shorter period that the registrant was required to submit and post such file). Yes No
Indicate by check mark whether the registrant is a large accelerated filer, an accelerated filer, a non-accelerated filer, or a smaller reporting company. See the definitions of “large accelerated filer,” “accelerated filer,” and “smaller reporting company” in Rule 12b-2 of the Exchange Act. (Check one):
Large accelerated filer Accelerated filer Non-accelerated filer Smaller reporting company (Do not check if a smaller reporting company)
Indicate by check mark whether the registrant is a shell company (as defined in Rule 12b-2 of the Act). Yes No The registrant estimates that the aggregate market value of the voting shares held by non-affiliates of the registrant was approximately
$2,166.6 million as of June 30, 2016, the last business day of the registrant’s most recently completed second fiscal quarter, based on the closing price on the New York Stock Exchange for such stock.
As of February 21, 2017, 48,720,648 shares of Common Stock, par value $.01 per share, of the registrant were outstanding.DOCUMENTS INCORPORATED BY REFERENCE:
Part III of this Form 10-K incorporates by reference portions of the registrant’s Proxy Statement for its 2017 Annual Meeting of Stockholders.

TABLE OF CONTENTS
Page
PART I Item 1. BusinessItem 1A. Risk FactorsItem 1B. Unresolved Staff CommentsItem 2. PropertiesItem 3. Legal ProceedingsItem 4. Mine Safety Disclosures
PART II Item 5. Market for Registrant’s Common Equity, Related Stockholder Matters and Issuer Purchases of Equity
SecuritiesItem 6. Selected Financial DataItem 7. Management’s Discussion and Analysis of Financial Condition and Results of OperationsItem 7A. Quantitative and Qualitative Disclosures About Market RisksItem 8. Financial Statements and Supplementary DataItem 9. Changes in and Disagreements with Accountants on Accounting and Financial DisclosureItem 9A. Controls and ProceduresItem 9B. Other Information
PART III Item 10. Directors, Executive Officers and Corporate GovernanceItem 11. Executive CompensationItem 12. Security Ownership of Certain Beneficial Owners and Management and Related Stockholder MattersItem 13. Certain Relationships and Related Transactions, and Director IndependenceItem 14. Principal Accountant Fees and Services
PART IV Item 15. Exhibits and Financial Statement SchedulesItem 16. Form 10-K SummarySignatures EX-21.1 EX-23.1 EX-31.1 EX-31.2 EX-32.1 EX-32.2
1913131414
1517183233737373
7474747474
757981

1
PART I
Item 1. Business.
In this Annual Report on Form 10-K, “WESCO” refers to WESCO International, Inc., and its subsidiaries and its predecessors unless the context otherwise requires. References to “we,” “us,” “our” and the “Company” refer to WESCO and its subsidiaries.
The Company
WESCO International, Inc. (“WESCO International”), incorporated in 1993 and effectively formed in February 1994 upon acquiring a distribution business from Westinghouse Electric Corporation, is a leading North American-based distributor of products and provider of advanced supply chain management and logistics services used primarily in industrial, construction, utility, and commercial, institutional and government (“CIG”) markets. We are a leading provider of electrical, industrial, and communications maintenance, repair and operating (“MRO”) and original equipment manufacturers (“OEM”) products, construction materials, and advanced supply chain management and logistics services. Our primary product categories include general supplies, wire, cable and conduit, communications and security, electrical distribution and controls, lighting and sustainability, and automation, controls and motors.
We serve approximately 75,000 active customers globally through approximately 500 full service branches primarily located in North America, with operations in 14 additional countries and nine distribution centers located in the United States and Canada. The Company employs approximately 9,000 employees worldwide. We distribute over 1,000,000 products, grouped into six categories, from more than 25,000 suppliers, utilizing a highly automated, proprietary electronic procurement and inventory replenishment system.
In addition, we offer a comprehensive portfolio of value-added capabilities, which includes supply chain management, logistics and transportation, procurement, warehousing and inventory management, as well as kitting, limited assembly of products and system installation. Our value-added capabilities, extensive geographic reach, experienced workforce and broad product and supply chain solutions have enabled us to grow our business and establish a leading position in North America.
Industry Overview
We operate in highly fragmented markets that include thousands of small regional and locally based, privately owned competitors. According to one industry publication, in 2015, the latest year for which market data is available, the five largest full-line electrical distributors in North America, including WESCO, accounted for approximately 33% of an estimated $100 billion-plus of electrical sales in North America. Our global account, integrated supply and OEM programs provide customers with regional, national, North American and global supply chain consolidation opportunities. The demand for these programs is driven primarily by the desire of companies to reduce operating expenses by outsourcing operational and administrative functions associated with the procurement, management and utilization of MRO supplies and OEM components. We believe that opportunities exist for expansion of these programs. The total potential in the United States for purchases of MRO and OEM supplies and services across all industrial distribution market segments and channels is estimated to be nearly $500 billion per a combination of industry sources.
According to various industry sources, electrical distribution industry sales have grown low-single-digits on average over the past three years, despite a low-single-digit decline in 2016. Growth in recent years has been driven by new products, technologies and applications. It is estimated that approximately 75% of electrical products sold in the United States are delivered to the end user through the distribution channel.
2
Markets and Customers
We have a large base of approximately 75,000 active customers across a diverse set of end markets. Our top ten customers accounted for approximately 13% of our sales in 2016. No one customer accounted for more than 4% of our sales in 2016.
The following table outlines our sales breakdown by end market:
Year Ended December 31, 2016 2015 2014(percentages based on total sales)
Industrial 36% 39% 42%Construction 34% 32% 31%Utility 16% 15% 14%Commercial, Institutional and Government 14% 14% 13%
Industrial. Sales to industrial customers of MRO, OEM, and construction products and services accounted for approximately 36% of our sales in 2016, compared to 39% in 2015. Industrial sales product categories include a broad range of electrical equipment and supplies as well as lubricants, pipe, valves, fittings, fasteners, cutting tools, power transmission, and safety products. In addition, OEM customers require a reliable supply of assemblies and components to incorporate into their own products as well as value-added services such as supplier consolidation, design and technical support, just-in-time supply and electronic commerce, and supply chain management.
Construction. Sales of electrical and communications products to contractors accounted for approximately 34% of our sales in 2016, compared to 32% in 2015. Customers include a wide array of contractors and engineering, procurement and construction firms for industrial, infrastructure, commercial and data and broadband communications projects. Specific applications include projects for refineries, railways, hospitals, wastewater treatment facilities, data centers, security installations, offices, and modular and mobile homes. In addition to a wide array of electrical products, we offer contractors communications products for projects related to IT/network modernization, physical security upgrades, broadband deployments, network security, and disaster recovery.
Utility. Sales to utilities and utility contractors accounted for approximately 16% of our sales in 2016, compared to 15% in 2015. Customers include large investor-owned utilities, rural electric cooperatives, municipal power authorities and contractors that serve these customers. We provide our utility customers with products and services to support the construction and maintenance of their generation, transmission and distribution systems along with an extensive range of products that meet their power plant MRO and capital projects needs. Materials management and procurement outsourcing arrangements are also important in this market, as cost pressures and deregulation have caused utility customers to seek improvements in the efficiency and effectiveness of their supply chains.
Commercial, Institutional and Government ("CIG"). Sales to CIG customers accounted for approximately 14% of our sales in 2016 and 2015. Customers include schools, hospitals, property management firms, retailers and federal, state and local government agencies of all types, including federal contractors.
Business Strategy
Our goal is to grow organically at a rate greater than that of our industry while making accretive acquisitions. Our organic growth strategy focuses on enhancing our sales, technical expertise and customer service capabilities to acquire new customers and increase our sales to current customers, broaden our product and service offerings and expand our geographic footprint. We utilize LEAN continuous improvement initiatives on a company-wide basis to deliver operational excellence and improve productivity. We also extend our LEAN initiatives to customers to improve the efficiency and effectiveness of their operations and supply chains. In addition, we seek to develop a distinct competitive advantage through talent management and employee development processes and programs.
We have identified certain growth engines that we believe provide substantial opportunities for above-market growth, and have developed strategies to address each of these areas of opportunity. These growth engines are a combination of business models, selected end markets and product categories, as discussed below.
Grow Our Global Account Customer Relationships and Base. Our typical global account customer is a large, multi-location industrial or commercial company, a large utility, a major contractor, or a government or institutional customer. Our global account program is designed to provide customers with supply chain management services and cost reductions by coordinating and standardizing activity for MRO materials and OEM direct materials across their multiple locations, utilizing our broad geographic footprint and our largely integrated information technology platform. Comprehensive account plans are developed and managed at the local, national and international levels to prioritize activities, identify key performance

3
measures, and track progress against objectives. We involve our preferred suppliers early in the implementation process to contribute expertise and product knowledge to accelerate program implementation and delivery of cost savings and process improvements.
We plan to continue to expand our product and service offerings to existing global account customers, and increase our reach to serve additional customer locations. We plan on expanding our customer base by capitalizing on our industry expertise and supply chain optimization capabilities.
Extend Our Position in Integrated Supply Programs. Our integrated supply programs focus on optimizing the supply chain and replacing the traditional multi-vendor, resource-intensive procurement process with a single, outsourced, automated process. Each integrated supply program employs our product and distribution expertise to reduce the number of suppliers, total procurement costs, and administrative expenses, while meeting the customers’ service needs and improving their operating controls. We believe that large customers will seek to utilize such services to consolidate and simplify their MRO and OEM supply chains.
We are expanding our position in North America as an integrated supply service provider by building upon established relationships within our large customer base and premier supplier network, and extending our services to additional customers and locations around the world. Our services are offered across all four of our end markets.
Expand Our Relationships with Construction Contractors. We support new construction, renovation and retrofit projects across a wide variety of vertical markets, including manufacturing, healthcare, education, enterprise data communications, telecommunications, energy and government infrastructure. We believe that significant cross selling opportunities exist for our electrical and communications products and expertise, and we plan to use our global account and integrated supply programs, LEAN initiatives and project management expertise to capitalize on new non-residential construction opportunities.
Expand Products and Services for Utilities. Our investor-owned, public power and utility contractor customers continue to focus on improving grid reliability and operating efficiency, while reducing costs. As a result, we anticipate opportunities from distribution grid improvement and transmission expansion projects as well as the adoption of integrated supply programs. Accordingly, we are focused on expanding our logistical and project services and supply chain management programs to increase our scope of supply on distribution grid, generation and other energy projects, including alternative energy projects.
Invest in Industrial MRO and Safety. Our sales of industrial maintenance, repair, and operating supply (MRO) materials include a broad range of electrical and non-electrical products used in the ongoing maintenance and repair of equipment used in production processes. These products are also used for facility upkeep in manufacturing, commercial, institutional, and other operations. In addition, through acquisitions, we have expanded our safety products, personal protection safety equipment, first aid supplies, and OSHA compliance categories to complement the industrial MRO product lines.
Expand International Operations. We seek to capitalize on existing and emerging international market opportunities through the expansion of our global product and service platforms. We follow large existing global customers into international markets, extending our procurement outsourcing, integrated supply programs and supplier relationships. Once established, we also seek to develop new business opportunities in these markets. We believe this strategy of working with well-developed customer and supplier relationships significantly reduces risk and provides the opportunity to establish profitable business. Our priorities are focused on global vertical markets including energy, mining and metals, manufacturing, and infrastructure, as well as key product categories such as communications and security.
Grow Our Communications Products Position. Over the last several years, there has been a convergence of electrical and data communications contractors. Our ability to provide both electrical and communications products and services lines as well as automation, electromechanical, non-electrical MRO, physical security and utility products has presented cross selling opportunities across WESCO. Communications products are in continual demand due to network upgrades, low voltage security investments, data center upgrades and increasing broadband and telecommunications usage.
Grow Lighting System and Sustainability Sales. Lighting applications are undergoing significant innovation, driven by energy efficiency and sustainability trends. We have expanded our sales team and marketing initiatives and increased our presence and customer base with the acquisition of Needham Electric Supply. We expect to continue to add product and service offerings to provide lighting and energy-saving solutions.
Pursue Strategic Acquisitions. In 2016, we acquired Atlanta Electrical Distributors, LLC, which expanded our construction end market presence in the growing Southeastern United States. Since 2010, we have made fourteen acquisitions that have helped us strengthen our product and services portfolio and increase our customer base, as well as provide an important source of talent.
We believe that the highly fragmented nature of the electrical and industrial distribution industry will continue to provide acquisition opportunities.

4
Drive Operational Excellence. LEAN continuous improvement is a set of company-wide strategic initiatives to increase efficiency and effectiveness across the entire business enterprise, including sales, operations and administrative processes. The basic principles behind LEAN are to systematically identify and implement improvements through simplification, elimination of waste and reduction in errors. We apply LEAN in our distribution environment, and develop and deploy numerous initiatives through the Kaizen approach targeting improvements in sales, margin, warehouse operations, transportation, purchasing, working capital management and administrative processes. Our objective is to continue to implement LEAN initiatives across our business enterprise and to extend LEAN services to our customers and suppliers.
Talent Management. We seek to develop a distinct competitive advantage through talent management and employee engagement and development. We believe our ability to attract, develop and retain diverse human capital is imperative to ongoing business success. We improve workforce capability through various programs and processes that identify, recruit, develop and promote our talent base. Significant enhancements in these programs have been made over the last several years, and we expect to continue to refine and enhance these programs in the future.
Products and Services
Products
Our network of branches and distribution centers stock approximately 230,000 unique product stock keeping units and we provide customers with access to more than 1,000,000 different products. Each branch tailors its inventory to meet the needs of its local customers.
Representative product categories and associated product lines that we offer include:
• General Supplies. Wiring devices, fuses, terminals, connectors, boxes, enclosures, fittings, lugs, terminations, wrap, splicing and marking equipment, tools and testers, safety, personal protection, sealants, cutting tools, adhesives, consumables, fasteners, janitorial and other MRO supplies;
• Wire, Cable and Conduit. Wire, cable, raceway, metallic and non-metallic conduit;
• Communications and Security. Structured cabling systems, broadband products, low voltage specialty systems, specialty wire and cable products, equipment racks and cabinets, access control, alarms, cameras, paging and voice solutions;
• Electrical Distribution and Controls. Circuit breakers, transformers, switchboards, panel boards, metering products and busway products;
• Lighting and Sustainability. Lamps, fixtures, ballasts and lighting control products, and
• Automation, Controls and Motors. Motor control devices, drives, surge and power protection, relays, timers, pushbuttons, operator interfaces, switches, sensors, and interconnects.
The following table sets forth sales information by product category:
Year Ended December 31, 2016 2015 2014(percentages based on total sales)
General Supplies 40% 40% 40%Wire, Cable and Conduit 14% 15% 16%Communications and Security 15% 15% 14%Electrical Distribution and Controls 11% 11% 11%Lighting and Sustainability 12% 10% 10%Automation, Controls and Motors 8% 9% 9%
We purchase products from a diverse group of more than 25,000 suppliers. In 2016, our ten largest suppliers accounted for approximately 32% of our purchases. Our largest supplier in 2016 was Eaton Corporation, accounting for approximately 11% of our purchases. No other supplier accounted for more than 5% of our total purchases.
Our supplier relationships are important to us, providing access to a wide range of products, technical training, and sales and marketing support. We have approximately 300 preferred supplier arrangements with more than 200 firms and purchase nearly 60% of our products pursuant to these arrangements. Consistent with industry practice, most of our agreements with suppliers, including both distribution agreements and preferred supplier agreements, are terminable by either party on 60 days notice or less.

5
Services
As part of our overall offering, we provide customers a comprehensive portfolio of value-added solutions within a wide range of service categories including construction, e-commerce, energy and sustainability, engineering services, production support, safety and security, supply chain optimization, training, and working capital. These solutions are designed to address our customers' business needs through:
• Technical support for operational and transactional process improvements;
• Inventory optimization programs, including just-in-time delivery and vendor managed inventory;
• Collaborative, cross-functional, cost savings teams;
• Dedicated on-site support personnel;
• Consultation on energy-efficient product upgrades, and
• Safety and product training for customer employees.
Competitive Strengths
As a leading electrical distributor in a highly fragmented North American market, we compete directly with global, national, regional and local distributors of electrical and other industrial supplies, along with buying groups formed by smaller distributors. Competition is generally based on product line breadth, product availability, service capabilities and price. We believe that our market leadership, broad product offering and value-added services, extensive distribution network and low-cost operator status provide distinct competitive advantages.
Market Leadership. Our ability to manage complex global supply chains, and multi-site facility maintenance programs and construction projects, which require special sourcing, technical advice, logistical support and locally based service, has enabled us to establish a strong presence in the competitive and fragmented North American electrical distribution market.
Broad Product Offering and Value-added Services. We provide a wide range of products, services and procurement solutions, which draw on our product knowledge, supply and logistics expertise, system capabilities and supplier relationships to enable our customers to maximize productivity, minimize waste, improve efficiencies, reduce costs and enhance safety. Our broad product offering and stable source of supply enables us to consistently meet customers’ wide-ranging capital project, MRO and OEM requirements.
Extensive Distribution Network. We operate approximately 500 geographically dispersed branch locations and nine distribution centers (five in the United States and four in Canada). Our distribution centers add value for our customers, suppliers, and branches through the combination of a broad and deep selection of inventory, online ordering and next-day shipment capabilities, and central order handling and fulfillment. Our distribution center network reduces the lead time and cost of supply chain activities through its automated replenishment and warehouse management system, and provides economies of scale in purchasing, inventory management, administration and transportation. This extensive network, which would be difficult and expensive to replicate, allows us to:
• Enhance localized customer service, technical support and sales coverage;
• Tailor individual branch products and services to local customer needs, and
• Offer multi-site distribution capabilities to large customers and global accounts.
Low-Cost Operator. Our competitiveness has been enhanced by our consistent favorable operating cost position, which is based on the use of LEAN, strategically-located distribution centers, and purchasing economies of scale. As a result of these and other factors, our operating cost as a percentage of sales is one of the lowest in our industry. Our selling, general and administrative expenses as a percentage of revenues for 2016 were 14.3%.

6
Geography
Our network of branches and distribution centers are located primarily in North America. We attribute revenues from external customers to individual countries on the basis of the point of sale. The following table sets forth information about us by geographic area:
Net SalesYear Ended December 31,
Long-Lived AssetsDecember 31,
2016 2015 2014 2016 2015 2014(In thousands)
United States $ 5,635,803 77% $ 5,665,962 75% $ 5,618,240 71% $ 123,465 $ 157,570 $ 127,670Canada 1,394,657 19% 1,533,705 21% 1,899,173 24% 60,372 63,088 80,080Mexico 62,430 1% 70,048 1% 95,585 1% 227 332 442
Subtotal North AmericanOperations 7,092,890 7,269,715 7,612,998 184,064 220,990 208,192
Other International 243,127 3% 248,772 3% 276,628 4% 4,583 5,369 8,213Total $ 7,336,017 $ 7,518,487 $ 7,889,626 $ 188,647 $ 226,359 $ 216,405
United States. To serve our customers in the United States, we operate a network of approximately 350 branches supported by five distribution centers located in Arkansas, Mississippi, Nevada, Pennsylvania and Wisconsin. Sales in the United States represented approximately 77% of our total sales in 2016. According to an industry source, the U.S. electrical wholesale distribution industry had estimated sales of nearly $100 billion in 2016.
Canada. To serve our Canadian customers, we operate a network of approximately 130 branches in nine provinces. Branch operations are supported by four distribution centers located in Alberta, British Columbia, Ontario and Quebec. Sales in Canada represented approximately 19% of our total sales in 2016. Total annual electrical industry sales in Canada were more than $7 billion in 2016, according to an industry source.
Mexico. We have seven branch locations in Mexico. Our headquarters in Tlalnepantla Estado de Mexico operates similar to a distribution center to enhance the service capabilities of the local branches. Sales in Mexico represented approximately 1% of our total sales in 2016.
Other International. We sell to global customers through export sales offices located in Calgary, Houston, Miami, Montreal and Pittsburgh within North America and sales offices and branch operations in various international locations. Sales from other international locations represented approximately 3% of our total sales in 2016. Our branches in Aberdeen, Scotland, Dublin, Ireland and Manchester, England support sales efforts in Europe and the Middle East. We have branches in Singapore and Thailand to support our sales to Asia and a branch near Shanghai to serve customers in China. Furthermore, we support sales in South America through our branches in Chile, Ecuador and Peru, and we have operations in five additional countries. Many of our international locations have been established to serve our growing list of customers with global operations.
Intellectual Property
We currently have trademarks, patents and service marks registered with the U.S. Patent and Trademark Office and Canadian Intellectual Property Office. The trademarks and service marks registered in the U.S. include: “WESCO®”, our corporate logo and the running man logo. The Company's "EECOL" trademark is registered in Canada. In addition, trademarks, patents, and service mark applications have been filed in various foreign jurisdictions, including Canada, Chile, China, the European Community, Hong Kong, Mexico, Singapore, Thailand and the United Kingdom.
Environmental Matters
Our facilities and operations are subject to federal, state and local laws and regulations relating to environmental protection and human health and safety. Some of these laws and regulations may impose strict, joint and several liabilities on certain persons for the cost of investigation or remediation of contaminated properties. These persons may include former, current or future owners or operators of properties and persons who arranged for the disposal of hazardous substances. Our owned and leased real property may give rise to such investigation, remediation and monitoring liabilities under environmental laws. In addition, anyone disposing of certain products we distribute, such as ballasts, fluorescent lighting and batteries, must comply with environmental laws that regulate certain materials in these products.
We believe that we are in compliance, in all material respects, with applicable environmental laws. As a result, we do not anticipate making significant capital expenditures for environmental control matters either in the current year or in the near future.

7
Seasonality
Sales during the first quarter are affected by a reduced level of activity. Sales during the second, third and fourth quarters are generally 5 - 7% higher than the first quarter. Sales typically increase beginning in March, with slight fluctuations per month through October. During periods of economic expansion or contraction our sales by quarter have varied significantly from this seasonal pattern.
Website Access
Our Internet address is www.wesco.com. Information contained on our website is not part of, and should not be construed as being incorporated by reference into, this Annual Report on Form 10-K. We make available free of charge under the “Investors” heading on our website our annual reports on Form 10-K, quarterly reports on Form 10-Q, current reports on Form 8-K and amendments to those reports filed or furnished pursuant to Section 13(a) or 15(d) of the Securities Exchange Act of 1934, as amended (the “Exchange Act”), as well as our Proxy Statements, as soon as reasonably practicable after such documents are electronically filed or furnished, as applicable, with the Securities and Exchange Commission (the “SEC”). You also may read and copy any materials we file with the SEC at the SEC’s Public Reference Room at 100 F Street, NE, Washington, DC 20549-0213. You may obtain information on the operation of the Public Reference Room by calling the SEC at 1-800-SEC-0330. The SEC maintains an Internet site at www.sec.gov that contains reports, proxy and information statements and other information regarding issuers like us who file electronically with the SEC.
In addition, our charters for our Executive Committee, Nominating and Governance Committee, Audit Committee and Compensation Committee, as well as our Corporate Governance Guidelines, Code of Principles for Senior Executives, Independence Policy, Global Anti-Corruption Policy, and Code of Business Ethics and Conduct for our Directors, officers and employees, are all available on our website in the “Corporate Governance” link under the “Investors” heading.
Forward-Looking Information
This Annual Report on Form 10-K contains various “forward-looking statements” within the meaning of the Private Securities Litigation Reform Act of 1995. These statements involve certain unknown risks and uncertainties, including, among others, those contained in Item 1, “Business,” Item 1A, “Risk Factors,” and Item 7, “Management’s Discussion and Analysis of Financial Condition and Results of Operations.” When used in this Annual Report on Form 10-K, the words “anticipates,” “plans,” “believes,” “estimates,” “intends,” “expects,” “projects,” “will” and similar expressions may identify forward-looking statements, although not all forward-looking statements contain such words. Such statements, including, but not limited to, our statements regarding business strategy, growth strategy, competitive strengths, productivity and profitability enhancement, competition, new product and service introductions and liquidity and capital resources, are based on management’s beliefs, as well as on assumptions made by and information currently available to management, and involve various risks and uncertainties, some of which are beyond our control. Our actual results could differ materially from those expressed in any forward-looking statement made by us or on our behalf. In light of these risks and uncertainties, there can be no assurance that the forward-looking information will in fact prove to be accurate. We have undertaken no obligation to publicly update or revise any forward-looking statements, whether as a result of new information, future events or otherwise.

8
Executive Officers
Our executive officers and their respective ages and positions as of February 22, 2017, are set forth below.
Name Age Position
John J. Engel 55 Chairman, President and Chief Executive OfficerDiane E. Lazzaris 50 Senior Vice President and General CounselDavid S. Schulz 51 Senior Vice President and Chief Financial OfficerKimberly G. Windrow 59 Senior Vice President and Chief Human Resources Officer
Set forth below is biographical information for our executive officers listed above.
John J. Engel was appointed Chairman of the Board in May 2011 and has served as President and Chief Executive Officer since September 2009. Previously, Mr. Engel served as our Senior Vice President and Chief Operating Officer from 2004 to September 2009. From 2003 to 2004, Mr. Engel served as Senior Vice President and General Manager of Gateway, Inc. From 1999 to 2002, Mr. Engel served as an Executive Vice President and Senior Vice President of Perkin Elmer, Inc. From 1994 to 1999, Mr. Engel served as a Vice President and General Manager of Allied Signal, Inc. and held various engineering, manufacturing and general management positions at General Electric Company from 1985 to 1994.
Diane E. Lazzaris has served as our Senior Vice President and General Counsel since January 2014, and from February 2010 to December 2013 she served as our Vice President, Legal Affairs. From 2008 to February 2010, Ms. Lazzaris served as Senior Vice President - Legal, General Counsel and Corporate Secretary of Dick’s Sporting Goods, Inc. From 1994 to 2008, she held various corporate counsel positions at Alcoa Inc., most recently as Group Counsel to a group of global businesses.
David S. Schulz has served as our Senior Vice President and Chief Financial Officer since October 2016. From April 2016 to October 2016, he served as Senior Vice President and Chief Operating Officer of Armstrong Flooring, Inc. From November 2013 to March 2016, he served as Senior Vice President and Chief Financial Officer of Armstrong World Industries, Inc., and as Vice President, Finance of the Armstrong Building Products division from June 2011 to November 2013. Prior to joining Armstrong World Industries in 2011, he held various financial leadership roles with Proctor & Gamble and The J.M. Smucker Company. Mr. Schulz began his career as an officer in the United States Marine Corps.
Kimberly G. Windrow has served as our Senior Vice President and Chief Human Resources Officer since January 2014, and from August 2010 to December 2013 she served as our Vice President, Human Resources. From 2004 until July 2010, Ms. Windrow served as Senior Vice President of Human Resources for The McGraw Hill Companies in the education segment. From 2001 until 2004, she served as Senior Vice President of Human Resources for The MONY Group, and from 1988 until 2000, she served in various Human Resource positions at Willis, Inc.

9
Item 1A. Risk Factors.
The following factors, among others, could cause our actual results to differ materially from the forward-looking statements we make. All forward-looking statements attributable to us or persons working on our behalf are expressly qualified by the following factors. This information should be read in conjunction with Item 7, Management’s Discussion and Analysis of Financial Condition and Results of Operations, Item 7A, Quantitative and Qualitative Disclosures about Market Risks and the consolidated financial statements and related notes included in this Form 10-K.
Adverse conditions in the global economy and disruptions of financial markets could negatively impact our results of operations.
Our results of operations are affected by the level of business activity of our customers, which in turn is affected by global economic conditions and market factors impacting the industries and markets that they serve. Certain global economies and markets continue to experience significant uncertainty and volatility, particularly commodity-driven end markets such as oil and gas and metals and mining. Adverse economic conditions or lack of liquidity in these markets, particularly in North America, may adversely affect our revenues and operating results. Economic and financial market conditions also affect the availability of financing for projects and for our customers' capital or other expenditures, which can result in project delays or cancellations and thus affect demand for our products. There can be no assurance that any governmental responses to economic conditions or disruptions in the financial markets ultimately will stabilize the markets or increase our customers' liquidity or the availability of credit to our customers. Should one or more of our larger customers declare bankruptcy, it could adversely affect the collectability of our accounts receivable, bad debt reserves and net income. In addition, our ability to access the capital markets may be restricted at a time when we would like, or need, to do so. The economic, political and financial environment also may affect our business and financial condition in ways that we currently cannot predict, and there can be no assurance that economic, political and market conditions will not adversely affect our results of operations, cash flow or financial position in the future. Fluctuations of the U.S. dollar relative to other currencies could negatively affect our business, financial results and liquidity.
Certain events or conditions, including a failure or breach of our information security systems, could lead to interruptions in our operations, which may materially adversely affect our business, financial condition or results of operations.
We operate a number of facilities and we coordinate company activities, including information technology systems and administrative services and the like, through our headquarters operations. Our operations depend on our ability to maintain existing systems and implement new technology, which includes allocating sufficient resources to periodically upgrade our information technology systems, and to protect our equipment and the information stored in our databases against both manmade and natural disasters, as well as power losses, computer and telecommunications failures, technological breakdowns, unauthorized intrusions, cyber-attacks, and other events. Conversions to new information technology systems may result in cost overruns, delays or business interruptions. If our information technology systems are disrupted, become obsolete or do not adequately support our strategic, operational or compliance needs, it could result in competitive disadvantage and adversely affect our financial results and business operations, including our ability to process orders, receive and ship products, maintain inventories, collect accounts receivable and pay expenses.
Because we rely heavily on information technology both in serving our customers and in our enterprise infrastructure in order to achieve our objectives, we may be vulnerable to damage or intrusion from a variety of cyber-attacks including computer viruses, worms or other malicious software programs that access our systems. Despite the precautions we take to mitigate the risks of such events, an attack on our enterprise information technology system could result in theft or disclosure of our proprietary or confidential information or a breach of confidential customer, supplier or employee information. Such events could have an adverse impact on revenue and harm our reputation. Additionally, such an event could cause us to incur legal liability and costs, which could be significant, in order to address and remediate the effects of an attack and related security concerns.
We also depend on accessible office facilities, distribution centers and information technology data centers for our operations to function properly. An interruption of operations at any of our distribution centers could have a material adverse effect on the operations of branches served by the affected distribution center. Such disaster related risks and effects are not predictable with certainty and, although they typically can be mitigated, they cannot be eliminated. We seek to mitigate our exposures to disaster events in a number of ways. For example, where feasible, we design the configuration of our facilities to reduce the consequences of disasters. We also maintain insurance for our facilities against casualties and we evaluate our risks and develop contingency plans for dealing with them. Although we have reviewed and analyzed a broad range of risks applicable to our business, the ones that actually affect us may not be those we have concluded most likely to occur. Furthermore, although our reviews have led to more systematic contingency planning, our plans are in varying stages of

10
development and execution, such that they may not be adequate at the time of occurrence for the magnitude of any particular disaster event that befalls us.
Loss of key suppliers, product cost fluctuations, lack of product availability or inefficient supply chain operations could decrease sales and earnings.
Most of our agreements with suppliers are terminable by either party on 60 days' notice or less. Our ten largest suppliers in 2016 accounted for approximately 32% of our purchases for the period. Our largest supplier in 2016 was Eaton Corporation, accounting for approximately 11% of our purchases. The loss of, or a substantial decrease in the availability of, products from any of these suppliers, a supplier's change in sales strategy to rely less on distribution channels, the loss of key preferred supplier agreements, or disruptions in a key supplier's operations could have a material adverse effect on our business. Supply interruptions could arise from shortages of raw materials, effects of economic, political or financial market conditions on a supplier's operations, labor disputes or weather conditions affecting products or shipments, transportation disruptions, information system disruptions or other reasons beyond our control.
In addition, certain of our products, such as wire and conduit, are commodity-price-based products and may be subject to significant price fluctuations which are beyond our control. While increases in the cost of energy or products could have adverse effects, decreases in those costs, particularly if severe, could also adversely impact us by creating deflation in selling prices, which could cause our gross profit margin to deteriorate. Fluctuations in energy or raw materials costs can also adversely affect our customers. The recent declines in oil and gas prices have negatively impacted our customers operating in those industries and, consequently, our sales to those customers. Furthermore, we cannot be certain that particular products or product lines will be available to us, or available in quantities sufficient to meet customer demand. Such limited product access could cause us to be at a competitive disadvantage. The profitability of our business is also dependent upon the efficiency of our supply chain. An inefficient or ineffective supply chain strategy or operations could increase operational costs, reduce profit margins and adversely affect our business.
Expansion into new business activities, industries, product lines or geographic areas could subject the company to increased costs and risks and may not achieve the intended results.
Engaging in or significantly expanding business activities in product sourcing, sales and services could subject the company to unexpected costs and risks. Such activities could subject us to increased operating costs, product liability, regulatory requirements and reputational risks. Our expansion into new and existing markets, including manufacturing related or regulated businesses, may present competitive, distribution and regulatory challenges that differ from current ones. We may be less familiar with the target customers and may face different or additional risks, as well as increased or unexpected costs, compared to existing operations. Growth into new markets may also bring us into direct competition with companies with whom we have little or no past experience as competitors. To the extent we are reliant upon expansion into new geographic, industry and product markets for growth and do not meet the new challenges posed by such expansion, our future sales growth could be negatively impacted, our operating costs could increase, and our business operations and financial results could be negatively affected. Expanding our e-commerce capabilities and customer experience has required additional investments, and if not successful, we may not realize the return on our investments as anticipated or our operating results could be adversely affected by slower than expected sales growth or additional costs.
We must attract, retain and motivate key employees, and the failure to do so may adversely affect our business and results of operations.
Our success depends on hiring, retaining and motivating key employees, including executive, managerial, sales, technical, marketing and support personnel. We may have difficulty locating and hiring qualified personnel. In addition, we may have difficulty retaining such personnel once hired, and key people may leave and compete against us. The loss of key personnel or our failure to attract and retain other qualified and experienced personnel could disrupt or adversely affect our business, its sales and results of operations. In addition, our operating results could be adversely affected by increased costs due to increased competition for employees, higher employee turnover, which may also result in loss of significant customer business, or increased employee benefit costs.
Changes in tax laws or challenges to the Company's tax positions by taxing authorities could adversely impact the Company's results of operations and financial condition.
We are subject to taxes in jurisdictions in which we do business, including but not limited to taxes imposed on our income, receipts, stockholders' equity, property, sales, purchases and payroll. As a result, the tax expense we incur can be adversely affected by changes in tax law. We frequently cannot anticipate these changes in tax law, which can cause unexpected volatility in our results from operations. While not limited to the United States and Canada, changes in the tax law at the federal and state/provincial levels in the United States and Canada can have a materially adverse effect on our results from operations.

11
Additionally, the tax laws to which the Company is subject are inherently complex and ambiguous. Therefore, we must interpret the applicable laws and make subjective judgments about the expected outcome upon challenge by the applicable taxing authorities. As a result, the impact on our results from operations of the application of enacted tax laws to our facts and circumstances is frequently uncertain. If a tax authority successfully challenges our interpretation and application of the tax law to our facts and circumstances, there can be no assurance that we can accurately predict the outcome and the taxes ultimately owed upon effective settlement may differ from the tax expense recognized in our consolidated statements of income and comprehensive income (loss) and accrued in our consolidated balance sheets. Additionally, if we cannot meet liquidity requirements in the United States, we may have to repatriate funds from overseas, which would result in a United States tax liability on the amount repatriated.
An increase in competition could decrease sales or earnings.
We operate in a highly competitive industry and compete directly with global, national, regional and local providers of our products and services. Some of our existing competitors have, and new market entrants may have, greater resources than us. Competition is generally based on product line breadth, product availability, service capabilities and price. Other sources of competition are buying groups formed by smaller distributors to increase purchasing power and provide some cooperative marketing capability as well as e-commerce companies. There may be new market entrants with non-traditional business and customer service models, resulting in increased competition and changing industry dynamics.
Existing or future competitors may seek to gain or retain market share by reducing prices, and we may be required to lower our prices or may lose business, which could adversely affect our financial results. Also, to the extent that we do not meet changing customer preferences or demands or to the extent that one or more of our competitors becomes more successful with private label products, on-line offerings or otherwise, our ability to attract and retain customers could be materially adversely affected. Existing or future competitors also may seek to compete with us for acquisitions, which could have the effect of increasing the price and reducing the number of suitable acquisitions. In addition, it is possible that competitive pressures resulting from industry consolidation could affect our growth and profit margins.
Acquisitions that we may undertake would involve a number of inherent risks, any of which could cause us not to realize the benefits anticipated to result.
We have expanded our operations through organic growth and selected acquisitions of businesses and assets and may seek to do so in the future. Acquisitions involve various inherent risks, including: problems that could arise from the integration of the acquired business; uncertainties in assessing the value, strengths, weaknesses, contingent and other liabilities and potential profitability of acquisition candidates; the potential loss of key employees of an acquired business; the ability to achieve identified operating and financial synergies anticipated to result from an acquisition or other transaction; unanticipated changes in business, industry or general economic conditions that affect the assumptions underlying the acquisition or other transaction rationale; and expansion into new countries or geographic markets where we may be less familiar with operating requirements, target customers and regulatory compliance. Any one or more of these factors could increase our costs or cause us not to realize the benefits anticipated to result from the acquisition of business or assets.
While there are risks associated with acquisitions generally, including integration risks, there are additional risks more specifically associated with owning and operating businesses internationally, including those arising from import and export controls, foreign currency exchange rate changes, material developments in political, regulatory or economic conditions impacting those operations and various environmental and climatic conditions in particular areas of the world.
Fluctuations in foreign currency have an effect on reported results from operations.
The results of our foreign operations are reported in the local currency and then translated into U.S. dollars at the applicable exchange rates for inclusion in our consolidated financial statements. The exchange rates between some of these currencies and the U.S. dollar have fluctuated significantly in recent years, and may continue to do so in the future. In addition, because our financial statements are stated in U.S. dollars, such fluctuations may affect our results of operations and financial position, and may affect the comparability of our results between financial periods.
We are subject to costs and risks associated with laws and regulations affecting our business, as well as litigation for product liability or other matters affecting our business.
The complex legal and regulatory environment exposes us to compliance costs and risks, as well as litigation and other legal proceedings, which could materially affect our operations and financial results. These laws and regulations may change, sometimes significantly, as a result of political or economic events, and some changes are anticipated to occur in the coming year. They include tax laws and regulations, import and export laws and regulations, labor and employment laws and regulations, product safety, occupational safety and health laws and regulations, securities and exchange laws and regulations (and other laws applicable to publicly-traded companies such as the Foreign Corrupt Practices Act), and environmental laws

12
and regulations. Furthermore, as a government contractor selling to federal, state and local government entities, we are also subject to a wide variety of additional laws and regulations. Proposed laws and regulations in these and other areas, such as healthcare, employment, or legal matters could affect the cost of our business operations. From time to time we are involved in legal proceedings, audits or investigations which may relate to, for example, product liability, labor and employment (including wage and hour), tax, escheat, import and export compliance, government contracts, worker health and safety, general commercial and securities matters. While we believe that the outcome of any pending matter is unlikely to have a material adverse effect on our financial condition or liquidity, additional legal proceedings may arise in the future and the outcome of any legal proceedings and other contingencies could require us to take actions which could adversely affect our operations or could require us to pay substantial amounts of money.
Our outstanding indebtedness requires debt service commitments that could adversely affect our ability to fulfill our obligations and could limit our growth and impose restrictions on our business.
As of December 31, 2016, we had $1.40 billion of consolidated indebtedness (excluding debt discount and debt issuance costs), including $500 million in aggregate principal amount of 5.375% Senior Notes due 2021 (the “2021 Notes”), $350 million in aggregate principal amount of 5.375% Senior Notes due 2024 (the “2024 Notes”) and $144.8 million in aggregate principal amount of term loans due 2019 (the “Term Loan Facility”). Our consolidated indebtedness also includes amounts outstanding under our revolving credit facility (the "Revolving Credit Facility"), which has an aggregate borrowing capacity of $600 million, and our accounts receivable securitization facility (the “Receivables Facility”), through which we sell up to $550 million of our accounts receivable to third-party financial institutions. We and our subsidiaries may undertake additional borrowings in the future, subject to certain limitations contained in the instruments governing our indebtedness.
Our debt service obligations have important consequences, including: our payments of principal and interest reduce the funds available to us for operations, future business opportunities and acquisitions and other purposes; they increase our vulnerability to adverse economic, financial market and industry conditions; our ability to obtain additional financing may be limited; and our financial results are affected by increased interest costs. Our ability to make scheduled payments of principal and interest on our debt, refinance our indebtedness, make scheduled payments on our operating leases, fund planned capital expenditures or to finance acquisitions will depend on our future performance, which, to a certain extent, is subject to economic, financial, competitive and other factors beyond our control. There can be no assurance that our business will continue to generate sufficient cash flow from operations in the future to service our debt, make necessary capital expenditures or meet other cash needs. If unable to do so, we may be required to refinance all or a portion of our existing debt, to sell assets or to obtain additional financing. Our Receivables Facility is subject to renewal in September 2018 and our Revolving Credit Facility is subject to renewal in September 2020. There can be no assurance that available funding or any sale of additional receivables or additional financing will be possible at the times of renewal in amounts or terms favorable to us, if at all.
Over the next three years, we will be required to repay approximately $548.5 million of our currently outstanding indebtedness, of which $380.0 million is related to our Receivables Facility, $144.8 million is related to our Term Loan Facility, $20.9 million is related to our international lines of credit, and $2.8 million is related to our capital leases.
Our debt agreements contain restrictions that may limit our ability to operate our business.
Our credit facilities also require us to maintain specific earnings to fixed expenses and to meet minimum net worth requirements in certain circumstances. Our credit facilities, Term Loan Facility, 2021 Notes and 2024 Notes contain, and any of our future debt agreements may contain, certain covenant restrictions that limit our ability to operate our business, including restrictions on our ability to: incur additional debt or issue guarantees; create liens; make certain investments; enter into transactions with our affiliates; sell certain assets; make capital expenditures; redeem capital stock or make other restricted payments; declare or pay dividends or make other distributions to stockholders; and merge or consolidate with any person. Our Term Loan Facility and certain other credit facilities contain additional affirmative and negative covenants, and our ability to comply with these covenants is dependent on our future performance, which will be subject to many factors, some of which are beyond our control, including prevailing economic conditions.
As a result of these covenants, our ability to respond to changes in business and economic conditions and to obtain additional financing, if needed, may be significantly restricted, and we may be prevented from engaging in transactions that might otherwise be beneficial to us. In addition, our failure to comply with these covenants could result in a default under the credit facilities, Term Loan Facility, 2021 Notes, 2024 Notes and our other debt, which could permit the holders to accelerate such debt. If any of our debt is accelerated, we may not have sufficient funds available to repay such debt.
Goodwill and indefinite-lived intangible assets recorded as a result of our acquisitions could become impaired.
As of December 31, 2016, our combined goodwill and indefinite-lived intangible assets amounted to $1.82 billion. To the extent we do not generate sufficient cash flows to recover the net amount of any investments in goodwill and other indefinite-lived intangible assets recorded, the investment could be considered impaired and subject to write-off. We expect to record

13
further goodwill and other indefinite-lived intangible assets as a result of future acquisitions we may complete. Future amortization of such assets or impairments, if any, of goodwill or indefinite-lived intangible assets would adversely affect our results of operations in any given period.
There is a risk that the market value of our common stock may decline.
Stock markets have experienced significant price and trading volume fluctuations, and the market prices of companies in our industry have been volatile. In recent years, volatility and disruption reached unprecedented levels. For some issuers, the markets have exerted downward pressure on stock prices and credit capacity. It is impossible to predict whether the price of our common stock will rise or fall. Trading prices of our common stock will be influenced by our operating results and prospects and by economic, political, financial and other factors.
Item 1B. Unresolved Staff Comments.
None.
Item 2. Properties.
We have approximately 500 branches, of which approximately 350 are located in the United States, approximately 130 are located in Canada, seven are located in Mexico and the remainder are in other countries located in Asia, Europe and South America. Approximately 14% of our branches are owned facilities, and the remainder are leased.
The following table summarizes our distribution centers:
Square Feet Leased/Owned
Location Little Rock, AR 100,000 LeasedByhalia, MS(1) 148,000 OwnedSparks, NV 199,000 LeasedWarrendale, PA(1) 194,000 OwnedMadison, WI 136,000 LeasedEdmonton, AB 101,000 LeasedBurnaby, BC 65,000 LeasedMississauga, ON 246,000 LeasedMontreal, QC 126,000 Leased
(1) Property pledged as collateral under our Term Loan Facility.
We also lease our 84,000 square-foot headquarters in Pittsburgh, Pennsylvania. We do not regard the real property associated with any single branch location as material to our operations. We believe our facilities are in good operating condition and are adequate for their respective uses.

14
Item 3. Legal Proceedings.
From time to time, a number of lawsuits and claims have been or may be asserted against us relating to the conduct of our business, including routine litigation relating to commercial and employment matters. The outcome of any litigation cannot be predicted with certainty, and some lawsuits may be determined adversely to us. However, management does not believe that the ultimate outcome of any such pending matters is likely to have a material adverse effect on our financial condition or liquidity, although the resolution in any fiscal period of one or more of these matters may have a material adverse effect on our results of operations for that period.
Information relating to legal proceedings is included in Note 13, "Commitments and Contingencies," of the Notes to Consolidated Financial Statements and is incorporated herein by reference.
Item 4. Mine Safety Disclosures.
Not applicable.

15
PART II
Item 5. Market for Registrant’s Common Equity, Related Stockholder Matters and Issuer Purchases of Equity Securities.
Market, Stockholder and Dividend Information. Our common stock is listed on the New York Stock Exchange under the symbol “WCC.” As of February 21, 2017, there were 48,720,648 shares of common stock outstanding held by approximately 22 holders of record. We have not paid dividends on the common stock and do not currently plan to pay dividends. We do, however, evaluate the possibility from time to time. It is currently expected that earnings will be reinvested to support business growth, debt reduction, acquisitions and share repurchases. In addition, our Revolving Credit Facility and Term Loan Facility limit our ability to pay dividends. Furthermore, the 2021 Notes and 2024 Notes limit our ability to pay dividends and repurchase our common stock. See Part II, Item 7, “Management’s Discussion and Analysis of Financial Condition and Results of Operations — Liquidity and Capital Resources.”
The following table sets forth the high and low sales prices per share of our common stock, as reported on the New York Stock Exchange, for the periods indicated.
Sales PricesQuarter High Low
2015 First $ 77.40 $ 65.38Second 74.61 66.51Third 69.57 45.47Fourth 52.26 39.622016 First $ 55.92 $ 34.00Second 62.66 50.64Third 63.90 49.67Fourth 73.40 51.45
Issuer Purchases of Equity Securities. On December 17, 2014, WESCO announced that its Board of Directors approved, on December 11, 2014, the repurchase of up to $300 million of the Company's common stock through December 31, 2017. As of December 31, 2016, WESCO has repurchased 2,468,576 shares of the Company's common stock for $150.0 million under this repurchase authorization.

16
Company Performance. The following stock price performance graph illustrates the cumulative total return on an investment in WESCO International, a 2016 Performance Peer Group, and the Russell 2000 Index. The graph covers the period from December 31, 2011 to December 31, 2016, and assumes that the value for each investment was $100 on December 31, 2011, and that all dividends were reinvested.
2016 Performance Peer Group (3):Airgas, Inc. Essendant, Inc.1 MSC Industrial Direct Co., Inc.Anixter International, Inc. Fastenal Company Rexel SAApplied Industrial Technologies, Inc. Genuine Parts Company Rockwell Automation, Inc.Arrow Electronics, Inc. HD Supply Holdings, Inc. Tech Data CorporationAvnet, Inc. Hubbell, Inc. W.W. Grainger, Inc.Barnes Group Ingram Micro, Inc.2
Eaton Corporation Plc MRC Global, Inc.
2015 Performance Peer Group:Airgas, Inc. Eaton Corporation Plc MSC Industrial Direct Co., Inc.Anixter International, Inc. Emerson Electric Company Pool CorporationApplied Industrial Technologies, Inc. Fastenal Company Rockwell Automation, Inc.Arrow Electronics, Inc. Genuine Parts Company Tech Data CorporationAvnet, Inc. Houston Wire & Cable Company Essendant, Inc.1
Beacon Roofing Supply, Inc. Hubbell, Inc. W.W. Grainger, Inc.Danaher Corporation Ingram Micro, Inc. Watsco, Inc.
1 United Stationers changed their name to Essendant, Inc. in February 2015.2 Tianjin Tianhai Investment Company, Ltd. acquired Ingram Micro Inc. in December 2016.3 The performance peer group was updated in 2016 based on a review of relative market capitalization, industry, capital structure, revenue
size and investor peers.

17
Item 6. Selected Financial Data.
Selected financial data and significant events related to the Company’s financial results for the last five fiscal years are listed below. The financial data should be read in conjunction with the Consolidated Financial Statements and Notes thereto included in Item 8 and with Management’s Discussion and Analysis of Financial Condition and Results of Operations, included in Item 7.
Year Ended December 31, 2016 2015 2014 2013 2012(In millions, except per share data)
Income Statement Data:Net sales $ 7,336.0 $ 7,518.5 $ 7,889.6 $ 7,513.3 $ 6,579.3Cost of goods sold (excluding depreciation and amortization) 5,887.8 6,024.8 6,278.6 5,967.9 5,247.8Selling, general and administrative expenses 1,049.3 1,055.0 1,076.8 996.8 961.0Depreciation and amortization 66.9 65.0 68.0 67.6 37.6Income from operations 332.0 373.7 466.2 481.0 332.9Interest expense, net 76.6 69.8 82.1 85.6 47.8Loss on debt extinguishment(1) 123.9 — — 13.2 3.5Other loss(2) — — — 2.3 —Income before income taxes 131.5 303.9 384.1 379.9 281.6Provision for income taxes 30.4 95.5 108.7 103.4 79.9Net income 101.1 208.4 275.4 276.5 201.7 Net loss (income) attributable to noncontrolling interests(3) 0.5 2.3 0.5 (0.1) 0.1 Net income attributable to WESCO International $ 101.6 $ 210.7 $ 275.9 $ 276.4 $ 201.8Earnings per common share attributable to WESCO
International Basic $ 2.30 $ 4.85 $ 6.21 $ 6.26 $ 4.62Diluted $ 2.10 $ 4.18 $ 5.18 $ 5.25 $ 3.95
Weighted-average common shares outstanding Basic 44.1 43.4 44.4 44.1 43.7Diluted 48.3 50.4 53.3 52.7 51.1
Other Financial Data: Capital expenditures $ 18.0 $ 21.7 $ 20.5 $ 27.8 $ 23.1Net cash provided by operating activities 300.2 283.1 251.2 315.1 288.2Net cash used in investing activities (70.5) (170.2) (144.2) (18.2) (1,311.0)Net cash used in financing activities (276.3) (67.8) (95.5) (257.5) 1,044.0Balance Sheet Data: Total assets $ 4,491.0 $ 4,569.7 $ 4,754.4 $ 4,648.9 $ 4,629.6Total debt (including current and short-term debt)(4) 1,385.3 1,483.4 1,415.6 1,487.7 1,735.2Stockholders’ equity 2,010.0 1,773.9 1,928.2 1,764.8 1,553.7
(1) Represents the loss recognized in 2016 related to the redemption of the 6.0% Convertible Senior Debentures due 2029, the loss recognized in 2013 related to the $500 million prepayment made to the U.S. sub-facility of the Term Loan Facility, and the loss recognized in 2012 due to the redemption of the Company's then outstanding 7.50% Senior Subordinated Notes due 2017.
(2) Represents the loss on the sale of a foreign operation in 2013. (3) Represents the portion of net loss (income) attributable to consolidated entities that are not owned by the Company. (4) Includes the discount related to the 6.0% Convertible Senior Debentures due 2029 and Term Loan Facility. For 2016
and 2015, also includes debt issuance costs. See Note 7 of the Notes to Consolidated Financial Statements.

18
Item 7. Management’s Discussion and Analysis of Financial Condition and Results of Operations.
The following discussion should be read in conjunction with the audited consolidated financial statements and notes thereto included in Item 8 of this Annual Report on Form 10-K.
Company Overview
In 2016, we took actions to further streamline our organization, simplified our capital structure by redeeming the 6.0% Convertible Senior Debentures due 2029 (the "2029 Debentures"), improved productivity, integrated one accretive acquisition, generated strong cash flow and closely managed costs. Our financial results primarily reflect challenging economic and end market conditions, partially offset by the benefits of cost reduction actions and discretionary spending controls. Sales decreased $182.5 million, or 2.4%, over the prior year. Acquisitions and number of workdays positively impacted net sales by 3.1% and 0.4%, respectively, and were partially offset by a 1.0% decrease in foreign exchange rates, resulting in a 4.9% decrease in normalized organic sales. Cost of goods sold as a percentage of net sales was 80.3% and 80.1% in 2016 and 2015, respectively. Operating income was $332.0 million for 2016, compared to $373.7 million for 2015. Operating income decreased due to lower sales and gross margin, despite actions to reduce operating costs. Net income attributable to WESCO International of $101.6 million decreased by 51.8%. Diluted earnings per share attributable to WESCO International was $2.10 in 2016, based on 48.3 million diluted shares, compared with diluted earnings per share of $4.18 in 2015, based on 50.4 million diluted shares. Excluding the non-cash impact of the convertible debt conversion in the third quarter of $1.70, adjusted earnings per diluted share for 2016 was $3.80.
Our end markets consist of industrial firms, electrical and data communications contractors, utilities, and commercial organizations, institutions and government entities. Our transaction types to these markets can be categorized as stock, direct ship and special order. Stock orders are filled directly from existing inventory and represent approximately 50% of total sales. Approximately 39% of our total sales are direct ship sales. Direct ship sales are typically custom-built products, large orders or products that are too bulky to be easily handled and, as a result, are shipped directly to the customer from the supplier. Special orders are for products that are not ordinarily stocked in inventory and are ordered based on a customer’s specific request. Special orders represent the remaining 11% of total sales.
We have historically financed our working capital requirements, capital expenditures, acquisitions, share repurchases and new branch openings through internally generated cash flow, debt issuances, borrowings under our Revolving Credit Facility and funding through our Receivables Facility.
Cash Flow
We generated $300.2 million in operating cash flow during 2016. Cash provided by operating activities included net income of $101.1 million, adjustments to net income totaling $159.3 million, including a loss on the redemption of our convertible debt of $123.9 million, and changes in assets and liabilities of $39.8 million. Investing activities included net payments of $50.9 million, primarily for the acquisition of Atlanta Electrical Distributors, LLC, and capital expenditures of $18.0 million. Financing activities consisted of borrowings and repayments of $1.03 billion and $1.10 billion, respectively, related to our Revolving Credit Facility, borrowings and repayments of $706.9 million and $851.9 million, respectively, related to our Receivables Facility, proceeds from the issuance of the 2024 Notes of $350.0 million, a payment of $344.8 million to redeem the 2029 Debentures and repayments of $30.0 million applied to our Term Loan Facility. Financing activities in 2016 also included borrowings and repayments on our various international lines of credit of $111.5 million and $131.5 million, respectively.
Free cash flow for the years ended December 31, 2016 and 2015 was $282.2 million and $261.4 million, respectively.
The following table sets forth the components of free cash flow:
Twelve Months EndedDecember 31,
Free Cash Flow: 2016 2015
(In millions)
Cash flow provided by operations $ 300.2 $ 283.1 Less: Capital expenditures (18.0) (21.7) Free cash flow $ 282.2 $ 261.4

19
Note: The table above reconciles cash flow provided by operations to free cash flow. Free cash flow is a non-GAAP financial measure provided by the Company as an additional liquidity measure. Capital expenditures are deducted from operating cash flow todetermine free cash flow. Free cash flow is available to fund the Company's other investing and financing activities.
Financing Availability
As of December 31, 2016, we had $509.7 million in total available borrowing capacity under our Revolving Credit Facility, which was comprised of $301.3 million of availability under the U.S. sub-facility and $208.4 million of availability under the Canadian sub-facility. Available borrowing capacity under our Receivables Facility was $146.8 million. The Receivables Facility and Revolving Credit Facility mature in September 2018 and September 2020, respectively.
Critical Accounting Policies and Estimates
Our discussion and analysis of our financial condition and results of operations are based upon our consolidated financial statements, which have been prepared in accordance with accounting principles generally accepted in the United States of America (GAAP). The preparation of these financial statements requires us to make estimates and judgments that affect the reported amounts of assets, liabilities, revenues and expenses and related disclosure of contingent assets and liabilities. On an ongoing basis, we evaluate our estimates, including those related to supplier programs, bad debts, inventories, insurance costs, goodwill, income taxes, contingencies and litigation. We base our estimates on historical experience and on various other assumptions that are believed to be reasonable under the circumstances, the results of which form the basis for making judgments about the carrying values of assets and liabilities that are not readily apparent from other sources. Actual results may differ from these estimates. If actual market conditions are less favorable than those projected by management, additional adjustments to reserve items may be required. We believe the following critical accounting policies affect our judgments and estimates used in the preparation of our consolidated financial statements.
Revenue Recognition
Revenues are recognized for product sales when title, ownership and risk of loss pass to the customer or for services when the service is rendered. In the case of stock sales and special orders, a sale occurs at the time of shipment from our distribution point, as the terms of our sales are typically FOB shipping point. In cases where we process customer orders but ships directly from its suppliers, revenue is recognized once product is shipped and title has passed. In all cases, revenue is recognized once the sales price to our customer is fixed or is determinable and we have reasonable assurance as to the collectability.
In certain customer arrangements, we provide services such as inventory management. We may perform some or all of the following services for customers: determine inventory stocking levels; establish inventory reorder points; launch purchase orders; receive material; pack away material; and pick material for order fulfillment. We recognize revenue for services rendered during the period based upon a previously negotiated fee arrangement. We also sell inventory to these customers and recognize revenue at the time title and risk of loss transfers to the customer.
Selling, General and Administrative Expenses
We include warehousing, purchasing, branch operations, information services, and marketing and selling expenses in this category, as well as other types of general and administrative costs.
Allowance for Doubtful Accounts
We maintain allowances for doubtful accounts for estimated losses resulting from the inability of our customers to make required payments. We have a systematic procedure using estimates based on historical data and reasonable assumptions of collectability made at the local branch level and on a consolidated corporate basis to calculate the allowance for doubtful accounts.
Excess and Obsolete Inventory
We write down our inventory to lower of cost and net realizable value based on internal factors derived from historical analysis of actual losses. Retrospectively, we identify items in excess of 36 months supply relative to demand or movement. We then analyze the ultimate disposition of previously identified excess inventory items as they are sold, returned to supplier, or scrapped. This historical item-by-item analysis allows us to develop an estimate of the likelihood that an item identified as being in excess supply ultimately becomes obsolete. We apply the estimate to inventory items currently in excess of 36 months supply, and reduce our inventory carrying value by the derived amount. We revisit and test our assumptions on a periodic basis. Historically, we have not had material changes to our assumptions, nor do we anticipate any material changes in the future.

20
Supplier Volume Rebates
We receive rebates from certain suppliers based on contractual arrangements with them. Since there is a lag between actual purchases and the rebates received from the suppliers, we estimate and accrue the approximate amount of rebates available at a specific date. We record the amounts as other accounts receivable in the Consolidated Balance Sheets. The corresponding rebate income is derived from the level of actual purchases made by us and is recorded as a reduction of cost of goods sold. Supplier volume rebate rates have historically ranged between approximately 0.9% and 1.4% of sales depending on market conditions. In 2016, the rebate rate was 1.3%.
Goodwill and Indefinite-Lived Intangible Assets
Goodwill and indefinite-lived intangible assets are tested for impairment annually during the fourth quarter using information available at the end of September, or more frequently if triggering events occur indicating that their carrying value may not be recoverable. We test for goodwill impairment on a reporting unit level and the evaluation involves comparing the fair value of each reporting unit with its carrying value. The fair values of the reporting units are determined using a combination of a discounted cash flow analysis and market multiples. Assumptions used for these fair value techniques are based on a combination of historical results, current forecasts, market data and recent economic events. We evaluate the recoverability of indefinite-lived intangible assets using the relief-from-royalty method based on projected financial information. The determination of fair value involves significant management judgment and we apply our best judgment when assessing the reasonableness of financial projections. At December 31, 2016 and 2015, goodwill and indefinite-lived trademarks totaled $1.82 billion and $1.77 billion, respectively.
A possible indicator of goodwill impairment is the relationship of a company’s market capitalization to its book value. As of December 31, 2016, our market capitalization exceeded our book value and there were no impairment losses identified as a result of our annual test. Fair value determinations require considerable judgment and are sensitive to changes in underlying assumptions and factors. As a result, there can be no assurance that the estimates and assumptions made for purposes of the annual goodwill and indefinite-lived intangible impairment tests will prove to be an accurate prediction of future results.
Intangible Assets
We account for certain economic benefits purchased as a result of our acquisitions, including customer relations, distribution agreements, technology and trademarks, as intangible assets. Most trademarks have an indefinite life. We amortize all other intangible assets over a useful life determined by the expected cash flows produced by such intangibles and their respective tax benefits. Useful lives vary between 2 and 20 years, depending on the specific intangible asset.
Insurance Programs
We use commercial insurance for auto, workers’ compensation, casualty and health claims as a risk sharing strategy to reduce our exposure to catastrophic losses. Our strategy involves large deductible policies where we must pay all costs up to the deductible amount. We estimate our reserve based on historical incident rates and costs.
Income Taxes
We account for income taxes under the asset and liability method, which requires the recognition of deferred income taxes for events that have future tax consequences. Under this method, deferred income taxes are recognized (using enacted tax laws and rates) based on the future income tax effects of differences in the carrying amounts of assets and liabilities for financial reporting and tax purposes. The effect of a tax rate change on deferred tax assets and liabilities is recognized in income in the period of change.
We recognize deferred tax assets at amounts that are expected to be realized. To make such determination, we evaluate all positive and negative evidence, including but not limited to, prior, current and future taxable income, tax planning strategies and future reversals of existing temporary differences. A valuation allowance is recognized if it is “more-likely-than-not” that some or all of a deferred tax asset will not be realized. We regularly assess the realizability of deferred tax assets.
No provision is made for undistributed earnings that are considered to be permanently reinvested to fund growth in foreign markets.
We account for uncertainty in income taxes using a "more-likely-than-not" recognition threshold. Due to the subjectivity inherent in the evaluation of uncertain tax positions, the tax benefit ultimately recognized may materially differ from our estimate. We recognize interest and penalties related to uncertain tax benefits as part of interest expense and income tax expense, respectively.
Convertible Debentures
We separately accounted for the liability and equity components of the 2029 Debentures in a manner that reflected our non-convertible debt borrowing rate. We estimated our non-convertible debt borrowing rate through a combination of discussions

21
with our financial institutions and review of relevant market data. The discounts to the convertible debt balances were amortized to interest expense, using the effective interest method, over the implicit life of the debentures.
Stock-Based Compensation
Our stock-based employee compensation plans are comprised of stock-settled stock appreciation rights, restricted stock units, and performance-based awards. Compensation cost for all stock-based awards is measured at fair value on the date of grant, and compensation cost is recognized, net of forfeitures, over the service period for awards expected to vest. The fair value of stock-settled appreciation rights and performance-based awards with market conditions is determined using the Black-Scholes and Monte Carlo simulation models, respectively. The fair value of restricted stock units with service conditions and performance-based awards with performance conditions is determined by the grant-date closing price of WESCO's common stock. Expected volatilities are based on historical volatility of our common stock. We estimate the expected life of stock-settled stock appreciation rights using historical data pertaining to option exercises and employee terminations. The risk-free rate is based on the U.S. Treasury yields in effect at the time of grant. The forfeiture assumption is based on our historical employee behavior, which we review on an annual basis. No dividends are assumed for stock-based awards.
Results of Operations
The following table sets forth the percentage relationship to net sales of certain items in our Consolidated Statements of Income and Comprehensive Income (Loss) for the periods presented.
Year Ended December 31, 2016 2015 2014
Net sales 100.0% 100.0% 100.0%Cost of goods sold 80.3 80.1 79.6Selling, general and administrative expenses 14.3 14.0 13.6Depreciation and amortization 0.9 0.9 0.9Income from operations 4.5 5.0 5.9Interest expense 1.0 0.9 1.0Loss on debt redemption 1.7 — —Income before income taxes 1.8 4.1 4.9Provision for income taxes 0.4 1.3 1.4Net income attributable to WESCO International 1.4% 2.8% 3.5%
2016 Compared to 2015
Net Sales. Net sales in 2016 decreased 2.4% to $7.34 billion, compared with $7.52 billion in 2015. Acquisitions and number of workdays positively impacted net sales by 3.1% and 0.4%, respectively, and were partially offset by a 1.0% decrease in foreign exchange rates, resulting in a 4.9% decrease in normalized organic sales.
The following table sets forth the normalized organic sales change:
Twelve Months EndedDecember 31,
Normalized Organic Sales Change: 2016 2015
Change in net sales (2.4)% (4.7)% Less: Impact from acquisitions 3.1 % 2.0 % Less: Impact from foreign exchange rates (1.0)% (3.4)% Less: Impact from number of workdays 0.4 % — % Normalized organic sales change (4.9)% (3.3)%
Note: Normalized organic sales change is a non-GAAP financial measure provided by the Company to better understand the Company's organic sales trends. Normalized organic sales change is calculated by deducting the percentage impact from acquisitions in the first year of ownership, foreign exchange rates and number of workdays from the overall percentage change in consolidated net sales.
Cost of Goods Sold. Cost of goods sold decreased 2.3% in 2016 to $5.89 billion, compared with $6.02 billion in 2015. Cost of goods sold as a percentage of net sales was 80.3% and 80.1% in 2016 and 2015, respectively.
Selling, General and Administrative (“SG&A”) Expenses. SG&A expenses include costs associated with personnel, shipping and handling, travel, advertising, facilities, utilities and bad debts. SG&A expenses decreased by $5.7 million, or

22
0.5%, to $1.05 billion in 2016. SG&A expenses decreased as the cost impact of recent acquisitions was offset by savings from headcount reductions, branch closures and consolidations, and ongoing discretionary spending cost controls. As a percentage of net sales, SG&A expenses increased to 14.3% in 2016, compared to 14.0% in 2015, reflecting lower sales volume.
SG&A payroll expenses for 2016 of $734.8 million decreased by $1.1 million compared to 2015. The decrease in SG&A payroll expenses was primarily due to a decrease in commissions, incentives and benefits.
The remaining SG&A expenses for 2016 of $314.5 million decreased by $4.6 million compared to 2015.
Depreciation and Amortization. Depreciation and amortization increased $1.9 million to $66.9 million in 2016, compared with $65.0 million in 2015.
Income from Operations. Income from operations decreased by $41.7 million to $332.0 million in 2016, compared to $373.7 million in 2015. Income from operations as a percentage of net sales was 4.5% and 5.0% in 2016 and 2015, respectively. Income from operations as a percentage of net sales decreased as the benefits resulting from cost management were offset by lower sales and gross margin.
Interest Expense. Interest expense totaled $76.6 million in 2016, compared with $69.8 million in 2015, an increase of 9.7%. Non-cash interest expense, which includes the amortization of debt discounts and debt issuance costs, and interest related to uncertain tax positions, was $7.9 million and $3.5 million for 2016 and 2015, respectively. In the fourth quarter of 2015, the resolution of transfer pricing matters associated with previously filed tax positions resulted in non-cash interest income of $9.4 million.
The following table sets forth the components of interest expense:
Twelve Months EndedDecember 31,
2016 2015
(In millions)
Amortization of debt discounts $ 3.1 $ 6.1Amortization of debt issuance costs 3.6 6.1Interest related to uncertain tax positions, net 1.2 (8.7)
Non-cash interest expense 7.9 3.5Change in accrued interest (5.6) —Cash interest expense 74.3 66.3
Total interest expense $ 76.6 $ 69.8
Loss on Debt Redemption. Loss on debt redemption of $123.9 million was the result of a non-cash charge from the early redemption of the 2029 Debentures in the third quarter of 2016.
Income Taxes. Our effective tax rate was 23.1% in 2016 compared to 31.4% in 2015. Our effective tax rate is affected by recurring items, such as the relative amounts of income earned in the United States and foreign jurisdictions, primarily Canada, the tax rates in these jurisdictions and changes in foreign currency exchange rates. The loss on debt redemption reduced income before income taxes, which decreased the effective tax rate for 2016. In 2015, the resolution of the transfer pricing matter described above resulted in incremental income tax expense, which increased the effective tax rate.
Net Income. Net income decreased by $107.3 million, or 51.5%, to $101.1 million in 2016, compared to $208.4 million in 2015. Adjusted net income for the year ended December 31, 2016 was $183.8 million.
Net Loss Attributable to Noncontrolling Interests. Net loss attributable to noncontrolling interests was $0.5 million in 2016, compared to $2.3 million in 2015. The losses in 2016 and 2015 were primarily due to foreign exchange losses on cash balances.
Net Income Attributable to WESCO International. Net income and diluted earnings per share attributable to WESCO International were $101.6 million and $2.10 per share, respectively, in 2016, compared with $210.7 million and $4.18 per share, respectively, in 2015. Adjusted net income and diluted earnings per share attributable to WESCO International were $184.3 million and $3.80 per share, respectively, for the year ended December 31, 2016.

23
The following table sets forth adjusted net income attributable to WESCO International and adjusted earnings per diluted share:
Twelve Months Ended
December 31,
Adjusted Income Before Income Taxes: 2016 2015
Income before income taxes $ 131.5 $ 303.9Loss on debt redemption 123.9 —
Adjusted income before income taxes $ 255.4 $ 303.9
Adjusted Tax Provision:Provision for income taxes $ 30.4 $ 95.5
Income tax benefit from loss on debt redemption (1) 41.2 —Adjusted provision for income taxes $ 71.6 $ 95.5
Adjusted Net Income Attributable to WESCO International:Adjusted income before income taxes $ 255.4 $ 303.9Adjusted provision for income taxes 71.6 95.5
Adjusted net income 183.8 208.4Net loss attributable to noncontrolling interests (0.5) (2.3)Adjusted net income attributable to WESCO International $ 184.3 $ 210.7
Twelve MonthsEnded
Adjusted Earnings Per Diluted Share:December 31,
2016
Diluted earnings per common share $ 2.10Loss on debt redemption (2) 2.54Tax effect of loss on debt redemption (2) (0.84)
Adjusted diluted earnings per common share $ 3.80
(1) Represents the third quarter of 2016 income tax benefit related to the loss on debt redemption.
(2) The loss on debt redemption and related income tax benefit are based on the third quarter of 2016 diluted shares of 48.7 million.
Note: Adjusted net income attributable to WESCO International, Inc. is defined as income before income taxes plus the third quarter loss on debt redemption, less the provision for income taxes excluding the third quarter benefit of such loss. Adjusted earnings per diluted share is computed by adding the loss per diluted share on debt redemption and deducting the related income tax benefit per diluted share recognized in the third quarter of 2016. The Company believes that these non-GAAP financial measures provide an overall understanding of the Company's current financial performance and a consistent measure for assessing the current and historical financial results.
2015 Compared to 2014
Net Sales. Net sales in 2015 decreased 4.7% to $7.52 billion, compared with $7.89 billion in 2014. Normalized organic sales decreased 3.3%; foreign exchange rates negatively impacted sales by 3.4% and were partially offset by a positive impact from acquisitions of 2.0%. Additionally, management estimates that price had no measurable impact on net sales.

24
The following table sets forth the normalized organic sales change:
Twelve Months EndedDecember 31,
Normalized Organic Sales Change: 2015 2014
Change in net sales (4.7)% 5.0 % Less: Impact from acquisitions 2.0 % 1.4 % Less: Impact from foreign exchange rates (3.4)% (1.6)% Less: Impact from number of workdays — % (0.4)% Normalized organic sales change (3.3)% 5.6 %
Note: Normalized organic sales change is a non-GAAP financial measure provided by the Company to better understand the Company's organic sales trends. Normalized organic sales change is calculated by deducting the percentage impact from acquisitions in the first year of ownership, foreign exchange rates and number of workdays from the overall percentage change in consolidated net sales.
Cost of Goods Sold. Cost of goods sold decreased 4.0% in 2015 to $6.02 billion, compared with $6.28 billion in 2014. Cost of goods sold as a percentage of net sales was 80.1% and 79.6% in 2015 and 2014, respectively.
Selling, General and Administrative (“SG&A”) Expenses. SG&A expenses include costs associated with personnel, shipping and handling, travel, advertising, facilities, utilities and bad debts. SG&A expenses decreased by $21.9 million, or 2.0%, to $1.06 billion in 2015. The decrease in SG&A expenses is primarily due to cost reduction actions implemented during 2015, foreign exchange rates, lower variable sales and compensation costs and ongoing discretionary spending controls. As a percentage of net sales, SG&A expenses increased to 14.0% in 2015, compared to 13.6% in 2014, reflecting lower sales volume and incremental costs related to recent acquisitions, which were not fully offset by cost control actions and initiatives.
SG&A payroll expenses for 2015 of $735.9 million decreased by $23.0 million compared to 2014. The decrease in SG&A payroll expenses was primarily due to a decrease in commissions, incentives and benefits of $16.6 million and a decrease in temporary labor of $4.7 million. These decreases were due to a 5% headcount reduction, exclusive of acquisitions, and a reduction in discretionary spending.
The remaining SG&A expenses for 2015 of $319.1 million increased by $1.2 million compared to 2014.
Depreciation and Amortization. Depreciation and amortization decreased $3.0 million to $65.0 million in 2015, compared with $68.0 million in 2014.
Income from Operations. Income from operations decreased by $92.5 million to $373.7 million in 2015, compared to $466.2 million in 2014. Income from operations as a percentage of net sales was 5.0% and 5.9% in 2015 and 2014, respectively.
Interest Expense. Interest expense totaled $69.8 million in 2015, compared with $82.1 million in 2014, a decrease of 14.9%. Non-cash interest expense, which includes the amortization of debt discounts and debt issuance costs, and interest related to uncertain tax positions, was $3.5 million and $9.5 million for 2015 and 2014, respectively. The resolution of transfer pricing matters associated with previously filed tax positions resulted in non-cash interest income of $9.4 million in the fourth quarter of 2015. Cash interest expense decreased primarily as a result of the repayment of the Canadian sub-facility of the term loans due 2019 throughout 2015.

25
The following table sets forth the components of interest expense:
Twelve Months EndedDecember 31,
2015 2014
(In millions)
Amortization of debt discounts $ 6.1 $ 4.1Amortization of debt issuance costs 6.1 4.4Interest related to uncertain tax positions, net (8.7) 1.0
Non-cash interest expense 3.5 9.5Change in accrued interest — (1.4)Cash interest expense 66.3 74.0
Total interest expense $ 69.8 $ 82.1
Income Taxes. Our effective tax rate was 31.4% in 2015 compared to 28.3% in 2014. Our effective tax rate is affected by recurring items, such as the relative amounts of income earned in the United States and foreign jurisdictions, primarily Canada, the tax rates in these jurisdictions and changes in foreign currency exchange rates. The resolution of the tax matter described above in the discussion of interest expense resulted in incremental income tax expense of $11.7 million, which increased the effective tax rate by 2.9 percentage points.
Net Income. Net income decreased by $67.1 million, or 24.3%, to $208.4 million in 2015, compared to $275.4 million in 2014.
Net Loss Attributable to Noncontrolling Interests. Net loss attributable to noncontrolling interests was $2.3 million in 2015, compared to $0.5 million in 2014. The losses in 2015 and 2014 were primarily due to foreign exchange losses on cash balances.
Net Income Attributable to WESCO International. Net income and diluted earnings per share attributable to WESCO International were $210.7 million and $4.18 per share, respectively, in 2015, compared with $275.9 million and $5.18 per share, respectively, in 2014.

26
Liquidity and Capital Resources
Total assets were $4.49 billion and $4.57 billion at December 31, 2016 and 2015, respectively. Total liabilities at December 31, 2016 and 2015 were $2.48 billion and $2.80 billion, respectively. Stockholders’ equity increased by 13.3% to $2.01 billion at December 31, 2016, compared with $1.77 billion at December 31, 2015, primarily as a result of net income of $101.6 million, the redemption of the 2029 Debentures, which excluding the loss, had a positive net impact on equity of $93.6 million, and foreign currency translation adjustments of $38.3 million.
The following table sets forth our outstanding indebtedness:
As of December 31,2016 2015
(In millions)
Accounts Receivable Securitization Facility $ 380.0 $ 525.0Revolving Credit Facility 4.0 75.0International lines of credit 20.9 43.3Term Loan Facility, less debt discount of $0.7 and $1.0 in 2016 and 2015, respectively 144.0 173.75.375% Senior Notes due 2021 500.0 500.05.375% Senior Notes due 2024 350.0 —6.0% Convertible Senior Debentures due 2029, less debt discount of $163.3 in 2015 — 181.6Capital leases 2.9 2.5
Total debt 1,401.8 1,501.1Less unamortized debt issuance costs(1) (16.5) (17.7)Less current and short-term debt (22.1) (44.3)
Total long-term debt $ 1,363.2 $ 1,439.1
(1) See Note 2 of the Notes to Consolidated Financial Statements.
The required annual principal repayments for all indebtedness for the next five years and thereafter, as of December 31, 2016, is set forth in the following table:
(In millions) 2017 $ 22.12018 380.92019 145.42020 4.12021 500.0Thereafter 350.0
Total payments on debt 1,402.5Debt discount (0.7)
Total debt $ 1,401.8
Our liquidity needs generally arise from fluctuations in our working capital requirements, capital expenditures, acquisitions and debt service obligations. As of December 31, 2016, we had $509.7 million in available borrowing capacity under our Revolving Credit Facility and $146.8 million in available borrowing capacity under our Receivables Facility, which combined with available cash of $48.1 million, provided liquidity of $704.6 million. Cash included in our determination of liquidity represents cash in deposit and interest bearing investment accounts. We believe cash provided by operations and financing activities will be adequate to cover our current operational and business needs.
We monitor the depository institutions that hold our cash and cash equivalents on a regular basis, and we believe that we have placed our deposits with creditworthy financial institutions. We also communicate on a regular basis with our lenders regarding our financial and working capital performance, liquidity position and financial leverage. Our financial leverage ratio was 3.5 and 3.8 as of December 31, 2016 and 2015, respectively. In addition, we are in compliance with all covenants and restrictions contained in our debt agreements as of December 31, 2016.
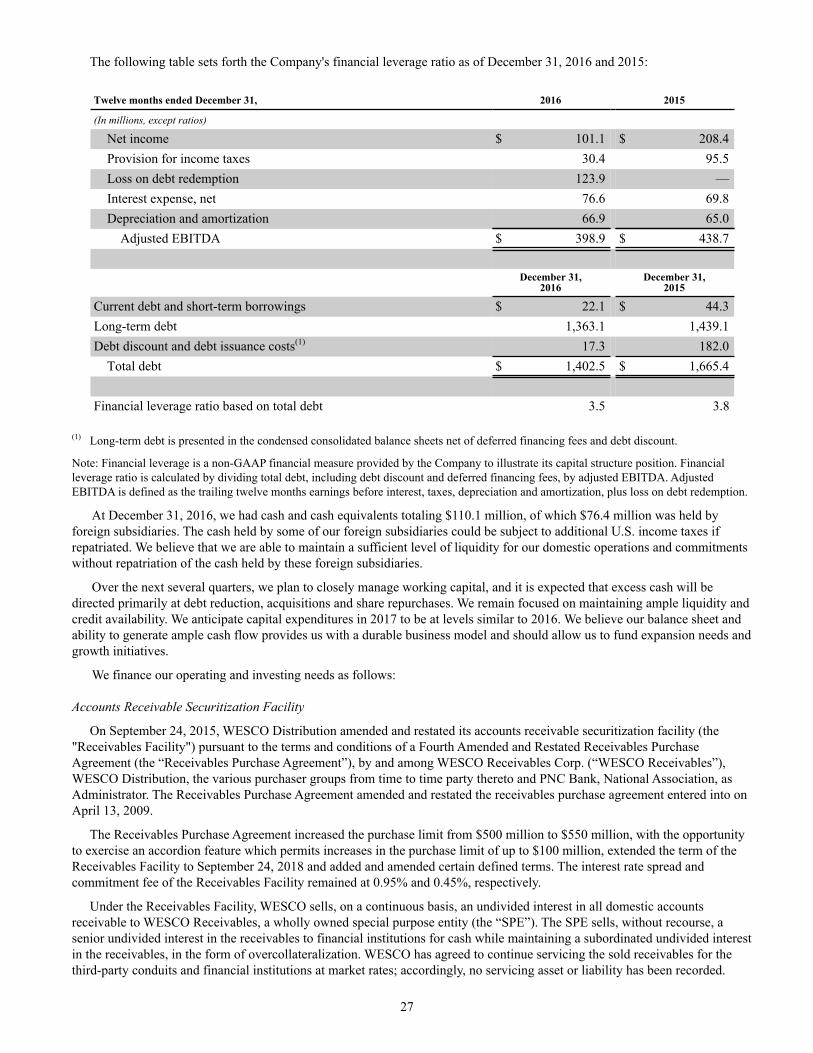
27
The following table sets forth the Company's financial leverage ratio as of December 31, 2016 and 2015:
Twelve months ended December 31, 2016 2015
(In millions, except ratios)
Net income $ 101.1 $ 208.4 Provision for income taxes 30.4 95.5 Loss on debt redemption 123.9 — Interest expense, net 76.6 69.8 Depreciation and amortization 66.9 65.0 Adjusted EBITDA $ 398.9 $ 438.7
December 31,2016
December 31,2015
Current debt and short-term borrowings $ 22.1 $ 44.3Long-term debt 1,363.1 1,439.1Debt discount and debt issuance costs(1) 17.3 182.0 Total debt $ 1,402.5 $ 1,665.4
Financial leverage ratio based on total debt 3.5 3.8
(1) Long-term debt is presented in the condensed consolidated balance sheets net of deferred financing fees and debt discount.
Note: Financial leverage is a non-GAAP financial measure provided by the Company to illustrate its capital structure position. Financial leverage ratio is calculated by dividing total debt, including debt discount and deferred financing fees, by adjusted EBITDA. Adjusted EBITDA is defined as the trailing twelve months earnings before interest, taxes, depreciation and amortization, plus loss on debt redemption.
At December 31, 2016, we had cash and cash equivalents totaling $110.1 million, of which $76.4 million was held by foreign subsidiaries. The cash held by some of our foreign subsidiaries could be subject to additional U.S. income taxes if repatriated. We believe that we are able to maintain a sufficient level of liquidity for our domestic operations and commitments without repatriation of the cash held by these foreign subsidiaries.
Over the next several quarters, we plan to closely manage working capital, and it is expected that excess cash will be directed primarily at debt reduction, acquisitions and share repurchases. We remain focused on maintaining ample liquidity and credit availability. We anticipate capital expenditures in 2017 to be at levels similar to 2016. We believe our balance sheet and ability to generate ample cash flow provides us with a durable business model and should allow us to fund expansion needs and growth initiatives.
We finance our operating and investing needs as follows:
Accounts Receivable Securitization Facility
On September 24, 2015, WESCO Distribution amended and restated its accounts receivable securitization facility (the "Receivables Facility") pursuant to the terms and conditions of a Fourth Amended and Restated Receivables Purchase Agreement (the “Receivables Purchase Agreement”), by and among WESCO Receivables Corp. (“WESCO Receivables”), WESCO Distribution, the various purchaser groups from time to time party thereto and PNC Bank, National Association, as Administrator. The Receivables Purchase Agreement amended and restated the receivables purchase agreement entered into on April 13, 2009.
The Receivables Purchase Agreement increased the purchase limit from $500 million to $550 million, with the opportunity to exercise an accordion feature which permits increases in the purchase limit of up to $100 million, extended the term of the Receivables Facility to September 24, 2018 and added and amended certain defined terms. The interest rate spread and commitment fee of the Receivables Facility remained at 0.95% and 0.45%, respectively.
Under the Receivables Facility, WESCO sells, on a continuous basis, an undivided interest in all domestic accounts receivable to WESCO Receivables, a wholly owned special purpose entity (the “SPE”). The SPE sells, without recourse, a senior undivided interest in the receivables to financial institutions for cash while maintaining a subordinated undivided interest in the receivables, in the form of overcollateralization. WESCO has agreed to continue servicing the sold receivables for the third-party conduits and financial institutions at market rates; accordingly, no servicing asset or liability has been recorded.
28
As of December 31, 2016 and 2015, accounts receivable eligible for securitization totaled approximately $657.5 million and $684.7 million, respectively. The Consolidated Balance Sheets as of December 31, 2016 and 2015 include $380.0 million and $525.0 million, respectively, of account receivable balances legally sold to third parties, as well as borrowings for equal amounts. At December 31, 2016, the interest rate on borrowings under this facility was approximately 1.4%.
Revolving Credit Facility
On September 24, 2015, WESCO International, WESCO Distribution and certain other subsidiaries of the Company entered into a $600 million revolving credit facility (the “Revolving Credit Facility”), which contains a letter of credit sub-facility of up to $125 million, pursuant to the terms and conditions of a Second Amended and Restated Credit Agreement (the "Credit Agreement"). The Revolving Credit Facility contains an accordion feature allowing WESCO Distribution to request increases to the borrowing commitments, subject to customary conditions. This accordion feature increased from $100 million to $200 million in the aggregate. The Revolving Credit Facility replaced WESCO Distribution’s prior revolving credit facility entered into on December 12, 2012.
The Revolving Credit Facility matures in September 2020 and consists of two separate sub-facilities: (i) a Canadian sub-facility with a borrowing limit of up to $400 million, which is collateralized by substantially all assets of WESCO Canada and the other Canadian Borrowers, other than, among other things, real property, in each case, subject to customary exceptions and limitations, and (ii) a U.S sub-facility with a borrowing limit of up to $600 million less the amount of outstanding borrowings under the Canadian sub-facility. The U.S. sub-facility is collateralized by substantially all assets of WESCO Distribution and its subsidiaries which are party to the Credit Agreement, other than, among other things, real property and accounts receivable sold or intended to be sold pursuant to the Receivables Purchase Agreement. The applicable interest rate for borrowings under the Revolving Credit Facility includes interest rate spreads based on available borrowing capacity that range between 1.25% and 1.75% for LIBOR-based borrowings and 0.25% and 0.75% for prime rate-based borrowings. At December 31, 2016, the interest rate on borrowings under this facility was approximately 2.0%.
The Credit Agreement requires ongoing compliance with certain customary affirmative and negative covenants. The Credit Agreement also contains customary events of default.
During 2016, WESCO borrowed $1,025.8 million under the Revolving Credit Facility and made repayments in the aggregate amount of $1,096.8 million. During 2015, aggregate borrowings and repayments were $1,276.0 million and $1,209.0 million, respectively. WESCO had $509.7 million available under the Revolving Credit facility at December 31, 2016, after giving effect to outstanding letters and international lines of credit, as compared to approximately $438.7 million million at December 31, 2015.
International Lines of Credit
Certain foreign subsidiaries of WESCO have entered into uncommitted lines of credit, which serve as overdraft facilities, to support local operations. The maximum borrowing limit varies by facility and ranges between $0.3 million and $21.0 million. The applicable interest rate for borrowings under these lines of credit varies by country and is governed by the applicable loan agreement. The international lines of credit are renewable on an annual basis and certain facilities are fully and unconditionally guaranteed by WESCO Distribution. Accordingly, borrowings under these lines directly reduce availability under the Revolving Credit Facility.
Term Loan Facility On December 12, 2012, WESCO Distribution, as U.S. borrower, WDCC Enterprises Inc. ("WDCC" and together with
WESCO Distribution, the “Borrowers”), as Canadian borrower, and WESCO International entered into a Term Loan Agreement (the “Term Loan Agreement”) among WESCO Distribution, WDCC, the Company, the lenders party thereto and Credit Suisse AG Cayman Islands Branch, as administrative agent and as collateral agent.
The Term Loan Agreement provided a seven-year term loan facility (the “Term Loan Facility”), which consisted of two separate sub-facilities: (i) a Canadian sub-facility in an aggregate principal amount of CAD150 million, issued at a 2.0% discount, and (ii) a U.S. sub-facility in an aggregate principal amount of $700 million, issued at a 1.0% discount. The proceeds of the Term Loan Facility were used to finance the acquisition of EECOL, and to pay fees and expenses incurred in connection with the acquisition and certain other transactions. Subject to the terms of the Term Loan Agreement, the Borrowers may request incremental term loans from time to time in an aggregate principal amount not to exceed at any time $300 million, with an equivalent principal amount in U.S. dollars being calculated for any incremental term loan denominated in Canadian dollars.
On November 19, 2013, the Borrowers and WESCO International entered into an amendment (the “Term Loan Amendment”) to the Term Loan Agreement. The Term Loan Amendment, among other things, reduced the applicable margin on U.S. term loans by 0.50% and the LIBOR floor applicable to the U.S. sub-facility from 1.00% to 0.75%. The modified pricing terms were effective December 13, 2013.

29
On November 26, 2013, WESCO Distribution sold $500 million aggregate principal amount of 5.375% Senior Notes due 2021 (the “2021 Notes”), and used the net proceeds plus excess cash to prepay $500 million under the Company's U.S. sub-facility of the Term Loan Facility (see discussion below under “5.375% Senior Notes due 2021” for additional information). The prepayment satisfied all remaining quarterly repayment obligations under the U.S. sub-facility. As of December 31, 2016, the amount outstanding under the U.S. sub-facility was $144.8 million. The Canadian sub-facility was fully repaid in 2015 using cash provided by Canadian operations.
Borrowings under the Term Loan Facility bear interest at base rates plus applicable margins. At December 31, 2016, the interest rate on borrowings under the U.S. sub-facility was 4.0%. To the extent not previously paid, the outstanding U.S. sub-facility will become due and payable on December 12, 2019, with any unpaid incremental term loans becoming due and payable on the respective maturity dates applicable to those incremental term loans. At any time or from time to time, the Borrowers may prepay borrowings under the Term Loan Facility in whole or in part without premium or penalty. The Borrowers' obligations under the Term Loan Facility are secured by substantially all of the assets of the Borrowers, the Company and certain of the Company's other subsidiaries; provided that, with respect to borrowings under the U.S. sub-facility, the collateral does not include assets of certain foreign subsidiaries or more than 65% of the issued and outstanding equity interests in certain foreign subsidiaries.
The Term Loan Facility contains customary affirmative and negative covenants for credit facilities of this type. The Term Loan Facility also provides for customary events of default.
5.375% Senior Notes due 2021
In November 2013, WESCO Distribution issued $500 million aggregate principal amount of 2021 Notes through a private offering exempt from the registration requirements of the Securities Act of 1933, as amended (the “Securities Act”). The 2021 Notes were issued at 100% of par and are governed by an indenture (the “2021 Indenture”) entered into on November 26, 2013 with WESCO International and U.S. Bank National Association, as trustee. The 2021 Notes are unsecured senior obligations of WESCO Distribution and are guaranteed on a senior unsecured basis by WESCO International. The 2021 Notes bear interest at a stated rate of 5.375%, payable semi-annually in arrears on June 15 and December 15 of each year. In addition, we incurred costs related to the issuance of the 2021 Notes totaling $8.4 million, which are recorded as a reduction to the carrying value of the debt and are being amortized over the life of the notes. The 2021 Notes mature on December 15, 2021. The net proceeds of the 2021 Notes were used to prepay a portion of the U.S. sub-facility of the term loans due 2019.
Under the terms of a registration rights agreement dated as of November 26, 2013 among WESCO Distribution, WESCO International and Merrill Lynch, Pierce, Fenner & Smith Incorporated, as the representative of the initial purchasers of the 2021 Notes, WESCO Distribution and WESCO International agreed to register under the Securities Act notes having terms identical in all material respects to the 2021 Notes (the “2021 Exchange Notes”) and to make an offer to exchange the 2021 Exchange Notes for the 2021 Notes. WESCO Distribution launched the exchange offer on June 12, 2014 and the exchange offer expired on July 17, 2014.
At any time on or after December 15, 2016, WESCO Distribution may redeem all or a part of the 2021 Notes. Between December 15, 2016 and December 14, 2017, WESCO Distribution may redeem all or a part of the 2021 Notes at a redemption price equal to 104.031% of the principal amount. Between December 15, 2017 and December 14, 2018, WESCO Distribution may redeem all or a part of the 2021 Notes at a redemption price equal to 102.688% of the principal amount. Between December 15, 2018 and December 14, 2019, WESCO Distribution may redeem all or a part of the 2021 Notes at a redemption price equal to 101.344% of the principal amount. On and after December 15, 2019, WESCO Distribution may redeem all or a part of the 2021 Notes at a redemption price equal to 100% of the principal amount.
The 2021 Indenture contains customary covenants and customary events of default. In addition, upon a change of control, the holders of 2021 Notes have the right to require WESCO Distribution to repurchase all or any part of the 2021 Notes at a redemption price equal to 101% of the principal amount, plus accrued and unpaid interest.
5.375% Senior Notes due 2024
In June 2016, WESCO Distribution issued $350 million aggregate principal amount of 5.375% Senior Notes due 2024 (the "2024 Notes") through a private offering exempt from the registration requirements of the Securities Act. The 2024 Notes were issued at 100% of par and are governed by an indenture (the “2024 Indenture”) entered into on June 15, 2016 among WESCO Distribution, as issuer, WESCO International, as parent guarantor, and U.S. Bank National Association, as trustee. The 2024 Notes are unsecured senior obligations of WESCO Distribution and are guaranteed on a senior unsecured basis by WESCO International. The 2024 Notes bear interest at a rate of 5.375% per annum, payable semi-annually in arrears on June 15 and December 15 of each year, commencing on December 15, 2016. We incurred costs totaling $6.0 million to issue the 2024 Notes, which are recorded as a reduction to the carrying value of the debt and are being amortized over the life of the note. The notes mature on June 15, 2024. The Company used the net proceeds to redeem its 2029 Debentures on September 15, 2016.

30
Under the terms of a registration rights agreement dated as of June 15, 2016 among WESCO Distribution, as the issuer, WESCO International, as parent guarantor, and Goldman, Sachs & Co., as representative of the initial purchasers of the 2024 Notes, WESCO Distribution and WESCO International agreed to register under the Securities Act notes having terms identical in all material respects to the 2024 Notes (the “2024 Exchange Notes”) and to make an offer to exchange the 2024 Exchange Notes for the 2024 Notes. WESCO Distribution launched the exchange offer on December 28, 2016 and the exchange offer expired on January 31, 2017.
At any time on or after June 15, 2019, WESCO Distribution may redeem all or a part of the 2024 Notes. Between June 15, 2019 and June 14, 2020, WESCO Distribution may redeem all or a part of the 2024 Notes at a redemption price equal to 104.031% of the principal amount. Between June 15, 2020 and June 14, 2021, WESCO Distribution may redeem all or a part of the 2024 Notes at a redemption price equal to 102.688% of the principal amount. Between June 15, 2021 and June 14, 2022, WESCO Distribution may redeem all or a part of the 2024 Notes at a redemption price equal to 101.344% of the principal amount. On and after June 15, 2022, WESCO Distribution may redeem all or a part of the 2024 Notes at a redemption price equal to 100% of the principal amount.
The 2024 Indenture contains customary covenants and events of default. Upon a change of control, the holders of the 2024 Notes have the right to require WESCO Distribution to repurchase all or any part of the 2024 Notes at a redemption price equal to 101% of the principal amount thereof, plus accrued and unpaid interest.
6.0% Convertible Senior Debentures due 2029
On August 27, 2009, WESCO International completed an exchange offer pursuant to which it issued $345 million in aggregate principal amount of the 2029 Debentures. The 2029 Debentures were issued pursuant to an Indenture dated August 27, 2009, with The Bank of New York Mellon, as trustee, and were unconditionally guaranteed on an unsecured senior subordinate basis by WESCO Distribution.
We separately accounted for the liability and equity components of the 2029 Debentures in a manner that reflected our non-convertible debt borrowing rate. We utilized an interest rate of 13.875% to reflect the non-convertible debt borrowing rate of our offering upon issuance, which was determined based on discussions with our financial institutions and a review of relevant market data, and resulted in a $181.2 million discount to the 2029 Debenture balance and a net increase in additional capital of $106.5 million. As of December 31, 2015, the net equity included in additional capital related to the 2029 Debentures totaled $106.3 million. In addition, the financing costs incurred to issue the 2029 Debentures were allocated between the instrument's debt and equity components. We amortized the discount and financing costs over the life of the debt. For the years ended December 31, 2016, 2015 and 2014, non-cash interest expense for the amortization of the debt discount and debt issuance costs was $3.1 million, $4.2 million and $3.8 million, respectively.
On September 15, 2016, we redeemed the 2029 Debentures. Holders of the 2029 Debentures received cash totaling $344.8 million, which was equal to the principal amount of the then-outstanding Debentures, in addition to accrued and unpaid interest. Holders who surrendered the 2029 Debentures for conversion received 18 shares of our stock for each $1,000 principal amount of 2029 Debentures converted. In total, 6,267,688 shares were issued on the redemption date. The redemption resulted in a non-cash loss of $123.9 million, which included the write off of unamortized discount and debt issuance costs.
The following table sets forth the components of WESCO's outstanding convertible debenture indebtedness:
December 31, 2016 December 31, 2015
PrincipalBalance Discount
Net CarryingAmount
PrincipalBalance Discount
Net CarryingAmount
(In millions) 2029 Convertible Debentures $ — — $ — $ 344.9 (163.3) $ 181.6
Covenant Compliance
We were in compliance with all relevant covenants contained in our debt agreements as of December 31, 2016.

31
Cash Flow
An analysis of cash flows for 2016 and 2015 follows:
Operating Activities. Cash provided by operating activities for 2016 totaled $300.2 million, compared with $283.1 million of cash generated in 2015. Cash provided by operating activities included net income of $101.1 million and adjustments to net income totaling $159.3 million, which included a loss on the redemption of our convertible debt of $123.9 million. Other sources of cash in 2016 were generated from a decrease in trade receivables of $56.8 million, an increase in other current and noncurrent liabilities of $15.7 million, and a decrease in prepaid expenses and other noncurrent assets of $13.2 million. Primary uses of cash in 2016 included a $40.6 million decrease in accounts payable, a $1.9 million decrease in accrued payroll and benefit costs, and decreases in other accounts receivable and inventories of $1.6 million. In 2015, primary sources of cash were net income of $208.4 million and adjustments to net income totaling $121.2 million. Other sources of cash in 2015 were generated from decreases in other accounts receivable of $57.2 million, trade receivables of $40.1 million and inventories of $2.4 million. Primary uses of cash in 2015 included a $66.8 million decrease in other current and noncurrent liabilities, a $55.9 million decrease in accounts payable, a $15.0 million decrease in accrued payroll and benefit costs, and a $8.5 million increase in prepaid expenses and other noncurrent assets.
Investing Activities. Net cash used in investing activities in 2016 was $70.5 million, compared with $170.2 million of net cash used in 2015. Capital expenditures were $18.0 million and $21.7 million in 2016 and 2015, respectively. Proceeds from the sale of assets were $8.4 million and $3.0 million in 2016 and 2015, respectively. During 2016, the Company had $50.9 million of acquisition payments, primarily related to Atlanta Electrical Distributors, LLC, compared to $151.6 million in 2015, primarily to acquire Hill Country Electric Supply, LP and Needham Electric Supply Corporation. Other investing activities in 2016 were $10.0 million.
Financing Activities. Net cash used in financing activities in 2016 was $276.3 million, compared with $67.8 million in 2015. During 2016, financing activities consisted of borrowings and repayments of $1.03 billion and $1.10 billion, respectively, related to our Revolving Credit Facility, borrowings and repayments of $706.9 million and $851.9 million, respectively, related to our Receivables Facility, proceeds from the issuance of the 2024 Notes of $350.0 million, a payment of $344.8 million to redeem the 2029 Debentures and repayments of $30.0 million applied to our Term Loan Facility. Financing activities in 2016 also included borrowings and repayments on our various international lines of credit of $111.5 million and $131.5 million, respectively. During 2015, financing activities consisted of borrowings and repayments of $1.28 billion and $1.21 billion, respectively, related to our Revolving Credit Facility, borrowings and repayments of $252.6 million and $157.6 million, respectively, related to our Receivables Facility, and repayments of $69.2 million related to our Term Loan Facility. Financing activities in 2015 also included borrowings and repayments on our various international lines of credit of $102.0 million and $100.3 million, respectively. Additionally, financing activities in 2015 included the repurchase of $155.8 million of the Company's common stock, $150.0 million of which was pursuant to the repurchase plan announced on December 17, 2014.
Contractual Cash Obligations and Other Commercial Commitments
The following summarizes our contractual obligations, including interest, at December 31, 2016 and the effect such obligations are expected to have on liquidity and cash flow in future periods.
2017 2018 to 2019 2020 to 2021 2022 - After Total(In millions) Contractual cash obligations (including interest): Debt, excluding debt discount and debt issuance costs $ 22.1 $ 526.3 $ 504.1 $ 350.0 $ 1,402.5 Interest on indebtedness(1) 58.3 106.7 90.3 47.0 302.3 Non-cancelable operating leases 68.3 103.3 57.3 49.7 278.6Total contractual cash obligations $ 148.7 $ 736.3 $ 651.7 $ 446.7 $ 1,983.4
(1) Interest on the variable rate debt was calculated using the rates and balances outstanding at December 31, 2016.
Purchase orders for inventory requirements and service contracts are not included in the table above. Generally, our purchase orders and contracts contain clauses allowing for cancellation. We do not have significant agreements to purchase material or goods that would specify minimum order quantities. Also, we do not consider liabilities for uncertain tax benefits to be contractual obligations requiring disclosure due to the uncertainty surrounding the ultimate settlement and timing of these liabilities. As such, we have not included liabilities for uncertain tax benefits of $7.0 million in the table above.
32
Inflation
The rate of inflation, as measured by changes in the producer price index, affects different commodities, the cost of products purchased and ultimately the pricing of our different products and product classes to our customers. Our pricing related to inflation did not have a measurable impact on our sales revenue. Historically, price changes from suppliers have been consistent with inflation and have not had a material impact on the results of operations.
Seasonality
Sales during the first quarter are affected by a reduced level of activity. Sales during the second, third and fourth quarters are generally 5 - 7% higher than the first quarter. Sales typically increase beginning in March, with slight fluctuations per month through October. During periods of economic expansion or contraction our sales by quarter have varied significantly from this pattern.
Impact of Recently Issued Accounting Standards
See Note 2 of the Notes to the Consolidated Financial Statements for information regarding the effect of new accounting pronouncements.
Item 7A. Quantitative and Qualitative Disclosures about Market Risks.
Foreign Currency Risks
Approximately 23% of our sales in 2016 were made by our foreign subsidiaries located in North America, South America, Europe, Africa, and Asia and are denominated in foreign currencies. We may establish additional foreign subsidiaries in the future. Accordingly, we may derive a larger portion of our sales from international operations, and a portion of these sales may be denominated in foreign currencies. As a result, our future operating results could become subject to fluctuations in foreign exchange rates relative to the U.S. dollar. Furthermore, to the extent that we engage in international sales denominated in U.S. dollars, an increase in the value of the U.S. dollar relative to foreign currencies could make our products less competitive in international markets. We have monitored and will continue to monitor our exposure to currency fluctuations.
Interest Rate Risk
Fixed Rate Borrowings: Approximately 61% of our debt portfolio is comprised of fixed rate debt. At various times, we have refinanced our debt to mitigate the impact of interest rate fluctuations. As the 2021 Notes and 2024 Notes were issued at fixed rates, interest expense would not be impacted by interest rate fluctuations, although market value would be. For the 2021 Notes and 2024 Notes, fair value approximated carrying value (see Note 7 to the Consolidated Financial Statements).
Floating Rate Borrowings: The Company's variable rate borrowings at December 31, 2016 were comprised of the amounts outstanding under the Term Loan Facility, Receivables Facility, Revolving Credit Facility, and the international lines of credit. The fair value of these debt instruments at December 31, 2016 approximated carrying value. We entered into the Term Loan Facility on December 12, 2012 and the proceeds were primarily used to finance the acquisition of EECOL. Borrowings under the U.S. sub-facility of the Term Loan Facility bear interest at 0.75% or, if greater, the applicable LIBOR (London Interbank Offered Rate) or base rates plus applicable margins and therefore are subject to fluctuations in interest rates. We borrow under our Revolving Credit Facility and Receivables Facility for general corporate purposes, including working capital requirements and capital expenditures. Borrowings under our Revolving Credit Facility bear interest at the applicable LIBOR / CDOR (Canadian Dealer Offered Rate) or base rates plus applicable margins, whereas borrowings under the Receivables Facility bear interest at the 30 day LIBOR plus applicable margins. A 100 basis point increase or decrease in interest rates would not have a significant impact on future earnings under our current capital structure.

33
Item 8. Financial Statements and Supplementary Data.
The information required by this item is set forth in our Consolidated Financial Statements contained in this Annual Report on Form 10-K. Specific financial statements can be found at the pages listed below:
PAGE
Report of Independent Registered Public Accounting FirmConsolidated Balance Sheets as of December 31, 2016 and 2015Consolidated Statements of Income and Comprehensive Income (Loss) for the years ended
December 31, 2016, 2015 and 2014Consolidated Statements of Stockholders’ Equity for the years ended December 31, 2016, 2015 and 2014Consolidated Statements of Cash Flows for the years ended December 31, 2016, 2015 and 2014Notes to Consolidated Financial Statements
3435
36373839

34
Report of Independent Registered Public Accounting Firm
To the Board of Directors and Shareholders of WESCO International, Inc.:
In our opinion, the accompanying consolidated balance sheets and the related consolidated statements of income and comprehensive income (loss), stockholders’ equity and cash flows present fairly, in all material respects, the financial position of WESCO International, Inc. and its subsidiaries at December 31, 2016 and 2015, and the results of their operations and their cash flows for each of the three years in the period ended December 31, 2016 in conformity with accounting principles generally accepted in the United States of America. In addition, in our opinion, the financial statement schedule listed in the index appearing under Item 15(a)(2) presents fairly, in all material respects, the information set forth therein when read in conjunction with the related consolidated financial statements. Also in our opinion, the Company maintained, in all material respects, effective internal control over financial reporting as of December 31, 2016, based on criteria established in Internal Control - Integrated Framework (2013) issued by the Committee of Sponsoring Organizations of the Treadway Commission (COSO). The Company's management is responsible for these financial statements and financial statement schedule, for maintaining effective internal control over financial reporting and for its assessment of the effectiveness of internal control over financial reporting, included in Management's Report on Internal Control over Financial Reporting appearing under Item 9A. Our responsibility is to express opinions on these financial statements, on the financial statement schedule, and on the Company's internal control over financial reporting based on our integrated audits. We conducted our audits in accordance with the standards of the Public Company Accounting Oversight Board (United States). Those standards require that we plan and perform the audits to obtain reasonable assurance about whether the financial statements are free of material misstatement and whether effective internal control over financial reporting was maintained in all material respects. Our audits of the financial statements included examining, on a test basis, evidence supporting the amounts and disclosures in the financial statements, assessing the accounting principles used and significant estimates made by management, and evaluating the overall financial statement presentation. Our audit of internal control over financial reporting included obtaining an understanding of internal control over financial reporting, assessing the risk that a material weakness exists, and testing and evaluating the design and operating effectiveness of internal control based on the assessed risk. Our audits also included performing such other procedures as we considered necessary in the circumstances. We believe that our audits provide a reasonable basis for our opinions.
As disclosed in Note 2 to the consolidated financial statements, the Company changed the manner in which it accounts for the presentation of deferred income taxes and debt issuance costs in 2016.
A company’s internal control over financial reporting is a process designed to provide reasonable assurance regarding the reliability of financial reporting and the preparation of financial statements for external purposes in accordance with generally accepted accounting principles. A company’s internal control over financial reporting includes those policies and procedures that (i) pertain to the maintenance of records that, in reasonable detail, accurately and fairly reflect the transactions and dispositions of the assets of the company; (ii) provide reasonable assurance that transactions are recorded as necessary to permit preparation of financial statements in accordance with generally accepted accounting principles, and that receipts and expenditures of the company are being made only in accordance with authorizations of management and directors of the company; and (iii) provide reasonable assurance regarding prevention or timely detection of unauthorized acquisition, use, or disposition of the company’s assets that could have a material effect on the financial statements.
Because of its inherent limitations, internal control over financial reporting may not prevent or detect misstatements. Also, projections of any evaluation of effectiveness to future periods are subject to the risk that controls may become inadequate because of changes in conditions, or that the degree of compliance with the policies or procedures may deteriorate.
/s/ PricewaterhouseCoopers LLP
Pittsburgh, Pennsylvania
February 22, 2017

WESCO INTERNATIONAL, INC. AND SUBSIDIARIES
35
CONSOLIDATED BALANCE SHEETSDecember 31,
2016 2015(In thousands,
except share data)Assets
Current Assets:Cash and cash equivalents $ 110,131 $ 160,279Trade accounts receivable, net of allowance for doubtful accounts of $22,007 and $22,587
in 2016 and 2015, respectively 1,034,402 1,075,257Other accounts receivable 85,019 81,242Inventories 821,441 810,067Current deferred income taxes (Note 2) — 8,455Income taxes receivable 72,881 73,814Prepaid expenses and other current assets 48,583 48,420
Total current assets 2,172,457 2,257,534Property, buildings and equipment, net (Note 6) 157,607 166,739Intangible assets, net (Note 3) 393,362 403,649Goodwill (Note 3) 1,720,714 1,681,662Deferred income taxes (Note 9) 15,803 18,221Other assets 31,041 41,921
Total assets $ 4,490,984 $ 4,569,726Liabilities and Stockholders’ Equity
Current Liabilities:Accounts payable $ 684,721 $ 715,519Accrued payroll and benefit costs (Note 11) 49,250 51,258Short-term debt (Note 7) 20,920 43,314Current portion of long-term debt (Note 7) 1,218 1,025Bank overdrafts 29,384 34,170Income taxes payable 32,879 29,212Other current liabilities 78,425 73,303
Total current liabilities 896,797 947,801Long-term debt, net of debt discount and debt issuance costs of $17,278 and $182,041
in 2016 and 2015, respectively (Note 7) 1,363,135 1,439,062Deferred income taxes (Note 9) 158,009 364,838Other noncurrent liabilities 63,031 44,154
Total liabilities $ 2,480,972 $ 2,795,855Commitments and contingencies (Note 13)Stockholders’ Equity:
Preferred stock, $.01 par value; 20,000,000 shares authorized, no shares issued oroutstanding (Note 8) — —
Common stock, $.01 par value; 210,000,000 shares authorized, 58,817,781 and 58,597,380shares issued and 48,611,497 and 42,173,790 shares outstanding in 2016 and 2015,respectively (Note 8) 588 586
Class B nonvoting convertible common stock, $.01 par value; 20,000,000 shares authorized,4,339,431 issued and no shares outstanding in 2016 and 2015, respectively 43 43
Additional capital 986,020 1,117,421Retained earnings 1,956,532 1,854,456Treasury stock, at cost; 14,545,715 and 20,763,021 shares in 2016 and 2015, respectively (542,537) (772,679)Accumulated other comprehensive loss (387,365) (423,155)
Total WESCO International, Inc. stockholders' equity 2,013,281 1,776,672Noncontrolling interests (3,269) (2,801) Total stockholders’ equity 2,010,012 1,773,871 Total liabilities and stockholders’ equity $ 4,490,984 $ 4,569,726
The accompanying notes are an integral part of the consolidated financial statements.

WESCO INTERNATIONAL, INC. AND SUBSIDIARIES
36
CONSOLIDATED STATEMENTS OF INCOME AND COMPREHENSIVE INCOME (LOSS)
Year Ended December 31, 2016 2015 2014 (In thousands, except per share data)
Net sales $ 7,336,017 $ 7,518,487 $ 7,889,626Cost of goods sold (excluding depreciation and amortization) 5,887,814 6,024,826 6,278,584Selling, general and administrative expenses 1,049,286 1,054,951 1,076,808Depreciation and amortization 66,858 64,968 68,017
Income from operations 332,059 373,742 466,217Interest expense, net 76,575 69,832 82,064Loss on debt redemption (Note 7) 123,933 — —
Income before income taxes 131,551 303,910 384,153Provision for income taxes (Note 9) 30,431 95,537 108,716
Net income 101,120 208,373 275,437Less: Net loss attributable to noncontrolling interests (468) (2,314) (469) Net income attributable to WESCO International, Inc. $ 101,588 $ 210,687 $ 275,906Other comprehensive income (loss): Foreign currency translation adjustment 38,275 (225,795) (120,293) Post retirement benefit plan adjustment, net of tax (Note 11) (2,485) 4,532 (5,056) Comprehensive income (loss) attributable to WESCO International, Inc. $ 137,378 $ (10,576) $ 150,557
Earnings per share attributable to WESCO International, Inc. (Note 10) Basic $ 2.30 $ 4.85 $ 6.21Diluted $ 2.10 $ 4.18 $ 5.18
The accompanying notes are an integral part of the consolidated financial statements.

WE
SCO
INT
ER
NAT
ION
AL
, IN
C. A
ND
SU
BSI
DIA
RIE
S
37
CO
NSO
LID
AT
ED
ST
AT
EM
EN
TS
OF
STO
CK
HO
LD
ER
S’ E
QU
ITY
Acc
umul
ated
Oth
er
Cla
ss B
R
etai
ned
Com
preh
ensi
ve
Com
mon
Sto
ckC
omm
on S
tock
Add
ition
alE
arni
ngs
Tre
asur
y St
ock
Non
cont
rolli
ngIn
com
e(I
n th
ousa
nds)
Am
ount
Shar
esA
mou
ntSh
ares
Cap
ital
(Def
icit)
Am
ount
Shar
esIn
tere
sts
(Los
s)
Bal
ance
, Dec
embe
r 31
, 201
3$
581
58,1
07,3
04$
434,
339,
431
$1,
082,
772
$1,
368,
386
$(6
10,4
30)
(18,
179,
275)
$(1
8)$
(76,
543)
Exer
cise
of s
tock
-bas
ed a
war
ds, i
nclu
ding
tax
bene
fit o
f $4,
899
330
8,39
9
5,
741
(5
,936
)(7
0,90
3)
Stoc
k-ba
sed
com
pens
atio
n ex
pens
e14
,766
Con
vers
ion
of 2
029
Deb
entu
res,
net o
f tax
—13
4(1
)Ta
x w
ithho
ldin
g re
late
d to
ves
ting
ofre
stric
ted
stoc
k un
its a
nd re
tirem
ent o
fco
mm
on st
ock
—(1
5,10
1 )(9
09)
(378
)N
onco
ntro
lling
inte
rest
s(4
69)
Net
inco
me
275,
906
Tran
slat
ion
adju
stm
ent
(120
,293
)B
enef
it pl
an a
djus
tmen
ts, n
et o
f tax
eff
ect
of $
2,44
7(5
,056
)B
alan
ce, D
ecem
ber
31, 2
014
$58
458
,400
,736
$43
4,33
9,43
1$
1,10
2,36
9$
1,64
3,91
4$
(616
,366
)(1
8,25
0,17
8)$
(487
)$
(201
,892
)Ex
erci
se o
f sto
ck-b
ased
aw
ards
, inc
ludi
ngta
x be
nefit
of $
1,40
32
230,
206
1,34
4
(3,3
00)
(44,
267)
St
ock-
base
d co
mpe
nsat
ion
expe
nse
12,8
99C
onve
rsio
n of
202
9 D
eben
ture
s, ne
t of t
ax—
427
(2)
Rep
urch
ase
of c
omm
on st
ock
3,01
3(1
53,0
13)
(2,4
68,5
76)
Tax
with
hold
ing
rela
ted
to v
estin
g of
rest
ricte
d st
ock
units
and
retir
emen
t of
com
mon
stoc
k—
(33,
989 )
(2,2
02)
(145
)N
onco
ntro
lling
inte
rest
s(2
,314
)N
et in
com
e21
0,68
7Tr
ansl
atio
n ad
just
men
t(2
25,7
95)
Ben
efit
plan
adj
ustm
ents
, net
of t
ax e
ffec
tof
$1,
661
4,53
2B
alan
ce, D
ecem
ber
31, 2
015
$58
658
,597
,380
$43
4,33
9,43
1$
1,11
7,42
1$
1,85
4,45
6$
(772
,679
)(2
0,76
3,02
1)$
(2,8
01)
$(4
23,1
55)
Exer
cise
of s
tock
-bas
ed a
war
ds, i
nclu
ding
tax
expe
nse
of $
672
230,
464
(2,8
76)
(3
,224
)(4
4,19
1)
Stoc
k-ba
sed
com
pens
atio
n ex
pens
e12
,493
Con
vers
ion
of 2
029
Deb
entu
res,
net o
f tax
—7,
295
(139
,765
)23
3,36
66,
261,
497
Tax
with
hold
ing
rela
ted
to v
estin
g of
rest
ricte
d st
ock
units
and
retir
emen
t of
com
mon
stoc
k—
(17,
358 )
(1,2
53)
488
Non
cont
rolli
ng in
tere
sts
(468
)N
et in
com
e10
1,58
8Tr
ansl
atio
n ad
just
men
t38
,275
Ben
efit
plan
adj
ustm
ents
, net
of t
ax e
ffec
tof
$30
2(2
,485
)B
alan
ce, D
ecem
ber
31, 2
016
$58
858
,817
,781
$43
4,33
9,43
1$
986,
020
$1,
956,
532
$(5
42,5
37)
(14,
545,
715)
$(3
,269
)$
(387
,365
)
The
acco
mpa
nyin
g no
tes a
re a
n in
tegr
al p
art o
f the
con
solid
ated
fina
ncia
l sta
tem
ents
.

WESCO INTERNATIONAL, INC. AND SUBSIDIARIES
38
CONSOLIDATED STATEMENTS OF CASH FLOWS
Year Ended December 31, 2016 2015 2014
(In thousands)Operating Activities: Net income $ 101,120 $ 208,373 $ 275,437Adjustments to reconcile net income to net cash provided by operating activities:
Depreciation and amortization 66,858 64,968 68,017Stock-based compensation expense 12,493 12,899 14,766Amortization of debt issuance costs 3,585 6,120 4,426Amortization of debt discount 3,099 6,075 4,136Loss on debt redemption (Note 7) 123,933 — —Gain on sale of property, buildings and equipment (4,702) (45) (7,733)Gain on sale of businesses — (1,319) —Excess tax benefit from stock-based compensation (1,988) (1,569) (5,705)Interest related to uncertain tax positions, net 1,152 (8,739) 964Deferred income taxes (45,174) 42,850 4,979Changes in assets and liabilities:
Trade receivables, net 56,767 40,102 (89,029)Other accounts receivable (1,628) 57,242 (11,659)Inventories (1,612) 2,410 (36,847)Prepaid expenses and other assets 13,207 (8,517) (27,020)Accounts payable (40,607) (55,914) 37,587Accrued payroll and benefit costs (1,922) (15,015) 7,619Other current and noncurrent liabilities 15,654 (66,872) 11,218
Net cash provided by operating activities 300,235 283,049 251,156Investing Activities: Capital expenditures (17,957) (21,658) (20,548)Acquisition payments, net of cash acquired (50,890) (151,595) (138,630)Proceeds from sale of assets 8,361 3,023 14,991Other investing activities (10,000) — —
Net cash used in investing activities (70,486) (170,230) (144,187)Financing Activities:Proceeds from issuance of short-term debt 111,458 102,033 71,308Repayments of short-term debt (131,501) (101,353) (57,827)Proceeds from issuance of long-term debt 2,082,738 1,528,578 1,168,580Repayments of long-term debt (2,323,568) (1,435,820) (1,244,173)Repayment of deferred acquisition payable — — (29,395)Debt issuance costs (6,002) (3,359) (472)Proceeds from the exercise of stock options — — 838Excess tax benefit from stock-based compensation 1,988 1,569 5,705Repurchase of common stock (Note 10) (4,818) (155,805) (7,222)Other financing activities (6,558) (3,658) (2,832)
Net cash used in financing activities (276,263) (67,815) (95,490)Effect of exchange rate changes on cash and cash equivalents (3,634) (13,044) (6,885)Net change in cash and cash equivalents (50,148) 31,960 4,594Cash and cash equivalents at the beginning of period 160,279 128,319 123,725Cash and cash equivalents at the end of period $ 110,131 $ 160,279 $ 128,319Supplemental disclosures:Cash paid for interest $ 74,391 $ 66,342 $ 74,016Cash paid for taxes 76,293 74,213 107,147Non-cash investing and financing activities:
Property, buildings and equipment acquired through capital leases 1,143 288 1,091The accompanying notes are an integral part of the consolidated financial statements.

WESCO INTERNATIONAL, INC. AND SUBSIDIARIESNOTES TO CONSOLIDATED FINANCIAL STATEMENTS
39
1. ORGANIZATION
WESCO International, Inc. ("WESCO International") and its subsidiaries (collectively, “WESCO” or the "Company"), headquartered in Pittsburgh, Pennsylvania, is a full-line distributor of electrical, industrial and communications maintenance, repair and operating (“MRO”) and original equipment manufacturers (“OEM”) products, construction materials, and advanced supply chain management and logistics services used primarily in the industrial, construction, utility and commercial, institutional and government markets. We serve approximately 75,000 active customers globally, through approximately 500 full service branches and nine distribution centers located primarily in the United States, Canada and Mexico, with operations in 14 additional countries.
2. ACCOUNTING POLICIES
Basis of Consolidation
The consolidated financial statements include the accounts of WESCO International and all of its subsidiaries. All significant intercompany accounts and transactions have been eliminated in consolidation.
Reclassifications
The Consolidated Statement of Cash Flows for the year ended December 31, 2015 and 2014 includes certain reclassifications to previously reported amounts to conform to the current period presentation.
During the first quarter of 2016, the Company adopted certain accounting pronouncements that were effective beginning this fiscal year. The adoption of such guidance, as described below, resulted in certain reclassifications to amounts previously reported in the Consolidated Balance Sheet at December 31, 2015.
Use of Estimates
The preparation of financial statements in conformity with generally accepted accounting principles in the United States of America requires management to make estimates and assumptions that affect the amounts reported in the consolidated financial statements and accompanying disclosures. Although these estimates are based on management’s best knowledge of current events and actions WESCO may undertake in the future, actual results may ultimately differ from the estimates.
Revenue Recognition
Revenues are recognized for product sales when title, ownership and risk of loss pass to the customer or for services when the service is rendered. In the case of stock sales and special orders, a sale occurs at the time of shipment from WESCO's distribution point, as the terms of WESCO’s sales are typically FOB shipping point. In cases where WESCO processes customer orders but ships directly from its suppliers, revenue is recognized once product is shipped and title has passed. In all cases, revenue is recognized once the sales price to the customer is fixed or is determinable and WESCO has reasonable assurance as to the collectability.
In certain customer arrangements, WESCO provides services such as inventory management. WESCO may perform some or all of the following services for customers: determine inventory stocking levels; establish inventory reorder points; launch purchase orders; receive material; pack away material; and pick material for order fulfillment. WESCO recognizes revenue for services rendered during the period based upon a previously negotiated fee arrangement. WESCO also sells inventory to these customers and recognizes revenue at the time title and risk of loss transfers to the customer. The amount of revenue attributed to these services totaled $27.1 million, $35.1 million, and $31.0 million in 2016, 2015 and 2014, respectively.
Selling, General and Administrative Expenses
WESCO includes warehousing, purchasing, branch operations, information services, and marketing and selling expenses in this category, as well as other types of general and administrative costs.
Supplier Volume Rebates
WESCO receives volume rebates from certain suppliers based on contractual arrangements with such suppliers. Volume rebates are included within other accounts receivable in the Consolidated Balance Sheets, and represent the estimated amounts due to WESCO under the rebate provisions of the various supplier contracts. The corresponding rebate income is derived from the level of actual purchases made by WESCO and is recorded as a reduction to cost of goods sold. Receivables under the supplier rebate program were $64.2 million at December 31, 2016 and $62.6 million at December 31, 2015. Supplier volume rebate rates have historically ranged between approximately 0.9% and 1.4% of sales depending on market conditions. In 2016, the rebate rate was 1.3%.

WESCO INTERNATIONAL, INC. AND SUBSIDIARIESNOTES TO CONSOLIDATED FINANCIAL STATEMENTS—(CONTINUED)
40
Shipping and Handling Costs and Fees
WESCO records the costs and fees associated with transporting its products to customers as a component of selling, general and administrative expenses. These costs totaled $57.9 million, $59.4 million and $63.6 million in 2016, 2015 and 2014, respectively.
Cash Equivalents
Cash equivalents are defined as highly liquid investments with original maturities of 90 days or less when purchased.
Asset Securitization
WESCO maintains control of the receivables transferred pursuant to its accounts receivable securitization program (the “Receivables Facility”); therefore, the transfers do not qualify for “sale” treatment. As a result, the transferred receivables remain on the balance sheet, and WESCO recognizes the related secured borrowing. The expenses associated with the Receivables Facility are reported as interest expense in the Consolidated Statements of Income and Comprehensive Income (Loss).
Allowance for Doubtful Accounts
WESCO maintains allowances for doubtful accounts for estimated losses resulting from the inability of its customers to make required payments. WESCO has a systematic procedure using estimates based on historical data and reasonable assumptions of collectability made at the local branch level and on a consolidated corporate basis to calculate the allowance for doubtful accounts. If the financial condition of WESCO’s customers were to deteriorate, resulting in an impairment of their ability to make payments, additional allowances may be required. The allowance for doubtful accounts was $22.0 million at December 31, 2016 and $22.6 million at December 31, 2015. The total amount recorded as selling, general and administrative expense related to bad debts was $5.9 million, $6.1 million and $5.9 million for 2016, 2015 and 2014, respectively.
Inventories
Inventories primarily consist of merchandise purchased for resale and are stated at the lower of cost and net realizable value. Cost is determined principally under the average cost method. WESCO makes provisions for obsolete or slow-moving inventories as necessary to reflect reduction in inventory value. WESCO writes down its inventory to net realizable value based on internal factors derived from historical analysis of actual losses. Retrospectively, WESCO identifies items in excess of 36 months supply relative to demand or movement. WESCO then analyzes the ultimate disposition of previously identified excess inventory items as they are sold, returned to supplier, or scrapped. This historical item-by-item analysis allows WESCO to develop an estimate of the likelihood that an item identified as being in excess supply ultimately becomes obsolete. WESCO applies the estimate to inventory items currently in excess of 36 months supply, and reduces the carrying value of its inventory by the derived amount. Reserves for excess and obsolete inventories were $27.3 million and $24.7 million at December 31, 2016 and 2015, respectively. The total expense related to excess and obsolete inventories, included in cost of goods sold, was $7.3 million, $8.6 million and $6.2 million for 2016, 2015 and 2014, respectively. WESCO absorbs into the cost of inventory certain overhead expenses related to inventory such as purchasing, receiving and storage and at December 31, 2016 and 2015, $65.3 million and $65.0 million, respectively, of these costs were included in ending inventory.
Property, Buildings and Equipment
Property, buildings and equipment are recorded at cost. Depreciation expense is determined using the straight-line method over the estimated useful lives of the assets. Leasehold improvements are amortized over either their respective lease terms or their estimated lives, whichever is shorter. Estimated useful lives range from five to forty years for leasehold improvements and buildings and three to ten years for furniture, fixtures and equipment.
Capitalized computer software costs are amortized using the straight-line method over the estimated useful life, typically three to five years, and are reported at the lower of unamortized cost or net realizable value.
Expenditures for new facilities and improvements that extend the useful life of an asset are capitalized. Ordinary repairs and maintenance are expensed as incurred. When property is retired or otherwise disposed of, the cost and the related accumulated depreciation are removed from the accounts and any related gains or losses are recorded and reported as selling, general and administrative expenses.
Of WESCO’s $157.6 million net book value of property, buildings and equipment as of December 31, 2016, $98.1 million consists of land, buildings and leasehold improvements and are geographically dispersed among WESCO’s 500 branches and nine distribution centers, mitigating the risk of impairment. WESCO assesses its long-lived assets for impairment whenever events or changes in circumstances indicate the carrying amount of any such assets may not be fully recoverable. Changes in

WESCO INTERNATIONAL, INC. AND SUBSIDIARIESNOTES TO CONSOLIDATED FINANCIAL STATEMENTS—(CONTINUED)
41
circumstances include technological advances, changes in our business model, capital structure, economic conditions or operating performance. The evaluation is based upon, among other things, utilization, serviceability and assumptions about the estimated future undiscounted cash flows these assets are expected to generate. When the sum of the undiscounted cash flows is less than the carrying value of the asset or asset group, WESCO will recognize an impairment loss to the extent that carrying value exceeds fair value. Management applies its best judgment when performing these evaluations.
Goodwill and Indefinite-Lived Intangible Assets
Goodwill and indefinite-lived intangible assets are tested for impairment annually during the fourth quarter using information available at the end of September, or more frequently if triggering events occur indicating that their carrying value may not be recoverable. WESCO tests for goodwill impairment on a reporting unit level and the evaluation involves comparing the fair value of each reporting unit to its carrying value. The fair values of the reporting units are determined using a combination of a discounted cash flow analysis and market multiples. Assumptions used for these fair value techniques are based on a combination of historical results, current forecasts, market data and recent economic events. WESCO evaluates the recoverability of indefinite-lived intangible assets using the relief-from-royalty method based on projected financial information. The determination of fair value involves significant management judgment and management applies its best judgment when assessing the reasonableness of financial projections. At December 31, 2016 and 2015, goodwill and indefinite-lived trademarks totaled $1.82 billion.
A possible indicator of goodwill impairment is the relationship of a company’s market capitalization to its book value. As of December 31, 2016, WESCO's market capitalization exceeded its book value and there were no impairment losses identified as a result of the annual test. Fair value determinations require considerable judgment and are sensitive to changes in underlying assumptions and factors. As a result, there can be no assurance that the estimates and assumptions made for purposes of the annual goodwill and indefinite-lived intangible impairment tests will prove to be an accurate prediction of future results.
Definite Lived Intangible Assets
Intangible assets are amortized over 2 to 20 years. A portion of intangible assets related to certain customer relationships are amortized using an accelerated method whereas all other intangible assets subject to amortization use a straight-line method that reflects the pattern in which the economic benefits of the respective assets are consumed or otherwise used. Intangible assets are tested for impairment if events or circumstances occur indicating that the respective asset might be impaired.
Insurance Programs
WESCO uses commercial insurance for auto, workers’ compensation, casualty and health claims as a risk-reduction strategy to minimize catastrophic losses. The Company’s strategy involves large deductible policies where WESCO must pay all costs up to the deductible amount. WESCO estimates the reserve for these programs based on historical incident rates and costs. The assumptions included in developing this accrual include the period of time between the incurrence and payment of a claim. The total liability related to the insurance programs was $9.5 million and $9.8 million at December 31, 2016 and 2015, respectively.
Income Taxes
WESCO accounts for income taxes under the asset and liability method, which requires the recognition of deferred income taxes for events that have future tax consequences. Under this method, deferred income taxes are recognized (using enacted tax laws and rates) based on the future income tax effects of differences in the carrying amounts of assets and liabilities for financial reporting and tax purposes. The effect of a tax rate change on deferred tax assets and liabilities is recognized in income in the period of change.
WESCO recognizes deferred tax assets at amounts that are expected to be realized. To make such determination, management evaluates all positive and negative evidence, including but not limited to, prior, current and future taxable income, tax planning strategies and future reversals of existing temporary differences. A valuation allowance is recognized if it is “more-likely-than-not” that some or all of a deferred tax asset will not be realized. WESCO regularly assesses the realizability of deferred tax assets.
No provision is made for undistributed earnings that are considered to be permanently reinvested to fund growth in foreign markets.
WESCO accounts for uncertainty in income taxes using a "more-likely-than-not" recognition threshold. Due to the subjectivity inherent in the evaluation of uncertain tax positions, the tax benefit ultimately recognized may materially differ from the estimate. WESCO recognizes interest and penalties related to uncertain tax benefits as part of interest expense and income tax expense, respectively.

WESCO INTERNATIONAL, INC. AND SUBSIDIARIESNOTES TO CONSOLIDATED FINANCIAL STATEMENTS—(CONTINUED)
42
Debt Issuance Costs
WESCO capitalizes costs associated with the issuance of debt and such costs are amortized over the term of the respective debt instrument on a straight-line basis. Debt issuance costs are presented in the Consolidated Balance Sheets as a direct reduction from the carrying amount of the related debt liability. Upon prepayment of debt, the Company accelerates the recognition of an appropriate amount of the costs as refinancing or extinguishment of debt. During the year ending December 31, 2016, the Company capitalized debt issuance costs of $6.0 million. As of December 31, 2016 and 2015, unamortized debt issuance costs of $16.5 million and $17.7 million were recorded in the Consolidated Balance Sheets, respectively.
Convertible Debentures
WESCO separately accounted for the liability and equity components of the 6.0% Convertible Senior Debentures due 2029 (the "2029 Debentures") in a manner that reflected its non-convertible debt borrowing rate. WESCO estimated its non-convertible debt borrowing rate through a combination of discussions with its financial institutions and review of relevant market data. The discounts to the convertible debt balances were amortized to interest expense, using the effective interest method, over the implicit life of the debentures.
Foreign Currency
The local currency is the functional currency for the majority of WESCO’s operations outside the United States. Assets and liabilities of these operations are translated to U.S. dollars at the exchange rate in effect at the end of each period. Income statement accounts are translated at an exchange rate that approximates the average for the period. Translation adjustments arising from the use of differing exchange rates from period to period are included as a component of other comprehensive income (loss) within stockholders’ equity. Gains and losses from foreign currency transactions are included in net income for the period.
Defined Benefit Pension Plan
In connection with the December 14, 2012 acquisition of EECOL, the Company assumed a contributory defined benefit plan covering substantially all Canadian employees of EECOL. The plan provides retirement benefits based on earnings and credited service, and participants contribute 2% of their earnings to the plan.
The Company also assumed EECOL's Supplemental Executive Retirement Plan (SERP), which provides additional pension benefits to certain executives based on earnings, credited service, and executive service. Participants in the SERP contribute 4% of their earnings to the SERP.
Liabilities and expenses for pension benefits are determined using actuarial methodologies and incorporate significant assumptions, including the interest rate used to discount the future estimated cash flows, the expected long-term rate of return on plan assets, and several assumptions relating to the employee workforce (salary increases, retirement age, and mortality).
The interest rate used to discount future estimated cash flows is determined using the Canadian Institute of Actuaries ("CIA") methodology, which references yield curve information provided by Fiera Capital. The discount rate used to determine benefit obligations for the Canadian pension was 3.9% in 2016. An increase in the discount rate of one quarter percent would decrease the projected benefit obligation by $4.7 million, and a decrease in the discount rate of one quarter percent would increase the projected benefit obligation by $5.1 million. The impact of a change in the discount rate of one quarter percent would be either a charge or credit of $0.3 million to earnings in the following year.
The expected long-term rate of return on plan assets is applied to the fair market-related value of plan assets.
Stock-Based Compensation
WESCO's stock-based employee compensation plans are comprised of stock-settled stock appreciation rights, restricted stock units, and performance-based awards. Compensation cost for all stock-based awards is measured at fair value on the date of grant, and compensation cost is recognized, net of forfeitures, over the service period for awards expected to vest. The fair value of stock-settled appreciation rights and performance-based awards with market conditions is determined using the Black-Scholes and Monte Carlo simulation models, respectively. The fair value of restricted stock units with service conditions and performance-based awards with performance conditions is determined by the grant-date closing price of WESCO's common stock. Expected volatilities are based on historical volatility of WESCO's common stock. WESCO estimates the expected life of stock-settled stock appreciation rights using historical data pertaining to option exercises and employee terminations. The risk-free rate is based on the U.S. Treasury yields in effect at the time of grant. The forfeiture assumption is based on WESCO's historical employee behavior, which is reviewed on an annual basis. No dividends are assumed for stock-based awards.

WESCO INTERNATIONAL, INC. AND SUBSIDIARIESNOTES TO CONSOLIDATED FINANCIAL STATEMENTS—(CONTINUED)
43
Treasury Stock
Common stock purchased for treasury is recorded at cost. At the date of subsequent reissue, the treasury stock account is reduced by the cost of such stock, with cost determined on a weighted-average basis.
Fair Value of Financial Instruments
The Company measures the fair value of financial assets and liabilities in accordance with Financial Accounting Standards Board (FASB) Accounting Standards Codification (ASC) 820, "Fair Value Measurements and Disclosures," which defines fair value, establishes a framework for measuring fair value and expands disclosures about fair value measurements.
ASC 820 establishes a fair value hierarchy that prioritizes the inputs to valuation techniques used to measure fair value and requires an entity to maximize the use of observable inputs and minimize the use of unobservable inputs. The hierarchy gives the highest priority to unadjusted quoted prices in active markets for identical assets or liabilities (Level 1 measurements) and the lowest priority to measurements involving significant unobservable inputs (Level 3 measurements). The three levels of the fair value hierarchy are as follows:
• Level 1 inputs are quoted prices (unadjusted) in active markets for identical assets or liabilities that are accessible at the measurement date.
• Level 2 inputs include inputs other than Level 1 that are observable, either directly or indirectly, such as quoted prices in active markets for similar assets and liabilities, quoted prices for identical or similar assets or liabilities in markets that are not active, or other inputs that are observable or can be corroborated by observable market data for substantially the full term of assets or liabilities.
• Level 3 inputs are unobservable inputs in which little or no market data exists, therefore requiring an entity to develop its own assumptions.
The Company’s financial instruments consist of cash and cash equivalents, accounts receivable, accounts payable and other accrued liabilities, and outstanding indebtedness. Except for the previously outstanding 2029 Debentures, the reported carrying amounts of WESCO’s debt instruments approximate their fair values. As described in Note 7, the 2029 Debentures were fully redeemed on September 15, 2016. At December 31, 2015, the carrying value of the 2029 Debentures was $177.8 million and the fair value was approximately $514.2 million. The Company uses a market approach to fair value all of its debt instruments, utilizing quoted prices in active markets, interest rates and other relevant information generated by market transactions involving similar instruments. Therefore, all of the Company's debt instruments are classified as Level 2 within the valuation hierarchy. For all of the Company's remaining financial instruments, carrying values are considered to approximate fair value.
Environmental Expenditures
WESCO has facilities and operations that distribute certain products that must comply with environmental regulations and laws. Expenditures for current operations are expensed or capitalized, as appropriate. Expenditures relating to existing conditions caused by past operations, and that do not contribute to future revenue, are expensed. Liabilities are recorded when remedial efforts are probable and the costs can be reasonably estimated.
Recently Adopted Accounting Pronouncements
In September 2014, the FASB issued ASU 2014-15, Disclosure of Uncertainties about an Entity's Ability to Continue as a Going Concern. This ASU describes how an entity should assess its ability to meet obligations and sets disclosure requirements for how this information should be disclosed in the financial statements. The standard provides accounting guidance that will be used with existing auditing standards. The Company adopted this ASU in the first quarter of 2016. The adoption of this guidance did not have an impact on WESCO's consolidated financial statements and notes thereto.
In April 2015 and August 2015, the FASB issued Accounting Standards Update (ASU) 2015-03, Simplifying the Presentation of Debt Issuance Costs, and ASU 2015-15, Presentation and Subsequent Measurement of Debt Issuance Costs Associated with Line-of-Credit Arrangements. These ASUs simplify the presentation of debt issuance costs by requiring that debt issuance costs related to a recognized liability be presented in the balance sheet as a direct deduction from the carrying amount of that debt liability, consistent with debt discounts. The Company adopted this new guidance on a retrospective basis effective January 1, 2016. Accordingly, the Company reclassified approximately $17.7 million of debt issuance costs from other noncurrent assets to long-term debt in the balance sheet as of December 31, 2015. See Note 7 of the Notes to Consolidated Financial Statements.
In May 2015, the FASB issued ASU 2015-07, Disclosures for Investments in Certain Entities That Calculate Net Asset Value per Share (or Its Equivalent). This updated guidance removes the requirement to categorize investments for which fair

WESCO INTERNATIONAL, INC. AND SUBSIDIARIESNOTES TO CONSOLIDATED FINANCIAL STATEMENTS—(CONTINUED)
44
value is measured using the net asset value (NAV) per share practical expedient within the fair value hierarchy. The Company adopted this guidance on a retrospective basis effective January 1, 2016. The adoption of this ASU did not have an impact on WESCO's financial position, results of operations or cash flows; however, this guidance impacted the Company's defined benefit plan disclosure in Note 11 of the Notes to Consolidated Financial Statements as presented herein. Specifically, investments for which fair value is measured using the NAV per share practical expedient were removed from the tabular disclosure of the fair value hierarchy in all periods presented.
In November 2015, the FASB issued ASU 2015-17, Balance Sheet Classification of Deferred Taxes. This ASU simplifies the presentation of deferred income taxes by requiring that all deferred tax assets and liabilities, along with any related valuation allowance, be classified as noncurrent in the balance sheet. The Company elected to early adopt this ASU on a prospective basis during the first quarter of 2016. The adoption of this ASU did not have a material impact on WESCO's financial position and it had no impact on its results of operations or cash flows.
Recently Issued Accounting Pronouncements
In August 2015, the FASB issued ASU 2015-14, Revenue from Contracts with Customers: Deferral of Effective Date. The Company previously reported that in May 2014, the FASB issued ASU 2014-09, Revenue from Contracts with Customers, which provides a framework for addressing revenue recognition issues and replaces almost all existing revenue recognition guidance in current U.S. generally accepted accounting principles. The core principle of ASU 2014-09 is for companies to recognize revenue for the transfer of goods or services to customers in amounts that reflect the consideration to which the company expects to be entitled in exchange for those goods or services. ASU 2014-09 will also result in enhanced disclosures about revenue, provide guidance for transactions that were not previously addressed comprehensively, and improve guidance for multiple-element arrangements. The amendments in ASU 2015-14 defer the effective date of the new revenue recognition guidance to annual reporting periods beginning after December 15, 2017, including interim periods within that reporting period. During 2016, the FASB issued four ASUs that address implementation issues and correct or improve certain aspects of the new revenue recognition guidance, including ASU 2016-08, Principal versus Agent Considerations (Reporting Revenue Gross versus Net), ASU 2016-10, Identifying Performance Obligations and Licensing, ASU 2016-12, Narrow-Scope Improvements and Practical Expedients and ASU 2016-20, Technical Corrections and Improvements to Topic 606, Revenue from Contracts with Customers. These ASUs do not change the core principles in the revenue recognition standard outlined above. The Company has developed a phased approach to implementing the new standard. We are currently in the assessment phase and cannot reasonably estimate the financial statement impact of the future adoption.
In February 2016, the FASB issued ASU 2016-02, Leases, a comprehensive new standard that amends various aspects ofexisting accounting guidance for leases, including the recognition of a right-of-use asset and a lease liability on the balancesheet and disclosing key information about leasing arrangements. This guidance is effective for fiscal years beginning afterDecember 15, 2018, including interim periods within those fiscal years. Early adoption is permitted. The new leasing standardrequires modified retrospective transition, which requires application of the new guidance at the beginning of the earliestcomparative period presented in the year of adoption. Management is currently evaluating the impact of this new standard onWESCO's consolidated financial statements and notes thereto.
In March 2016, the FASB issued ASU 2016-09, Compensation—Stock Compensation (Topic 718): Improvements to Employee Share-Based Payment Accounting, which simplifies several aspects of accounting for share-based payment transactions, including the income tax consequences, classification of awards as either equity or liabilities, and classification on the statement of cash flows. The amendments in this ASU affect all entities that issue share-based payment awards to their employees. This ASU will be effective in the first quarter of 2017. The impact of this new guidance is dependent upon future equity award exercises and stock prices, which cannot be predicted. Therefore, the Company is unable to determine the significance of the impact on its reported income taxes or cash flows from operating activities.
In June 2016, the FASB issued ASU 2016-13, Financial Instruments—Credit Losses (Topic 326): Measurement of Credit Losses on Financial Instruments, which introduces new guidance for the accounting for credit losses on certain financial instruments. The amendments in ASU 2016-13 are effective for fiscal years beginning after December 15, 2019, including interim periods within those fiscal years and early adoption is permitted. Management is currently evaluating the impact of this accounting standard on WESCO's consolidated financial statements and notes thereto.
In August 2016, the FASB issued ASU 2016-15, Statement of Cash Flows (Topic 230): Classification of Certain Cash Receipts and Cash Payments (a consensus of the Emerging Issues Task Force). This ASU provides guidance on eight specific cash flow issues where there is diversity in practice. The amendments in this ASU are effective for fiscal years beginning after December 15, 2017, and interim periods within those fiscal years. Early adoption is permitted, including adoption in an interim period. Management is currently evaluating the impact of this accounting standard on WESCO's consolidated financial statements and notes thereto.

WESCO INTERNATIONAL, INC. AND SUBSIDIARIESNOTES TO CONSOLIDATED FINANCIAL STATEMENTS—(CONTINUED)
45
In October 2016, the FASB issued ASU 2016-16, Income Taxes (Topic 740): Intra-Entity Transfers of Assets Other Than Inventory. The purpose of ASU 2016-16 is to simplify the income tax accounting of an intra-entity transfer of an asset other than inventory and to record its effect when the transfer occurs. The guidance is effective for annual reporting periods beginning after December 15, 2017, including interim reporting periods within those annual reporting periods and early adoption is permitted. The Company will early adopt this ASU on a modified retrospective basis in the first quarter of 2017. The adoption of this ASU is not expected to have a material impact on WESCO's financial position and it will have no impact on its results of operations or cash flows.
In January 2017, the FASB issued ASU 2017-04, Intangibles—Goodwill and Other (Topic 350): Simplifying the Test for Goodwill Impairment, which eliminates Step 2 from the goodwill impairment test. Under the amendments in this update, an entity should perform its annual, or interim, goodwill impairment test by comparing the fair value of a reporting unit with its carrying amount. An entity should recognize an impairment charge for the amount by which the carrying amount exceeds the reporting unit’s fair value; however, the loss recognized should not exceed the total amount of goodwill allocated to that reporting unit. An entity should apply the amendments in this ASU on a prospective basis. This guidance is effective for fiscal years beginning after December 15, 2019, including interim periods within those fiscal years. Management has not yet evaluated the impact of this accounting standard on WESCO's consolidated financial statements and notes thereto.
Other pronouncements issued by the FASB or other authoritative accounting standards groups with future effective dates are either not applicable or are not expected to be significant to WESCO’s financial position, results of operations or cash flows.
3. GOODWILL AND INTANGIBLE ASSETS
Goodwill
The following table sets forth the changes in the carrying value of goodwill:
Year Ended December 31, 2016 2015 (In thousands)
Beginning balance January 1 $ 1,681,662 $ 1,735,440Foreign currency exchange rate changes 21,434 (113,719)Adjustments to goodwill for acquisitions (1) 17,618 59,941
Ending balance December 31 $ 1,720,714 $ 1,681,662
(1) Includes a $15.2 million reduction recorded during the second quarter of 2016 to correct deferred income taxes related to prior acquisitions.
WESCO has never recorded an impairment loss related to goodwill.
Intangible Assets
The components of intangible assets are as follows:
December 31, 2016 December 31, 2015
Life
Gross Carrying
Amount (1)
AccumulatedAmortization (1)
NetCarryingAmount
Gross Carrying
Amount (1)
AccumulatedAmortization (1)
NetCarryingAmount
(In thousands)
Intangible assets: Trademarks Indefinite $ 96,962 $ — $ 96,962 $ 91,945 $ — $ 91,945Trademarks 4-15 25,098 (3,426) 21,672 22,793 (1,581) 21,212Non-compete agreements 2-7 196 (63) 133 429 (201) 228Customer relationships 2-20 362,637 (126,835) 235,802 339,820 (95,634) 244,186Distribution agreements 10-19 38,972 (19,295) 19,677 38,726 (16,595) 22,131Patents 10 48,310 (29,194) 19,116 48,310 (24,363) 23,947 $ 572,175 $ (178,813) $ 393,362 $ 542,023 $ (138,374) $ 403,649
(1) Excludes the original cost and accumulated amortization of fully-amortized intangible assets.

WESCO INTERNATIONAL, INC. AND SUBSIDIARIESNOTES TO CONSOLIDATED FINANCIAL STATEMENTS—(CONTINUED)
46
Amortization expense related to intangible assets totaled $39.1 million, $36.9 million and $39.0 million for the years ended December 31, 2016, 2015 and 2014, respectively.
The following table sets forth the estimated amortization expense for intangible assets for the next five years:
Estimated Amortization
ExpenseFor the year ended December 31, (In thousands)
2017 $ 38,2122018 36,7372019 35,5072020 32,3882021 24,765
WESCO has never recorded an impairment loss related to intangible assets.
4. CONCENTRATIONS OF CREDIT RISK AND SIGNIFICANT SUPPLIERS
WESCO distributes its products and services and extends credit to a large number of customers in the industrial, construction, utility, and commercial, institutional and government markets. Based upon WESCO’s broad customer base, the Company has concluded that it has no material credit risk as a result of customer concentration. Our largest supplier is Eaton Corporation, accounting for approximately 11% of our purchases in 2016 and 2015, respectively, and 12% in 2014. Therefore, WESCO could potentially incur risk due to supplier concentration.
5. ACQUISITIONS
The following table sets forth the consideration paid for acquisitions:
Year Ended December 31, 2016 2015 2014
(In thousands)
Fair value of assets acquired $ 76,980 $ 192,099 $ 153,597Fair value of liabilities assumed 25,058 39,836 19,772
Cash paid for acquisitions $ 51,922 $ 152,263 $ 133,825Supplemental cash flow disclosure related to acquisitions:
Cash paid for acquisitions $ 51,922 $ 152,263 $ 133,825Less: cash acquired (1,032) (668) —Cash paid for acquisitions, net of cash acquired $ 50,890 $ 151,595 $ 133,825
The fair values of assets acquired and liabilities assumed during the year ended December 31, 2016, which are primarily for the acquisition of Atlanta Electrical Distributors, LLC, are based upon preliminary calculations and valuations. WESCO's estimates and assumptions for its preliminary purchase price allocations are subject to change as it obtains additional information for its estimates during the respective measurement periods (up to one year from the respective acquisition date).
Acquisition of Atlanta Electrical Distributors, LLC
On March 14, 2016, WESCO Distribution, Inc. ("WESCO Distribution") completed the acquisition of Atlanta Electrical Distributors, LLC, an Atlanta-based electrical distributor focused on the construction and MRO markets from five locations in Georgia with approximately $85 million in annual sales. WESCO Distribution funded the purchase price paid at closing with borrowings under its revolving credit facility. The purchase price was allocated to the respective assets and liabilities based upon their estimated fair values as of the acquisition date. In addition to the cash paid at closing, the purchase price includes a contingent payment that may be earned upon the achievement of certain financial performance targets over three consecutive one year periods. The fair value of the contingent consideration was determined using a probability-weighted outcome analysis and Level 3 inputs such as internal forecasts. This amount has been accrued at the maximum potential payout under the terms of the purchase agreement and it is included in the fair value of liabilities assumed as presented above. The preliminary fair value of intangibles was estimated by management and the allocation resulted in intangible assets of $21.8 million and goodwill of $30.0 million. The intangible assets include customer relationships of $15.8 million amortized over 13 and 14 years, a

WESCO INTERNATIONAL, INC. AND SUBSIDIARIESNOTES TO CONSOLIDATED FINANCIAL STATEMENTS—(CONTINUED)
47
trademark of $6.0 million amortized over 13 years, and non-compete agreements of less than $0.1 million amortized over 5 years. No residual value is estimated for the intangible assets being amortized. Management believes that the majority of goodwill is deductible for tax purposes.
2015 Acquisitions of Hill Country Electric Supply, LP and Needham Electric Supply Corporation
On May 1, 2015, WESCO Distribution completed the acquisition of Hill Country Electric Supply, LP ("Hill Country"), an electrical distributor focused on the commercial construction market from nine locations in Central and South Texas with approximately $140 million in annual sales. WESCO Distribution funded the purchase price paid at closing with borrowings under its prior revolving credit facility. The purchase price was allocated to the respective assets and liabilities based upon their estimated fair values as of the acquisition date. The fair value of intangibles was estimated by management and the allocation resulted in intangible assets of $21.1 million and goodwill of $16.2 million. The majority of goodwill is deductible for tax purposes.
On October 30, 2015, WESCO Distribution completed the acquisition of Needham Electric Supply Corporation ("Needham"), an electrical distributor focused on the commercial construction and lighting national account markets from 24 locations in Massachusetts, New Hampshire and Vermont with approximately $115 million in annual sales. WESCO Distribution funded the purchase price paid at closing with cash and borrowings under its revolving credit facility. The purchase price was allocated to the respective assets and liabilities based upon their estimated fair values as of the acquisition date. The fair value of intangibles was estimated by management and the allocation resulted in intangible assets of $31.0 million and goodwill of $35.7 million. The majority of goodwill is deductible for tax purposes.
For the acquisitions of Hill Country and Needham that were made in 2015, the intangible assets include customer relationships of $37.6 million amortized over 11 to 14 years, trademarks of $14.3 million amortized over 12 and 13 years, and other intangibles of $0.2 million. No residual value is estimated for the intangible assets being amortized.
2014 Acquisitions of LaPrairie, Inc., Hazmasters, Inc. and Hi-Line Utility Supply
On February 1, 2014, WESCO Distribution, through its wholly-owned Canadian subsidiary, completed the acquisition of LaPrairie, Inc. ("LaPrairie"), a wholesale distributor of electrical products with approximately $30 million in annual sales servicing the transmission, distribution, and substation needs of utilities and utility contractors from a single location in Newmarket, Ontario. WESCO funded the purchase price paid at closing with cash. The purchase price was allocated to the respective assets and liabilities based upon their estimated fair values as of the acquisition date. The fair value of intangibles was determined by management and the allocation resulted in intangible assets of $11.0 million and goodwill of $8.9 million. The majority of goodwill is deductible for tax purposes.
On March 17, 2014, WESCO Distribution, through its wholly-owned Canadian subsidiary, completed the acquisition of Hazmasters, Inc. ("Hazmasters"), a leading independent Canadian distributor of safety products with approximately $80 million in annual sales servicing customers in the industrial, construction, and commercial, institutional and government markets from 14 branches across Canada. WESCO funded the purchase price paid at closing with cash and borrowings under its prior revolving credit facility. The purchase price was allocated to the respective assets and liabilities based upon their estimated fair values as of the acquisition date. The fair value of intangibles was estimated by management and the allocation resulted in intangible assets of $28.1 million and goodwill of $29.5 million, which is not deductible for tax purposes.
On June 11, 2014, WESCO Distribution, completed the acquisition of Hi-Line Utility Supply ("Hi-Line"), a provider of utility MRO and safety products, as well as rubber goods testing and certification services, with approximately $30 million in annual sales from locations in Chicago, Illinois and Millbury, Massachusetts. WESCO Distribution funded the purchase price paid at closing with cash. The purchase price was allocated to the respective assets and liabilities based upon their estimated fair values as of the acquisition date. The fair value of intangibles was estimated by management and the allocation resulted in intangible assets of $14.2 million and goodwill of $24.0 million. The majority of goodwill is deductible for tax purposes.
For the acquisitions of LaPrairie, Hazmasters, and Hi-Line that were made in 2014, the intangible assets include customer relationships of $38.9 million amortized over 2 to 12 years, supplier relationships of $3.2 million amortized over 10 years, trademarks of $10.9 million, and other intangibles of $0.3 million. Certain trademarks have been assigned an indefinite life while others are amortized over 5 years and 10 years. No residual value is estimated for the intangible assets being amortized.
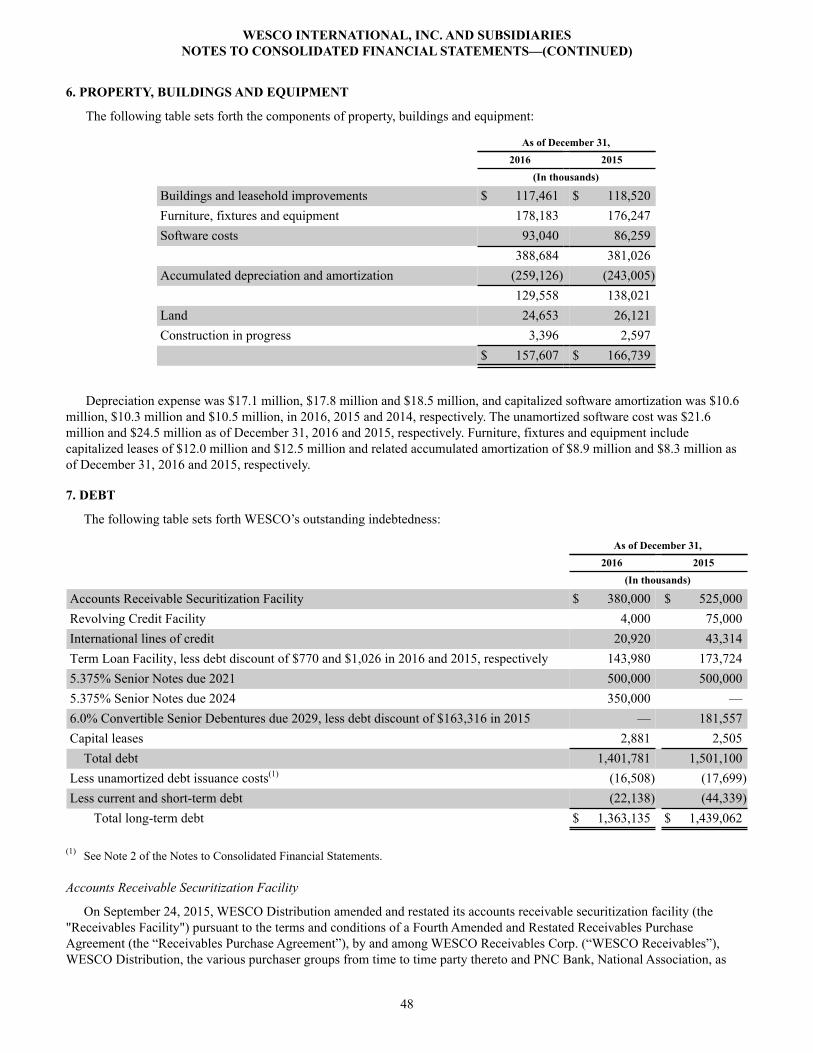
WESCO INTERNATIONAL, INC. AND SUBSIDIARIESNOTES TO CONSOLIDATED FINANCIAL STATEMENTS—(CONTINUED)
48
6. PROPERTY, BUILDINGS AND EQUIPMENT
The following table sets forth the components of property, buildings and equipment:
As of December 31, 2016 2015 (In thousands)
Buildings and leasehold improvements $ 117,461 $ 118,520Furniture, fixtures and equipment 178,183 176,247Software costs 93,040 86,259 388,684 381,026Accumulated depreciation and amortization (259,126) (243,005) 129,558 138,021Land 24,653 26,121Construction in progress 3,396 2,597 $ 157,607 $ 166,739
Depreciation expense was $17.1 million, $17.8 million and $18.5 million, and capitalized software amortization was $10.6 million, $10.3 million and $10.5 million, in 2016, 2015 and 2014, respectively. The unamortized software cost was $21.6 million and $24.5 million as of December 31, 2016 and 2015, respectively. Furniture, fixtures and equipment include capitalized leases of $12.0 million and $12.5 million and related accumulated amortization of $8.9 million and $8.3 million as of December 31, 2016 and 2015, respectively.
7. DEBT
The following table sets forth WESCO’s outstanding indebtedness:
As of December 31, 2016 2015 (In thousands)
Accounts Receivable Securitization Facility $ 380,000 $ 525,000Revolving Credit Facility 4,000 75,000International lines of credit 20,920 43,314Term Loan Facility, less debt discount of $770 and $1,026 in 2016 and 2015, respectively 143,980 173,7245.375% Senior Notes due 2021 500,000 500,0005.375% Senior Notes due 2024 350,000 —6.0% Convertible Senior Debentures due 2029, less debt discount of $163,316 in 2015 — 181,557Capital leases 2,881 2,505
Total debt 1,401,781 1,501,100Less unamortized debt issuance costs(1) (16,508) (17,699)Less current and short-term debt (22,138) (44,339)
Total long-term debt $ 1,363,135 $ 1,439,062
(1) See Note 2 of the Notes to Consolidated Financial Statements.
Accounts Receivable Securitization Facility
On September 24, 2015, WESCO Distribution amended and restated its accounts receivable securitization facility (the "Receivables Facility") pursuant to the terms and conditions of a Fourth Amended and Restated Receivables Purchase Agreement (the “Receivables Purchase Agreement”), by and among WESCO Receivables Corp. (“WESCO Receivables”), WESCO Distribution, the various purchaser groups from time to time party thereto and PNC Bank, National Association, as

WESCO INTERNATIONAL, INC. AND SUBSIDIARIESNOTES TO CONSOLIDATED FINANCIAL STATEMENTS—(CONTINUED)
49
Administrator. The Receivables Purchase Agreement amended and restated the receivables purchase agreement entered into on April 13, 2009.
The Receivables Purchase Agreement increased the purchase limit from $500 million to $550 million, with the opportunity to exercise an accordion feature which permits increases in the purchase limit of up to $100 million, extended the term of the Receivables Facility to September 24, 2018 and added and amended certain defined terms. The interest rate spread and commitment fee of the Receivables Facility remained at 0.95% and 0.45%, respectively.
Under the Receivables Facility, WESCO sells, on a continuous basis, an undivided interest in all domestic accounts receivable to WESCO Receivables, a wholly owned special purpose entity (the “SPE”). The SPE sells, without recourse, a senior undivided interest in the receivables to financial institutions for cash while maintaining a subordinated undivided interest in the receivables, in the form of overcollateralization. WESCO has agreed to continue servicing the sold receivables for the third-party conduits and financial institutions at market rates; accordingly, no servicing asset or liability has been recorded.
As of December 31, 2016 and 2015, accounts receivable eligible for securitization totaled approximately $657.5 million and $684.7 million, respectively. The Consolidated Balance Sheets as of December 31, 2016 and 2015 include $380.0 million and $525.0 million, respectively, of account receivable balances legally sold to third parties, as well as borrowings for equal amounts. At December 31, 2016, the interest rate on borrowings under this facility was approximately 1.4%.
Revolving Credit Facility
On September 24, 2015, WESCO International, WESCO Distribution and certain other subsidiaries of the Company entered into a $600 million revolving credit facility (the “Revolving Credit Facility”), which contains a letter of credit sub-facility of up to $125 million, pursuant to the terms and conditions of a Second Amended and Restated Credit Agreement (the "Credit Agreement"). The Revolving Credit Facility contains an accordion feature allowing WESCO Distribution to request increases to the borrowing commitments, subject to customary conditions. This accordion feature increased from $100 million to $200 million in the aggregate. The Revolving Credit Facility replaced WESCO Distribution’s prior revolving credit facility entered into on December 12, 2012.
The Revolving Credit Facility matures in September 2020 and consists of two separate sub-facilities: (i) a Canadian sub-facility with a borrowing limit of up to $400 million, which is collateralized by substantially all assets of WESCO Canada and the other Canadian Borrowers, other than, among other things, real property, in each case, subject to customary exceptions and limitations, and (ii) a U.S sub-facility with a borrowing limit of up to $600 million less the amount of outstanding borrowings under the Canadian sub-facility. The U.S. sub-facility is collateralized by substantially all assets of WESCO Distribution and its domestic subsidiaries which are party to the Credit Agreement, other than, among other things, real property and accounts receivable sold or intended to be sold pursuant to the Receivables Purchase Agreement. The applicable interest rate for borrowings under the Revolving Credit Facility includes interest rate spreads based on available borrowing capacity that range between 1.25% and 1.75% for LIBOR-based borrowings and 0.25% and 0.75% for prime rate-based borrowings. At December 31, 2016, the interest rate on borrowings under this facility was approximately 2.0%.
The Credit Agreement requires ongoing compliance with certain customary affirmative and negative covenants. The Credit Agreement also contains customary events of default.
During 2016, WESCO borrowed $1,025.8 million under the Revolving Credit Facility and made repayments in the aggregate amount of $1,096.8 million. During 2015, aggregate borrowings and repayments were $1,276.0 million and $1,209.0 million, respectively. WESCO had $509.7 million available under the Revolving Credit facility at December 31, 2016, after giving effect to $26.5 million of outstanding letters and international lines of credit, as compared to approximately $438.7 million available under the Revolving Credit facility at December 31, 2015, after giving effect to $40.3 million of outstanding letters and international lines of credit.
International Lines of Credit
Certain foreign subsidiaries of WESCO have entered into uncommitted lines of credit, which serve as overdraft facilities, to support local operations. The maximum borrowing limit varies by facility and ranges between $0.3 million and $21.0 million. The applicable interest rate for borrowings under these lines of credit varies by country and is governed by the applicable loan agreement. The international lines of credit are renewable on an annual basis and certain facilities are fully and unconditionally guaranteed by WESCO Distribution. Accordingly, borrowings under these lines directly reduce availability under the Revolving Credit Facility.
Term Loan Facility On December 12, 2012, WESCO Distribution, as U.S. borrower, WDCC Enterprises Inc. ("WDCC" and together with
WESCO Distribution, the “Borrowers”), as Canadian borrower, and WESCO International entered into a Term Loan Agreement

WESCO INTERNATIONAL, INC. AND SUBSIDIARIESNOTES TO CONSOLIDATED FINANCIAL STATEMENTS—(CONTINUED)
50
(the “Term Loan Agreement”) among WESCO Distribution, WDCC, the Company, the lenders party thereto and Credit Suisse AG Cayman Islands Branch, as administrative agent and as collateral agent.
The Term Loan Agreement provided a seven-year term loan facility (the “Term Loan Facility”), which consisted of two separate sub-facilities: (i) a Canadian sub-facility in an aggregate principal amount of CAD150 million, issued at a 2.0% discount, and (ii) a U.S. sub-facility in an aggregate principal amount of $700 million, issued at a 1.0% discount. The proceeds of the Term Loan Facility were used to finance the acquisition of EECOL, and to pay fees and expenses incurred in connection with the acquisition and certain other transactions. Subject to the terms of the Term Loan Agreement, the Borrowers may request incremental term loans from time to time in an aggregate principal amount not to exceed at any time $300 million, with an equivalent principal amount in U.S. dollars being calculated for any incremental term loan denominated in Canadian dollars.
On November 19, 2013, the Borrowers and WESCO International entered into an amendment (the “Term Loan Amendment”) to the Term Loan Agreement. The Term Loan Amendment, among other things, reduced the applicable margin on U.S. term loans by 0.50% and the LIBOR floor applicable to the U.S. sub-facility from 1.00% to 0.75%. The modified pricing terms were effective December 13, 2013.
On November 26, 2013, WESCO Distribution sold $500 million aggregate principal amount of 5.375% Senior Notes due 2021 (the “2021 Notes”), and used the net proceeds plus excess cash to prepay $500 million under the Company's U.S. sub-facility of the Term Loan Facility (see discussion below under “5.375% Senior Notes due 2021” for additional information). The prepayment satisfied all remaining quarterly repayment obligations under the U.S. sub-facility. As of December 31, 2016, the amount outstanding under the U.S. sub-facility was $144.8 million. The Canadian sub-facility was fully repaid in 2015 using cash provided by Canadian operations.
Borrowings under the Term Loan Facility bear interest at base rates plus applicable margins. At December 31, 2016, the interest rate on borrowings under the U.S. sub-facility was 4.0%. To the extent not previously paid, the outstanding U.S. sub-facility will become due and payable on December 12, 2019, with any unpaid incremental term loans becoming due and payable on the respective maturity dates applicable to those incremental term loans. At any time or from time to time, the Borrowers may prepay borrowings under the Term Loan Facility in whole or in part without premium or penalty. The Borrowers' obligations under the Term Loan Facility are secured by substantially all of the assets of the Borrowers, the Company and certain of the Company's other subsidiaries; provided that, with respect to borrowings under the U.S. sub-facility, the collateral does not include assets of certain foreign subsidiaries or more than 65% of the issued and outstanding equity interests in certain foreign subsidiaries.
The Term Loan Facility contains customary affirmative and negative covenants for credit facilities of this type. The Term Loan Facility also provides for customary events of default.
5.375% Senior Notes due 2021
In November 2013, WESCO Distribution issued $500 million aggregate principal amount of 2021 Notes through a private offering exempt from the registration requirements of the Securities Act of 1933, as amended (the “Securities Act”). The 2021 Notes were issued at 100% of par and are governed by an indenture (the “2021 Indenture”) entered into on November 26, 2013 with WESCO International and U.S. Bank National Association, as trustee. The 2021 Notes are unsecured senior obligations of WESCO Distribution and are guaranteed on a senior unsecured basis by WESCO International. The 2021 Notes bear interest at a stated rate of 5.375%, payable semi-annually in arrears on June 15 and December 15 of each year. In addition, WESCO incurred costs related to the issuance of the 2021 Notes totaling $8.4 million, which are recorded as a reduction to the carrying value of the debt and are being amortized over the life of the notes. The 2021 Notes mature on December 15, 2021. The net proceeds of the 2021 Notes were used to prepay a portion of the U.S. sub-facility of the term loans due 2019.
Under the terms of a registration rights agreement dated as of November 26, 2013 among WESCO Distribution, WESCO International and Merrill Lynch, Pierce, Fenner & Smith Incorporated, as the representative of the initial purchasers of the 2021 Notes, WESCO Distribution and WESCO International agreed to register under the Securities Act notes having terms identical in all material respects to the 2021 Notes (the “2021 Exchange Notes”) and to make an offer to exchange the 2021 Exchange Notes for the 2021 Notes. WESCO Distribution launched the exchange offer on June 12, 2014 and the exchange offer expired on July 17, 2014.
At any time on or after December 15, 2016, WESCO Distribution may redeem all or a part of the 2021 Notes. Between December 15, 2016 and December 14, 2017, WESCO Distribution may redeem all or a part of the 2021 Notes at a redemption price equal to 104.031% of the principal amount. Between December 15, 2017 and December 14, 2018, WESCO Distribution may redeem all or a part of the 2021 Notes at a redemption price equal to 102.688% of the principal amount. Between December 15, 2018 and December 14, 2019, WESCO Distribution may redeem all or a part of the 2021 Notes at a redemption price equal to 101.344% of the principal amount. On and after December 15, 2019, WESCO Distribution may redeem all or a part of the 2021 Notes at a redemption price equal to 100% of the principal amount.

WESCO INTERNATIONAL, INC. AND SUBSIDIARIESNOTES TO CONSOLIDATED FINANCIAL STATEMENTS—(CONTINUED)
51
The 2021 Indenture contains customary covenants and customary events of default. In addition, upon a change of control, the holders of 2021 Notes have the right to require WESCO Distribution to repurchase all or any part of the 2021 Notes at a redemption price equal to 101% of the principal amount, plus accrued and unpaid interest.
5.375% Senior Notes due 2024
In June 2016, WESCO Distribution issued $350 million aggregate principal amount of 5.375% Senior Notes due 2024 (the "2024 Notes") through a private offering exempt from the registration requirements of the Securities Act. The 2024 Notes were issued at 100% of par and are governed by an indenture (the “2024 Indenture”) entered into on June 15, 2016 among WESCO Distribution, as issuer, WESCO International, as parent guarantor, and U.S. Bank National Association, as trustee. The 2024 Notes are unsecured senior obligations of WESCO Distribution and are guaranteed on a senior unsecured basis by WESCO International. The 2024 Notes bear interest at a rate of 5.375% per annum, payable semi-annually in arrears on June 15 and December 15 of each year, commencing on December 15, 2016. WESCO incurred costs totaling $6.0 million to issue the 2024 Notes, which are recorded as a reduction to the carrying value of the debt and are being amortized over the life of the note. The notes mature on June 15, 2024. The Company used the net proceeds to redeem its 2029 Debentures on September 15, 2016.
Under the terms of a registration rights agreement dated as of June 15, 2016 among WESCO Distribution, as the issuer, WESCO International, as parent guarantor, and Goldman, Sachs & Co., as representative of the initial purchasers of the 2024 Notes, WESCO Distribution and WESCO International agreed to register under the Securities Act notes having terms identical in all material respects to the 2024 Notes (the “2024 Exchange Notes”) and to make an offer to exchange the 2024 Exchange Notes for the 2024 Notes. WESCO Distribution launched the exchange offer on December 28, 2016 and the exchange offer expired on January 31, 2017.
At any time on or after June 15, 2019, WESCO Distribution may redeem all or a part of the 2024 Notes. Between June 15, 2019 and June 14, 2020, WESCO Distribution may redeem all or a part of the 2024 Notes at a redemption price equal to 104.031% of the principal amount. Between June 15, 2020 and June 14, 2021, WESCO Distribution may redeem all or a part of the 2024 Notes at a redemption price equal to 102.688% of the principal amount. Between June 15, 2021 and June 14, 2022, WESCO Distribution may redeem all or a part of the 2024 Notes at a redemption price equal to 101.344% of the principal amount. On and after June 15, 2022, WESCO Distribution may redeem all or a part of the 2024 Notes at a redemption price equal to 100% of the principal amount.
The 2024 Indenture contains customary covenants and events of default. Upon a change of control, the holders of the 2024 Notes have the right to require WESCO Distribution to repurchase all or any part of the 2024 Notes at a redemption price equal to 101% of the principal amount thereof, plus accrued and unpaid interest.
6.0% Convertible Senior Debentures due 2029
On August 27, 2009, WESCO International completed an exchange offer pursuant to which it issued $345 million in aggregate principal amount of the 2029 Debentures. The 2029 Debentures were issued pursuant to an Indenture dated August 27, 2009, with The Bank of New York Mellon, as trustee, and were unconditionally guaranteed on an unsecured senior subordinate basis by WESCO Distribution.
WESCO separately accounted for the liability and equity components of its 2029 Debentures in a manner that reflected its non-convertible debt borrowing rate. WESCO utilized an interest rate of 13.875% to reflect the non-convertible debt borrowing rate of its offering upon issuance, which was determined based on discussions with its financial institutions and a review of relevant market data, and resulted in a $181.2 million discount to the 2029 Debenture balance and a net increase in additional capital of $106.5 million. As of December 31, 2015, the net equity included in additional capital related to the 2029 Debentures totaled $106.3 million. In addition, the financing costs incurred to issue the 2029 Debentures were allocated between the instrument's debt and equity components. WESCO amortized the debt discount and financing costs over the life of the instrument. For the years ended December 31, 2016, 2015 and 2014, non-cash interest expense for the amortization of the debt discount and debt issuance costs was $3.1 million, $4.2 million and $3.8 million, respectively.
On September 15, 2016, the Company redeemed the 2029 Debentures. Holders of the 2029 Debentures received cash totaling $344.8 million, which was equal to the principal amount of the then-outstanding debentures, in addition to accrued and unpaid interest. Holders who surrendered the 2029 Debentures for conversion received 18 shares of WESCO stock for each $1,000 principal amount of 2029 Debentures converted. In total, 6,267,688 shares were issued on the redemption date. The redemption resulted in a non-cash loss of $123.9 million, which included the write off of unamortized debt issuance costs.

WESCO INTERNATIONAL, INC. AND SUBSIDIARIESNOTES TO CONSOLIDATED FINANCIAL STATEMENTS—(CONTINUED)
52
The following table sets forth the components of WESCO’s outstanding convertible debenture indebtedness:
December 31, 2016 December 31, 2015
PrincipalBalance Discount
NetCarryingAmount
PrincipalBalance Discount
NetCarryingAmount
(In thousands)
2029 Convertible Debentures $ — — $ — $ 344,873 (163,316) $ 181,557
Covenant Compliance
WESCO was in compliance with all relevant covenants contained in its debt agreements as of December 31, 2016.
The following table sets forth the aggregate principal repayment requirements for all indebtedness for the next five years and thereafter, as of December 31, 2016:
(In thousands)
2017 $ 22,1382018 380,9262019 145,3772020 4,1102021 500,000Thereafter 350,000
Total payments on debt 1,402,551Debt discount (770)
Total debt $ 1,401,781
WESCO’s credit agreements contain various restrictive covenants that, among other things, impose limitations on: (i) dividend payments or certain other restricted payments or investments; (ii) the incurrence of additional indebtedness and guarantees; (iii) creation of liens; (iv) mergers, consolidation or sales of substantially all of WESCO’s assets; (v) certain transactions among affiliates; (vi) payments by certain subsidiaries to WESCO, and (vii) capital expenditures. In addition, the Revolving Credit Facility and the Receivables Facility require WESCO to meet certain fixed charge coverage tests depending on availability or liquidity, respectively.
8. CAPITAL STOCK
Preferred Stock
There are 20 million shares of preferred stock authorized at a par value of $.01 per share; there are no shares issued or outstanding. The Board of Directors has the authority, without further action by the stockholders, to issue all authorized preferred shares in one or more series and to fix the number of shares, designations, voting powers, preferences, optional and other special rights and the restrictions or qualifications thereof. The rights, preferences, privileges and powers of each series of preferred stock may differ with respect to dividend rates, liquidation values, voting rights, conversion rights, redemption provisions and other matters.
Common Stock
There are 210 million shares of common stock and 20 million shares of Class B common stock authorized at a par value of $.01 per share. The Class B common stock is identical to the common stock, except for voting and conversion rights. The holders of Class B common stock have no voting rights. With certain exceptions, Class B common stock may be converted, at the option of the holder, into the same number of shares of common stock.
The terms of the Revolving Credit Facility and the Term Loan Facility provide certain limits on declaring or paying dividends. In addition, the indentures governing the 2021 Notes and 2024 Notes place limits on the Company's ability to pay dividends and repurchase common stock. At December 31, 2016 and 2015, no dividends had been declared and, therefore, no retained earnings were reserved for dividend payments.

WESCO INTERNATIONAL, INC. AND SUBSIDIARIESNOTES TO CONSOLIDATED FINANCIAL STATEMENTS—(CONTINUED)
53
9. INCOME TAXES
The following table sets forth the components of income before income taxes by jurisdiction:
Year Ended December 31, 2016 2015 2014 (In thousands)
United States $ 80,881 $ 288,881 $ 326,934Foreign 50,670 15,029 57,219 Income before income taxes $ 131,551 $ 303,910 $ 384,153
The following table sets forth the components of the provision (benefit) for income taxes:
Year Ended December 31, 2016 2015 2014 (In thousands)
Current taxes: Federal(1) $ 65,614 $ 45,812 $ 69,495
State 6,489 4,565 7,161Foreign 3,502 2,309 27,081
Total current taxes 75,605 52,686 103,737Deferred taxes:
Federal (42,835) 29,593 14,525State (2,938) 3,767 2,522Foreign 599 9,491 (12,068)
Total deferred taxes (45,174) 42,851 4,979 Provision for income taxes $ 30,431 $ 95,537 $ 108,716
(1) Tax (expense) benefits related to stock-based awards and other equity instruments recorded directly to additional paid in capital totaled $(0.1) million, $1.6 million and $5.0 million in 2016, 2015 and 2014, respectively.
The following table sets forth the reconciliation between the federal statutory income tax rate and the effective tax rate:
Year Ended December 31,2016 2015 2014
Federal statutory rate 35.0% 35.0% 35.0%State taxes, net of federal tax benefit 1.0 2.2 1.9Nondeductible expenses 1.6 1.2 0.7Foreign tax rate differences (0.4) (1.1) (1.4)Tax effect of intercompany financing (19.9) (8.8) (7.8)Adjustment related to uncertain tax positions 3.7 2.7 (0.2)Valuation allowance against deferred tax assets 1.1 — —Other 1.0 0.2 0.1Effective tax rate 23.1% 31.4% 28.3%

WESCO INTERNATIONAL, INC. AND SUBSIDIARIESNOTES TO CONSOLIDATED FINANCIAL STATEMENTS—(CONTINUED)
54
As of December 31, 2016, WESCO’s foreign subsidiaries had unremitted earnings of approximately $759.9 million, of which $668.0 million was attributable to the Company's Canadian operations. WESCO asserts that these earnings are permanently reinvested to fund growth in the foreign markets and, therefore, has not provided a deferred tax liability on these earnings. Additionally, WESCO’s current plans do not require that these earnings be repatriated to fund liquidity needs in the U.S. It is not practicable for WESCO to determine the deferred tax liability associated with repatriation of these earnings as such determination involves material uncertainties, however, if these earnings were repatriated and taxed at the U.S. statutory rate of 35%, the unrecognized deferred tax liability would be approximately $266.0 million.
The following table sets forth deferred tax assets and liabilities:
As of December 31, 2016 2015 (In thousands) Assets Liabilities Assets Liabilities
Accounts receivable $ 3,484 $ — $ 4,736 $ —Inventory — 4,001 — 5,410Depreciation — 11,487 — 11,671Amortization of intangible assets — 226,779 — 240,106Convertible debt interest — — — 161,700Employee benefits 18,577 — 16,702 —Stock-based compensation 23,844 — 27,531 —Advance payments 22,056 — — —Foreign tax credits 15,698 — 11,494 —Tax loss carryforwards 18,440 — 21,095 —Other 7,175 7,783 6,768 7,715
Deferred taxes before valuation allowance 109,274 250,050 88,326 426,602Valuation allowance (1,430) — — —
Total deferred taxes $ 107,844 $ 250,050 $ 88,326 $ 426,602
As of December 31, 2016 and 2015, WESCO had deferred tax assets of $10.0 million and $12.6 million, respectively, related to Canadian net operating loss carryforwards. The Canadian net operating loss carryforwards expire beginning in 2029 through 2036. Additionally, WESCO had deferred tax assets of $6.2 million and $5.3 million as of December 31, 2016 and 2015, respectively, related to non-Canadian foreign net operating loss carryforwards. These net operating loss carryforwards expire beginning in 2019, while some may be carried forward indefinitely. As of December 31, 2016 and 2015, WESCO had deferred tax assets of $3.2 million related to state net operating loss carryforwards. These carryforwards expire beginning in 2022 through 2035. The Company has determined, based upon an evaluation of all available positive and negative evidence, that it "more-likely-than-not" will utilize all of its net operating loss carryforwards before expiration other than those recently incurred in a non-Canadian foreign location. Accordingly, the Company recorded a partial valuation allowance of $1.4 million against the total deferred tax asset related to the non-Canadian foreign net operating loss carryforwards of $2.2 million at December 31, 2016.
As of December 31, 2016 and 2015, WESCO had deferred tax assets of $15.7 million and $11.5 million, respectively, related to U.S. foreign tax credit (“FTC”) carryforwards. These FTC carryforwards expire beginning in 2019 through 2025. The Company has determined that prudent and feasible tax planning strategies exist and it intends to implement these tax planning strategies to prevent these FTC carryforwards from expiring unused. Accordingly, a valuation allowance has not been recorded.

WESCO INTERNATIONAL, INC. AND SUBSIDIARIESNOTES TO CONSOLIDATED FINANCIAL STATEMENTS—(CONTINUED)
55
The Company is under examination by tax authorities in the United States and Canada and remains subject to examination until the applicable statutes of limitation expire. The statutes of limitation for the material jurisdictions in which the Company files income tax returns remain open as follows:
United States — Federal 2004 and forwardUnited States — Material States 2012 and forwardCanada 2004 and forward
The statutes of limitation with respect to the Company’s 2004 to 2007 U.S. federal income tax returns are open by waiver only in connection with the Mutual Agreement Procedure (“MAP”) concluded in the fourth quarter of 2015 between the Competent Authorities of the Internal Revenue Service (“IRS”) and Canada Revenue Agency (“CRA”) with respect to transfer pricing matters and matters pending before the Appeals Division of Canada Revenue Agency. The statutes of limitation with respect to the Company’s 2008 to 2011 U.S. federal income tax returns are open by waiver only in connection with the Advance Pricing Agreement (“APA”) concluded in the fourth quarter of 2015 between the IRS and CRA. The APA resolves certain transfer pricing matters for the 2008 to 2018 tax years. The statute of limitation with respect to the Company’s 2012 U.S. federal income tax return is open by waiver only in connection with the IRS examination of the 2012 and 2013 years and the APA.
The following table sets forth the reconciliation of gross unrecognized tax benefits:
As of December 31, 2016 2015 2014 (In thousands)
Beginning balance January 1 $ 5,436 $ 20,033 $ 25,548Additions based on tax positions related to the current year — 46 69Additions for tax positions of prior years 3,298 402 191Additions for acquired tax positions — — 308Reductions for tax positions of prior years (21) (378) (5,608)Settlements (1,921) (9,638) (209)Lapse in statute of limitations (728) (1,497) (40)Foreign currency exchange rate changes 117 (3,532) (226)Ending balance December 31 $ 6,181 $ 5,436 $ 20,033
The total amount of unrecognized tax benefits were $6.2 million, $5.4 million, and $20.0 million as of December 31, 2016, 2015 and 2014, respectively. The amount of unrecognized tax benefits that would affect the effective tax rate if recognized in the consolidated financial statements was $7.5 million, $6.2 million, and $20.4 million, respectively. The amount for 2014 primarily related to transfer pricing adjustments made by Canada Revenue Agency, which were subject to MAP and APA proceedings under the U.S./Canada income tax treaty. These proceedings concluded in the fourth quarter of 2015.
It is reasonably possible that the amount of unrecognized tax benefits will decrease by approximately $0.9 million within the next twelve months due to the settlement of uncertain tax positions related to Internal Revenue Service audits or the expiration of statutes of limitation. Of this amount, approximately $0.3 million could impact the effective tax rate.
The Company classifies interest related to unrecognized tax benefits as interest income or expense. Interest expense on unrecognized tax benefits was $1.2 million and $1.0 million for 2016 and 2014, respectively. In 2015, interest income of $8.7 million was recognized as a result of the conclusion of the MAP and APA proceedings for the 2004 to 2015 tax years. As of December 31, 2016 and 2015, WESCO had an accrued liability of $2.2 million and $2.1 million, respectively, for interest expense related to unrecognized tax benefits. The Company classifies penalties related to unrecognized tax benefits as part of income tax expense. Penalties recorded in income tax expense were immaterial in 2016, 2015, and 2014.

WESCO INTERNATIONAL, INC. AND SUBSIDIARIESNOTES TO CONSOLIDATED FINANCIAL STATEMENTS—(CONTINUED)
56
10. EARNINGS PER SHARE
Basic earnings per share is computed by dividing net income attributable to WESCO International by the weighted-average number of common shares outstanding during the periods. Diluted earnings per share is computed by dividing net income attributable to WESCO International by the weighted-average common shares and common share equivalents outstanding during the periods. The dilutive effect of common share equivalents is considered in the diluted earnings per share computation using the treasury stock method, which includes consideration of equity awards and contingently convertible debt.
The following tables set forth the details of basic and diluted earnings per share:
Year Ended December 31, 2016 2015 2014(In thousands, except per share data)
Net income attributable to WESCO International $ 101,588 $ 210,687 $ 275,906Weighted-average common shares outstanding used in computing basic
earnings per share 44,116 43,433 44,440Common shares issuable upon exercise of dilutive equity awards 543 626 997Common shares issuable from contingently convertible debentures (see
below for basis of calculation) 3,674 6,314 7,821Weighted-average common shares outstanding and common share
equivalents used in computing diluted earnings per share 48,333 50,373 53,258Earnings per share attributable to WESCO International
Basic $ 2.30 $ 4.85 $ 6.21Diluted $ 2.10 $ 4.18 $ 5.18
The computation of diluted earnings per share attributable to WESCO International excluded equity awards of approximately 1.2 million for the years ended December 31, 2016 and 2015, and 0.3 million for the year ended December 31, 2014. These shares were excluded because their effect would have been antidilutive.
Because of WESCO’s previous obligation to settle the par value of the 2029 Debentures in cash upon conversion, WESCO was required to include shares underlying the 2029 Debentures in its diluted weighted-average shares outstanding when the average stock price per share for the period exceeded the conversion price of the debentures. Only the number of shares that would have been issuable under the treasury stock method of accounting for share dilution were included, which was based upon the amount by which the average stock price exceeded the conversion price. The conversion price of the 2029 Debentures was $28.87 and the maximum amount of share dilution was limited to 11,951,932 shares. For the years ended December 31, 2016, 2015, and 2014, the effect of the 2029 Debentures on diluted earnings per share attributable to WESCO International was a decrease of $0.17, $0.60, and $0.89, respectively.
In December 2014, the Company's Board of Directors authorized the repurchase of up to $300 million of the Company's common stock through December 31, 2017. During the year ended December 31, 2015, the Company entered into accelerated stock repurchase agreements (the "ASR Transactions") with certain financial institutions to purchase shares of its common stock. In exchange for up-front cash payments totaling $150.0 million, the Company received 2,468,576 shares. The total number of shares ultimately delivered under the ASR Transactions was determined by the average of the volume-weighted-average prices of the Company's common stock for each exchange business day during the respective settlement valuation periods. WESCO funded the repurchases with borrowings under its prior revolving credit facility. For purposes of computing earnings per share in 2015, share repurchases have been reflected as a reduction to common shares outstanding on the respective share delivery dates.

WESCO INTERNATIONAL, INC. AND SUBSIDIARIESNOTES TO CONSOLIDATED FINANCIAL STATEMENTS—(CONTINUED)
57
11. EMPLOYEE BENEFIT PLANS
Defined Contribution Plans
A majority of WESCO’s employees are covered by defined contribution retirement savings plans for their service rendered subsequent to WESCO’s formation. WESCO also offers a deferred compensation plan for select individuals. For U.S. participants, WESCO matches contributions made by employees at an amount equal to 50% of the participants' total monthly contributions up to a maximum of 6% of eligible compensation. For Canadian participants, WESCO will make contributions in an amount ranging from 3% to 5% of participants' eligible compensation based on years of continuous service. In addition, for U.S. participants, employer contributions may be made at the discretion of the Board of Directors. A discretionary employer contribution charge of $9.7 million was incurred in 2014. For the years ended December 31, 2016, 2015 and 2014, WESCO incurred charges of $18.5 million, $18.1 million, and $28.3 million, respectively, for all such plans. Contributions are made in cash to employee retirement savings plan accounts. The deferred compensation plan is an unfunded plan. As of December 31, 2016 and 2015, the Company's obligation under the deferred compensation plan was $21.7 million and $23.5 million, respectively. Employees have the option to transfer balances allocated to their accounts in the defined contribution retirement savings plan and the deferred compensation plan into any of the available investment options.
Defined Benefit Plans
In connection with the December 14, 2012 acquisition of EECOL, the Company assumed a contributory defined benefit plan (the "Plan") covering substantially all Canadian employees of EECOL. The Plan provides retirement benefits based on earnings and credited service, and participants contribute 2% of their earnings to the Plan. Participants become 100% vested after two years of continuous service.
The Company also assumed EECOL's Supplemental Executive Retirement Plan (the "SERP"), which provides additional pension benefits to certain executives based on earnings, credited service and executive service. Participants in the SERP become 100% vested after two years of continuous service and contribute 4% of their earnings to the SERP.

WESCO INTERNATIONAL, INC. AND SUBSIDIARIESNOTES TO CONSOLIDATED FINANCIAL STATEMENTS—(CONTINUED)
58
The following tables present the changes in benefit obligations, plan assets and funded status for the pension plans and the components of net periodic pension cost.
Year Ended December 31,(In thousands) 2016 2015Accumulated Benefit Obligation (ABO) at December 31 $ 75,666 $ 67,614
Change in Projected Benefit Obligation (PBO) PBO at beginning of year $ 87,186 $ 106,325Service cost 3,845 4,537Interest cost 3,856 4,012Participant contributions 709 735Actuarial loss (gain), including assumption changes 2,172 (6,687)Benefits paid (4,404) (3,986)Foreign currency exchange rate changes 2,796 (17,750)PBO at end of year $ 96,160 $ 87,186
Change in Plan Assets Fair value of plan assets at beginning of year $ 79,185 $ 90,342Actual return on plan assets 4,115 4,781Participant contributions 709 735Employer contributions 1,956 2,366Benefits paid (4,404) (3,986)Foreign currency exchange rate changes 3,192 (15,053)Fair value of plan assets at end of year $ 84,753 $ 79,185
Funded Status $ (11,407) $ (8,001)
Amounts Recognized in the Consolidated Balance SheetsCurrent liabilities $ (364) $ (355)Noncurrent liabilities (11,043) (7,646)Net amount recognized $ (11,407) $ (8,001)
Amounts Recognized in Accumulated Other Comprehensive Income (Loss)Net actuarial gain $ (5,333) $ (9,021)Total net amount recognized, before tax effect $ (5,333) $ (9,021)

WESCO INTERNATIONAL, INC. AND SUBSIDIARIESNOTES TO CONSOLIDATED FINANCIAL STATEMENTS—(CONTINUED)
59
Year Ended December 31,(In thousands) 2016 2015 2014Components of Net Periodic Pension Cost Service cost $ 3,845 $ 4,537 $ 3,610Interest cost 3,856 4,012 4,600Expected return on plan assets (5,328) (5,260) (5,408)Recognized actuarial gain (31) (15) (55)Net periodic pension cost $ 2,342 $ 3,274 $ 2,747
Other Changes in Plan Assets and PBO Recognized in AccumulatedOther Comprehensive Income (Loss)
Net actuarial loss (gain) $ 2,756 $ (6,208) $ 7,448Amortization of unrecognized net actuarial gain 31 15 55Total amount recognized, before tax effect 2,787 (6,193) 7,503Tax effect (302) 1,661 (2,447)Total amount recognized, after tax effect $ 2,485 $ (4,532) $ 5,056
Total recognized in net periodic pension cost and accumulated othercomprehensive income (loss) $ 4,827 $ (1,258) $ 7,803
The following weighted-average actuarial assumptions were used to determine benefit obligations at December 31:
2016 2015
Pension Plan SERP Pension Plan SERP
Discount rate 3.9% 3.9% 4.2% 4.2%Rate of compensation increase 3.8% 3.8% 4.0% 4.0%
The following weighted-average actuarial assumptions were used to determine net periodic pension costs at January 1:
Year Ended December 31,2016 2015 2014
Pension Plan SERP Pension Plan SERP Pension Plan SERP
Discount rate 4.2% 4.2% 4.1% 4.1% 4.9% 4.9%Expected long-term return on assets 6.4% n/a 6.4% n/a 6.4% n/aRate of compensation increase 4.0% 4.0% 4.0% 4.0% 4.0% 4.0%
The following benefit payments, which reflect expected future service, are expected to be paid:
Years ending December 31 (In thousands)
2017 $ 2,8512018 2,8762019 2,9112020 2,9872021 3,1422022 to 2026 18,617
The Company expects to contribute approximately $0.4 million to the plans in 2017.

WESCO INTERNATIONAL, INC. AND SUBSIDIARIESNOTES TO CONSOLIDATED FINANCIAL STATEMENTS—(CONTINUED)
60
The Company's pension plan weighted asset allocations by asset category are as follows:
December 312016 2015
Asset Category Pooled Funds:
Canadian equities 11.7% 23.0%U.S. equities 4.6% 14.0%Non-North American equities 21.6% 18.6%Fixed income investments 43.4% 37.5%
Other 18.7% 6.9%Total 100.0% 100.0%
The Plan's long-term overall objective is to maintain benefits at their current level without affecting the cost of maintaining the Plan, assuming that the demographic make-up of the group of members remains the same.
The primary investment objective, in support of the overall objective, is to earn the highest rate of return possible for the Plan, while keeping risk at acceptable levels. The long-term return objective of the Plan is to achieve a minimum annualized rate of return in excess of the actuarial requirements. This translates into a required return of 3.0% above inflation, net of investment management fees. The return objective is consistent with the overall investment risk level that the Plan assumes in order to meet the pension obligations of the Plan. To achieve this long term investment objective, the Plan has adopted an asset mix that has a combination of equity and fixed income investments. Risk is controlled by investing in a well-diversified portfolio of asset classes. A benchmark portfolio is established based on the expected returns for each asset class available. The investment of the Plan's assets in accordance with the benchmark portfolio should enable the Plan to not only attain, but also exceed the minimum overall objective.
The following table presents the target asset mix based on market value for each investment category within which the investment managers must invest the Plan's assets. The asset mix is reviewed and rebalanced to target on an annual basis.
Asset Category Target %Canadian equities 12.5%Non-Canadian equities 27.5%
Total equities 40%Fixed income investments 45%Other investments 15%
The Plan's assets are measured at fair value, which is defined as the price that would be received to sell an asset or paid to transfer a liability in an orderly transaction between market participants at the measurement date. As described in Note 2, "Accounting Policies," financial assets and liabilities are classified in the fair value hierarchy based on the lowest level of any input that is significant to the measurement of fair value. Investments for which fair value is measured using the NAV per share practical expedient are not classified in the fair value hierarchy. The following describes the valuation methodologies used to measure the fair value of the Plan's assets.
Pooled Equity Investments. These investments consist of the Plan's share of segregated funds that invest primarily in equity securities. The funds are valued at the net asset value of shares held at December 31.
Pooled Fixed Income Investments. These investments consist of a segregated fund that primarily invests in Canadian issued bonds and debentures and is valued at the net asset value of shares held in the underlying funds.
Other Investments. These investments consist of money market and diversified growth funds. The diversified growth fund invests in a broad range of asset classes, including equities, bonds, infrastructure, property, commodities and absolute return strategies. These investments are valued at the net asset value of shares held in the underlying funds.

WESCO INTERNATIONAL, INC. AND SUBSIDIARIESNOTES TO CONSOLIDATED FINANCIAL STATEMENTS—(CONTINUED)
61
The fair value methods described above may not be indicative of net realizable value or reflective of future fair values. Additionally, while the Company believes the valuation methods are appropriate and consistent with other market participants, the use of different methodologies or assumptions to determine the fair value of certain financial instruments could result in a different fair value measurement at the reporting date.
The following tables set forth the fair value of plan assets by asset category:
December 31, 2016
(In thousands) Level 1 Level 2 Level 3 NAV (1) TotalPooled Funds:
Canadian equities $ — $ — $ — $ 9,916 $ 9,916U.S. equities — — — 3,881 3,881Non-North American equities — — — 18,296 18,296Fixed income investments — — — 36,677 36,677
Other 235 — — 15,748 15,983Total investments $ 235 $ — $ — $ 84,518 $ 84,753
December 31, 2015
(In thousands) Level 1 Level 2 Level 3 NAV (1) TotalPooled Funds:
Canadian equities $ — $ — $ — $ 18,189 $ 18,189U.S. equities — — — 11,055 11,055Non-North American equities — — — 14,649 14,649Fixed income investments — — — 29,601 29,601
Other 241 — — 5,450 5,691Total investments $ 241 $ — $ — $ 78,944 $ 79,185
(1) As described above, investments measured at fair value using the NAV per share practical expedient have not been classified in the fair value hierarchy. The amounts presented in the tables are intended to reconcile the fair value hierarchy to the total fair value of plan assets.
12. STOCK-BASED COMPENSATION
WESCO sponsors four stock-based compensation plans. The 1999 Long-Term Incentive Plan, as amended and restated (“LTIP”), was designed to be the successor plan to all prior plans. Any shares remaining reserved for future issuance under the prior plans are available for issuance under the LTIP. The LTIP and predecessor plans are administered by the Compensation Committee of the Board of Directors.
On May 30, 2013, the Company renewed and restated the LTIP, increasing the maximum number of shares of common stock that may be issued under the plan by 1.6 million shares to 4.0 million. Under the LTIP, the total number of shares of common stock authorized to be issued under the LTIP will be reduced by 1 share of common stock for every 1 share that is subject to an option or stock appreciation right granted, and 1.83 shares of common stock for every 1 share that is subject to an award other than an option or stock appreciation right granted on or after May 30, 2013. As of December 31, 2016, 2.4 million shares of common stock were reserved under the LTIP for future equity award grants.
Except for the performance-based award, awards granted vest and become exercisable once criteria based on time is achieved. Performance-based awards vest based on market or performance conditions. All awards vest immediately in the event of a change in control. Each award terminates on the tenth anniversary of its grant date unless terminated sooner under certain conditions.
WESCO recognized $12.5 million, $12.9 million and $14.8 million of non-cash stock-based compensation expense, which is included in selling, general and administrative expenses, for the years ended December 31, 2016, 2015 and 2014, respectively. As of December 31, 2016, there was $16.8 million of total unrecognized compensation expense related to non-vested stock-based compensation arrangements for all awards previously made of which approximately $9.9 million is expected to be recognized in 2017, $5.9 million in 2018 and $1.0 million in 2019.

WESCO INTERNATIONAL, INC. AND SUBSIDIARIESNOTES TO CONSOLIDATED FINANCIAL STATEMENTS—(CONTINUED)
62
The total intrinsic value of awards exercised during the years ended December 31, 2016, 2015, and 2014 was $13.0 million, $15.8 million, and $25.2 million, respectively. The total amount of cash received from the exercise of options was $0.8 million during the year ended December 31, 2014. The gross deferred tax benefit associated with the exercise of stock-based awards totaled $4.9 million, $5.7 million, and $9.4 million in 2016, 2015, and 2014, respectively.
The following table sets forth a summary of stock-settled stock appreciation rights and related information for the years indicated:
2016 2015 2014
Awards
Weighted-AverageExercise
Price
Weighted-Average
RemainingContractual
Life
AggregateIntrinsic
Value(In
thousands) Awards
Weighted-AverageExercise
Price Awards
Weighted-AverageExercise
Price
Beginning of year 2,567,021 $ 54.47 2,480,745 $ 50.91 2,715,651 $ 45.93Granted 709,999 42.63 394,182 69.54 274,508 85.35Exercised (526,818) 41.54 (232,542) 35.80 (485,469) 41.58Canceled (310,715) 63.71 (75,364) 73.59 (23,945) 70.30End of year 2,439,487 52.62 5.6 $ 40,135 2,567,021 54.47 2,480,745 50.91Exercisable at end
of year 1,549,350 $ 53.35 3.8 $ 24,903 2,034,263 $ 49.36 1,980,767 $ 44.06
WESCO granted the following stock-settled stock appreciation rights at the following weighted-average assumptions:
2016 2015 2014
Stock-settled stock appreciation rights granted 709,999 394,182 274,508 Risk free interest rate 1.2% 1.6% 1.5% Expected life (in years) 5 5 5 Expected volatility 32% 32% 39%
The weighted-average fair value per stock-settled stock appreciation right granted was $12.88, $21.68 and $30.64 for the years ended December 31, 2016, 2015 and 2014, respectively.
The following table sets forth a summary of time-based restricted stock units and related information for the year ended December 31, 2016:
Awards
Weighted-Average
FairValue
Unvested at December 31, 2015 175,411 $ 74.52Granted 162,256 44.45Vested (60,015) 72.41Forfeited (20,556) 59.15
Unvested at December 31, 2016 257,096 $ 57.47
The weighted-average fair value per restricted stock unit granted was $44.45, $69.05 and $85.32 for the years ended December 31, 2016, 2015 and 2014, respectively.

WESCO INTERNATIONAL, INC. AND SUBSIDIARIESNOTES TO CONSOLIDATED FINANCIAL STATEMENTS—(CONTINUED)
63
The following table sets forth a summary of performance-based awards for the year ended December 31, 2016:
Awards
Weighted-Average
FairValue
Unvested at December 31, 2015 114,520 $ 76.48 Granted 91,768 47.00 Vested — — Forfeited (56,968) 71.25Unvested at December 31, 2016 149,320 $ 60.36
The fair value of the performance shares based on total stockholder return granted during the year ended December 31, 2016 were estimated using the following weighted-average assumptions:
Weighted-Average Assumptions
Grant date share price $ 42.44WESCO expected volatility 26.3%Peer group median volatility 24.2%Risk-free interest rate 0.89%Correlation 121.5%
The unvested performance-based awards in the table above include 74,660 shares in which vesting of the ultimate number of shares is dependent upon WESCO's total stockholder return in relation to the total stockholder return of a select group of peer companies over a three-year period. The fair value of these awards is determined using a Monte Carlo simulation model. These awards are accounted for as awards with market conditions; compensation cost is recognized over the service period, regardless of whether the market conditions are achieved and the awards ultimately vest.
Vesting of the remaining 74,660 shares of performance-based awards in the table above is dependent upon the three-year average growth rate of WESCO's net income. The fair value of these awards is based upon the grant-date closing price of WESCO's common stock. These awards are accounted for as awards with performance conditions; compensation cost is recognized over the performance period based upon WESCO's determination of whether it is probable that the performance targets will be achieved.
13. COMMITMENTS AND CONTINGENCIES
Future minimum rental payments required under operating leases, primarily for real property that have noncancelable lease terms in excess of one year as of December 31, 2016, are as follows:
Years ending December 31 (In thousands)
2017 $ 68,2872018 58,0392019 45,2142020 33,8862021 23,397Thereafter 49,665
Rental expense for the years ended December 31, 2016, 2015 and 2014 was $76.7 million, $70.7 million and $63.2 million, respectively.

WESCO INTERNATIONAL, INC. AND SUBSIDIARIESNOTES TO CONSOLIDATED FINANCIAL STATEMENTS—(CONTINUED)
64
From time to time, a number of lawsuits and claims have been or may be asserted against WESCO relating to the conduct of its business, including routine litigation relating to commercial and employment matters. The outcomes of litigation cannot be predicted with certainty, and some lawsuits may be determined adversely to WESCO. However, management does not believe that the ultimate outcome of any such pending matters is likely to have a material adverse effect on WESCO’s financial condition or liquidity, although the resolution in any fiscal period of one or more of these matters may have a material adverse effect on WESCO’s results of operations for that period.
WESCO is subject to the laws and regulations of states and other jurisdictions concerning the identification, reporting and escheatment (the transfer of property to the state) of unclaimed or abandoned funds, and is subject to audit and examination for compliance with these requirements. WESCO Distribution is currently undergoing a compliance audit in the State of Delaware concerning the identification, reporting and escheatment of unclaimed or abandoned property. A third party auditor is conducting the audit on behalf of the State, and the Company has been working with an outside consultant during the audit process and in discussions with the auditors. The Company is defending the audit, the outcome of which cannot be predicted with certainty at this time. After the third party auditor completes its field work, it is expected to issue preliminary findings for review by the Company and the State, and thereafter the auditor is expected to issue a final report of examination. If the Company and State do not reach resolution after further discussion, the State may issue a demand for payment, which the Company may either agree to pay or appeal, in full or in part. The Company has recorded a liability for unclaimed property based on the facts currently known to the Company.
In October 2014, WESCO was notified that the New York County District Attorney’s Office is conducting a criminal investigation involving minority and disadvantaged business contracting practices in the construction industry in New York City and that various contractors, minority and disadvantaged business firms, and their material suppliers, including the Company, are a part of this investigation. The Company intends to cooperate with the government investigation. The Company cannot predict the outcome or impact of the matter at this time, but could be subject to fines, penalties or other adverse consequences. Based on the facts currently known to the Company, it cannot reasonably estimate a range of exposure to potential liability at this time.
14. SEGMENTS AND RELATED INFORMATION
WESCO provides distribution of product and services through its four operating segments, which have been aggregated as one reportable segment. WESCO has approximately 230,000 unique product stock keeping units and markets more than 1,000,000 products for customers. There were no material amounts of sales or transfers among geographic areas and no material amounts of export sales.
WESCO attributes revenues from external customers to individual countries on the basis of the point of sale. The following table sets forth information about WESCO by geographic area:
Net SalesYear Ended December 31,
Long-Lived AssetsDecember 31,
2016 2015 2014 2016 2015 2014(In thousands)
United States $ 5,635,803 77% $ 5,665,962 75% $ 5,618,240 71% $ 123,465 $ 157,570 $ 127,670Canada 1,394,657 19% 1,533,705 21% 1,899,173 24% 60,372 63,088 80,080Mexico 62,430 1% 70,048 1% 95,585 1% 227 332 442
Subtotal North AmericanOperations 7,092,890 7,269,715 7,612,998 184,064 220,990 208,192
Other International 243,127 3% 248,772 3% 276,628 4% 4,583 5,369 8,213Total $ 7,336,017 $ 7,518,487 $ 7,889,626 $ 188,647 $ 226,359 $ 216,405

WESCO INTERNATIONAL, INC. AND SUBSIDIARIESNOTES TO CONSOLIDATED FINANCIAL STATEMENTS—(CONTINUED)
65
The following table sets forth sales information about WESCO’s sales by product category:
Year Ended December 31, 2016 2015 2014(percentages based on total sales)
General Supplies 40% 40% 40%Wire, Cable and Conduit 14% 15% 16%Communications and Security 15% 15% 14%Electrical Distribution and Controls 11% 11% 11%Lighting and Sustainability 12% 10% 10%Automation, Controls and Motors 8% 9% 9%
15. CONDENSED CONSOLIDATING FINANCIAL INFORMATION
WESCO Distribution has outstanding $500 million in aggregate principal amount of 2021 Notes and $350 million in aggregate principal amount of 2024 Notes. The 2021 Notes and 2024 Notes are unsecured senior obligations of WESCO Distribution and are fully and unconditionally guaranteed on a senior unsecured basis by WESCO International.
Condensed consolidating financial information for WESCO International, WESCO Distribution and the non-guarantor subsidiaries is presented in the following tables.
Condensed Consolidating Balance Sheet December 31, 2016 (In thousands)
WESCOInternational,
Inc.
WESCODistribution,
Inc.Non-Guarantor
Subsidiaries
Consolidatingand
EliminatingEntries Consolidated
Cash and cash equivalents $ — $ 41,552 $ 68,579 $ — $ 110,131Trade accounts receivable, net — — 1,034,402 — 1,034,402Inventories — 364,562 456,879 — 821,441Prepaid expenses and other current assets 13,647 24,214 225,412 (56,790) 206,483
Total current assets 13,647 430,328 1,785,272 (56,790) 2,172,457Intercompany receivables, net — — 2,056,783 (2,056,783) —Property, buildings and equipment, net — 51,824 105,783 — 157,607Intangible assets, net — 3,417 389,945 — 393,362Goodwill — 244,648 1,476,066 — 1,720,714Investments in affiliates 3,584,857 4,018,661 — (7,603,518) —Other assets — 23,846 22,998 — 46,844
Total assets $ 3,598,504 $ 4,772,724 $ 5,836,847 $ (9,717,091) $ 4,490,984
Accounts payable $ — $ 381,795 $ 302,926 $ — $ 684,721Short-term debt — — 20,920 — 20,920Other current liabilities — 53,458 194,488 (56,790) 191,156
Total current liabilities — 435,253 518,334 (56,790) 896,797Intercompany payables, net 1,572,486 484,297 — (2,056,783) —Long-term debt — 983,449 379,686 — 1,363,135Other noncurrent liabilities 12,737 46,476 161,827 — 221,040Total WESCO International stockholders’ equity 2,013,281 2,823,249 4,780,269 (7,603,518) 2,013,281Noncontrolling interests — — (3,269) — (3,269)
Total liabilities and stockholders’ equity $ 3,598,504 $ 4,772,724 $ 5,836,847 $ (9,717,091) $ 4,490,984

WESCO INTERNATIONAL, INC. AND SUBSIDIARIESNOTES TO CONSOLIDATED FINANCIAL STATEMENTS—(CONTINUED)
66
Condensed Consolidating Balance Sheet December 31, 2015 (In thousands)
WESCOInternational,
Inc.
WESCODistribution,
Inc.Non-Guarantor
Subsidiaries
Consolidatingand
EliminatingEntries Consolidated
Cash and cash equivalents $ — $ 38,963 $ 121,316 $ — $ 160,279Trade accounts receivable, net — — 1,075,257 — 1,075,257Inventories — 376,641 433,426 — 810,067Prepaid expenses and other current assets 15 47,290 173,596 (8,970) 211,931
Total current assets 15 462,894 1,803,595 (8,970) 2,257,534Intercompany receivables, net — — 1,964,848 (1,964,848) —Property, buildings and equipment, net — 56,921 109,818 — 166,739Intangible assets, net — 4,072 399,577 — 403,649Goodwill — 255,251 1,426,411 — 1,681,662Investments in affiliates 3,309,006 3,827,069 — (7,136,075) —Other assets — 32,601 27,541 — 60,142
Total assets $ 3,309,021 $ 4,638,808 $ 5,731,790 $ (9,109,893) $ 4,569,726
Accounts payable $ — $ 414,524 $ 300,995 $ — $ 715,519Short-term debt — — 43,314 — 43,314Other current liabilities 15,254 55,129 127,555 (8,970) 188,968
Total current liabilities 15,254 469,653 471,864 (8,970) 947,801Intercompany payables, net 1,320,240 644,608 — (1,964,848) —Long-term debt 177,753 737,490 523,819 — 1,439,062Other noncurrent liabilities 19,102 216,515 173,375 — 408,992Total WESCO International stockholders’ equity 1,776,672 2,570,542 4,565,533 (7,136,075) 1,776,672Noncontrolling interests — — (2,801) — (2,801)
Total liabilities and stockholders’ equity $ 3,309,021 $ 4,638,808 $ 5,731,790 $ (9,109,893) $ 4,569,726
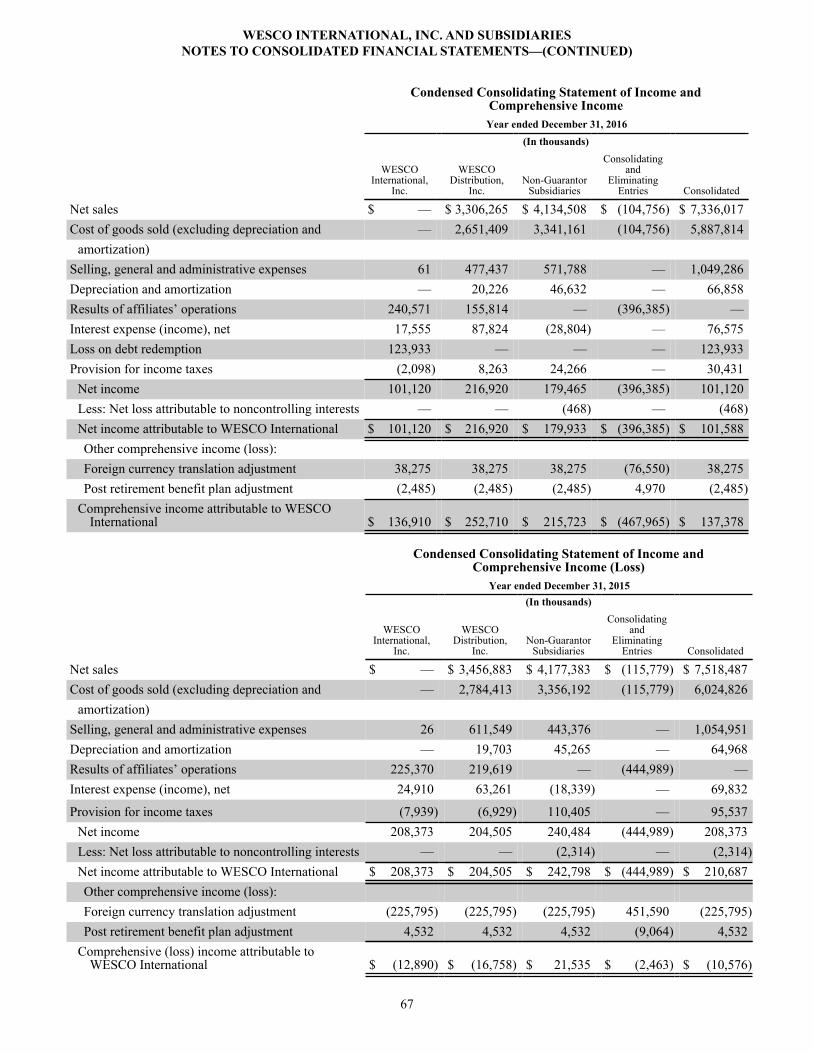
WESCO INTERNATIONAL, INC. AND SUBSIDIARIESNOTES TO CONSOLIDATED FINANCIAL STATEMENTS—(CONTINUED)
67
Condensed Consolidating Statement of Income andComprehensive Income
Year ended December 31, 2016 (In thousands)
WESCOInternational,
Inc.
WESCODistribution,
Inc.Non-Guarantor
Subsidiaries
Consolidatingand
EliminatingEntries Consolidated
Net sales $ — $ 3,306,265 $ 4,134,508 $ (104,756) $ 7,336,017Cost of goods sold (excluding depreciation and — 2,651,409 3,341,161 (104,756) 5,887,814
amortization)Selling, general and administrative expenses 61 477,437 571,788 — 1,049,286Depreciation and amortization — 20,226 46,632 — 66,858Results of affiliates’ operations 240,571 155,814 — (396,385) —Interest expense (income), net 17,555 87,824 (28,804) — 76,575Loss on debt redemption 123,933 — — — 123,933Provision for income taxes (2,098) 8,263 24,266 — 30,431
Net income 101,120 216,920 179,465 (396,385) 101,120Less: Net loss attributable to noncontrolling interests — — (468) — (468)Net income attributable to WESCO International $ 101,120 $ 216,920 $ 179,933 $ (396,385) $ 101,588Other comprehensive income (loss):Foreign currency translation adjustment 38,275 38,275 38,275 (76,550) 38,275Post retirement benefit plan adjustment (2,485) (2,485) (2,485) 4,970 (2,485)
Comprehensive income attributable to WESCOInternational $ 136,910 $ 252,710 $ 215,723 $ (467,965) $ 137,378
Condensed Consolidating Statement of Income andComprehensive Income (Loss)
Year ended December 31, 2015 (In thousands)
WESCOInternational,
Inc.
WESCODistribution,
Inc.Non-Guarantor
Subsidiaries
Consolidatingand
EliminatingEntries Consolidated
Net sales $ — $ 3,456,883 $ 4,177,383 $ (115,779) $ 7,518,487Cost of goods sold (excluding depreciation and — 2,784,413 3,356,192 (115,779) 6,024,826
amortization)Selling, general and administrative expenses 26 611,549 443,376 — 1,054,951Depreciation and amortization — 19,703 45,265 — 64,968Results of affiliates’ operations 225,370 219,619 — (444,989) —Interest expense (income), net 24,910 63,261 (18,339) — 69,832
Provision for income taxes (7,939) (6,929) 110,405 — 95,537Net income 208,373 204,505 240,484 (444,989) 208,373Less: Net loss attributable to noncontrolling interests — — (2,314) — (2,314)Net income attributable to WESCO International $ 208,373 $ 204,505 $ 242,798 $ (444,989) $ 210,687Other comprehensive income (loss):Foreign currency translation adjustment (225,795) (225,795) (225,795) 451,590 (225,795)Post retirement benefit plan adjustment 4,532 4,532 4,532 (9,064) 4,532
Comprehensive (loss) income attributable toWESCO International $ (12,890) $ (16,758) $ 21,535 $ (2,463) $ (10,576)

WESCO INTERNATIONAL, INC. AND SUBSIDIARIESNOTES TO CONSOLIDATED FINANCIAL STATEMENTS—(CONTINUED)
68
Condensed Consolidating Statement of Income andComprehensive Income
Year ended December 31, 2014 (In thousands)
WESCOInternational,
Inc.
WESCODistribution,
Inc.Non-Guarantor
Subsidiaries
Consolidatingand
EliminatingEntries Consolidated
Net sales $ — $ 3,557,839 $ 4,446,139 $ (114,352) $ 7,889,626Cost of goods sold (excluding depreciation and — 2,848,413 3,544,523 (114,352) 6,278,584
amortization)Selling, general and administrative expenses 9 557,596 519,203 — 1,076,808Depreciation and amortization — 19,084 48,933 — 68,017Results of affiliates’ operations 292,845 231,174 — (524,019) —Interest expense (income), net 24,472 74,653 (17,061) — 82,064Provision for income taxes (7,072) 16,446 99,342 — 108,716
Net income $ 275,436 $ 272,821 $ 251,199 $ (524,019) $ 275,437Less: Net loss attributable to noncontrolling interests — — (469) — (469)Net income attributable to WESCO International $ 275,436 $ 272,821 $ 251,668 $ (524,019) $ 275,906Other comprehensive income (loss):Foreign currency translation adjustment (120,293) (120,293) (120,293) 240,586 (120,293)Post retirement benefit plan adjustment (5,056) (5,056) (5,056) 10,112 (5,056)
Comprehensive income attributable to WESCOInternational $ 150,087 $ 147,472 $ 126,319 $ (273,321) $ 150,557

WESCO INTERNATIONAL, INC. AND SUBSIDIARIESNOTES TO CONSOLIDATED FINANCIAL STATEMENTS—(CONTINUED)
69
Condensed Consolidating Statement of Cash Flows Year ended December 31, 2016 (In thousands)
WESCOInternational,
Inc.
WESCODistribution,
Inc.Non-Guarantor
Subsidiaries
Consolidatingand
EliminatingEntries Consolidated
Net cash provided by (used in) operating activities $ 95,388 $ (243,476) $ 448,323 $ — $ 300,235Investing activities:
Capital expenditures — (12,482) (5,475) — (17,957)Acquisition payments, net of cash acquired — (50,890) — — (50,890)Proceeds from sale of assets — — 8,361 — 8,361Dividends received from subsidiaries — 82,912 — (82,912) —Advances to subsidiaries and other — (297,259) (337,344) 624,603 (10,000)Net cash used in investing activities — (277,719) (334,458) 541,691 (70,486)
Financing activities:Proceeds from issuance of debt 252,246 1,566,864 672,345 (297,259) 2,194,196Repayments of debt (344,804) (1,030,520) (752,401) (327,344) (2,455,069)Equity activities (2,830) — — — (2,830)Dividends paid by subsidiaries — — (82,912) 82,912 —Other — (12,560) — — (12,560)Net cash (used in) provided by financing activities (95,388) 523,784 (162,968) (541,691) (276,263)
Effect of exchange rate changes on cash and cashequivalents — — (3,634) — (3,634)
Net change in cash and cash equivalents — 2,589 (52,737) — (50,148)Cash and cash equivalents at the beginning of period — 38,963 121,316 — 160,279Cash and cash equivalents at the end of period $ — $ 41,552 $ 68,579 $ — $ 110,131

WESCO INTERNATIONAL, INC. AND SUBSIDIARIESNOTES TO CONSOLIDATED FINANCIAL STATEMENTS—(CONTINUED)
70
Condensed Consolidating Statement of Cash FlowsYear ended December 31, 2015
(In thousands)
WESCOInternational,
Inc.
WESCODistribution,
Inc.Non-Guarantor
Subsidiaries
Consolidatingand
EliminatingEntries Consolidated
Net cash provided by operating activities $ 3,531 $ 214,037 $ 65,481 $ — $ 283,049Investing activities:
Capital expenditures — (15,266) (6,392) — (21,658)Acquisition payments, net of cash acquired — (151,595) — — (151,595)Proceeds from sale of assets — — 3,023 — 3,023Dividends received from subsidiaries — 114,101 — (114,101) —Advances to subsidiaries and other — (197,345) 17,461 179,884 —Net cash (used in) provided by investing activities — (250,105) 14,092 65,783 (170,230)
Financing activities:Proceeds from issuance of debt 150,705 1,224,596 452,655 (197,345) 1,630,611Repayments of debt — (1,175,056) (379,578) 17,461 (1,537,173)Equity activities (154,236) — — — (154,236)Dividends paid by subsidiaries — — (114,101) 114,101 —Other — (7,017) — — (7,017)Net cash provided by (used in) financing activities (3,531) 42,523 (41,024) (65,783) (67,815)
Effect of exchange rate changes on cash and cashequivalents — — (13,044) — (13,044)
Net change in cash and cash equivalents — 6,455 25,505 — 31,960Cash and cash equivalents at the beginning of period — 32,508 95,811 — 128,319Cash and cash equivalents at the end of period $ — $ 38,963 $ 121,316 $ — $ 160,279

WESCO INTERNATIONAL, INC. AND SUBSIDIARIESNOTES TO CONSOLIDATED FINANCIAL STATEMENTS—(CONTINUED)
71
Condensed Consolidating Statement of Cash Flows Year ended December 31, 2014 (In thousands)
WESCOInternational,
Inc.
WESCODistribution,
Inc.Non-Guarantor
Subsidiaries
Consolidatingand
EliminatingEntries Consolidated
Net cash provided by operating activities $ 820 $ 51,738 $ 198,598 $ — $ 251,156Investing activities:
Capital expenditures — (13,717) (6,831) — (20,548)Acquisition payments, net of cash acquired — (42,226) (96,404) — (138,630)Proceeds from sale of assets — — 14,991 — 14,991Dividends received from subsidiaries — 71,381 — (71,381) —Advances to subsidiaries and other — (53,779) 17,461 36,318 —Net cash used in investing activities — (38,341) (70,783) (35,063) (144,187)
Financing activities:Proceeds from issuance of debt 6,517 798,315 495,493 (60,437) 1,239,888Repayments of debt (6,658) (807,776) (541,080) 24,119 (1,331,395)Equity activities (679) — — — (679)Dividends paid by subsidiaries — — (71,381) 71,381 —Other — (3,123) (181) — (3,304)Net cash used in financing activities (820) (12,584) (117,149) 35,063 (95,490)
Effect of exchange rate changes on cash and cashequivalents — — (6,885) — (6,885)
Net change in cash and cash equivalents — 813 3,781 — 4,594Cash and cash equivalents at the beginning of period — 31,695 92,030 — 123,725Cash and cash equivalents at the end of period $ — $ 32,508 $ 95,811 $ — $ 128,319
Revisions
The Condensed Consolidating Statements of Cash Flow for the year ended December 31, 2014 was revised to appropriately present dividends paid by the non-guarantor subsidiaries and dividends received by WESCO Distribution. The revisions did not impact the consolidated amounts previously reported, nor did they impact the Company's obligations under the 2021 Notes or the 2024 Notes.

WESCO INTERNATIONAL, INC. AND SUBSIDIARIESNOTES TO CONSOLIDATED FINANCIAL STATEMENTS—(CONTINUED)
72
16. SELECTED QUARTERLY FINANCIAL DATA (unaudited)
The following table sets forth selected quarterly financial data for the years ended December 31, 2016 and 2015:
FirstQuarter
SecondQuarter
ThirdQuarter
FourthQuarter
2016 Net Sales $ 1,775,961 $ 1,911,582 $ 1,855,212 $ 1,793,262Cost of goods sold (excluding depreciation and amortization) 1,420,793 1,532,113 1,490,173 1,444,735Income from operations 69,508 87,987 92,555 82,009Income (loss) before income taxes 50,679 68,535 (52,170) 64,507Net income (loss) 34,534 49,852 (31,021) 47,755
Net income (loss) attributable to WESCO International 36,053 49,798 (31,611) 47,348Basic earnings (loss) per share attributable to WESCO
International, Inc.(A) (C) 0.85 1.18 (0.73) 0.97Diluted earnings (loss) per share attributable to WESCO
International, Inc.(B) (C) 0.77 1.02 (0.73) 0.96
2015 Net Sales $ 1,816,330 $ 1,916,718 $ 1,923,899 $ 1,861,540Cost of goods sold (excluding depreciation and amortization) 1,448,639 1,535,084 1,543,113 1,497,990Income from operations 87,185 90,253 106,348 89,956Income before income taxes 66,291 71,640 85,931 80,048Net income 46,793 50,639 62,384 48,557
Net income attributable to WESCO International 47,031 51,741 63,503 48,412Basic earnings per share attributable to WESCO
International, Inc.(A) 1.06 1.18 1.47 1.15Diluted earnings per share attributable to WESCO
International, Inc.(B) 0.90 1.00 1.28 1.03
(A) Earnings per share (EPS) in each quarter is computed using the weighted-average number of shares outstanding during that quarter while EPS for the full year is computed by using the weighted-average number of shares outstanding during the year. Thus, the sum of the four quarters’ EPS may not equal the full-year EPS.
(B) Diluted EPS in each quarter is computed using the weighted-average number of shares outstanding and common share equivalents during that quarter while Diluted EPS for the full year is computed by using the weighted-average number of shares outstanding and common share equivalents during the year. Thus, the sum of the four quarters’ Diluted EPS may not equal the full-year Diluted EPS.
(C) On September 15, 2016, the Company completed the redemption of its 2029 Debentures. The redemption resulted in a non-cash charge of $123.9 million, which resulted in a net loss attributable to WESCO International, Inc. for the three months ended September 30, 2016. Accordingly, dilutive shares were not included in the calculation of diluted loss per share for the three months ended September 30, 2016 because their effect was antidilutive.

73
Item 9. Changes in and Disagreements with Accountants on Accounting and Financial Disclosure.
None.
Item 9A. Controls and Procedures.
Conclusion Regarding the Effectiveness of Disclosure Controls and Procedures
Under the supervision and with the participation of our management, including our principal executive officer and principal financial officer, we conducted an evaluation of our disclosure controls and procedures (as defined in Exchange Act Rules 13a-15(e) and 15d-15(e)) and internal control over financial reporting (as defined in Exchange Act Rules 13a-15(f) and 15d-15(f)). Based on this evaluation, our principal executive officer and our principal financial officer concluded that our disclosure controls and procedures and internal control over financial reporting were effective as of the end of the period covered by this report.
Management’s Report on Internal Control Over Financial Reporting
Our management is responsible for establishing and maintaining adequate internal control over financial reporting as such term is defined in Exchange Act Rules 13a-15(f) and 15d-15(f). Because of its inherent limitations, internal control over financial reporting may not prevent or detect misstatements. Also, projections of any evaluation of effectiveness to future periods are subject to the risk that controls may become inadequate because of changes in conditions, or that the degree of compliance with the policies or procedures may deteriorate. Under the supervision and with the participation of our management, including our principal executive officer and principal financial officer, we conducted an evaluation of the effectiveness of our internal control over financial reporting based on the updated framework in Internal Control — Integrated Framework (2013) (2013 Framework) issued by the Committee of Sponsoring Organizations of the Treadway Commission on May 14, 2013. Based on our evaluation under the 2013 Framework, our management concluded that our internal control over financial reporting was effective as of December 31, 2016.
The effectiveness of the Company’s internal control over financial reporting as of December 31, 2016 has been audited by PricewaterhouseCoopers LLP, an independent registered public accounting firm, as stated in their report, which is included herein.
Changes in Internal Control Over Financial Reporting
During the last fiscal quarter of 2016, there were no changes in the Company’s internal control over financial reporting identified in connection with management’s evaluation of the effectiveness of the Company’s internal control over financial reporting that have materially affected, or are reasonably likely to materially affect, the Company’s internal control over financial reporting.
Item 9B. Other Information.
None.

74
PART III
Item 10. Directors, Executive Officers and Corporate Governance.
The information set forth under the captions “Board of Directors” and “Executive Officers” in our definitive Proxy Statement for our 2017 Annual Meeting of Stockholders is incorporated herein by reference.
Codes of Business Ethics and Conduct
We have adopted a Code of Business Ethics and Conduct (“Code of Conduct”) that applies to our Directors, officers and employees that is available on our website at www.wesco.com by selecting the “Investors” tab followed by the “Corporate Governance” heading. Any amendment or waiver of the Code of Conduct for our officers or Directors will be disclosed promptly at that location on our website.
We also have adopted a Senior Financial Executive Code of Principles for Senior Executives (“Senior Financial Executive Code”) that applies to our principal executive officer, principal financial officer, principal accounting officer or controller, or persons performing these functions. The Senior Financial Executive Code is also available at that same location on our website. We intend to timely disclose any amendment or waiver of the Senior Financial Executive Code on our website and will retain such information on our website as required by applicable SEC rules.
A copy of the Code of Conduct and/or Senior Financial Executive Code may also be obtained upon request by any stockholder, without charge, by writing to us at WESCO International, Inc., 225 West Station Square Drive, Suite 700, Pittsburgh, Pennsylvania 15219, Attention: Corporate Secretary.
The information required by Item 10 that relates to our Directors and executive officers is incorporated by reference from the information appearing under the captions “Corporate Governance,” “Board and Committee Meetings” and “Security Ownership” in our definitive Proxy Statement for our 2017 Annual Meeting of Stockholders that is to be filed with the SEC pursuant to the Exchange Act within 120 days of the end of our fiscal year on December 31, 2016.
Item 11. Executive Compensation.
The information set forth under the captions “Compensation Discussion and Analysis” and “Director Compensation” in our definitive Proxy Statement for our 2017 Annual Meeting of Stockholders is incorporated herein by reference.
Item 12. Security Ownership of Certain Beneficial Owners and Management and Related Stockholder Matters.
The information set forth under the caption “Security Ownership” in our definitive Proxy Statement for our 2017 Annual Meeting of Stockholders is incorporated herein by reference.
The following table provides information as of December 31, 2016 with respect to the shares of our common stock that may be issued under our existing equity compensation plans:
Plan Category
Number of securitiesto be issued
upon exercise ofoutstanding options,warrants and rights
Weighted-averageexercise price of
outstanding options,warrants and rights
Number of securitiesremaining availablefor future issuance
under equitycompensation plans
Equity compensation plans approved by security holders 2,845,903 $ 45.11 2,350,955Equity compensation plans not approved by security holders — — —Total 2,845,903 $ 45.11 2,350,955
Item 13. Certain Relationships and Related Transactions, and Director Independence.
The information set forth under the captions “Transactions with Related Persons” and “Corporate Governance” in our definitive Proxy Statement for our 2017 Annual Meeting of Stockholders is incorporated herein by reference.
Item 14. Principal Accountant Fees and Services.
The information set forth under the caption “Independent Registered Public Accounting Firm Fees and Services” in our definitive Proxy Statement for our 2017 Annual Meeting of Stockholders is incorporated herein by reference.

75
PART IV
Item 15. Exhibits and Financial Statement Schedule.
The financial statements, financial statement schedule and exhibits listed below are filed as part of this annual report:
(a) (1) Financial Statements
The list of financial statements required by this item is set forth in Item 8, “Financial Statements and Supplementary Data,” and is incorporated herein by reference.
(2) Financial Statement Schedule
Schedule II — Valuation and Qualifying Accounts
(b) Exhibits
Exhibit No. Description of Exhibit Prior Filing or Sequential Page Number
2.1 Recapitalization Agreement, dated as of March 27,1998, among Thor Acquisitions L.L.C., WESCOInternational, Inc. (formerly known as CDW HoldingCorporation) and certain security holders of WESCOInternational, Inc.
Incorporated by reference to Exhibit 2.1 to WESCO’sRegistration Statement on Form S-4 (No. 333-43225)
2.2 Share Purchase Agreement, dated as of October 15,2012, between WDCC Enterprises Inc., theShareholders party thereto, EECOL Holdings Ltd.,Jarich Holdings Ltd., EESA Corp., EESA HoldingsLtd. and EECOL Electric Corp.
Incorporated by reference to Exhibit 2.1 to WESCO'sCurrent Report on Form 8-K, dated October 17, 2012
3.1 Restated Certificate of Incorporation of WESCOInternational, Inc.
Incorporated by reference to Exhibit 3.1 to WESCO’sRegistration Statement on Form S-4 (No. 333-70404)
3.2 Certificate of Amendment of Certificate ofIncorporation to Restated Certificate of Incorporationof WESCO International, Inc.
Incorporated by reference to Exhibit 3.1 to WESCO’sCurrent Report on Form 8-K, dated May 29, 2014
3.3 Amended and Restated By-laws of WESCOInternational, Inc., effective as of May 29, 2014
Incorporated by reference to Exhibit 3.2 to WESCO’sCurrent Report on Form 8-K, dated May 29, 2014
4.1 Indenture, dated November 26, 2013, among WESCO Distribution, Inc. and U.S. Bank National Association, as trustee
Incorporated by reference to Exhibit 4.1 to WESCO’sCurrent Report on Form 8-K, dated November 27,2013
4.2 Form of 5.375% Restricted Note due 2021 Incorporated by reference to Exhibit A-1 to Exhibit 4.1to WESCO’s Current Report on Form 8-K, datedNovember 27, 2013
4.3 Form of 5.375% Unrestricted Note due 2021 Incorporated by reference to Exhibit A-2 to Exhibit 4.1to WESCO’s Current Report on Form 8-K, datedNovember 27, 2013
4.4 Indenture, dated June 15, 2016, among WESCO Distribution, Inc. and U.S. Bank National Association, as trustee
Incorporated by reference to Exhibit 4.1 to WESCO’s Current Report on Form 8-K, dated June 15, 2016
4.5 Form of 5.375% Restricted Note due 2024 Incorporated by reference to Exhibit A-1 to Exhibit 4.1 to WESCO’s Current Report on Form 8-K, dated June 15, 2016
4.6 Form of 5.375% Unrestricted Note due 2024 Incorporated by reference to Exhibit A-2 to Exhibit 4.1to WESCO’s Current Report on Form 8-K, dated June15, 2016
10.1 1999 Deferred Compensation Plan for Non-EmployeeDirectors, as amended and restated September 20, 2007
Incorporated by reference to Exhibit 10.5 to WESCO'sAnnual Report on Form 10-K for the year endedDecember 31, 2011

76
Exhibit No. Description of Exhibit Prior Filing or Sequential Page Number
10.2 Form of Stock Appreciation Rights Agreement forEmployees
Incorporated by reference to Exhibit 10.7 to WESCO'sAnnual Report on Form 10-K for the year endedDecember 31, 2011
10.3 Form of Restricted Stock Unit Agreement forEmployees
Incorporated by reference to Exhibit 10.8 to WESCO'sAnnual Report on Form 10-K for the year endedDecember 31, 2011
10.4 Form of Stock Appreciation Rights Agreement forNon-Employee Directors
Incorporated by reference to Exhibit 10.3 to WESCO’sQuarterly Report on Form 10-Q for the quarter endedJune 30, 2010
10.5 Form of Restricted Stock Unit Agreement for Non-Employee Directors
Incorporated by reference to Exhibit 10.4 to WESCO’sQuarterly Report on Form 10-Q for the quarter endedJune 30, 2010
10.6 Amended and Restated Registration and ParticipationAgreement, dated as of June 5, 1998, among WESCOInternational, Inc. and certain security holders ofWESCO International, Inc. named therein
Incorporated by reference to Exhibit 10.19 toWESCO’s Registration Statement on Form S-4(No. 333-43225)
10.7 Amended and Restated Employment Agreement, datedas of September 1, 2009, between WESCOInternational Inc. and John J. Engel
Incorporated by reference to Exhibit 10.2 to WESCO’sQuarterly Report on Form 10-Q for the quarter endedSeptember 30, 2009
10.8 Term Sheet, dated January 15, 2010, memorializingterms of employment of Diane Lazzaris by WESCOInternational, Inc.
Incorporated by reference to Exhibit 10.28 toWESCO’s Annual Report on Form 10-K for the yearended December 31, 2009
10.9 Term Sheet, dated June 18, 2010, memorializing termsof employment of Kimberly Windrow by WESCOInternational, Inc.
Incorporated by reference to Exhibit 10.1 to WESCO’sQuarterly Report on Form 10-Q for the quarter endedSeptember 30, 2010
10.10 Notice of Performance Share Award under theWESCO International, Inc. 1999 Long-Term IncentivePlan
Incorporated by reference to Exhibit 10.1 to WESCO’sQuarterly Report on Form 10-Q for the quarter endedMarch 31, 2012
10.11 Term Loan agreement, dated as of December 12, 2012among WESCO Distribution, Inc., WDCC EnterprisesInc., WESCO International, Inc., Credit Suisse AG,Cayman Islands Branch, as Administrative Agent andCollateral Agent and the other Lenders and Agentsparty thereto
Incorporated by reference to Exhibit 10.1 to WESCO'sCurrent Report on Form 8-K, dated December 17,2012
10.12 1999 Long-Term Incentive Plan, as restated effective as of May 30, 2013
Incorporated by reference to Appendix A to the Proxy Statement filed on Schedule 14A on April 16, 2013
10.13 First Amendment to Term Loan Agreement, dated as of November 19, 2013 among WESCO Distribution, Inc., WDCC Enterprises Inc., WESCO International, Inc., Credit Suisse AG, Cayman Islands Branch, as Administrative Agent and Collateral Agent and the other Lenders and Agents party thereto
Incorporated by reference to Exhibit 10.31 toWESCO's Annual Report on Form 10-K for the yearended December 31, 2013
10.14 Form of Non-Employee Director Restricted Stock Unit Agreement
Incorporated by reference to Exhibit 10.32 to WESCO's Annual Report on Form 10-K for the year ended December 31, 2013
10.15 Form of Stock Appreciation Rights Agreement for Employees
Incorporated by reference to Exhibit 10.33 toWESCO's Annual Report on Form 10-K for the yearended December 31, 2014

77
Exhibit No. Description of Exhibit Prior Filing or Sequential Page Number
10.16 Form of Restricted Stock Unit Agreement For Employees
Incorporated by reference to Exhibit 10.34 toWESCO's Annual Report on Form 10-K for the yearended December 31, 2014
10.17 Notice of Performance Share Award Under the WESCO International, Inc. 1999 Long-Term Incentive Plan, as amended May 30, 2013
Incorporated by reference to Exhibit 10.35 to WESCO's Annual Report on Form 10-K for the year ended December 31, 2014
10.18 Second Amended and Restated Credit Agreement,dated as of September 24, 2015 among WESCODistribution, Inc., the other U.S. Borrowers partythereto, WESCO Distribution Canada LP, the otherCanadian Borrowers party thereto, WESCOInternational, Inc., the Lenders party thereto,JPMorgan Chase Bank, N.A., as Administrative Agent,and JPMorgan Chase Bank, N.A., Toronto Branch, asCanadian Administrative Agent
Incorporated by reference to Exhibit 10.1 to WESCO’sCurrent Report on Form 8-K, dated September 24,2015
10.19 Fourth Amended and Restated Receivables PurchaseAgreement, dated as of September 24, 2015, by andamong WESCO Receivables Corp., WESCODistribution, Inc., the various Purchaser Groups fromtime to time party thereto and PNC Bank, NationalAssociation, as Administrator
Incorporated by reference to Exhibit 10.2 to WESCO’sCurrent Report on Form 8-K, dated September 24,2015
10.20 Release Agreement, dated as of October 5, 2015,between WESCO International, Inc., and WESCODistribution, Inc., and Stephen A. Van Oss
Incorporated by reference to Exhibit 10.1 to WESCO’sQuarterly Report on Form 10-Q, for the quarter endedSeptember 30, 2015
10.21 Form of Non-Employee Director Restricted Stock UnitAgreement
Incorporated by reference to Exhibit 10.1 to WESCO’s Quarterly Report on Form 10-Q, for the quarter ended March 31, 2016
10.22 Form of Notice of Performance Share Award Underthe WESCO International, Inc. 1999 Long-TermIncentive Plan, as amended May 30, 2013
Incorporated by reference to Exhibit 10.23 to WESCO's Annual Report on Form 10-K for the year ended December 31, 2015
10.23 Form of Director and Officer IndemnificationAgreement, entered among WESCO International, Inc.and certain of its executive officers and directors listedon a schedule attached thereto
Incorporated by reference to Exhibit 10.24 to WESCO's Annual Report on Form 10-K for the year ended December 31, 2015
10.24 First Amendment to Fourth Amended and Restated Receivables Purchase Agreement, dated as of December 18, 2015
Incorporated by reference to Exhibit 10.1 to WESCO’sQuarterly Report on Form 10-Q, for the quarter endedJune 30, 2016
10.25 Second Amendment to Fourth Amended and Restated Receivables Purchase Agreement, dated as of April 19, 2016
Incorporated by reference to Exhibit 10.2 to WESCO’sQuarterly Report on Form 10-Q, for the quarter endedJune 30, 2016
10.26 Third Amendment to Fourth Amended and Restated Receivables Purchase Agreement, dated as of May 10, 2016
Incorporated by reference to Exhibit 10.3 to WESCO’sQuarterly Report on Form 10-Q, for the quarter endedJune 30, 2016
10.27 Fourth Amendment to Fourth Amended and Restated Receivables Purchase Agreement, dated as of May 27, 2016
Incorporated by reference to Exhibit 10.4 to WESCO’s Quarterly Report on Form 10-Q, for the quarter ended June 30, 2016
10.28 Term Sheet, dated October 6, 2016 memorializing terms of employment of David S. Schulz by WESCO International, Inc
Filed herewith
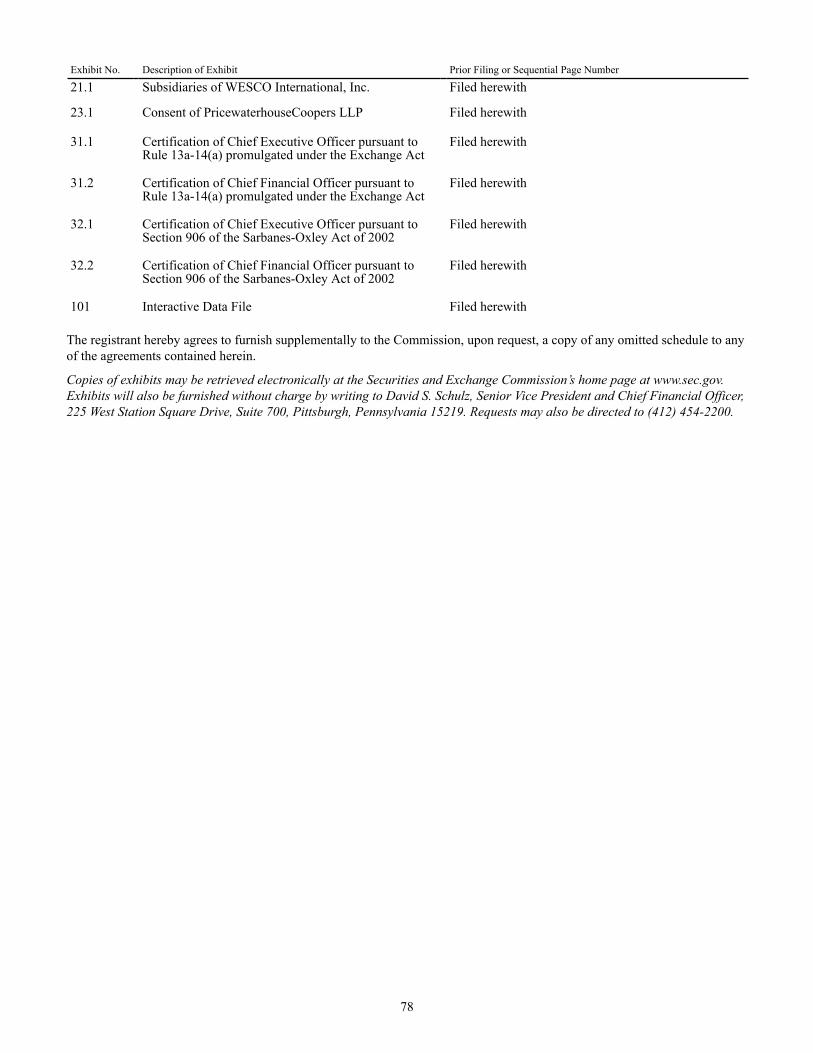
78
Exhibit No. Description of Exhibit Prior Filing or Sequential Page Number
21.1 Subsidiaries of WESCO International, Inc. Filed herewith
23.1 Consent of PricewaterhouseCoopers LLP Filed herewith
31.1 Certification of Chief Executive Officer pursuant toRule 13a-14(a) promulgated under the Exchange Act
Filed herewith
31.2 Certification of Chief Financial Officer pursuant toRule 13a-14(a) promulgated under the Exchange Act
Filed herewith
32.1 Certification of Chief Executive Officer pursuant toSection 906 of the Sarbanes-Oxley Act of 2002
Filed herewith
32.2 Certification of Chief Financial Officer pursuant toSection 906 of the Sarbanes-Oxley Act of 2002
Filed herewith
101 Interactive Data File Filed herewith
The registrant hereby agrees to furnish supplementally to the Commission, upon request, a copy of any omitted schedule to any of the agreements contained herein.
Copies of exhibits may be retrieved electronically at the Securities and Exchange Commission’s home page at www.sec.gov. Exhibits will also be furnished without charge by writing to David S. Schulz, Senior Vice President and Chief Financial Officer, 225 West Station Square Drive, Suite 700, Pittsburgh, Pennsylvania 15219. Requests may also be directed to (412) 454-2200.

79
Item 16. Form 10-K Summary.
Not applicable.

80
Schedule II—Valuation and Qualifying Accounts
Balance atBeginning Charged to
Charged toOther Balance at
of Period Expense Accounts(1) Deductions(2) End of Period
Allowance for doubtful accounts (In thousands)
Year ended December 31, 2016 $ 22,587 5,888 21 (6,489) $ 22,007Year ended December 31, 2015 21,084 6,099 1,305 (5,901) 22,587Year ended December 31, 2014 19,309 5,937 194 (4,356) 21,084
_________________________(1) Represents allowance for doubtful accounts in connection with certain acquisitions and divestitures.(2) Includes a reduction in the allowance for doubtful accounts due to write-off of accounts receivable.

81
SIGNATURES
Pursuant to the requirements of Section 13 or 15(d) of the Securities Exchange Act of 1934, the Registrant has duly caused this report to be signed on its behalf by the undersigned, thereunto duly authorized.
WESCO INTERNATIONAL, INC. By: /s/ JOHN J. ENGEL
Name: John J. Engel Title: Chairman, President and Chief Executive Officer Date: February 22, 2017
WESCO INTERNATIONAL, INC. By: /s/ DAVID S. SCHULZ
Name: David S. SchulzTitle: Senior Vice President and Chief Financial Officer Date: February 22, 2017

82
Pursuant to the requirements of the Securities Exchange Act of 1934, this report has been signed below by the following persons on behalf of the registrant and in the capacities and on the dates indicated.
Signature Title Date
/s/ JOHN J. ENGEL Chairman, President and Chief Executive Officer February 22, 2017John J. Engel (Principal Executive Officer)
/s/ DAVID S. SCHULZ Senior Vice President and Chief Financial Officer February 22, 2017David S. Schulz (Principal Financial and Accounting Officer)
/s/ SANDRA BEACH LIN Director February 22, 2017
Sandra Beach Lin
/s/ MATTHEW J. ESPE Director February 22, 2017
Matthew J. Espe
/s/ BOBBY J. GRIFFIN Director February 22, 2017
Bobby J. Griffin
/s/ JOHN K. MORGAN Director February 22, 2017
John K. Morgan
/s/ JAMES J. O’BRIEN Director February 22, 2017
James J. O’Brien
/s/ STEVEN A. RAYMUND Director February 22, 2017
Steven A. Raymund
/s/ JAMES L. SINGLETON Director February 22, 2017
James L. Singleton
/s/ LYNN M. UTTER Director February 22, 2017
Lynn M. Utter

83
Exhibit 21.1
SUBSIDIARIES OF WESCO INTERNATIONAL, INC.
1502218 Alberta Ltd., an Alberta corporation
Atlanta Electrical Distributors, LLC, a Delaware limited liability company
Calvert Wire & Cable Corporation, a Delaware corporation
Carlton-Bates Company, an Arkansas corporation
Carlton-Bates Company de Mexico S.A. de C.V., a Mexico variable capital company
Carlton-Bates Company of Texas GP, Inc., a Texas corporation
CBC LP Holdings, LLC, a Delaware limited liability company
CDW Holdco, LLC, a Delaware limited liability company
Communications Supply Corporation, a Connecticut corporation
Conney Investment Holdings, LLC, a Delaware limited liability company
Conney Safety Products, LLC, a Delaware limited liability company
Distribuidora Materiales Electricos E-Supply Limitada, a Chile limited liability company
EECOL Electric Bolivia Ltda., a Bolivia limited liability company
EECOL Electric Peru S.A.C., a Peru sociedad anonima cerrada
EECOL Electric ULC, an Alberta unlimited liability company
EECOL Industrial Electric Ecuador Limitada, an Ecuador limited liability company
EECOL Industrial Electric (SudAmerica) Limitada, a Chile limited liability company
EECOL Industrial Electric Limitada, a Chile limited liability company
EECOL Power S.A., a Chile closed stock corporation
EECOL Properties Corp., an Alberta corporation
Hazmasters, Inc., an Ontario corporation
Hi-Line Utility Supply Company, LLC, an Illinois limited liability company
Hill Country Electric Supply, L.P., a Texas limited partnership

84
Liberty Wire & Cable, Inc., a Delaware corporation
Needham Electric Supply, LLC, a Delaware limited liability company
Obras Y Servicios Sunpark S.A.C. (OS Sunpark), a Peru sociedad anonima cerrada
SASK Alta Holdings S.A., a Chile closely held stock corporation
Services Voice, Video and Data Distribution de Mexico, S. de R.L. de C.V., a Mexico limited liability company
Stone Eagle Electrical Supply GP Inc., an Alberta corporation
Stone Eagle Electrical Supply Limited Partnership, an Alberta limited partnership
TVC Canada Corp., a Nova Scotia unlimited liability company
TVC Communications, L.L.C., a Delaware limited liability company
TVC Espana Distribucion y Venta De Equipos, S.L., a Spain limited liability company
TVC International Holding, L.L.C., a Delaware limited liability company
TVC UK Holdings Limited, a United Kingdom limited company
Voice, Video and Data Distribution de Mexico, S. de R.L. de C.V., a Mexico limited liability company
WDC Holding Inc., a Delaware corporation
WDCC Enterprises Inc., an Alberta corporation
WDCH, LP, a Pennsylvania limited partnership
WDCH US LP, a Delaware limited partnership
WDI-Angola, LDA, an Angola company
WDINESCO B.V., a Netherlands private company with limited liability
WDINESCO C.V., a Netherlands limited partnership
WDINESCO II B.V., a Netherlands private company with limited liability
WDINESCO III B.V., a Netherlands private company with limited liability
WDINESCO II C.V., a Netherlands limited partnership
WDINESCO III C.V., a Netherlands limited partnership
WEAS Company, S. de R.L., a Mexico private limited company
WECOL Holdings ULC, an Alberta unlimited liability company

85
WESCO (Suzhou) Trading Co., Ltd., a China limited liability company
WESCO Australia Pty Ltd, an Australian company
WESCO Canada I, LP, an Alberta limited partnership
WESCO Canada II, LP, an Alberta limited partnership
WESCO Distribution Canada Co., a Nova Scotia unlimited liability company
WESCO Distribution Canada GP Inc., an Ontario Corporation
WESCO Distribution Canada LP, an Ontario limited partnership
WESCO Distribution de Mexico, S. de R.L., a Mexico private limited company
WESCO Distribution HK Limited, a Hong Kong limited private company
WESCO Distribution II ULC, a Nova Scotia unlimited liability company
WESCO Distribution III ULC, a Nova Scotia unlimited liability company
WESCO Distribution-International Limited, a United Kingdom limited company
WESCO Distribution, Inc., a Delaware Corporation
WESCO Distribution NL B.V., a Netherlands private company with limited liability
WESCO Distribution Pte. Ltd., a Singapore limited private company
WESCO Enterprises, Inc., a Delaware corporation
WESCO Equity Corporation, a Delaware corporation
WESCO Finance Corporation, a Delaware corporation
WESCO Holdings, LLC, a Delaware limited liability company
WESCO Integrated Supply, Inc., a Delaware corporation
WESCO Integrated Supply Polska Spolka z o.o., a Poland limited company
WESCO Nevada, Ltd., a Nevada corporation
WESCO Netherlands B.V., a Netherlands private company with limited liability
WESCO Nigeria, Inc., a Delaware corporation
WESCO Procurement Canada ULC, an Alberta unlimited liability company
WESCO Real Estate I, LLC, a Delaware limited liability company

86
WESCO Real Estate II, LLC, a Delaware limited liability company
WESCO Real Estate III, LLC, a Delaware limited liability company
WESCO Real Estate IV, LLC, a Delaware limited liability company
WESCO Receivables Corp., a Delaware corporation
WESCO TLD Holdings Co., Ltd., a Thailand limited private company
WND Nigeria Limited, a Nigeria corporation

87
Exhibit 23.1
CONSENT OF INDEPENDENT REGISTERED PUBLIC ACCOUNTING FIRM
We hereby consent to the incorporation by reference in the Registration Statements on Form S-8 (No's. 333-188979, 333-188978, 333-81845, 333-172531, 333-91187, 333-81841, 333-81847 and 333-81857) of WESCO International, Inc. of our report dated February 22, 2017 relating to the financial statements, financial statement schedule and the effectiveness of internal control over financial reporting, which appears in this Form 10-K.
/s/ PricewaterhouseCoopers LLPPittsburgh, PennsylvaniaFebruary 22, 2017

88
Exhibit 31.1 CERTIFICATION
I, John J. Engel, certify that:
1. I have reviewed this Annual Report on Form 10-K for the fiscal year ended December 31, 2016, of WESCO International, Inc.;
2. Based on my knowledge, this report does not contain any untrue statement of a material fact or omit to state a material fact necessary to make the statements made, in light of the circumstances under which such statements were made, not misleading with respect to the period covered by this report;
3. Based on my knowledge, the financial statements, and other financial information included in this report, fairly present in all material respects the financial condition, results of operations and cash flows of the registrant as of, and for, the periods presented in this report;
4. The registrant's other certifying officer(s) and I are responsible for establishing and maintaining disclosure controls and procedures (as defined in Exchange Act Rules 13a-15(e) and 15d-15(e)) and internal control over financial reporting (as defined in Exchange Act Rules 13a-15(f) and 15d-15(f)) for the registrant and have:
(a) Designed such disclosure controls and procedures, or caused such disclosure controls and procedures to be designed under our supervision, to ensure that material information relating to the registrant, including its consolidated subsidiaries, is made known to us by others within those entities, particularly during the period in which this report is being prepared;
(b) Designed such internal control over financial reporting, or caused such internal control over financial reporting to be designed under our supervision, to provide reasonable assurance regarding the reliability of financial reporting and the preparation of financial statements for external purposes in accordance with generally accepted accounting principles;
(c) Evaluated the effectiveness of the registrant's disclosure controls and procedures and presented in this report our conclusions about the effectiveness of the disclosure controls and procedures, as of the end of the period covered by this report based on such evaluation; and
(d) Disclosed in this report any change in the registrant's internal control over financial reporting that occurred during the registrant's most recent fiscal quarter (the registrant's fourth fiscal quarter in the case of an annual report) that has materially affected, or is reasonably likely to materially affect, the registrant's internal control over financial reporting; and
5. The registrant's other certifying officer(s) and I have disclosed, based on our most recent evaluation of internal control over financial reporting, to the registrant's auditors and the audit committee of the registrant's board of directors (or persons performing the equivalent functions):
(a) All significant deficiencies and material weaknesses in the design or operation of internal control over financial reporting which are reasonably likely to adversely affect the registrant's ability to record, process, summarize and report financial information; and
(b) Any fraud, whether or not material, that involves management or other employees who have a significant role in the registrant's internal control over financial reporting.
Date: February 22, 2017 By: /s/ John J. Engel John J. Engel Chairman, President and Chief Executive Officer

89
Exhibit 31.2 CERTIFICATION
I, David S. Schulz, certify that:
1. I have reviewed this Annual Report on Form 10-K for the fiscal year ended December 31, 2016, of WESCO International, Inc.;
2. Based on my knowledge, this report does not contain any untrue statement of a material fact or omit to state a material fact necessary to make the statements made, in light of the circumstances under which such statements were made, not misleading with respect to the period covered by this report;
3. Based on my knowledge, the financial statements, and other financial information included in this report, fairly present in all material respects the financial condition, results of operations and cash flows of the registrant as of, and for, the periods presented in this report;
4. The registrant's other certifying officer(s) and I are responsible for establishing and maintaining disclosure controls and procedures (as defined in Exchange Act Rules 13a-15(e) and 15d-15(e)) and internal control over financial reporting (as defined in Exchange Act Rules 13a-15(f) and 15d-15(f)) for the registrant and have:
(a) Designed such disclosure controls and procedures, or caused such disclosure controls and procedures to be designed under our supervision, to ensure that material information relating to the registrant, including its consolidated subsidiaries, is made known to us by others within those entities, particularly during the period in which this report is being prepared;
(b) Designed such internal control over financial reporting, or caused such internal control over financial reporting to be designed under our supervision, to provide reasonable assurance regarding the reliability of financial reporting and the preparation of financial statements for external purposes in accordance with generally accepted accounting principles;
(c) Evaluated the effectiveness of the registrant's disclosure controls and procedures and presented in this report our conclusions about the effectiveness of the disclosure controls and procedures, as of the end of the period covered by this report based on such evaluation; and
(d) Disclosed in this report any change in the registrant's internal control over financial reporting that occurred during the registrant's most recent fiscal quarter (the registrant's fourth fiscal quarter in the case of an annual report) that has materially affected, or is reasonably likely to materially affect, the registrant's internal control over financial reporting; and
5. The registrant's other certifying officer(s) and I have disclosed, based on our most recent evaluation of internal control over financial reporting, to the registrant's auditors and the audit committee of the registrant's board of directors (or persons performing the equivalent functions):
(a) All significant deficiencies and material weaknesses in the design or operation of internal control over financial reporting which are reasonably likely to adversely affect the registrant's ability to record, process, summarize and report financial information; and
(b) Any fraud, whether or not material, that involves management or other employees who have a significant role in the registrant's internal control over financial reporting.
Date: February 22, 2017 By: /s/ David S. Schulz David S. Schulz
Senior Vice President and Chief Financial Officer

90
Exhibit 32.1
CERTIFICATION PURSUANT TO18 U.S.C. SECTION 1350
AS ADOPTED PURSUANT TOSECTION 906 OF THE SARBANES-OXLEY ACT OF 2002
In connection with the Annual Report of WESCO International, Inc. (the “Company”) on Form 10-K for the fiscal year ended December 31, 2016, as filed with the Securities and Exchange Commission on the date hereof (the “Report”), the undersigned, in the capacity and on the date indicated below, hereby certifies pursuant to 18 U.S.C. Section 1350, as adopted pursuant to Section 906 of the Sarbanes-Oxley Act of 2002, that to his knowledge:
1. The Report fully complies with the requirements of Section 13(a) or 15(d) of the Securities Exchange Act of 1934; and
2. The information contained in the Report fairly presents, in all material respects, the financial condition and results of operation of the Company.
Date: February 22, 2017 By: /s/ John J. Engel John J. Engel Chairman, President and Chief Executive Officer
91
Exhibit 32.2
CERTIFICATION PURSUANT TO18 U.S.C. SECTION 1350
AS ADOPTED PURSUANT TOSECTION 906 OF THE SARBANES-OXLEY ACT OF 2002
In connection with the Annual Report of WESCO International, Inc. (the “Company”) on Form 10-K for the fiscal year ended December 31, 2016, as filed with the Securities and Exchange Commission on the date hereof (the “Report”), the undersigned, in the capacity and on the date indicated below, hereby certifies pursuant to 18 U.S.C. Section 1350, as adopted pursuant to Section 906 of the Sarbanes-Oxley Act of 2002, that to his knowledge:
1. The Report fully complies with the requirements of Section 13(a) or 15(d) of the Securities Exchange Act of 1934; and
2. The information contained in the Report fairly presents, in all material respects, the financial condition and results of operation of the Company.
Date: February 22, 2017 By: /s/ David S. Schulz David S. Schulz
Senior Vice President and Chief Financial Officer

Non-GAAP Reconciliations 2012 2013 2014 2015 2016
(Dollars in millions, except for diluted EPS)
Adjusted EBITDA:Income from operations (EBIT) 333 481 466 374 332ArcelorMittal litigation charge (recovery) 36 (36) — — —Adjusted income from operations (Adjusted EBIT) 369 445 466 374 332Depreciation and amortization 38 68 68 65 67Adjusted EBITDA 407 513 534 439 399
Adjusted net income attributable to WESCO International, Inc.:Net income attributable to WESCO International, Inc. 202 276 276 211 102ArcelorMittal litigation charge (recovery), net of tax 22 (22) — — —Loss on debt redemption, net of tax — — — — 82Adjusted net income attributable to WESCO International, Inc. 224 254 276 211 184
Adjusted Diluted EPS:Diluted share count 51.1 52.7 53.3 50.4 48.3Adjusted Diluted EPS (1) 4.38 4.82 5.18 4.18 3.80
Adjusted stockholders’ equity:Stockholders’ equity 1,554 1,765 1,928 1,774 2,010Add: ArcelorMittal litigation charge, net of tax 22 — — — —Add: Loss on debt redemption, net of tax — — — — 82Adjusted stockholders’ equity 1,576 1,765 1,928 1,774 2,092
(1) 2016 excludes the third quarter loss per diluted share on debt redemption of $1.70, net of tax, based on 48.7 million diluted shares.
92 WESCO International, Inc.

Non-GAAP Reconciliations 2012 2013 2014 2015 2016
(Dollars in millions, except percentages)
Free Cash Flow:Cash provided by operations 288 315 251 283 300Less: capital expenditures (23) (28) (21) (22) (18)Add: non-recurring pension contribution — 21 — — —Free cash flow 265 308 230 261 282
Adjusted net income attributable to WESCO International, Inc. 224 254 276 211 184
Free cash flow as a % of adjusted net income 118% 121% 84% 125% 154%
ROIC:Adjusted income from operations 369 445 466 374 332Tax effect (year-end effective tax rate) 105 121 132 117 77Tax effected adjusted income from operations 264 324 334 256 255
Par debtDecember 31 of the prior year 825 1,919 1,662 1,586 1,665March 31 of the current year 794 1,857 1,676 1,557 1,621June 30 of the current year 759 1,797 1,741 1,653 1,589September 30 of the current year 896 1,758 1,689 1,667 1,474December 31 of the current year 1,919 1,662 1,586 1,665 1,403Average par debt 1,039 1,799 1,671 1,626 1,550
Stockholders’ equityDecember 31 of the prior year (adjusted)1 1,346 1,576 1,765 1,928 1,774Less: debt discount 176 184 175 170 164Stockholders’ equity, net of debt discount 1,170 1,392 1,590 1,758 1,610
March 31 of the current year (adjusted)1 1,411 1,614 1,774 1,837 1,893Less: debt discount 175 183 174 169 163Stockholders’ equity, net of debt discount 1,236 1,431 1,600 1,669 1,730
June 30 of the current year (adjusted)1 1,469 1,639 1,890 1,866 1,943Less: debt discount 175 181 173 167 162Stockholders’ equity, net of debt discount 1,294 1,458 1,717 1,699 1,781
September 30 of the current year (adjusted) 1 1,545 1,739 1,909 1,760 1,993Less: debt discount 175 180 172 166 —Stockholders’ equity, net of debt discount 1,370 1,559 1,737 1,594 1,993
December 31 of the current year (adjusted) 1 1,576 1,765 1,928 1,774 2,092Less: debt discount 184 175 170 164 —Stockholders’ equity, net of debt discount 1,392 1,590 1,758 1,610 2,092
Average stockholders’ equity, net of debt discount 1,292 1,486 1,680 1,666 1,841
Average par debt and stockholders’ equity 2,331 3,285 3,351 3,292 3,391ROIC 11.3% 9.9% 10.0% 7.8% 7.5%
1 Adjusted for ArcelorMittal litigation impact in 2012 and 2013 and loss on debt redemption in 2016.
2016 Annual Report | A World of Solutions 93
Corporate Information
94 WESCO International, Inc.
Corporate HeadquartersWESCO International, Inc. Suite 700 225 West Station Square Drive Pittsburgh, PA 15219-1122 Phone: 412-454-2200 www.wesco.com
Investor RelationsFor questions regarding WESCO, contact Mary Ann Bell, Vice President, Investor Relations at [email protected]. A copy of the Company’s Annual Report on Form 10-K or other financial information may be requested through our website (www.wesco.com) or by contacting Investor Relations.
Common StockWESCO International, Inc. is listed on the New York Stock Exchange under the ticker symbol WCC.
Annual MeetingThe Annual Meeting of Stockholders will be held on May 31, 2017, at 5:00 p.m., E.D.T., at:
Hyatt Regency Pittsburgh International Airport 1111 Airport Boulevard Pittsburgh, PA 15231
Transfer Agent and RegistrarComputershare P.O. Box 30170 College Station, TX 77842-3170 Toll free: 877-264-3927 TDD for Hearing Impaired: 800-231-5469 Foreign Shareholders: 201-680-6578 TDD Foreign Shareholders: 201-680-6610
Website address: www.computershare.com/investor
Independent Registered Public Accounting FirmPricewaterhouseCoopers LLP Pittsburgh, PA
Certifications to the NYSE and the SECOn June 6, 2016, the Company submitted its CEO Certification to the NYSE under NYSE Rule 303A.12(a). Also, any CEO/CFO certifications required to be filed with the SEC, including the Section 302 certifications, are filed by the Company as exhibits to its Annual Report on Form 10-K.
An online version of the Annual Report is available at www.wesco.com

BOARD OF DIRECTORS(left to right)
Steven A. RaymundChairmanTech Data Corporation
Sandra Beach LinFormer Chief Executive OfficerCalisolar, Inc.
James L. Singleton Chairman and Chief Executive Officer Cürex Group Holdings, LLC
John J. EngelChairman, President, and Chief Executive OfficerWESCO International, Inc.
Bobby J. GriffinFormer President, International Operations of Ryder System, Inc.
Lynn M. UtterChief Executive OfficerFirst Source, LLC
John K. MorganFormer Chairman, President, and Chief Executive OfficerZep, Inc.
Matthew J. EspeChief Executive Officer Radial, Inc.
Term expires May 2017Sandra Beach LinJohn J. Engel Matthew J. EspeBobby J. GriffinJohn K. MorganSteven A. RaymundJames L. SingletonLynn M. Utter
EXECUTIVE OFFICERS(as of April 1, 2017)
John J. EngelChairman, President, and Chief Executive Officer
Diane E. LazzarisSenior Vice President and General Counsel
David S. SchulzSenior Vice President and Chief Financial Officer
Kimberly G. WindrowSenior Vice President and Chief Human Resources Officer
Corporate Governance

© Copyright by WESCO 2016– 2017. All rights reserved.
WESCO International, Inc. Suite 700 225 West Station Square Drive Pittsburgh, Pennsylvania 15219-1122 Phone: 412-454-2200 www.wesco.com
The printer and paper utilized for this report have been certified by the Forest Stewardship Council® (FSC®), which promotes environmentally appropriate, socially beneficial and economically viable management of the world’s forests. This report is printed on paper made from mixed sources of post-industrial recycled and virgin fiber.


