Half year results presentation - Bupa/media/files/site-specific-files/our... · 2017 half year...
33
Half year results presentation 6 months ended 30 June 2017
-
Upload
truongcong -
Category
Documents
-
view
219 -
download
2
Transcript of Half year results presentation - Bupa/media/files/site-specific-files/our... · 2017 half year...

Half year results presentation 6 months ended 30 June 2017

Overview Financial review Outlook & operating priorities Market unit performance
Agenda
2017 half year results presentation
2
Market unit performance
Joy Linton, CFO
Section 2
Financial review
Martin Potkins, Corporate Controller
Gareth Evans, Group Treasurer
Section 3
Evelyn Bourke, Group CEO
1. Overview
2. Market Unit performance
3. Financial review
4. Outlook and operating priorities
5. Questions and Answers

Overview Financial review Outlook & operating priorities Market unit performance
Section 1
Overview
Evelyn Bourke, Group CEO
3

Overview Financial review Outlook & operating priorities Market unit performance
Embedding Bupa’s strategic framework
4
HY 2017 Group highlights
• Using Net Promoter System to improve customer experience
• Focusing on digital transformation and continuous improvement
• Investing in strength and depth in key markets, and in risk management and compliance

Overview Financial review Outlook & operating priorities Market unit performance
Investing in strength and depth for future growth
5
HY 2017 Group highlights
Bupa Arabia stake increased from 26.25% to 34.25%
Operating highlights:
Australian health insurance business remains No.1 provider in highly competitive market Affordability pressures for customers
Intense competition
Challenging and volatile political and economic environments
Operating environment characterised by:
In the UK, completed Oasis Dental Care acquisition; integration on track
Bupa Thailand assets held for sale, with
divestment announced on 25 July 2017.
Growth in revenue, underlying profit and cashflow in H1
New CPO; Appointment of CEO International
Markets announced.

Overview Financial review Outlook & operating priorities Market unit performance
HY 2017 Group highlights
6
(1) The Solvency II capital coverage ratio is an estimated value.
Revenue
£6.1bn +4% CER
Underlying profit before tax
£330.9m +11% CER
Statutory profit before tax
£231.3m +66% AER
Net cash flow from operations
£554.4m +8% AER
Solvency coverage ratio (1)
160% -44% pts

Overview Financial review Outlook & operating priorities Market unit performance
Section 2
Market Unit
performance
Joy Linton, Chief Financial Officer
7
Overview Financial review Outlook & operating priorities Market unit performance
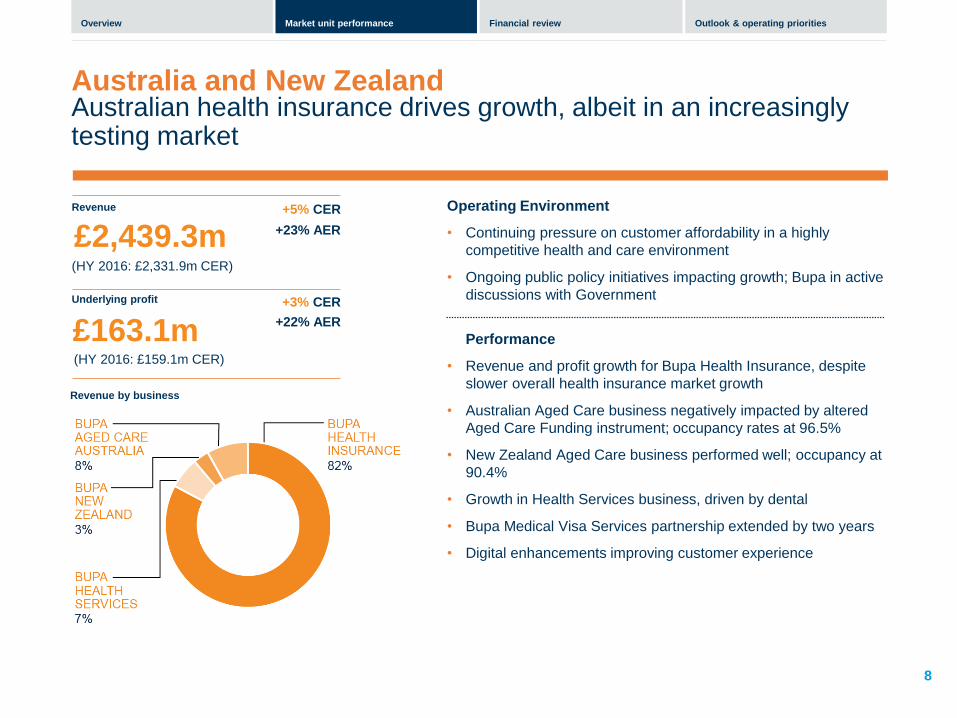
Australian health insurance drives growth, albeit in an increasingly testing market
8
Australia and New Zealand
Revenue
Underlying profit
Revenue by business
(HY 2016: £2,331.9m CER)
£2,439.3m +5% CER
+23% AER
(HY 2016: £159.1m CER)
£163.1m +3% CER
+22% AER
Operating Environment
• Continuing pressure on customer affordability in a highly
competitive health and care environment
• Ongoing public policy initiatives impacting growth; Bupa in active
discussions with Government
Performance
• Revenue and profit growth for Bupa Health Insurance, despite
slower overall health insurance market growth
• Australian Aged Care business negatively impacted by altered
Aged Care Funding instrument; occupancy rates at 96.5%
• New Zealand Aged Care business performed well; occupancy at
90.4%
• Growth in Health Services business, driven by dental
• Bupa Medical Visa Services partnership extended by two years
• Digital enhancements improving customer experience
Overview Financial review Outlook & operating priorities Market unit performance
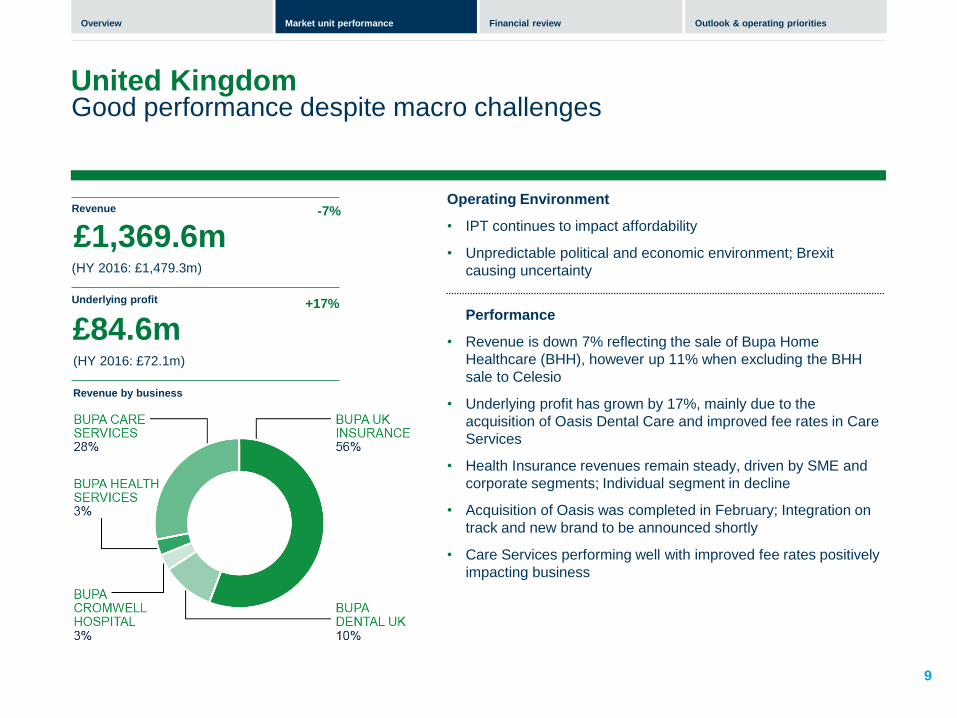
Good performance despite macro challenges
9
United Kingdom
Revenue
Underlying profit
Revenue by business
(HY 2016: £1,479.3m)
£1,369.6m -7%
(HY 2016: £72.1m)
£84.6m +17%
Operating Environment
• IPT continues to impact affordability
• Unpredictable political and economic environment; Brexit
causing uncertainty
Performance
• Revenue is down 7% reflecting the sale of Bupa Home
Healthcare (BHH), however up 11% when excluding the BHH
sale to Celesio
• Underlying profit has grown by 17%, mainly due to the
acquisition of Oasis Dental Care and improved fee rates in Care
Services
• Health Insurance revenues remain steady, driven by SME and
corporate segments; Individual segment in decline
• Acquisition of Oasis was completed in February; Integration on
track and new brand to be announced shortly
• Care Services performing well with improved fee rates positively
impacting business
Overview Financial review Outlook & operating priorities Market unit performance
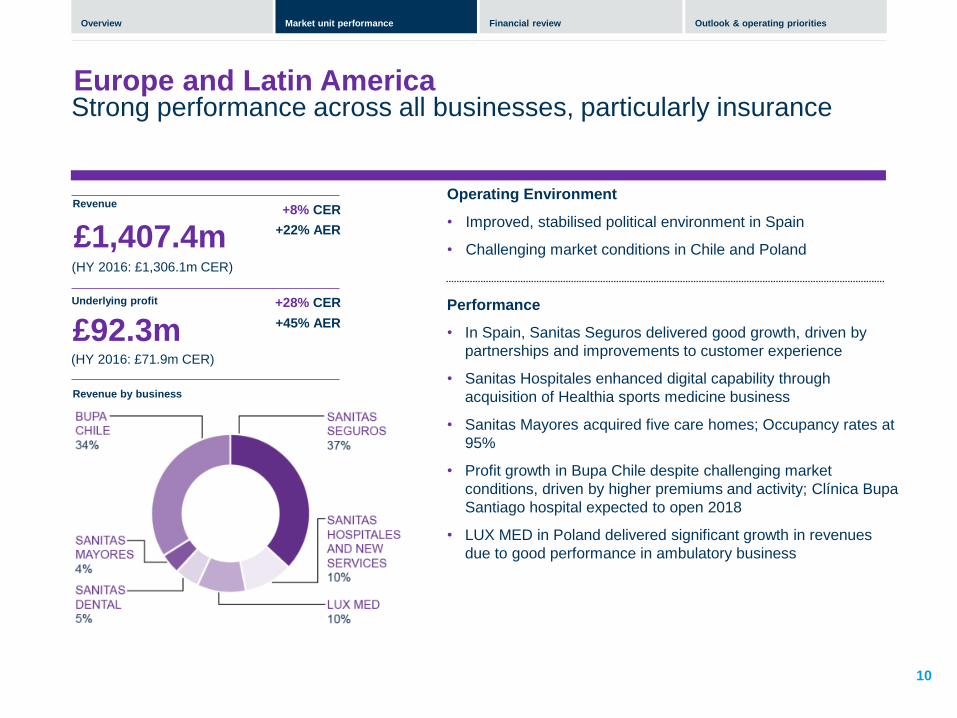
Strong performance across all businesses, particularly insurance
10
Europe and Latin America
Revenue
Underlying profit
Revenue by business
(HY 2016: £1,306.1m CER)
£1,407.4m +8% CER
+22% AER
(HY 2016: £71.9m CER)
£92.3m +28% CER
+45% AER
Operating Environment
• Improved, stabilised political environment in Spain
• Challenging market conditions in Chile and Poland
Performance
• In Spain, Sanitas Seguros delivered good growth, driven by
partnerships and improvements to customer experience
• Sanitas Hospitales enhanced digital capability through
acquisition of Healthia sports medicine business
• Sanitas Mayores acquired five care homes; Occupancy rates at
95%
• Profit growth in Bupa Chile despite challenging market
conditions, driven by higher premiums and activity; Clínica Bupa
Santiago hospital expected to open 2018
• LUX MED in Poland delivered significant growth in revenues
due to good performance in ambulatory business

Overview Financial review Outlook & operating priorities Market unit performance
Growth in revenues but Bupa Global challenges continue to impact profitability
11
International Markets
Revenue(1)
Underlying profit(1)
Revenue by business(2)
(HY 2016: £751.4m CER)
£862.8m +15% CER
+27% AER
(HY 2016: £34.4m CER)
£25.7m -25% CER
-18% AER
Operating Environment
• Less favourable economic conditions in Saudi Arabia
• Intense competition for IPMI
Performance
• Bupa Global customer mix changes and higher loss ratios
• Increased stake in Bupa Arabia to 34.25%; continues to deliver
good customer and revenue growth
• Acquisition of Care Plus in Brazil had positive impact on
performance; integration on track
• Bupa Hong Kong performance on target benefitting from strong
renewals and pricing improvements; Continued expansion of
Quality HealthCare clinics business with three new facilities
• Divestment of Bupa Thailand to Aetna announced 25 July
(1) Revenue of £862.8m does not include the revenues of our equity accounted associates (Max Bupa, India, Bupa Arabia and Highway to
Health, part of Bupa Global North America). Our appropriate share of profit from these businesses is included in underlying profit.
(2) Chart includes 100% of Bupa revenues from all businesses to give a sense of scale

Overview Financial review Outlook & operating priorities Market unit performance
Section 3
Financial review
Martin Potkins, Corporate Controller
Gareth Evans, Group Treasurer
12

Overview Financial review Outlook & operating priorities Market unit performance
Financial highlights
13
HY 2017 Financial overview
Short-term funding refinanced via £300m senior bond
Completion of transactions impacts solvency and funding metrics at the
half year as expected
Solvency capital coverage 160% (1)
Continued strong cash generation
(1) The Solvency II capital coverage ratio is an estimated value.

Overview Financial review Outlook & operating priorities Market unit performance
Group grew revenues by 4% and underlying profit 11% – a good result given local market conditions
14
HY 2017 Financial overview
Revenues
Underlying profit before tax(1)
HY 2017
HY 2016 (CER)
£6.1bn
£5.9bn
• Deepened and strengthened our market positions
aided through a number of key transactions
• Growth in underlying profit is underpinned by good
performances from ELA and the UK, driven by
growth in Sanitas Seguros and the acquisition of
Oasis Dental Care, respectively
HY 2017
HY 2016 (CER)
£330.9m
£298.5m
(1) In order to reflect trading performance in a consistent manner year on year, a number of non-trading items that limit comparability are removed from our statutory profit before tax to arrive at underlying profit. This
distinguishes underlying profit from other constituents of the statutory profit before tax, excluding items relating to business combinations and disposals, fluctuations in foreign exchange, property revaluations and
investment returns on return-seeking assets, along with other one-off items.
+4% at CER
+15% at AER
+11% at CER
+26% at AER
Overview Financial review Outlook & operating priorities Market unit performance
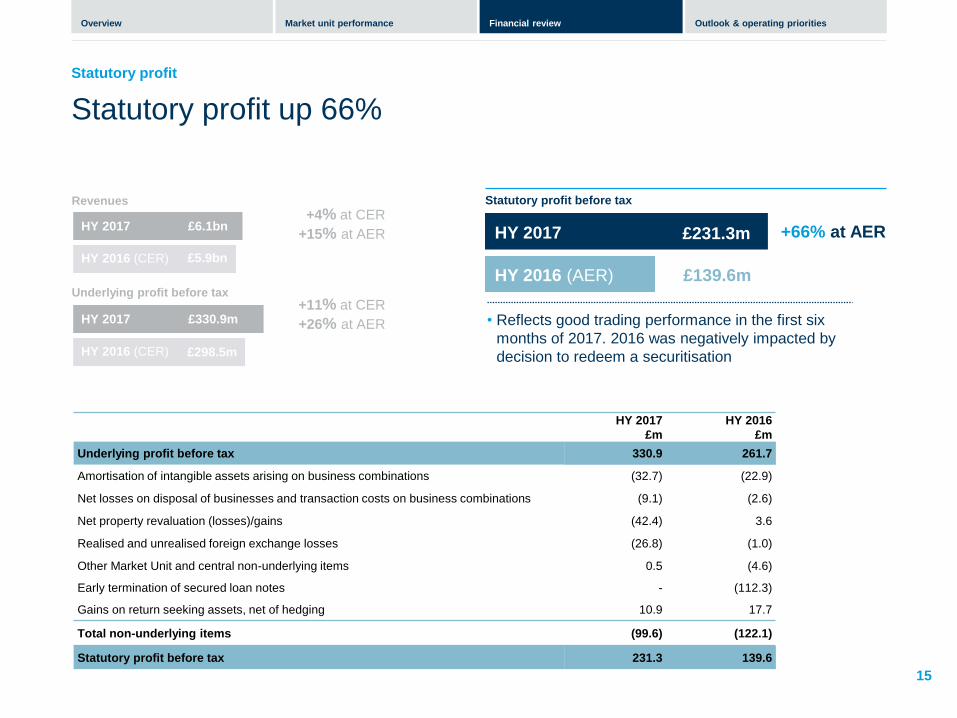
Statutory profit up 66%
15
Statutory profit
Revenues Statutory profit before tax
+4% at CER
+15% at AER HY 2017
HY 2016 (CER)
£6.1bn
£5.9bn
• Reflects good trading performance in the first six
months of 2017. 2016 was negatively impacted by
decision to redeem a securitisation
+66% at AER HY 2017
HY 2016 (AER) £139.6m
Underlying profit before tax
+11% at CER
+26% at AER HY 2017
HY 2016 (CER)
£330.9m
£298.5m
£231.3m
HY 2017
£m
HY 2016
£m
Underlying profit before tax 330.9 261.7
Amortisation of intangible assets arising on business combinations (32.7) (22.9)
Net losses on disposal of businesses and transaction costs on business combinations (9.1) (2.6)
Net property revaluation (losses)/gains (42.4) 3.6
Realised and unrealised foreign exchange losses (26.8) (1.0)
Other Market Unit and central non-underlying items 0.5 (4.6)
Early termination of secured loan notes - (112.3)
Gains on return seeking assets, net of hedging 10.9 17.7
Total non-underlying items (99.6) (122.1)
Statutory profit before tax 231.3 139.6
Overview Financial review Outlook & operating priorities Market unit performance
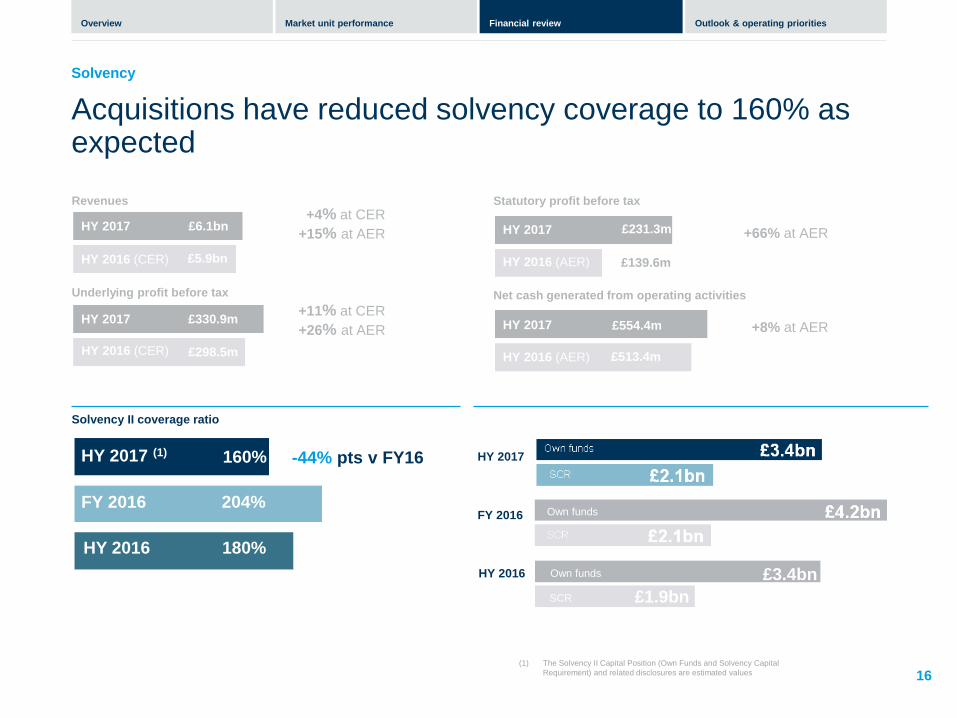
Acquisitions have reduced solvency coverage to 160% as expected
16
Solvency
Revenues
Solvency II coverage ratio
+4% at CER
+15% at AER HY 2017
HY 2016 (CER)
£6.1bn
£5.9bn
-44% pts v FY16
HY 2017 (1)
FY 2016
160%
204%
(1) The Solvency II Capital Position (Own Funds and Solvency Capital
Requirement) and related disclosures are estimated values
Underlying profit before tax
HY 2017
HY 2016 (CER)
£330.9m
£298.5m
Statutory profit before tax
+66% at AER HY 2017
HY 2016 (AER)
£231.3m
£139.6m
Net cash generated from operating activities
+8% at AER HY 2017
HY 2016 (AER)
£554.4m
£513.4m
HY 2016 180%
+11% at CER
+26% at AER
HY 2017
FY 2016
HY 2016 180%
HY 2016 Own funds £3.4bn
SCR £1.9bn
Own funds Own funds
Own funds £3.4bn
SCR £1.9bn
HY 2017 (1)
FY 2016
160%
204%
HY 2016 180%
Overview Financial review Outlook & operating priorities Market unit performance
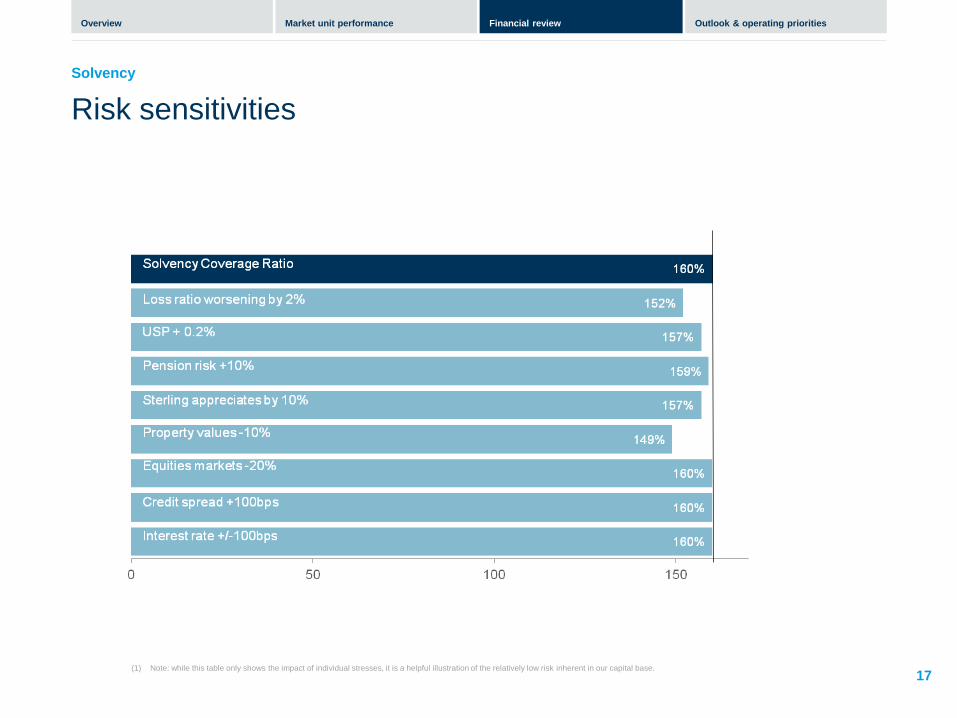
Risk sensitivities
17
Solvency
(1) Note: while this table only shows the impact of individual stresses, it is a helpful illustration of the relatively low risk inherent in our capital base.
Overview Financial review Outlook & operating priorities Market unit performance
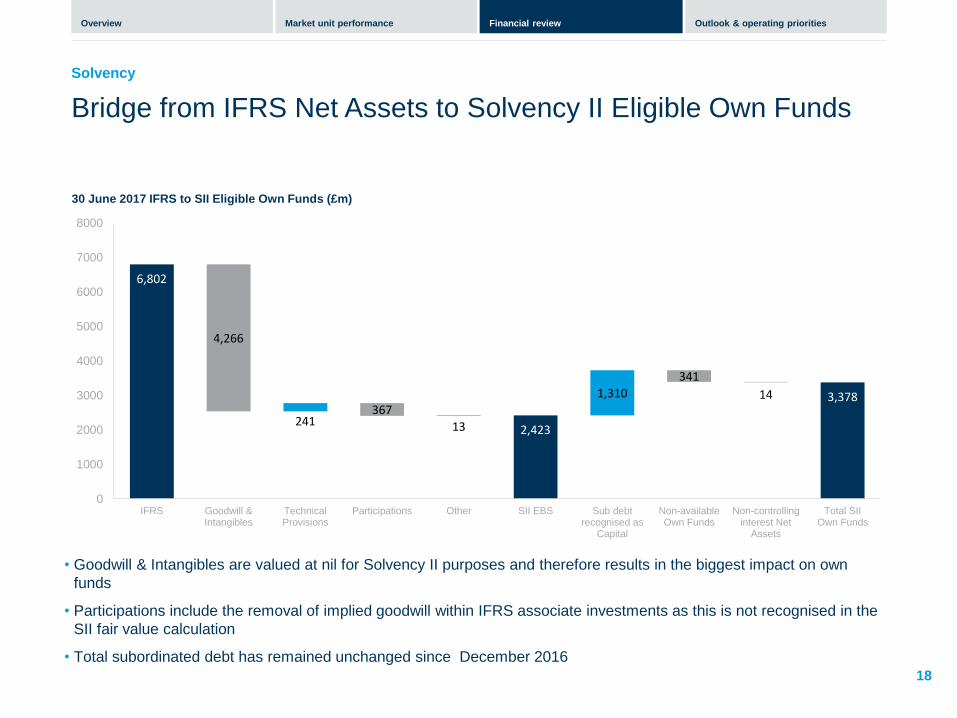
Bridge from IFRS Net Assets to Solvency II Eligible Own Funds
18
Solvency
30 June 2017 IFRS to SII Eligible Own Funds (£m)
• Goodwill & Intangibles are valued at nil for Solvency II purposes and therefore results in the biggest impact on own
funds
• Participations include the removal of implied goodwill within IFRS associate investments as this is not recognised in the
SII fair value calculation
• Total subordinated debt has remained unchanged since December 2016
6,802
2,423
3,378
241 13
1,310
4,266
367
341
14
0
1000
2000
3000
4000
5000
6000
7000
8000
IFRS Goodwill &Intangibles
TechnicalProvisions
Participations Other SII EBS Sub debtrecognised as
Capital
Non-availableOwn Funds
Non-controllinginterest Net
Assets
Total SIIOwn Funds
Overview Financial review Outlook & operating priorities Market unit performance
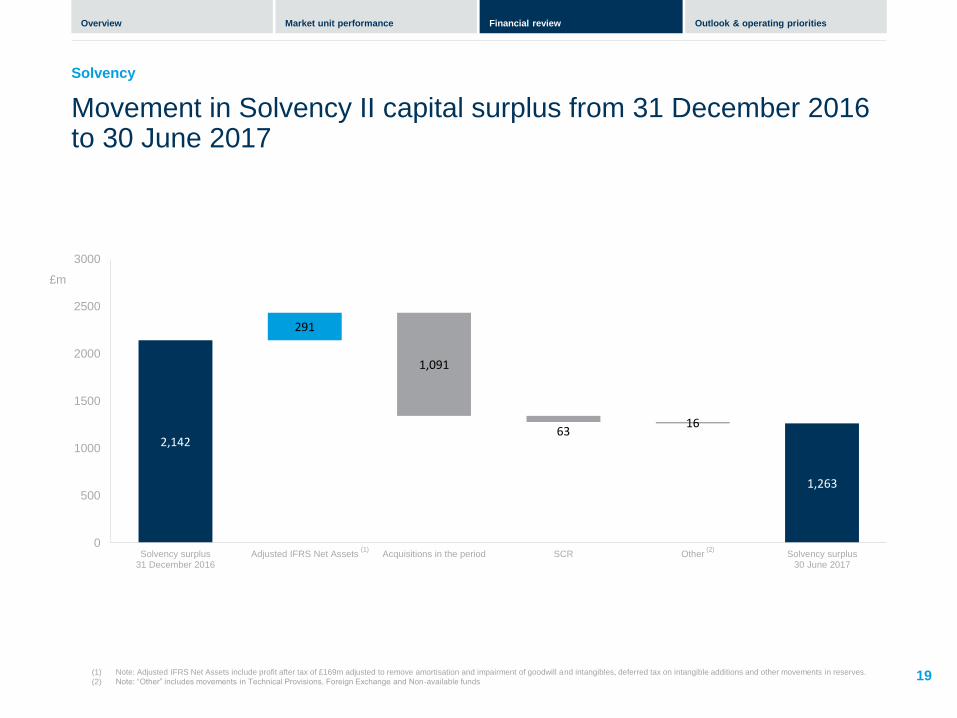
Movement in Solvency II capital surplus from 31 December 2016 to 30 June 2017
19
Solvency
Jun-18
(1) Note: Adjusted IFRS Net Assets include profit after tax of £169m adjusted to remove amortisation and impairment of goodwill and intangibles, deferred tax on intangible additions and other movements in reserves.
(2) Note: “Other” includes movements in Technical Provisions, Foreign Exchange and Non-available funds
2,142
1,263
291
1,091
63 16
0
500
1000
1500
2000
2500
3000
Solvency surplus31 December 2016
Adjusted IFRS Net Assets Acquisitions in the period SCR Other Solvency surplus30 June 2017
(1) (2)
£m
Overview Financial review Outlook & operating priorities Market unit performance
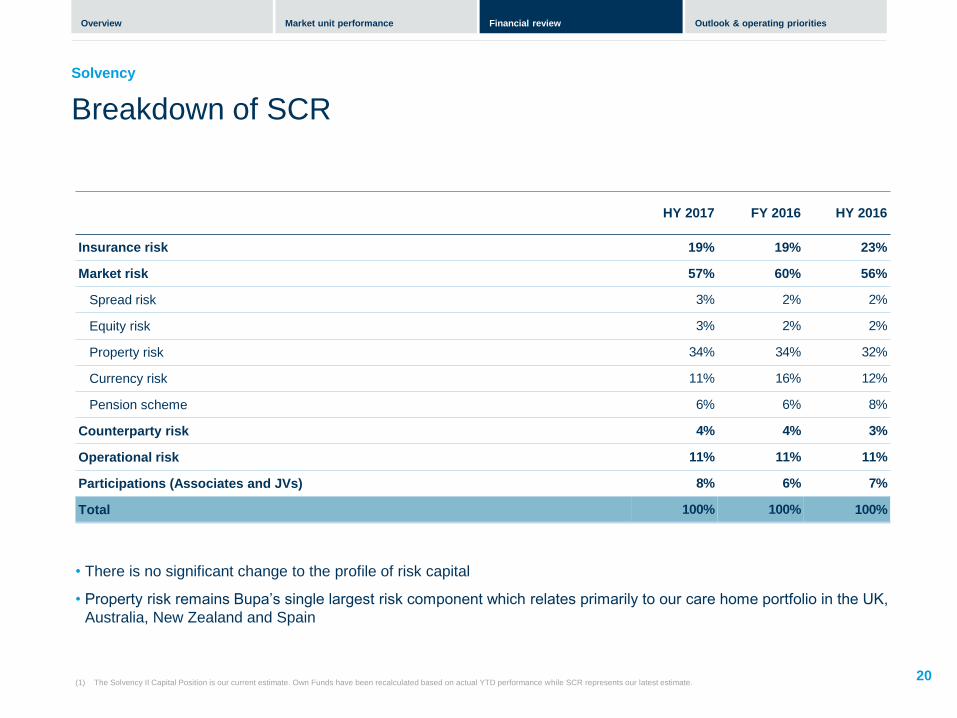
Breakdown of SCR
20
Solvency
(1) The Solvency II Capital Position is our current estimate. Own Funds have been recalculated based on actual YTD performance while SCR represents our latest estimate.
HY 2017 FY 2016 HY 2016
Insurance risk 19% 19% 23%
Market risk 57% 60% 56%
Spread risk 3% 2% 2%
Equity risk 3% 2% 2%
Property risk 34% 34% 32%
Currency risk 11% 16% 12%
Pension scheme 6% 6% 8%
Counterparty risk 4% 4% 3%
Operational risk 11% 11% 11%
Participations (Associates and JVs) 8% 6% 7%
Total 100% 100% 100%
• There is no significant change to the profile of risk capital
• Property risk remains Bupa’s single largest risk component which relates primarily to our care home portfolio in the UK,
Australia, New Zealand and Spain
Overview Financial review Outlook & operating priorities Market unit performance
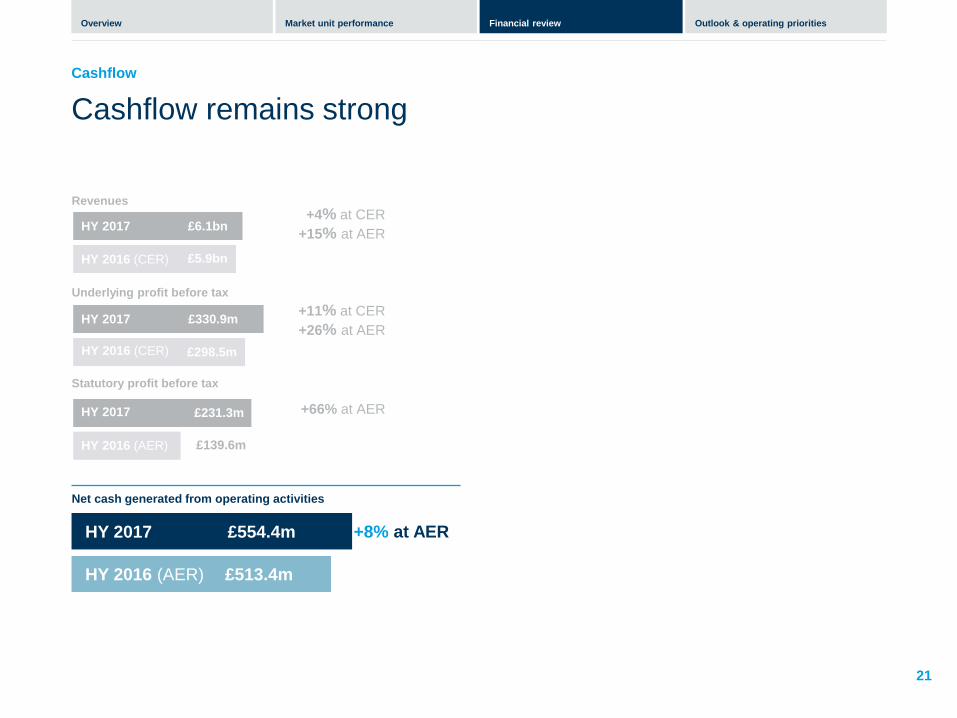
Cashflow remains strong
21
Cashflow
Revenues
Net cash generated from operating activities
+4% at CER
+15% at AER HY 2017
HY 2016 (CER)
£6.1bn
£5.9bn
HY 2017
HY 2016 (AER)
£554.4m
£513.4m
Underlying profit before tax
HY 2017
HY 2016 (CER)
£330.9m
£298.5m
Statutory profit before tax
+66% at AER HY 2017
HY 2016 (AER)
£231.3m
£139.6m
+8% at AER
+11% at CER
+26% at AER

Overview Financial review Outlook & operating priorities Market unit performance
Increased leverage following acquisitions
22
HY 2017 Financial overview
Revenues
Leverage(1)
+4% at CER
+15% at AER HY 2017
HY 2016 (CER)
£6.1bn
£5.9bn
HY 2017
FY 2016
30.2%
22.6%
Underlying profit before tax
HY 2017
HY 2016 (CER)
£330.9m
£298.5m
Statutory profit before tax
+66% at AER HY 2017
HY 2016 (AER)
£231.3m
£139.6m
Net cash generated from operating activities
+8% at AER HY 2017
HY 2016 (AER)
£554.4m
£513.4m
Solvency II coverage ratio
-44% pts v FY16 HY 2017
FY 2016
160%
204%
(1) Gross debt (including hybrid debt) / gross debt plus equity
+7.6% pts v FY16
HY 2016 24.3%
HY 2016 180%
+11% at CER
+26% at AER
Overview Financial review Outlook & operating priorities Market unit performance
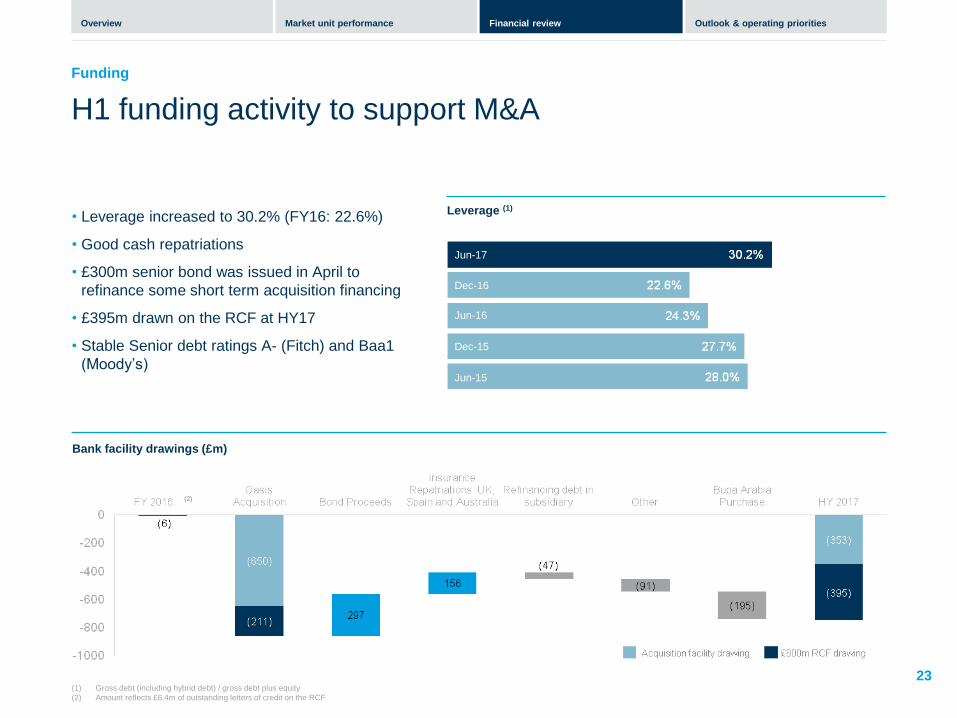
H1 funding activity to support M&A
23
Funding
Leverage (1)
Jun-17
Jun-16
Dec-15
Jun-15
Jun-18
Dec-16
• Leverage increased to 30.2% (FY16: 22.6%)
• Good cash repatriations
• £300m senior bond was issued in April to
refinance some short term acquisition financing
• £395m drawn on the RCF at HY17
• Stable Senior debt ratings A- (Fitch) and Baa1
(Moody’s)
(1) Gross debt (including hybrid debt) / gross debt plus equity
(2) Amount reflects £6.4m of outstanding letters of credit on the RCF
Bank facility drawings (£m)
(2)
Overview Financial review Outlook & operating priorities Market unit performance
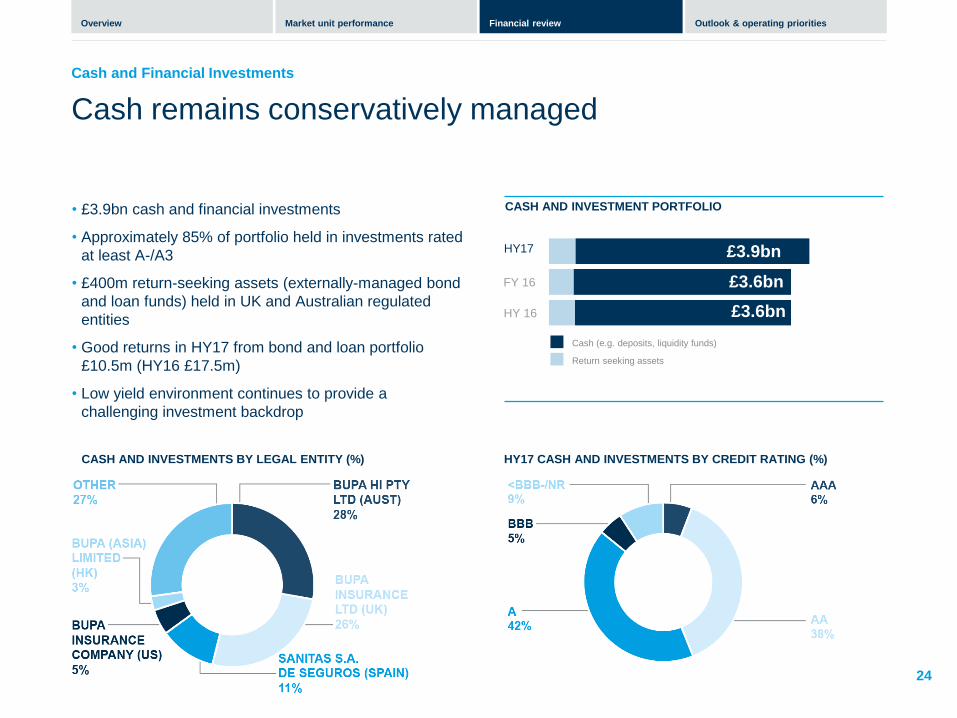
Cash remains conservatively managed
24
Cash and Financial Investments
CASH AND INVESTMENT PORTFOLIO • £3.9bn cash and financial investments
• Approximately 85% of portfolio held in investments rated
at least A-/A3
• £400m return-seeking assets (externally-managed bond
and loan funds) held in UK and Australian regulated
entities
• Good returns in HY17 from bond and loan portfolio
£10.5m (HY16 £17.5m)
• Low yield environment continues to provide a
challenging investment backdrop
HY17
Jun-18
HY17 CASH AND INVESTMENTS BY CREDIT RATING (%)
FY 16
£3.9bn
£3.6bn
Cash (e.g. deposits, liquidity funds)
Return seeking assets
HY 16 £3.6bn
CASH AND INVESTMENTS BY LEGAL ENTITY (%)

Overview Financial review Outlook & operating priorities Market unit performance
Section 4
Outlook and operating priorities Evelyn Bourke, Group CEO
25
Overview Financial review Outlook & operating priorities Market unit performance
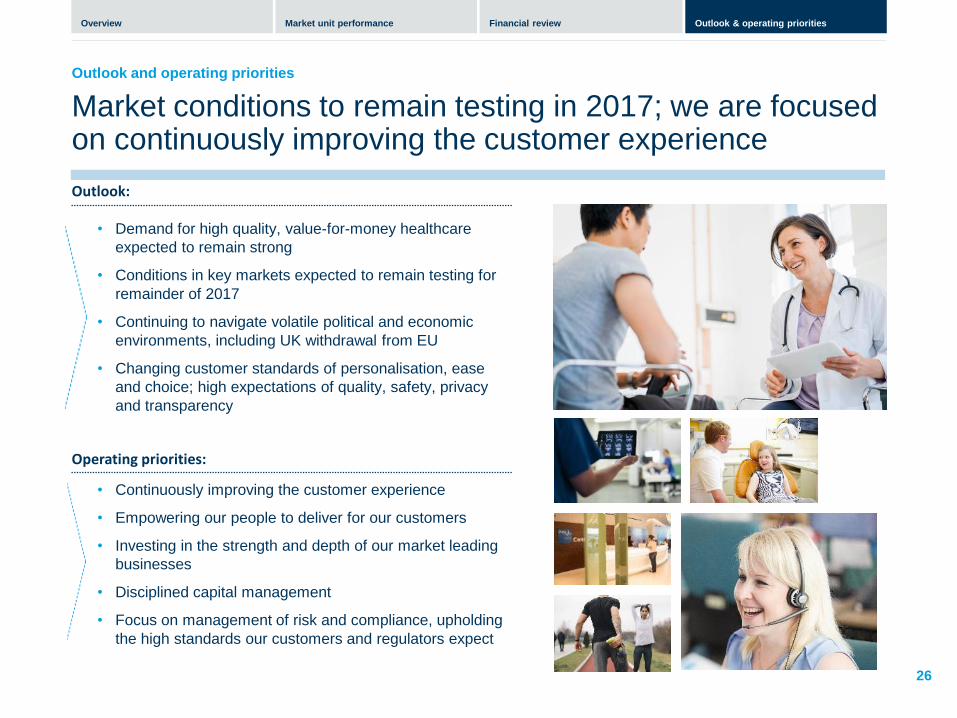
Market conditions to remain testing in 2017; we are focused on continuously improving the customer experience
Outlook and operating priorities
Outlook:
Operating priorities:
• Demand for high quality, value-for-money healthcare
expected to remain strong
• Conditions in key markets expected to remain testing for
remainder of 2017
• Continuing to navigate volatile political and economic
environments, including UK withdrawal from EU
• Changing customer standards of personalisation, ease
and choice; high expectations of quality, safety, privacy
and transparency
• Continuously improving the customer experience
• Empowering our people to deliver for our customers
• Investing in the strength and depth of our market leading
businesses
• Disciplined capital management
• Focus on management of risk and compliance, upholding
the high standards our customers and regulators expect
26

Overview Financial review Outlook & operating priorities Market unit performance
Questions and answers
27

Overview Financial review Outlook & operating priorities Market unit performance
Further information
• For further information or to request a follow-up call or meeting, email [email protected]
• All financial results and 2016 SFCRs for Bupa Group and Bupa Insurance Limited available on www.bupa.com/Corporate/our-performance
28

Overview Financial review Outlook & operating priorities Market unit performance
Appendices
29

Overview Financial review Outlook & operating priorities Market unit performance
Organisation structure
30
Market Units
Australia and New Zealand
• Bupa Health Insurance
• Bupa Health Services
• Bupa Aged Care Australia
• Bupa New Zealand
(1) Bupa completed the purchase of Oasis Dental Care on 09 February 2017
(2) Bupa Thailand sold 25 July 2017
Appendix
UK Europe & Latin America
International Markets
• Bupa UK Insurance
• Bupa Care Services
• Bupa Health Services
• Bupa Cromwell Hospital
• Bupa Dental UK (1)
• Sanitas Seguros
• Sanitas Hospitales and
New Services
• Sanitas Dental
• Sanitas Mayores
• LUX MED
• Bupa Chile
• Bupa Global
• Bupa Arabia
• Bupa Hong Kong
• Quality HealthCare
(Hong Kong)
• Max Bupa (India)
• Bupa China
• Bupa Thailand (2)
Overview Financial review Outlook & operating priorities Market unit performance
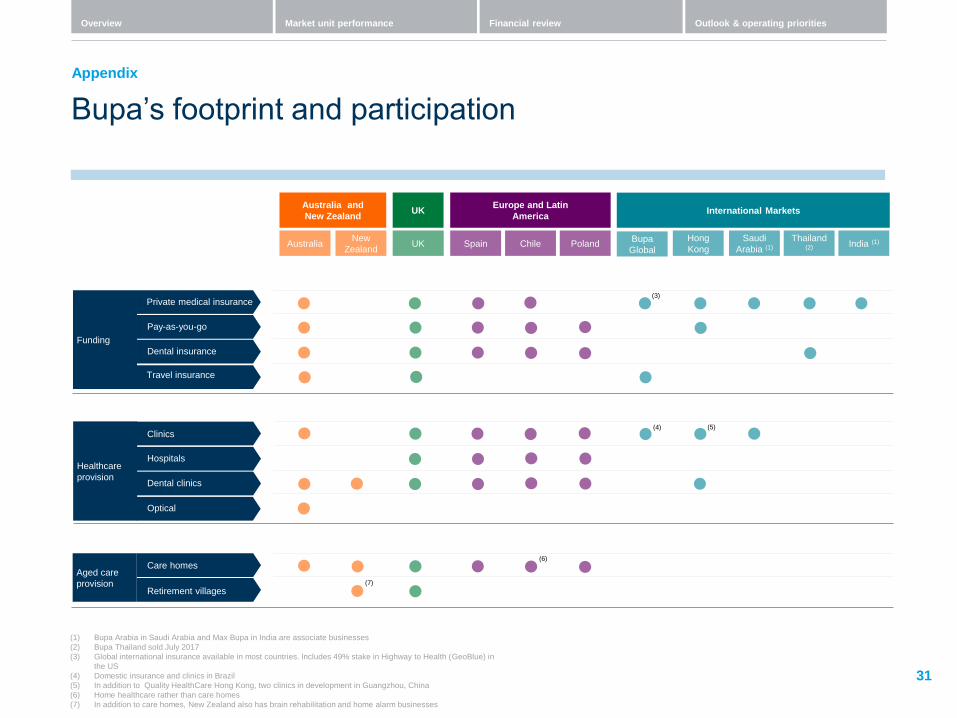
Bupa’s footprint and participation
31
Appendix
Hong
Kong
Thailand (2)
India (1) Saudi
Arabia (1) Poland
International Markets
Funding
Healthcare
provision
UK
UK
Spain
Europe and Latin
America
Chile Australia New
Zealand
Australia and
New Zealand
Private medical insurance
Pay-as-you-go
Dental insurance
Clinics
Hospitals
Dental clinics
Bupa
Global
Optical
Travel insurance
Aged care
provision
Care homes
Retirement villages
(1) Bupa Arabia in Saudi Arabia and Max Bupa in India are associate businesses
(2) Bupa Thailand sold July 2017
(3) Global international insurance available in most countries. Includes 49% stake in Highway to Health (GeoBlue) in
the US
(4) Domestic insurance and clinics in Brazil
(5) In addition to Quality HealthCare Hong Kong, two clinics in development in Guangzhou, China
(6) Home healthcare rather than care homes
(7) In addition to care homes, New Zealand also has brain rehabilitation and home alarm businesses
(7)
(3)
(4) (5)
(6)
Overview Financial review Outlook & operating priorities Market unit performance
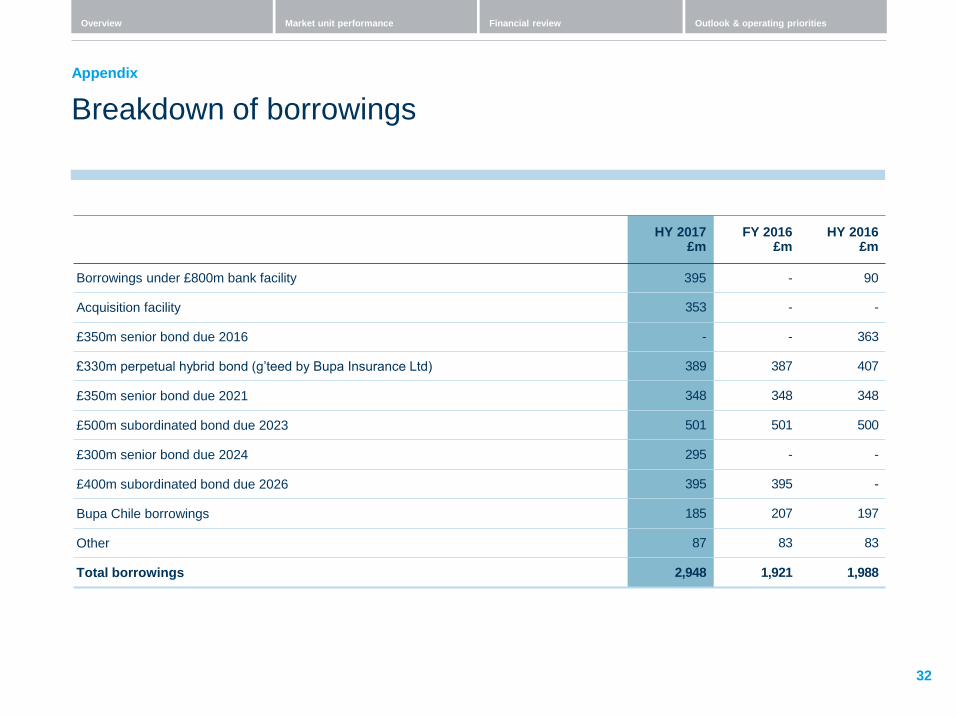
Breakdown of borrowings
32
HY 2017 £m
FY 2016 £m
HY 2016 £m
Borrowings under £800m bank facility 395 - 90
Acquisition facility 353 - -
£350m senior bond due 2016 - - 363
£330m perpetual hybrid bond (g’teed by Bupa Insurance Ltd) 389 387 407
£350m senior bond due 2021 348 348 348
£500m subordinated bond due 2023 501 501 500
£300m senior bond due 2024 295 - -
£400m subordinated bond due 2026 395 395 -
Bupa Chile borrowings 185 207 197
Other 87 83 83
Total borrowings 2,948 1,921 1,988
Appendix
Overview Financial review Outlook & operating priorities Market unit performance
Cautionary statement concerning forward-looking statements
33
This document may contain certain “forward-looking statements”. Statements that are not historical facts, including statements about the beliefs and expectations of the British United Provident Association Limited Group (“Bupa”) and Bupa’s directors or management, are forward-looking statements. In particular, but not exclusively, these may relate to Bupa’s plans, current goals and expectations relating to future financial condition, performance and results.
By their nature, forward-looking statements involve risk and uncertainty because they relate to events and depend upon future circumstances that may or may not occur, many of which are beyond Bupa’s control and all of which are solely based on Bupa’s current beliefs and expectations about future events. These circumstances include, among others, global economic and business conditions, market related risks such as fluctuations in interest rates and exchange rates, the policies and actions of governmental and regulatory authorities, the impact of competition, the timing, impact and other uncertainties of future mergers or combinations within relevant industries. Such forward-looking statements involve known and unknown risks, uncertainties and other factors, which may cause the actual future condition, results, performance or achievements of Bupa or its industry to be materially different to those expressed or implied by such forward looking statements. Other than as required by law, Bupa expressly disclaims any obligations or undertakings to release publicly any updates or revisions to any forward-looking statements to reflect any change in the expectations of Bupa with regard thereto or any change in events, conditions or circumstances on which any such statement is based.
The information contained in this presentation is intended to be read in conjunction with, and not as a substitute for, Bupa’s half year statement for the six months ended 30 June 2017 (the “HY17 Report”). In the event of any inconsistency, the HY17 Report should be considered to prevail.
Disclaimer