
2015 full year results - Rio Tinto - Rio Tinto Tinto 2015 full year results.pdf · 2015 full year...
45
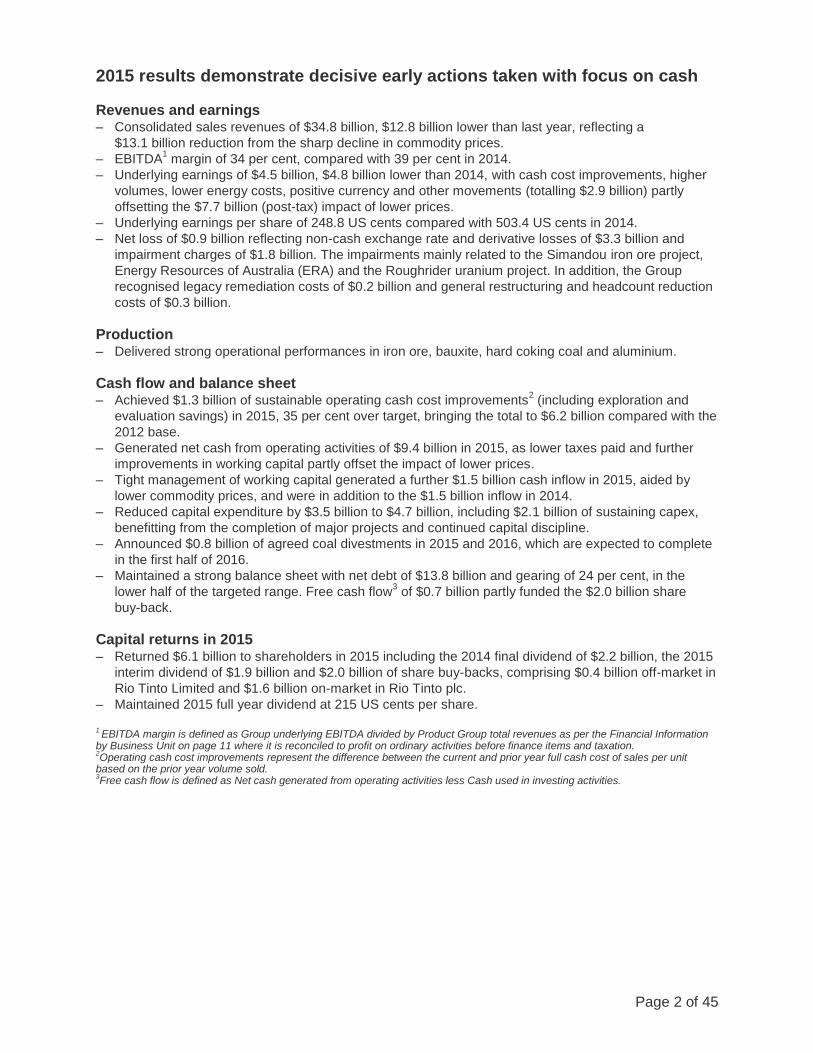
2015 full year results Page 1 of 45 Rio Tinto delivers underlying earnings of $4.5 billion and maintains 2015 full year dividend at 215 US cents per share 11 February 2016 Rio Tinto chief executive Sam Walsh said “Against a highly challenging environment, Rio Tinto delivered a strong performance in 2015 with underlying earnings of $4.5 billion. We continued to take decisive action to preserve cash through further cost reductions, lower capital expenditure and the release of working capital. This focus on cash resulted in operating cash flows of $9.4 billion. “At the same time, we have significantly strengthened our balance sheet and finished 2015 with net debt of $13.8 billion, which is $700 million better than the $14.5 billion pro-forma position at the end of 2014. “The continued deterioration in the macro environment has generated widespread market uncertainty. We are embarking on a new round of proactive measures to cut our operating costs by a further $1 billion in 2016 followed by an additional goal of $1 billion in 2017. We are also reducing our capital expenditure to $4 billion in 2016 and $5 billion in 2017, an overall reduction of $3 billion compared with our previous guidance. “These significant actions provide us with the confidence that we remain robustly positioned to maintain both balance sheet strength and deliver shareholder returns through the cycle.” Rio Tinto chairman Jan du Plessis said “The board has announced today a final dividend of 107.5 US cents per share, bringing the 2015 full year dividend to 215 US cents per share, in line with 2014. “Over the past five years we have returned more than $25 billion to our shareholders, underlining our commitment to shareholder returns. However, with the continuing uncertain market outlook, the board believes that maintaining the current progressive dividend policy would constrain the business and act against shareholders’ long-term interests. We are therefore replacing the progressive dividend policy with a more flexible approach that will allow the distribution of returns to reflect better the company’s position and outlook. For 2016, we intend that the full year dividend will not be less than 110 US cents per share.” Year to 31 December 2015 2014 Change Underlying earnings 1 (US$ millions) 4,540 9,305 -51% Net (loss) / earnings 1 (US$ millions) (866) 6,527 n/a Net cash generated from operating activities (US$ millions) 9,383 14,286 -34% Capital expenditure 2 (US$ millions) 4,685 8,162 -43% Underlying earnings per share (US cents) 248.8 503.4 -51% Basic (loss) / earnings per share (US cents) (47.5) 353.1 n/a Ordinary dividends per share (US cents) 215.0 215.0 - At 31 December 2015 2014 Change Net debt 3 (US$ millions) 13,783 12,495 +10% Gearing ratio 4 24% 19% +5% The financial results are prepared in accordance with IFRS and are unaudited. To allow production numbers to be compared on a like-for-like basis, production from asset divestments completed in 2014 have been excluded from Rio Tinto share of production data but assets sold in 2015 remain in the comparative. 1 Underlying earnings is a key financial performance indicator which management uses internally to assess performance. It is presented here to provide greater understanding of the underlying business performance of the Group’s operations. Net and underlying (loss) / earnings relate to (loss) / profit attributable to the owners of Rio Tinto. Underlying earnings is defined and reconciled to net (loss) / earnings on page 44. 2 Capital expenditure is presented gross, before taking into account any disposals of property, plant and equipment. 3 Net debt is defined and reconciled to the balance sheet on page 38. 4 Gearing ratio is defined as net debt divided by the sum of net debt and total equity at each period end.
Transcript of 2015 full year results - Rio Tinto - Rio Tinto Tinto 2015 full year results.pdf · 2015 full year...
2015 full year results
Page 1 of 45
Rio Tinto delivers underlying earnings of $4.5 billion and maintains 2015 full year dividend at 215 US cents per share
11 February 2016
Rio Tinto chief executive Sam Walsh said “Against a highly challenging environment, Rio Tinto delivered
a strong performance in 2015 with underlying earnings of $4.5 billion. We continued to take decisive
action to preserve cash through further cost reductions, lower capital expenditure and the release of
working capital. This focus on cash resulted in operating cash flows of $9.4 billion.
“At the same time, we have significantly strengthened our balance sheet and finished 2015 with net debt
of $13.8 billion, which is $700 million better than the $14.5 billion pro-forma position at the end of 2014.
“The continued deterioration in the macro environment has generated widespread market uncertainty. We
are embarking on a new round of proactive measures to cut our operating costs by a further $1 billion in
2016 followed by an additional goal of $1 billion in 2017. We are also reducing our capital expenditure to
$4 billion in 2016 and $5 billion in 2017, an overall reduction of $3 billion compared with our previous
guidance.
“These significant actions provide us with the confidence that we remain robustly positioned to maintain
both balance sheet strength and deliver shareholder returns through the cycle.”
Rio Tinto chairman Jan du Plessis said “The board has announced today a final dividend of 107.5 US
cents per share, bringing the 2015 full year dividend to 215 US cents per share, in line with 2014.
“Over the past five years we have returned more than $25 billion to our shareholders, underlining our
commitment to shareholder returns. However, with the continuing uncertain market outlook, the board
believes that maintaining the current progressive dividend policy would constrain the business and act
against shareholders’ long-term interests. We are therefore replacing the progressive dividend policy with
a more flexible approach that will allow the distribution of returns to reflect better the company’s position
and outlook. For 2016, we intend that the full year dividend will not be less than 110 US cents per share.”
Year to 31 December 2015 2014 Change
Underlying earnings1 (US$ millions) 4,540 9,305 -51%
Net (loss) / earnings1 (US$ millions) (866) 6,527 n/a
Net cash generated from operating activities (US$ millions) 9,383 14,286 -34%
Capital expenditure2 (US$ millions) 4,685 8,162 -43%
Underlying earnings per share (US cents) 248.8 503.4 -51%
Basic (loss) / earnings per share (US cents) (47.5) 353.1 n/a
Ordinary dividends per share (US cents) 215.0 215.0 -
At 31 December 2015 2014 Change
Net debt3 (US$ millions) 13,783 12,495 +10%
Gearing ratio4 24% 19% +5%
The financial results are prepared in accordance with IFRS and are unaudited. To allow production numbers to be compared on a like-for-like basis, production from asset divestments completed in 2014 have been excluded from Rio Tinto share of production data but assets sold in 2015 remain in the comparative. 1Underlying earnings is a key financial performance indicator which management uses internally to assess performance. It is
presented here to provide greater understanding of the underlying business performance of the Group’s operations. Net and underlying (loss) / earnings relate to (loss) / profit attributable to the owners of Rio Tinto. Underlying earnings is defined and reconciled to net (loss) / earnings on page 44. 2Capital expenditure is presented gross, before taking into account any disposals of property, plant and equipment.
3Net debt is defined and reconciled to the balance sheet on page 38.
4Gearing ratio is defined as net debt divided by the sum of net debt and total equity at each period end.
Page 2 of 45
2015 results demonstrate decisive early actions taken with focus on cash
Revenues and earnings – Consolidated sales revenues of $34.8 billion, $12.8 billion lower than last year, reflecting a
$13.1 billion reduction from the sharp decline in commodity prices.
– EBITDA1 margin of 34 per cent, compared with 39 per cent in 2014.
– Underlying earnings of $4.5 billion, $4.8 billion lower than 2014, with cash cost improvements, higher
volumes, lower energy costs, positive currency and other movements (totalling $2.9 billion) partly
offsetting the $7.7 billion (post-tax) impact of lower prices.
– Underlying earnings per share of 248.8 US cents compared with 503.4 US cents in 2014.
– Net loss of $0.9 billion reflecting non-cash exchange rate and derivative losses of $3.3 billion and
impairment charges of $1.8 billion. The impairments mainly related to the Simandou iron ore project,
Energy Resources of Australia (ERA) and the Roughrider uranium project. In addition, the Group
recognised legacy remediation costs of $0.2 billion and general restructuring and headcount reduction
costs of $0.3 billion.
Production – Delivered strong operational performances in iron ore, bauxite, hard coking coal and aluminium.
Cash flow and balance sheet – Achieved $1.3 billion of sustainable operating cash cost improvements
2 (including exploration and
evaluation savings) in 2015, 35 per cent over target, bringing the total to $6.2 billion compared with the
2012 base.
– Generated net cash from operating activities of $9.4 billion in 2015, as lower taxes paid and further
improvements in working capital partly offset the impact of lower prices.
– Tight management of working capital generated a further $1.5 billion cash inflow in 2015, aided by
lower commodity prices, and were in addition to the $1.5 billion inflow in 2014.
– Reduced capital expenditure by $3.5 billion to $4.7 billion, including $2.1 billion of sustaining capex,
benefitting from the completion of major projects and continued capital discipline.
– Announced $0.8 billion of agreed coal divestments in 2015 and 2016, which are expected to complete
in the first half of 2016.
– Maintained a strong balance sheet with net debt of $13.8 billion and gearing of 24 per cent, in the
lower half of the targeted range. Free cash flow3 of $0.7 billion partly funded the $2.0 billion share
buy-back.
Capital returns in 2015 – Returned $6.1 billion to shareholders in 2015 including the 2014 final dividend of $2.2 billion, the 2015
interim dividend of $1.9 billion and $2.0 billion of share buy-backs, comprising $0.4 billion off-market in
Rio Tinto Limited and $1.6 billion on-market in Rio Tinto plc.
– Maintained 2015 full year dividend at 215 US cents per share.
1 EBITDA margin is defined as Group underlying EBITDA divided by Product Group total revenues as per the Financial Information
by Business Unit on page 11 where it is reconciled to profit on ordinary activities before finance items and taxation. 2Operating cash cost improvements represent the difference between the current and prior year full cash cost of sales per unit
based on the prior year volume sold. 3Free cash flow is defined as Net cash generated from operating activities less Cash used in investing activities.
Page 3 of 45
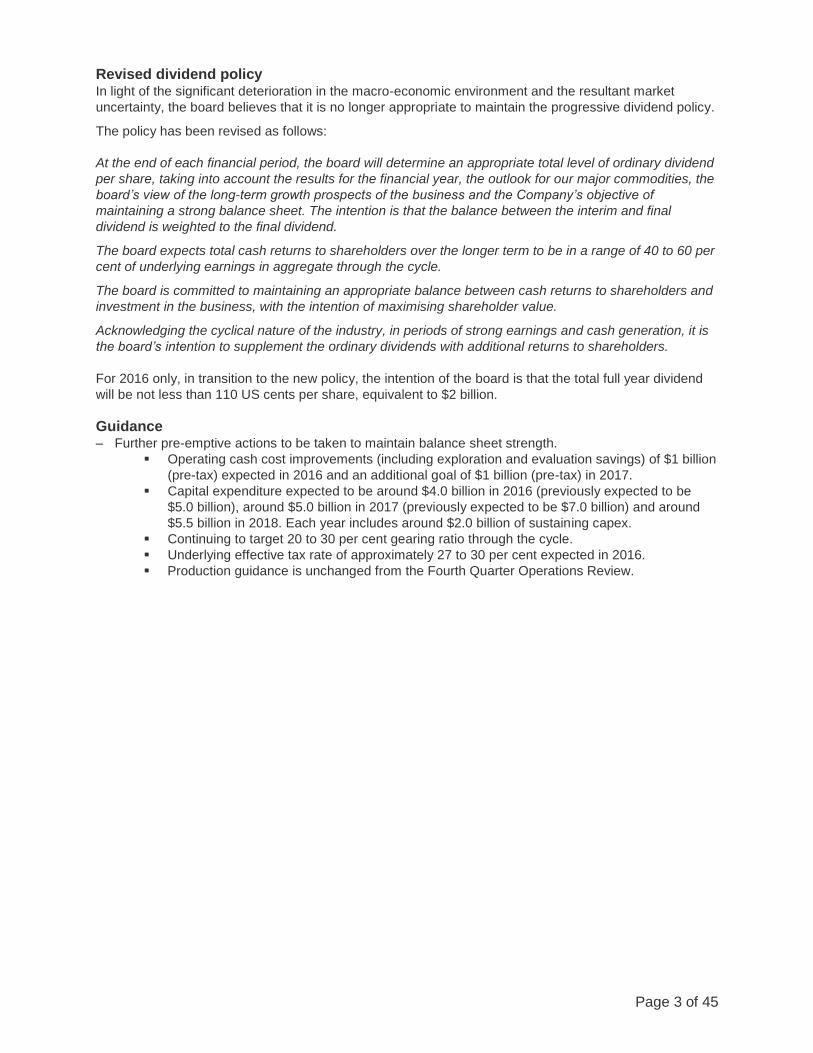
Revised dividend policy In light of the significant deterioration in the macro-economic environment and the resultant market
uncertainty, the board believes that it is no longer appropriate to maintain the progressive dividend policy.
The policy has been revised as follows:
At the end of each financial period, the board will determine an appropriate total level of ordinary dividend
per share, taking into account the results for the financial year, the outlook for our major commodities, the
board’s view of the long-term growth prospects of the business and the Company’s objective of
maintaining a strong balance sheet. The intention is that the balance between the interim and final
dividend is weighted to the final dividend.
The board expects total cash returns to shareholders over the longer term to be in a range of 40 to 60 per
cent of underlying earnings in aggregate through the cycle.
The board is committed to maintaining an appropriate balance between cash returns to shareholders and
investment in the business, with the intention of maximising shareholder value.
Acknowledging the cyclical nature of the industry, in periods of strong earnings and cash generation, it is
the board’s intention to supplement the ordinary dividends with additional returns to shareholders.
For 2016 only, in transition to the new policy, the intention of the board is that the total full year dividend
will be not less than 110 US cents per share, equivalent to $2 billion.
Guidance – Further pre-emptive actions to be taken to maintain balance sheet strength.
Operating cash cost improvements (including exploration and evaluation savings) of $1 billion
(pre-tax) expected in 2016 and an additional goal of $1 billion (pre-tax) in 2017.
Capital expenditure expected to be around $4.0 billion in 2016 (previously expected to be
$5.0 billion), around $5.0 billion in 2017 (previously expected to be $7.0 billion) and around
$5.5 billion in 2018. Each year includes around $2.0 billion of sustaining capex.
Continuing to target 20 to 30 per cent gearing ratio through the cycle.
Underlying effective tax rate of approximately 27 to 30 per cent expected in 2016.
Production guidance is unchanged from the Fourth Quarter Operations Review.
Page 4 of 45
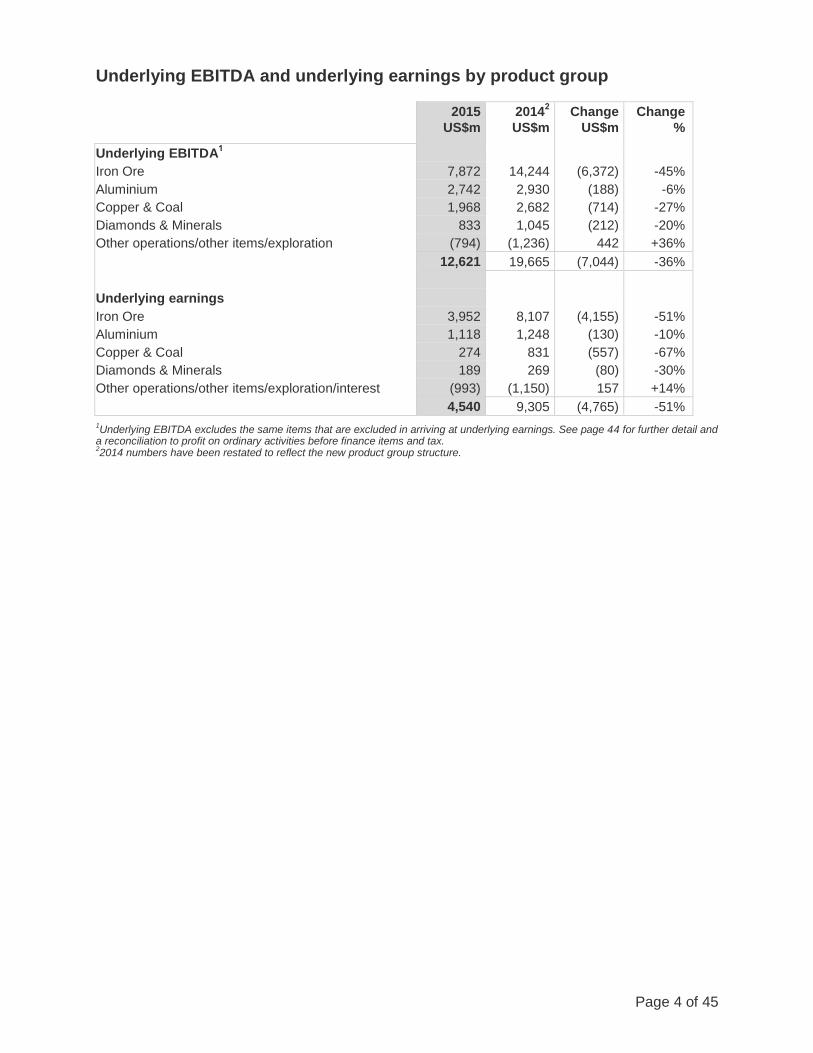
Underlying EBITDA and underlying earnings by product group
2015
US$m
20142
US$m
Change
US$m
Change
%
Underlying EBITDA1
Iron Ore 7,872 14,244 (6,372) -45%
Aluminium 2,742 2,930 (188) -6%
Copper & Coal 1,968 2,682 (714) -27%
Diamonds & Minerals 833 1,045 (212) -20%
Other operations/other items/exploration (794) (1,236) 442 +36%
12,621 19,665 (7,044) -36%
Underlying earnings
Iron Ore 3,952 8,107 (4,155) -51%
Aluminium 1,118 1,248 (130) -10%
Copper & Coal 274 831 (557) -67%
Diamonds & Minerals 189 269 (80) -30%
Other operations/other items/exploration/interest (993) (1,150) 157 +14%
4,540 9,305 (4,765) -51%
1Underlying EBITDA excludes the same items that are excluded in arriving at underlying earnings. See page 44 for further detail and
a reconciliation to profit on ordinary activities before finance items and tax. 22014 numbers have been restated to reflect the new product group structure.
Page 5 of 45
Economy and commodities
Global economy The global macro-economic environment presented significant challenges to the mining industry in 2015. Growth in developed economies solidified last year, in particular in Europe, but the overall pace of growth remained moderate and insufficient to spur global trade. China continued to transition toward its ‘New-Normal’ but the overhang from the 2009 stimulus is weighing heavily on near-term growth. In turn, weak global trade and commodity prices created strong headwinds for emerging economies.
China’s GDP growth slowed moderately to just below seven per cent in 2015. Its equity market correction
added to short-term volatility and resulted in concerns of financial markets impacting commodity trading.
Consumption continued to support the economy but investment and exports were significant drags on
growth. In particular, the deterioration in China’s construction and industrial sectors has been negative for
commodity demand. Early signs of stabilisation in these sectors started to appear during the second half
of 2015, albeit from a weak base. Policy measures introduced by the Chinese government supported a
pick-up in housing sales but inventories remain elevated, delaying a commensurate increase in
construction activity. China’s high debt levels are expected to constrain the central government’s ability to
broaden its stimulus policies, limiting the scope for a meaningful investment boost in 2016.
In the US, the Federal Reserve raised its policy rates in December for the first time since the financial crisis. This was initially interpreted positively by financial markets as a sign that the US economy continued to strengthen. Consumers were the main engine of growth in 2015, benefitting from improvements in the labour market. However, the growth momentum was dampened by a manufacturing sector struggling with a stronger US dollar. In contrast, Europe benefited from a weaker Euro and, while growth remains modest, 2015 saw by far the most solid performance in the Eurozone since 2011. This allowed the Greek crisis, which unfolded throughout the year, to remain relatively well-contained.
Commodities This weaker Chinese demand led to a further deepening of the cyclical downturn in most commodity
markets in 2015. The iron ore price dipped below $40 per dry metric tonne (CFR) towards the end of the
year, representing an 80 per cent fall from the peak of the market in 2011. Given its exposure to property
and investment trends, domestic finished steel consumption in China fell by between four and five per
cent. China’s iron ore requirement proved more stable due to a combination of record steel exports and a
declining share in scrap use. Nevertheless, this was far from sufficient to absorb the growth in low-cost
seaborne supplies. Price pressures led to about 130 million tonnes in high-cost production cuts from
China and non-traditional seaborne suppliers, in addition to the 125 million tonnes of exits in 2014.
Prices for several other commodities, such as aluminium, thermal and metallurgical coals, are at levels
preceding the China boom or only seen briefly in the depth of the Global Financial Crisis. In each of these
cases, strong Chinese supply and slow curtailments have exacerbated global market imbalances. As a
result, prices are cutting deep into global cost curves, despite significant reductions in costs, weaker
currencies and lower energy input prices. Revenues for aluminium producers also suffered from a rapid
fall in regional market premia during 2015.
Bauxite and copper have not experienced prices cutting as deeply into their respective global cost curves,
although downward pressures have gradually been building. Malaysian supplies have replaced Indonesia
as the main source of bauxite imports into China, resulting in stockpiles built up ahead of the Indonesian
ban not being drawn down as expected. Nevertheless, with further additions of alumina refining capacity
in China’s coastal province of Shandong, demand for imported bauxite remained strong.
In the copper market, a combination of mine disruptions, mine shutdowns and project deferrals
dampened the ramp-up in new supply. Reported copper inventories drifted down through the second half
of 2015 and remained at levels representative of a balanced market. This was not sufficient to stop a
gradual erosion in price, with expectations of continued supply growth from expansions reaching their
commissioning phase late in the year.
The absorption of excess titanium dioxide pigment and feedstocks inventories has been a long-drawn
process since 2012. This continued into 2015 with producers of high-grade feedstocks curtailing more
capacity.
Page 6 of 45
Conclusions The slowdown in emerging markets limited global growth to around 3 per cent in 2015. The impact on
commodity demand was much stronger, led by a further deterioration in key metals-intensive sectors in
China. In response, high-cost marginal supply is seen exiting across most markets. This is a slow
process. Without a turnaround in demand it is difficult to see these supply withdrawals having strong
positive price impacts in the short term.
The macro-economic consensus points to a moderate improvement in global growth in 2016, but volatility
in financial and oil markets is a strong sign that macroeconomic risks abound, with geopolitical concerns
also not far in the background. Longer term, demand prospects remain positive and we expect this will
support a recovery from the current cyclical low phase.
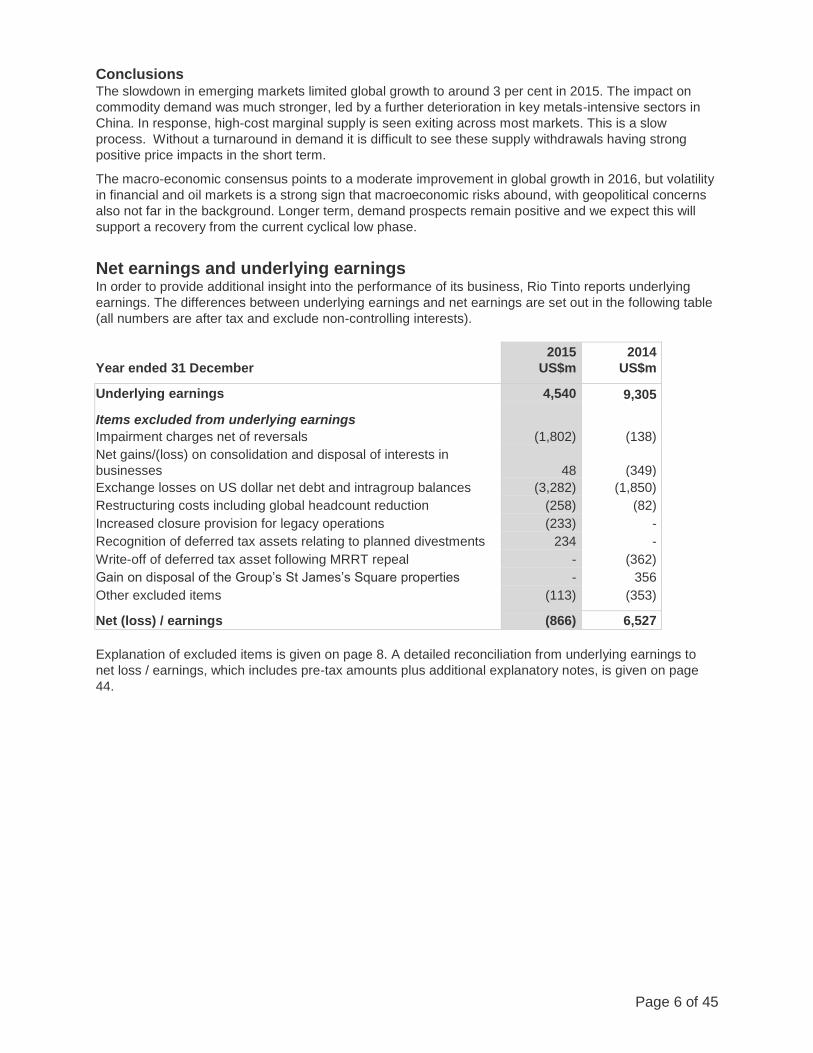
Net earnings and underlying earnings In order to provide additional insight into the performance of its business, Rio Tinto reports underlying
earnings. The differences between underlying earnings and net earnings are set out in the following table
(all numbers are after tax and exclude non-controlling interests).
Year ended 31 December
2015
US$m
2014
US$m
Underlying earnings 4,540 9,305
Items excluded from underlying earnings
Impairment charges net of reversals (1,802) (138)
Net gains/(loss) on consolidation and disposal of interests in
businesses
48
(349)
Exchange losses on US dollar net debt and intragroup balances (3,282) (1,850)
Restructuring costs including global headcount reduction (258) (82)
Increased closure provision for legacy operations (233) -
Recognition of deferred tax assets relating to planned divestments 234 -
Write-off of deferred tax asset following MRRT repeal - (362)
Gain on disposal of the Group’s St James’s Square properties - 356
Other excluded items (113) (353)
Net (loss) / earnings (866) 6,527
Explanation of excluded items is given on page 8. A detailed reconciliation from underlying earnings to
net loss / earnings, which includes pre-tax amounts plus additional explanatory notes, is given on page
44.
Page 7 of 45
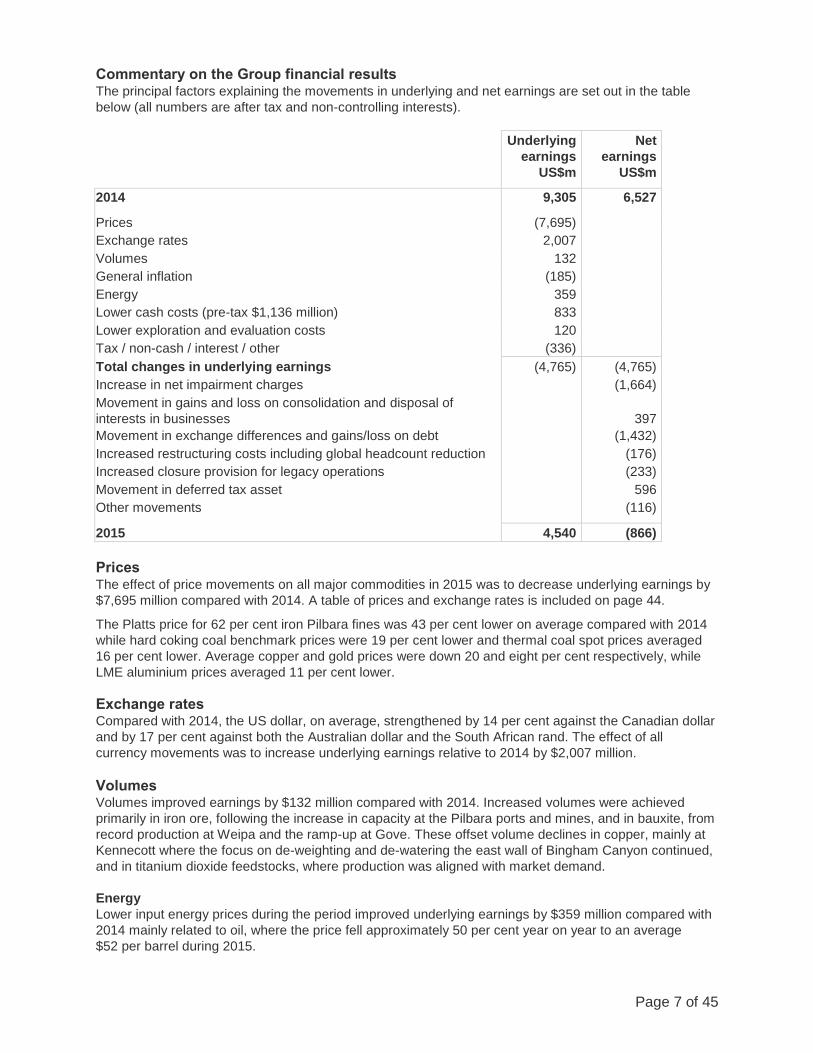
Commentary on the Group financial results The principal factors explaining the movements in underlying and net earnings are set out in the table
below (all numbers are after tax and non-controlling interests).
Underlying
earnings
US$m
Net
earnings
US$m
2014 9,305 6,527
Prices (7,695)
Exchange rates 2,007
Volumes 132
General inflation (185)
Energy 359
Lower cash costs (pre-tax $1,136 million) 833
Lower exploration and evaluation costs 120
Tax / non-cash / interest / other (336)
Total changes in underlying earnings (4,765) (4,765)
Increase in net impairment charges (1,664)
Movement in gains and loss on consolidation and disposal of
interests in businesses
397
Movement in exchange differences and gains/loss on debt (1,432)
Increased restructuring costs including global headcount reduction (176)
Increased closure provision for legacy operations (233)
Movement in deferred tax asset 596
Other movements (116)
2015 4,540 (866)
Prices The effect of price movements on all major commodities in 2015 was to decrease underlying earnings by
$7,695 million compared with 2014. A table of prices and exchange rates is included on page 44.
The Platts price for 62 per cent iron Pilbara fines was 43 per cent lower on average compared with 2014
while hard coking coal benchmark prices were 19 per cent lower and thermal coal spot prices averaged
16 per cent lower. Average copper and gold prices were down 20 and eight per cent respectively, while
LME aluminium prices averaged 11 per cent lower.
Exchange rates Compared with 2014, the US dollar, on average, strengthened by 14 per cent against the Canadian dollar
and by 17 per cent against both the Australian dollar and the South African rand. The effect of all
currency movements was to increase underlying earnings relative to 2014 by $2,007 million.
Volumes Volumes improved earnings by $132 million compared with 2014. Increased volumes were achieved
primarily in iron ore, following the increase in capacity at the Pilbara ports and mines, and in bauxite, from
record production at Weipa and the ramp-up at Gove. These offset volume declines in copper, mainly at
Kennecott where the focus on de-weighting and de-watering the east wall of Bingham Canyon continued,
and in titanium dioxide feedstocks, where production was aligned with market demand.
Energy
Lower input energy prices during the period improved underlying earnings by $359 million compared with
2014 mainly related to oil, where the price fell approximately 50 per cent year on year to an average
$52 per barrel during 2015.
Page 8 of 45
Cash costs, exploration and evaluation Rio Tinto made further strong progress on its cost reduction programme and has now achieved
$6.2 billion pre-tax ($4.3 billion post-tax) in total operating cash cost improvements and reductions in
exploration and evaluation expenditure compared with the 2012 base.
In 2015, the Group realised $1.3 billion pre-tax ($1.0 billion post tax) in operating cash cost savings and
reductions in exploration and evaluation expenditure. This was in addition to the $4.8 billion
pre-tax ($3.3 billion post-tax) achieved in 2013 and 2014.
The Group continued to refine its exploration and evaluation expenditure, building on the savings
achieved in 2014 whilst progressing the highest priority projects. In 2015, approximately six per cent of
this expenditure was incurred by Iron Ore, two per cent by Aluminium, 38 per cent by Copper & Coal,
23 per cent by Diamonds & Minerals and the remainder by central exploration on greenfield programmes.
Tax / non-cash / interest / other The 2015 effective corporate income tax rate on underlying earnings, excluding equity accounted units,
was 27 per cent compared with 28 per cent in 2014. The decreased rate was attributable to the absence
of the Australian Minerals Resource Rent Tax (MRRT) which was repealed in the second half of 2014.
The Group expects an underlying effective tax rate of approximately 27 to 30 per cent in 2016.
The Group interest charge (net of tax) of $389 million increased by $228 million compared with 2014,
following completion of some major capital projects in the first half of 2015. Interest is capitalised during
the construction period. In 2015, $254 million of interest was capitalised, compared with $470 million in
2014.
Items excluded from underlying earnings Total impairment charges of $1,802 million (post-tax) were recognised in 2015. The Simandou project
partners are currently finalising an integrated Bankable Feasibility Study (BFS) for the mine, port and
infrastructure elements of the project, which is scheduled to be submitted to the Government of Guinea in
May 2016. Given the uncertainties associated with funding the infrastructure, coupled with the volatility of
the current and near-term outlook for commodity prices, the Group has undertaken a review of the
carrying value of the asset and determined a non-cash impairment charge of $1,118 million (net of non-
controlling interests and tax). Rio Tinto is finalising the integrated BFS and will maintain a dialogue with
potential infrastructure investors, in order to preserve the potential of this world-class ore body.
On 11 June 2015, Rio Tinto announced that it supported ERA’s decision not to progress any further study
or development of Ranger 3 Deeps, due to the project’s economic challenges and, as indicated at the
time of the announcement, has recognised a non-cash impairment of $262 million (net of non-controlling
interests and tax) relating to its shareholding in ERA.
In late 2015, Rio Tinto completed an Order of Magnitude study on the Roughrider uranium project in
Canada. This led to the Group recognising a post-tax impairment charge of $199 million relating to
goodwill and intangible assets.
A post-tax charge of $233 million has been recognised for the remediation of legacy properties, including
the Holden mine in Washington State.
During 2015, the Group incurred $258 million (post-tax) of restructuring costs associated with its ongoing
costs reduction programme.
Non-cash exchange and derivative losses of $3,282 million (post-tax) arose primarily on US dollar debt in
non-US dollar functional currency Group companies, intragroup balances, and on the revaluation of
certain derivatives which do not qualify for hedge accounting. The exchange losses are largely offset by
currency translation gains recognised in equity and the quantum of US dollar debt, which will be repaid
from US dollar sales receipts and US dollar divestment proceeds, is therefore largely unaffected.
In 2014, net impairment charges of $138 million (post-tax) were recognised, including an $800 million
(post-tax) impairment of the Kitimat assets and a $1,049 million (post-tax) impairment reversal of some of
the Pacific Aluminium businesses.

Page 9 of 45
Other excluded items in 2014 included net losses on disposal of interests in businesses of $349 million
(post-tax), which mainly arose from the sale of the Group’s interests in Rio Tinto Coal Mozambique, and
the $362 million (post-tax) write-off of a net deferred tax asset, following the repeal of MRRT.
Cash flow Net cash generated from operating activities of $9.4 billion was 34 per cent lower than 2014, mainly
reflecting the impact of lower prices, partially offset by cash cost improvements, stable current working
capital movements and lower tax payments in line with lower profits. Operating cash flows more than
covered the $2.1 billion of sustaining capital expenditure and dividends of $4.1 billion, leaving $3.2 billion
which was invested in growth capital and partly funded the share buy-back programme.
Total working capital cash inflows of $1.5 billion in 2015 arose from continued efforts to reduce
inventories and receivables, which were partly offset by a reduction in payables, mostly from actions
taken to reduce capital and operating expenditures during the year. In balance sheet terms, working
capital decreased by $1.1 billion reflecting the impact of non-cash working capital and exchange rate
movements.
Purchases of property, plant and equipment and intangible assets declined by $3.5 billion or 43 per cent
to $4.7 billion in 2015. Major capital projects included the completion of the expansion of the Pilbara iron
ore infrastructure and the modernisation and expansion of the Kitimat aluminium smelter in British
Columbia, where first metal was poured in June 2015.
Dividends paid in 2015 of $4.1 billion reflected the increase in the final 2014 dividend paid in April 2015
and the 2015 interim dividend paid in September 2015. Share repurchases totalled $2.0 billion in 2015.
In 2014, net proceeds from the disposal of subsidiaries, joint ventures and associates of
$0.9 billion reflected the sale of the Group’s interests in the Clermont thermal coal mine, while proceeds
from the issue of equity to holders of non-controlling interests of $1.3 billion mainly related to the
Turquoise Hill Resources rights offering.
Balance sheet Net debt (see page 38) increased from $12.5 billion at 31 December 2014 to $13.8 billion at 31 December
2015, with free cash flow partly funding the $2.0 billion share buy-back. Net debt to total capital (gearing
ratio) was 24 per cent at 31 December 2015 (31 December 2014: 19 per cent) and interest cover was
seven times, down from 13 times coverage in 2014. Much of the increase in the gearing ratio was driven
by the $10.5 billion decline in shareholders’ equity from 31 December 2014 to 31 December 2015, mainly
attributable to weaker Australian and Canadian currencies along with the share buy-back and dividend
payments.
Adjusted total borrowings at 31 December 2015 were $23.1 billion. The weighted average cost of total
borrowings was approximately 3.5 per cent and the weighted average maturity was around eight years.
The maximum amount, within non-current borrowings, maturing in any one calendar year was $3.3 billion,
which matures in 2018. At 31 December 2015, approximately half of Rio Tinto’s total borrowings were at
fixed interest rates.
In 2015, the Group repaid $3.5 billion of borrowings. Cash and cash equivalents at 31 December 2015
were $9.4 billion (31 December 2014: $12.4 billion).
Loss for the year Net earnings and underlying earnings, which are the focus of the commentary in this report, refer to
amounts attributable to the owners of Rio Tinto. The net loss attributable to the owners of Rio Tinto in
2015 totalled $866 million (2014: profit of $6,527 million). The Group recorded a loss in 2015 of
$1,719 million (2014: profit of $6,499 million) of which a loss of $853 million (2014: loss of $28 million)
was attributable to non-controlling interests.
Page 10 of 45
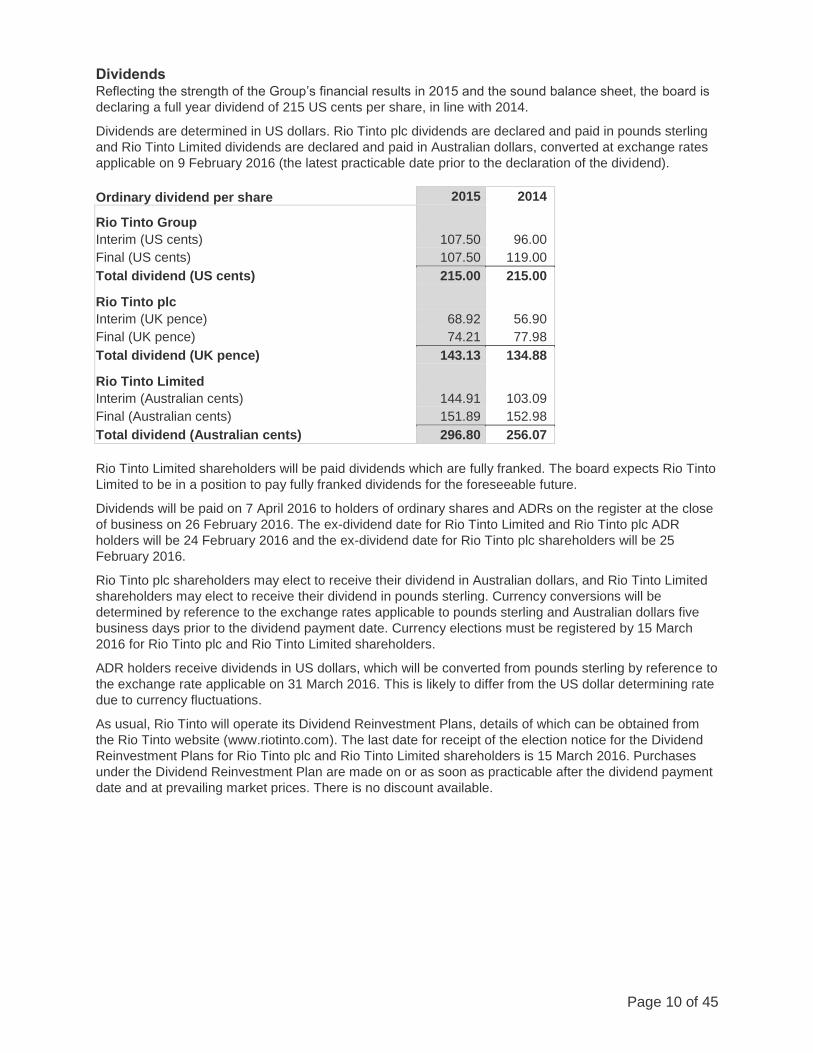
Dividends Reflecting the strength of the Group’s financial results in 2015 and the sound balance sheet, the board is
declaring a full year dividend of 215 US cents per share, in line with 2014.
Dividends are determined in US dollars. Rio Tinto plc dividends are declared and paid in pounds sterling
and Rio Tinto Limited dividends are declared and paid in Australian dollars, converted at exchange rates
applicable on 9 February 2016 (the latest practicable date prior to the declaration of the dividend).
Ordinary dividend per share 2015 2014
Rio Tinto Group
Interim (US cents) 107.50 96.00
Final (US cents) 107.50 119.00
Total dividend (US cents) 215.00 215.00
Rio Tinto plc
Interim (UK pence) 68.92 56.90
Final (UK pence) 74.21 77.98
Total dividend (UK pence) 143.13 134.88
Rio Tinto Limited
Interim (Australian cents) 144.91 103.09
Final (Australian cents) 151.89 152.98
Total dividend (Australian cents) 296.80 256.07
Rio Tinto Limited shareholders will be paid dividends which are fully franked. The board expects Rio Tinto
Limited to be in a position to pay fully franked dividends for the foreseeable future.
Dividends will be paid on 7 April 2016 to holders of ordinary shares and ADRs on the register at the close
of business on 26 February 2016. The ex-dividend date for Rio Tinto Limited and Rio Tinto plc ADR
holders will be 24 February 2016 and the ex-dividend date for Rio Tinto plc shareholders will be 25
February 2016.
Rio Tinto plc shareholders may elect to receive their dividend in Australian dollars, and Rio Tinto Limited
shareholders may elect to receive their dividend in pounds sterling. Currency conversions will be
determined by reference to the exchange rates applicable to pounds sterling and Australian dollars five
business days prior to the dividend payment date. Currency elections must be registered by 15 March
2016 for Rio Tinto plc and Rio Tinto Limited shareholders.
ADR holders receive dividends in US dollars, which will be converted from pounds sterling by reference to
the exchange rate applicable on 31 March 2016. This is likely to differ from the US dollar determining rate
due to currency fluctuations.
As usual, Rio Tinto will operate its Dividend Reinvestment Plans, details of which can be obtained from
the Rio Tinto website (www.riotinto.com). The last date for receipt of the election notice for the Dividend
Reinvestment Plans for Rio Tinto plc and Rio Tinto Limited shareholders is 15 March 2016. Purchases
under the Dividend Reinvestment Plan are made on or as soon as practicable after the dividend payment
date and at prevailing market prices. There is no discount available.
Page 11 of 45
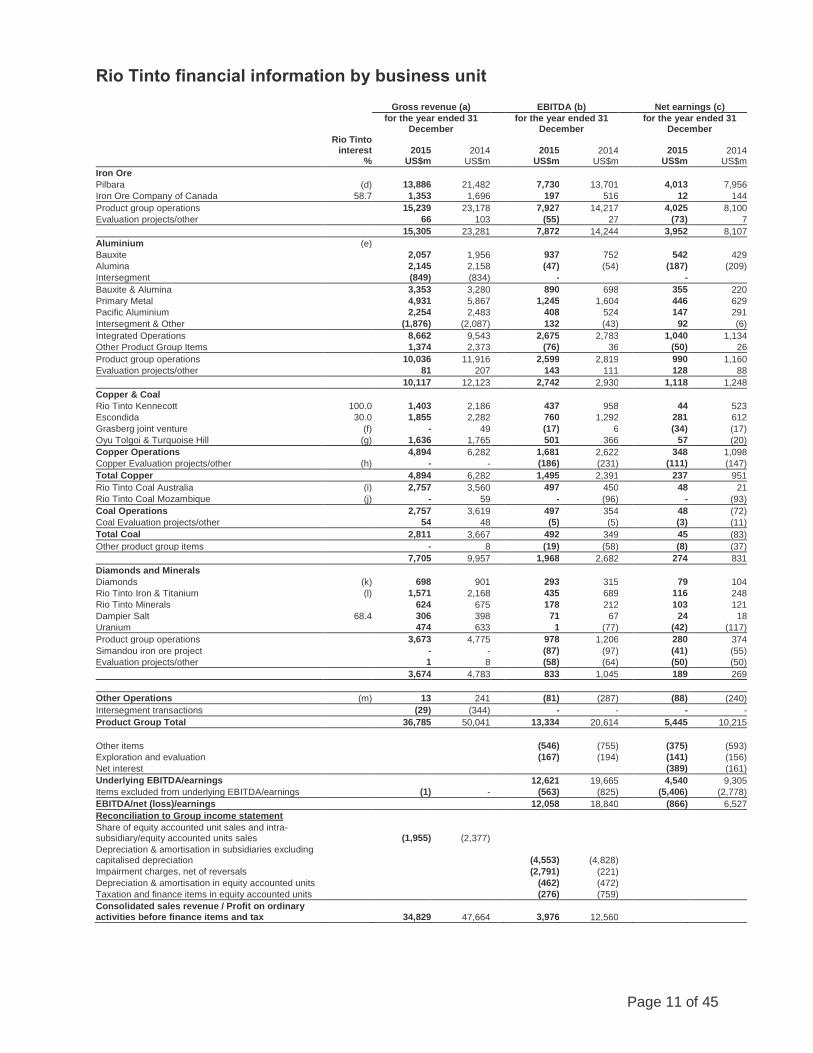
Rio Tinto financial information by business unit
Rio Tinto interest
%
Gross revenue (a) EBITDA (b) Net earnings (c)
for the year ended 31 December
for the year ended 31 December
for the year ended 31 December
2015 US$m
2014 US$m
2015
US$m
2014
US$m
2015
US$m
2014
US$m
Iron Ore
Pilbara (d) 13,886 21,482 7,730 13,701 4,013 7,956
Iron Ore Company of Canada 58.7 1,353 1,696 197 516 12 144
Product group operations 15,239 23,178 7,927 14,217 4,025 8,100
Evaluation projects/other 66 103 (55) 27 (73) 7
15,305 23,281 7,872 14,244 3,952 8,107
Aluminium (e)
Bauxite 2,057 1,956 937 752 542 429
Alumina 2,145 2,158 (47) (54) (187) (209)
Intersegment (849) (834) - -
Bauxite & Alumina 3,353 3,280 890 698 355 220
Primary Metal 4,931 5,867 1,245 1,604 446 629
Pacific Aluminium 2,254 2,483 408 524 147 291
Intersegment & Other (1,876) (2,087) 132 (43) 92 (6)
Integrated Operations 8,662 9,543 2,675 2,783 1,040 1,134
Other Product Group Items 1,374 2,373 (76) 36 (50) 26
Product group operations 10,036 11,916 2,599 2,819 990 1,160
Evaluation projects/other 81 207 143 111 128 88
10,117 12,123 2,742 2,930 1,118 1,248
Copper & Coal
Rio Tinto Kennecott 100.0 1,403 2,186 437 958 44 523
Escondida 30.0 1,855 2,282 760 1,292 281 612
Grasberg joint venture (f) - 49 (17) 6 (34) (17)
Oyu Tolgoi & Turquoise Hill (g) 1,636 1,765 501 366 57 (20)
Copper Operations 4,894 6,282 1,681 2,622 348 1,098
Copper Evaluation projects/other (h) - - (186) (231) (111) (147)
Total Copper 4,894 6,282 1,495 2,391 237 951
Rio Tinto Coal Australia (i) 2,757 3,560 497 450 48 21
Rio Tinto Coal Mozambique (j) - 59 - (96) - (93)
Coal Operations 2,757 3,619 497 354 48 (72)
Coal Evaluation projects/other 54 48 (5) (5) (3) (11)
Total Coal 2,811 3,667 492 349 45 (83)
Other product group items - 8 (19) (58) (8) (37)
7,705 9,957 1,968 2,682 274 831
Diamonds and Minerals
Diamonds (k) 698 901 293 315 79 104
Rio Tinto Iron & Titanium (l) 1,571 2,168 435 689 116 248
Rio Tinto Minerals 624 675 178 212 103 121
Dampier Salt 68.4 306 398 71 67 24 18
Uranium 474 633 1 (77) (42) (117)
Product group operations 3,673 4,775 978 1,206 280 374
Simandou iron ore project - - (87) (97) (41) (55)
Evaluation projects/other 1 8 (58) (64) (50) (50)
3,674 4,783 833 1,045 189 269
Other Operations (m) 13 241 (81) (287) (88) (240)
Intersegment transactions (29) (344) - - - -
Product Group Total 36,785 50,041 13,334 20,614 5,445 10,215
Other items (546) (755) (375) (593)
Exploration and evaluation (167) (194) (141) (156)
Net interest (389) (161)
Underlying EBITDA/earnings 12,621 19,665 4,540 9,305
Items excluded from underlying EBITDA/earnings (1) - (563) (825) (5,406) (2,778)
EBITDA/net (loss)/earnings 12,058 18,840 (866) 6,527
Reconciliation to Group income statement
Share of equity accounted unit sales and intra-subsidiary/equity accounted units sales (1,955) (2,377)
Depreciation & amortisation in subsidiaries excluding capitalised depreciation
(4,553) (4,828)
Impairment charges, net of reversals (2,791) (221)
Depreciation & amortisation in equity accounted units (462) (472)
Taxation and finance items in equity accounted units (276) (759)
Consolidated sales revenue / Profit on ordinary activities before finance items and tax
34,829 47,664
3,976 12,560
Page 12 of 45
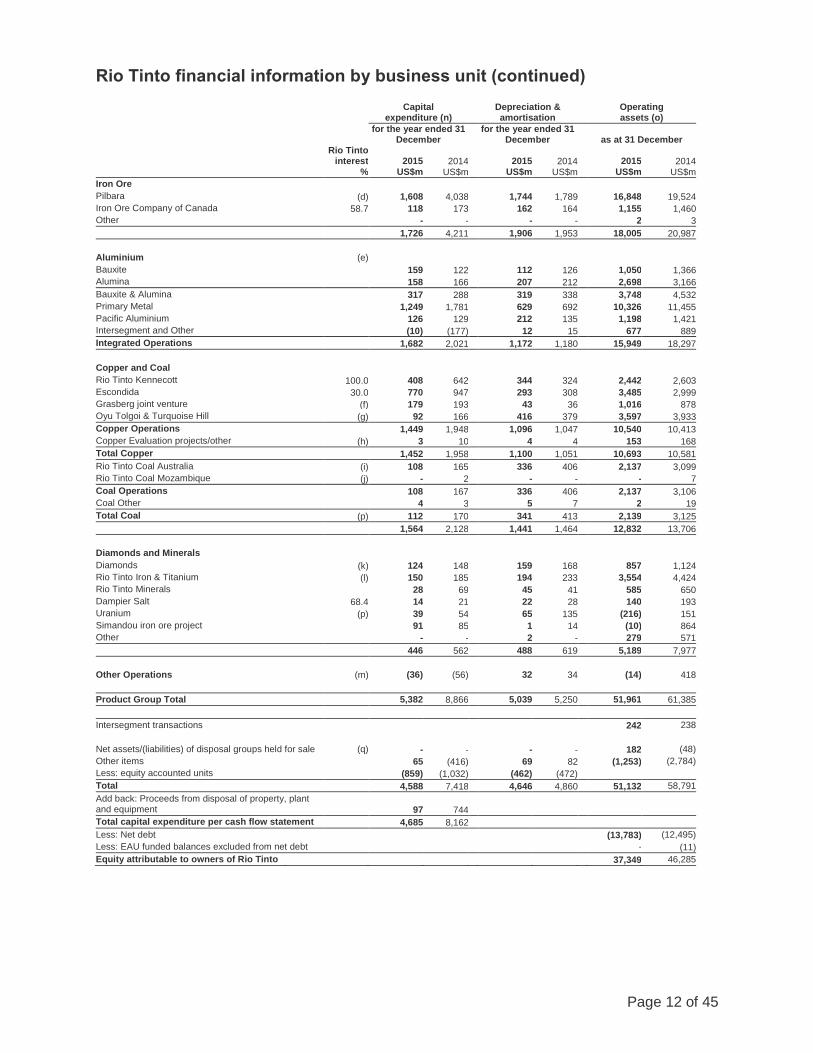
Rio Tinto financial information by business unit (continued)
Rio Tinto interest
%
Capital expenditure (n)
Depreciation & amortisation
Operating assets (o)
for the year ended 31 December
for the year ended 31 December as at 31 December
2015 US$m
2014
US$m
2015
US$m 2014
US$m
2015 US$m
2014
US$m
Iron Ore
Pilbara (d) 1,608 4,038 1,744 1,789 16,848 19,524
Iron Ore Company of Canada 58.7 118 173 162 164 1,155 1,460
Other - - - - 2 3
1,726 4,211 1,906 1,953 18,005 20,987
Aluminium (e)
Bauxite 159 122 112 126 1,050 1,366
Alumina 158 166 207 212 2,698 3,166
Bauxite & Alumina 317 288 319 338 3,748 4,532
Primary Metal 1,249 1,781 629 692 10,326 11,455
Pacific Aluminium 126 129 212 135 1,198 1,421
Intersegment and Other (10) (177) 12 15 677 889
Integrated Operations 1,682 2,021 1,172 1,180 15,949 18,297
Copper and Coal
Rio Tinto Kennecott 100.0 408 642 344 324 2,442 2,603
Escondida 30.0 770 947 293 308 3,485 2,999
Grasberg joint venture (f) 179 193 43 36 1,016 878
Oyu Tolgoi & Turquoise Hill (g) 92 166 416 379 3,597 3,933
Copper Operations 1,449 1,948 1,096 1,047 10,540 10,413
Copper Evaluation projects/other (h) 3 10 4 4 153 168
Total Copper 1,452 1,958 1,100 1,051 10,693 10,581
Rio Tinto Coal Australia (i) 108 165 336 406 2,137 3,099
Rio Tinto Coal Mozambique (j) - 2 - - - 7
Coal Operations 108 167 336 406 2,137 3,106
Coal Other 4 3 5 7 2 19
Total Coal (p) 112 170 341 413 2,139 3,125
1,564 2,128 1,441 1,464 12,832 13,706
Diamonds and Minerals
Diamonds (k) 124 148 159 168 857 1,124
Rio Tinto Iron & Titanium (l) 150 185 194 233 3,554 4,424
Rio Tinto Minerals 28 69 45 41 585 650
Dampier Salt 68.4 14 21 22 28 140 193
Uranium (p) 39 54 65 135 (216) 151
Simandou iron ore project 91 85 1 14 (10) 864
Other - - 2 - 279 571
446 562 488 619 5,189 7,977
Other Operations (m) (36) (56) 32 34 (14) 418
Product Group Total 5,382 8,866 5,039 5,250 51,961 61,385
Intersegment transactions 242 238
Net assets/(liabilities) of disposal groups held for sale (q) - - - - 182 (48)
Other items 65 (416) 69 82 (1,253) (2,784)
Less: equity accounted units (859) (1,032) (462) (472)
Total 4,588 7,418 4,646 4,860 51,132 58,791
Add back: Proceeds from disposal of property, plant and equipment 97 744
Total capital expenditure per cash flow statement 4,685 8,162
Less: Net debt (13,783) (12,495)
Less: EAU funded balances excluded from net debt - (11)
Equity attributable to owners of Rio Tinto 37,349 46,285
Page 13 of 45
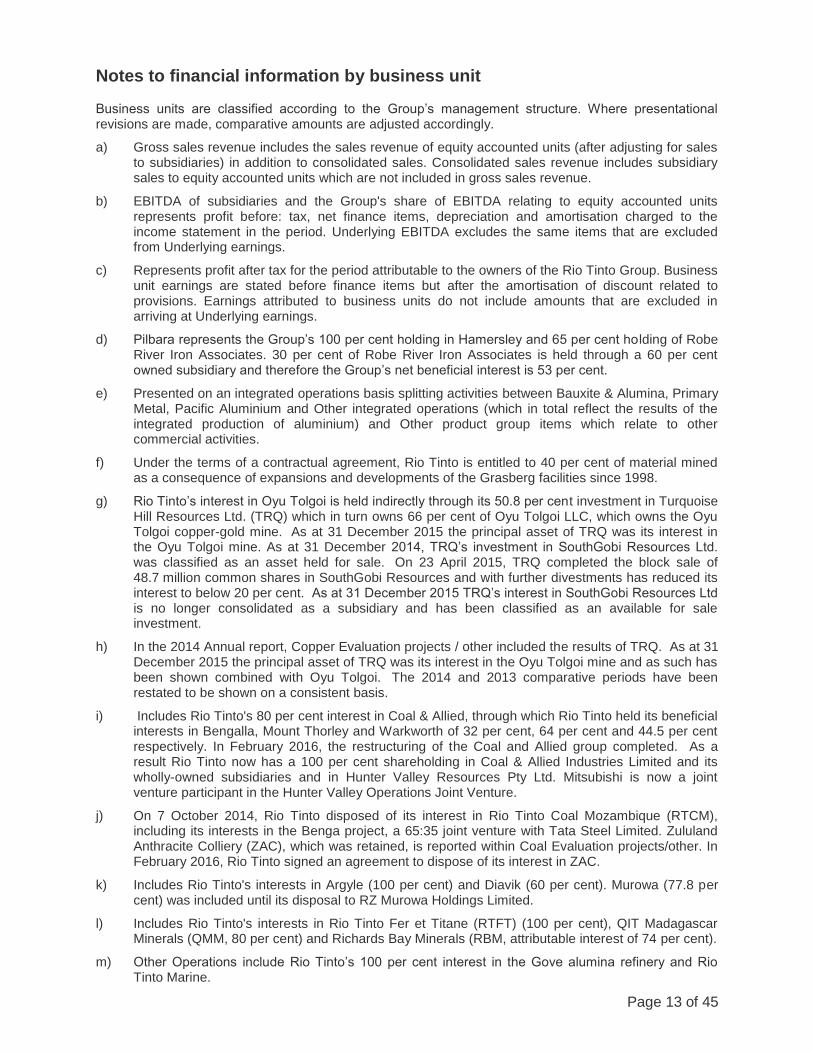
Notes to financial information by business unit Business units are classified according to the Group’s management structure. Where presentational revisions are made, comparative amounts are adjusted accordingly.
a) Gross sales revenue includes the sales revenue of equity accounted units (after adjusting for sales to subsidiaries) in addition to consolidated sales. Consolidated sales revenue includes subsidiary sales to equity accounted units which are not included in gross sales revenue.
b) EBITDA of subsidiaries and the Group's share of EBITDA relating to equity accounted units represents profit before: tax, net finance items, depreciation and amortisation charged to the income statement in the period. Underlying EBITDA excludes the same items that are excluded from Underlying earnings.
c) Represents profit after tax for the period attributable to the owners of the Rio Tinto Group. Business unit earnings are stated before finance items but after the amortisation of discount related to provisions. Earnings attributed to business units do not include amounts that are excluded in arriving at Underlying earnings.
d) Pilbara represents the Group’s 100 per cent holding in Hamersley and 65 per cent holding of Robe River Iron Associates. 30 per cent of Robe River Iron Associates is held through a 60 per cent owned subsidiary and therefore the Group’s net beneficial interest is 53 per cent.
e) Presented on an integrated operations basis splitting activities between Bauxite & Alumina, Primary Metal, Pacific Aluminium and Other integrated operations (which in total reflect the results of the integrated production of aluminium) and Other product group items which relate to other commercial activities.
f) Under the terms of a contractual agreement, Rio Tinto is entitled to 40 per cent of material mined as a consequence of expansions and developments of the Grasberg facilities since 1998.
g) Rio Tinto’s interest in Oyu Tolgoi is held indirectly through its 50.8 per cent investment in Turquoise Hill Resources Ltd. (TRQ) which in turn owns 66 per cent of Oyu Tolgoi LLC, which owns the Oyu Tolgoi copper-gold mine. As at 31 December 2015 the principal asset of TRQ was its interest in the Oyu Tolgoi mine. As at 31 December 2014, TRQ’s investment in SouthGobi Resources Ltd. was classified as an asset held for sale. On 23 April 2015, TRQ completed the block sale of 48.7 million common shares in SouthGobi Resources and with further divestments has reduced its interest to below 20 per cent. As at 31 December 2015 TRQ’s interest in SouthGobi Resources Ltd is no longer consolidated as a subsidiary and has been classified as an available for sale investment.
h) In the 2014 Annual report, Copper Evaluation projects / other included the results of TRQ. As at 31 December 2015 the principal asset of TRQ was its interest in the Oyu Tolgoi mine and as such has been shown combined with Oyu Tolgoi. The 2014 and 2013 comparative periods have been restated to be shown on a consistent basis.
i) Includes Rio Tinto's 80 per cent interest in Coal & Allied, through which Rio Tinto held its beneficial interests in Bengalla, Mount Thorley and Warkworth of 32 per cent, 64 per cent and 44.5 per cent respectively. In February 2016, the restructuring of the Coal and Allied group completed. As a result Rio Tinto now has a 100 per cent shareholding in Coal & Allied Industries Limited and its wholly-owned subsidiaries and in Hunter Valley Resources Pty Ltd. Mitsubishi is now a joint venture participant in the Hunter Valley Operations Joint Venture.
j) On 7 October 2014, Rio Tinto disposed of its interest in Rio Tinto Coal Mozambique (RTCM), including its interests in the Benga project, a 65:35 joint venture with Tata Steel Limited. Zululand Anthracite Colliery (ZAC), which was retained, is reported within Coal Evaluation projects/other. In February 2016, Rio Tinto signed an agreement to dispose of its interest in ZAC.
k) Includes Rio Tinto's interests in Argyle (100 per cent) and Diavik (60 per cent). Murowa (77.8 per cent) was included until its disposal to RZ Murowa Holdings Limited.
l) Includes Rio Tinto's interests in Rio Tinto Fer et Titane (RTFT) (100 per cent), QIT Madagascar Minerals (QMM, 80 per cent) and Richards Bay Minerals (RBM, attributable interest of 74 per cent).
m) Other Operations include Rio Tinto’s 100 per cent interest in the Gove alumina refinery and Rio Tinto Marine.
Page 14 of 45
Notes to financial information by business unit (continued)
n) Capital expenditure comprises the net cash outflow on purchases less disposals of property, plant
and equipment, capitalised evaluation costs and purchases less disposals of other intangible
assets. The details provided include 100 per cent of subsidiaries' capital expenditure and Rio
Tinto's share of the capital expenditure of joint operations and equity accounted units.
o) Operating assets of subsidiaries comprise net assets excluding post retirement assets and
liabilities, net of tax, and are before deducting net debt. Operating assets are stated after deduction
of non-controlling interests, which are calculated by reference to the net assets of the relevant
companies (i.e. inclusive of such companies' debt and amounts due to or from Rio Tinto Group
companies).
p) In 2015 the Energy product group as presented in previous periods was split with the coal assets
taken to the newly formed Copper and Coal product group and the uranium assets to the
Diamonds and Minerals product group.
q) Assets and liabilities held for sale at 31 December 2015 comprise Rio Tinto’s interests in the Blair
Athol coal project, Carbone Savoie, Bengalla, and Molybdenum Autoclave Process.
Assets and liabilities held for sale as at 31 December 2014 comprised Rio Tinto's interests in the
Blair Athol coal project and SouthGobi Resources Ltd.
Page 15 of 45
Review of operations
Iron Ore
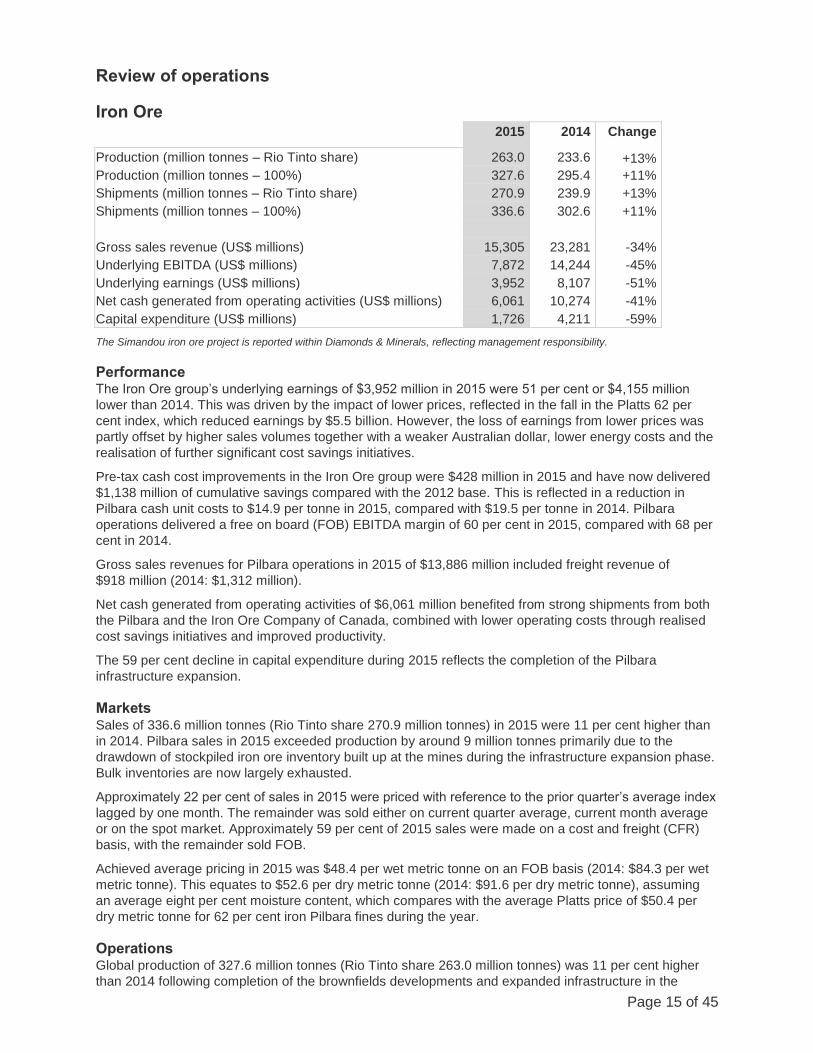
2015 2014 Change
Production (million tonnes – Rio Tinto share) 263.0 233.6 +13%
Production (million tonnes – 100%) 327.6 295.4 +11%
Shipments (million tonnes – Rio Tinto share) 270.9 239.9 +13%
Shipments (million tonnes – 100%) 336.6 302.6 +11%
Gross sales revenue (US$ millions) 15,305 23,281 -34%
Underlying EBITDA (US$ millions) 7,872 14,244 -45%
Underlying earnings (US$ millions) 3,952 8,107 -51%
Net cash generated from operating activities (US$ millions) 6,061 10,274 -41%
Capital expenditure (US$ millions) 1,726 4,211 -59%
The Simandou iron ore project is reported within Diamonds & Minerals, reflecting management responsibility.
Performance The Iron Ore group’s underlying earnings of $3,952 million in 2015 were 51 per cent or $4,155 million
lower than 2014. This was driven by the impact of lower prices, reflected in the fall in the Platts 62 per
cent index, which reduced earnings by $5.5 billion. However, the loss of earnings from lower prices was
partly offset by higher sales volumes together with a weaker Australian dollar, lower energy costs and the
realisation of further significant cost savings initiatives.
Pre-tax cash cost improvements in the Iron Ore group were $428 million in 2015 and have now delivered
$1,138 million of cumulative savings compared with the 2012 base. This is reflected in a reduction in
Pilbara cash unit costs to $14.9 per tonne in 2015, compared with $19.5 per tonne in 2014. Pilbara
operations delivered a free on board (FOB) EBITDA margin of 60 per cent in 2015, compared with 68 per
cent in 2014.
Gross sales revenues for Pilbara operations in 2015 of $13,886 million included freight revenue of
$918 million (2014: $1,312 million).
Net cash generated from operating activities of $6,061 million benefited from strong shipments from both
the Pilbara and the Iron Ore Company of Canada, combined with lower operating costs through realised
cost savings initiatives and improved productivity.
The 59 per cent decline in capital expenditure during 2015 reflects the completion of the Pilbara
infrastructure expansion.
Markets Sales of 336.6 million tonnes (Rio Tinto share 270.9 million tonnes) in 2015 were 11 per cent higher than
in 2014. Pilbara sales in 2015 exceeded production by around 9 million tonnes primarily due to the
drawdown of stockpiled iron ore inventory built up at the mines during the infrastructure expansion phase.
Bulk inventories are now largely exhausted.
Approximately 22 per cent of sales in 2015 were priced with reference to the prior quarter’s average index
lagged by one month. The remainder was sold either on current quarter average, current month average
or on the spot market. Approximately 59 per cent of 2015 sales were made on a cost and freight (CFR)
basis, with the remainder sold FOB.
Achieved average pricing in 2015 was $48.4 per wet metric tonne on an FOB basis (2014: $84.3 per wet
metric tonne). This equates to $52.6 per dry metric tonne (2014: $91.6 per dry metric tonne), assuming
an average eight per cent moisture content, which compares with the average Platts price of $50.4 per
dry metric tonne for 62 per cent iron Pilbara fines during the year.
Operations Global production of 327.6 million tonnes (Rio Tinto share 263.0 million tonnes) was 11 per cent higher
than 2014 following completion of the brownfields developments and expanded infrastructure in the
Page 16 of 45
Pilbara towards the end of the first half of 2015, as well as a significant positive shift in operational
performance at the Iron Ore Company of Canada due to a number of productivity improvements.
New projects and growth options Following completion of the Pilbara infrastructure and brownfields expansions in the first half of 2015, the
focus has shifted to the Nammuldi Incremental Tonnes (NIT) project which delivers high grade, low
phosphorous ore to the Pilbara Blend. The initial phase, with a five million tonne per annum capacity,
started production in the fourth quarter of 2015. Construction has commenced on the second phase,
which will take annual capacity from the NIT project up from five to ten million tonnes and is due to come
into production in the fourth quarter of 2016.
Testing and verification of AutoHaul® is continuing, with over 70,000 kilometres of mainline trials
completed by the end of 2015.
2016 shipments guidance Rio Tinto’s expected global shipments are around 350 million tonnes (100 per cent basis) from its
operations in Australia and Canada, subject to weather conditions.
Page 17 of 45
Aluminium
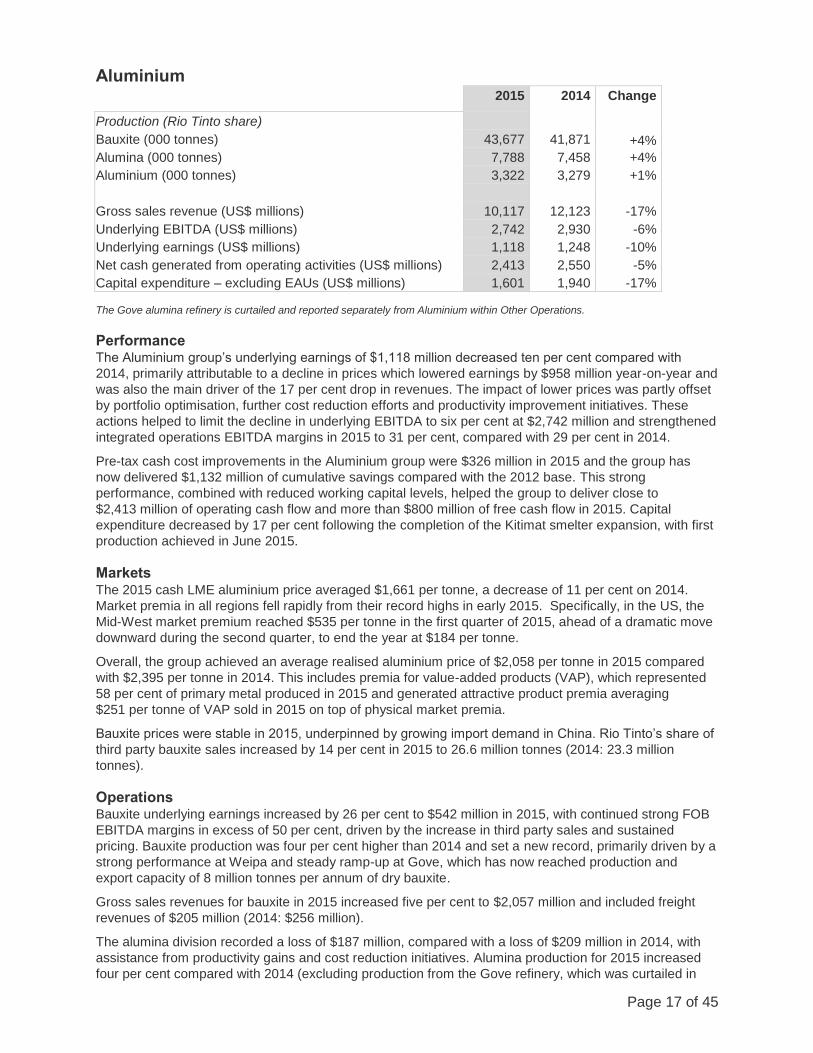
2015 2014 Change
Production (Rio Tinto share)
Bauxite (000 tonnes) 43,677 41,871 +4%
Alumina (000 tonnes) 7,788 7,458 +4%
Aluminium (000 tonnes) 3,322 3,279 +1%
Gross sales revenue (US$ millions) 10,117 12,123 -17%
Underlying EBITDA (US$ millions) 2,742 2,930 -6%
Underlying earnings (US$ millions) 1,118 1,248 -10%
Net cash generated from operating activities (US$ millions) 2,413 2,550 -5%
Capital expenditure – excluding EAUs (US$ millions) 1,601 1,940 -17%
The Gove alumina refinery is curtailed and reported separately from Aluminium within Other Operations.
Performance The Aluminium group’s underlying earnings of $1,118 million decreased ten per cent compared with
2014, primarily attributable to a decline in prices which lowered earnings by $958 million year-on-year and
was also the main driver of the 17 per cent drop in revenues. The impact of lower prices was partly offset
by portfolio optimisation, further cost reduction efforts and productivity improvement initiatives. These
actions helped to limit the decline in underlying EBITDA to six per cent at $2,742 million and strengthened
integrated operations EBITDA margins in 2015 to 31 per cent, compared with 29 per cent in 2014.
Pre-tax cash cost improvements in the Aluminium group were $326 million in 2015 and the group has
now delivered $1,132 million of cumulative savings compared with the 2012 base. This strong
performance, combined with reduced working capital levels, helped the group to deliver close to
$2,413 million of operating cash flow and more than $800 million of free cash flow in 2015. Capital
expenditure decreased by 17 per cent following the completion of the Kitimat smelter expansion, with first
production achieved in June 2015.
Markets The 2015 cash LME aluminium price averaged $1,661 per tonne, a decrease of 11 per cent on 2014.
Market premia in all regions fell rapidly from their record highs in early 2015. Specifically, in the US, the
Mid-West market premium reached $535 per tonne in the first quarter of 2015, ahead of a dramatic move
downward during the second quarter, to end the year at $184 per tonne.
Overall, the group achieved an average realised aluminium price of $2,058 per tonne in 2015 compared
with $2,395 per tonne in 2014. This includes premia for value-added products (VAP), which represented
58 per cent of primary metal produced in 2015 and generated attractive product premia averaging
$251 per tonne of VAP sold in 2015 on top of physical market premia.
Bauxite prices were stable in 2015, underpinned by growing import demand in China. Rio Tinto’s share of
third party bauxite sales increased by 14 per cent in 2015 to 26.6 million tonnes (2014: 23.3 million
tonnes).
Operations Bauxite underlying earnings increased by 26 per cent to $542 million in 2015, with continued strong FOB
EBITDA margins in excess of 50 per cent, driven by the increase in third party sales and sustained
pricing. Bauxite production was four per cent higher than 2014 and set a new record, primarily driven by a
strong performance at Weipa and steady ramp-up at Gove, which has now reached production and
export capacity of 8 million tonnes per annum of dry bauxite.
Gross sales revenues for bauxite in 2015 increased five per cent to $2,057 million and included freight
revenues of $205 million (2014: $256 million).
The alumina division recorded a loss of $187 million, compared with a loss of $209 million in 2014, with
assistance from productivity gains and cost reduction initiatives. Alumina production for 2015 increased
four per cent compared with 2014 (excluding production from the Gove refinery, which was curtailed in
Page 18 of 45
May 2014, and whose results are included within Other operations), reflecting continued consistent
performance across Rio Tinto’s refineries.
Primary Metal (Canada, Europe, Middle East) earnings declined by 29 per cent to $446 million, while
earnings from the Pacific Aluminium (Australia, New Zealand) smelters decreased by 49 per cent to
$147 million, driven by the negative movements in prices. All operations continued to realise significant
cost savings and benefited from favourable currency movements. Aluminium production was in line with
2014. Record annual production at nine smelters offset lower production from Kitimat as the modernised
and expanded smelter was commissioned.
New projects and growth options The expanded Kitimat smelter commenced production in June 2015. Its ramp-up towards nameplate
capacity of 420 thousand tonnes, which represents a 48 per cent increase over previous nameplate
capacity, is well underway and is expected to be achieved in early 2016. Once Kitimat is at full
production, it will sit comfortably in the first decile of the industry cost curve.
On 27 November 2015, the Group approved the $1.9 billion Amrun (South of Embley) bauxite mine and
associated processing and port facilities on the Cape York Peninsula in north Queensland. The planned
initial annual output of 22.8 million tonnes a year1 is expected to replace production from the depleting
East Weipa mine and increase annual bauxite exports from Cape York by around 10 million tonnes.
Production and shipping are expected to commence in the first half of 2019.
2016 production guidance Rio Tinto’s expected share of production of bauxite, alumina and aluminium is 45 million tonnes,
7.8 million tonnes and 3.6 million tonnes, respectively.
1This production target was disclosed in a release to the market on 27 November 2015. All material assumptions underpinning that
target continue to apply and have not materially changed.
Page 19 of 45
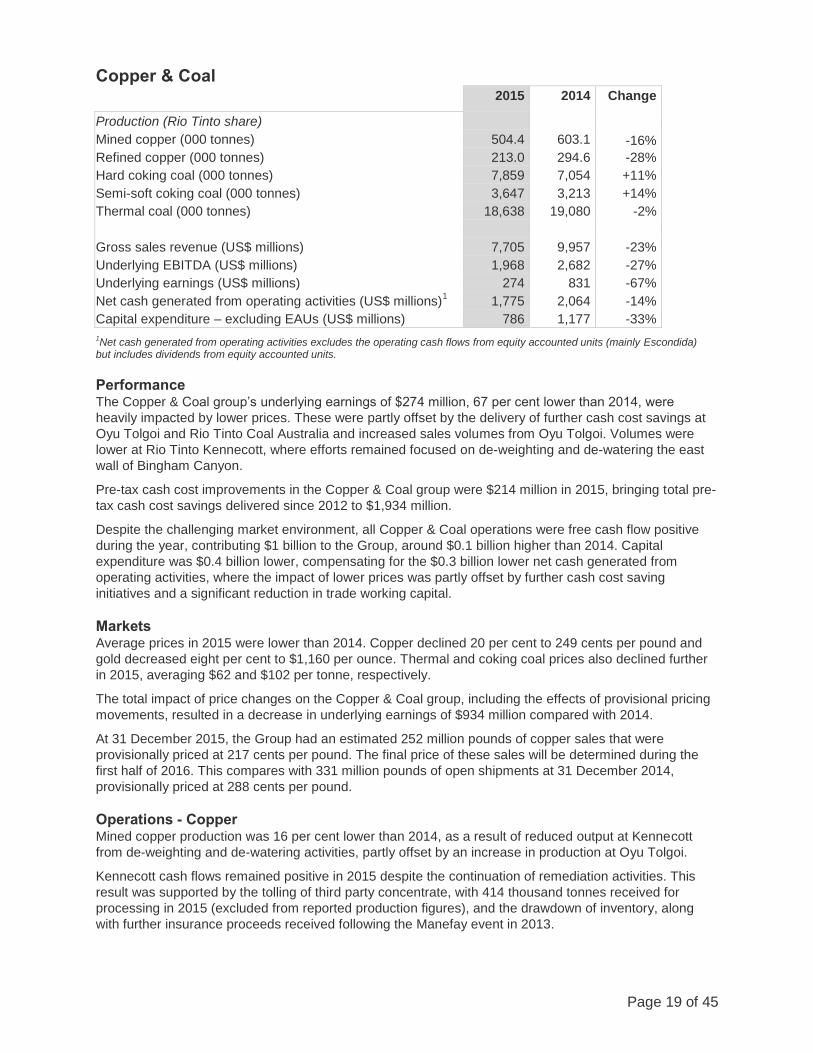
Copper & Coal
2015 2014 Change
Production (Rio Tinto share)
Mined copper (000 tonnes) 504.4 603.1 -16%
Refined copper (000 tonnes) 213.0 294.6 -28%
Hard coking coal (000 tonnes) 7,859 7,054 +11%
Semi-soft coking coal (000 tonnes) 3,647 3,213 +14%
Thermal coal (000 tonnes) 18,638 19,080 -2%
Gross sales revenue (US$ millions) 7,705 9,957 -23%
Underlying EBITDA (US$ millions) 1,968 2,682 -27%
Underlying earnings (US$ millions) 274 831 -67%
Net cash generated from operating activities (US$ millions)1 1,775 2,064 -14%
Capital expenditure – excluding EAUs (US$ millions) 786 1,177 -33%
1Net cash generated from operating activities excludes the operating cash flows from equity accounted units (mainly Escondida)
but includes dividends from equity accounted units.
Performance The Copper & Coal group’s underlying earnings of $274 million, 67 per cent lower than 2014, were
heavily impacted by lower prices. These were partly offset by the delivery of further cash cost savings at
Oyu Tolgoi and Rio Tinto Coal Australia and increased sales volumes from Oyu Tolgoi. Volumes were
lower at Rio Tinto Kennecott, where efforts remained focused on de-weighting and de-watering the east
wall of Bingham Canyon.
Pre-tax cash cost improvements in the Copper & Coal group were $214 million in 2015, bringing total pre-
tax cash cost savings delivered since 2012 to $1,934 million.
Despite the challenging market environment, all Copper & Coal operations were free cash flow positive
during the year, contributing $1 billion to the Group, around $0.1 billion higher than 2014. Capital
expenditure was $0.4 billion lower, compensating for the $0.3 billion lower net cash generated from
operating activities, where the impact of lower prices was partly offset by further cash cost saving
initiatives and a significant reduction in trade working capital.
Markets Average prices in 2015 were lower than 2014. Copper declined 20 per cent to 249 cents per pound and
gold decreased eight per cent to $1,160 per ounce. Thermal and coking coal prices also declined further
in 2015, averaging $62 and $102 per tonne, respectively.
The total impact of price changes on the Copper & Coal group, including the effects of provisional pricing
movements, resulted in a decrease in underlying earnings of $934 million compared with 2014.
At 31 December 2015, the Group had an estimated 252 million pounds of copper sales that were
provisionally priced at 217 cents per pound. The final price of these sales will be determined during the
first half of 2016. This compares with 331 million pounds of open shipments at 31 December 2014,
provisionally priced at 288 cents per pound.
Operations - Copper Mined copper production was 16 per cent lower than 2014, as a result of reduced output at Kennecott
from de-weighting and de-watering activities, partly offset by an increase in production at Oyu Tolgoi.
Kennecott cash flows remained positive in 2015 despite the continuation of remediation activities. This
result was supported by the tolling of third party concentrate, with 414 thousand tonnes received for
processing in 2015 (excluded from reported production figures), and the drawdown of inventory, along
with further insurance proceeds received following the Manefay event in 2013.
Page 20 of 45
Mined copper production at Escondida in 2015 was comparable to 2014, as higher throughput and
recoveries from leaching offset lower grades.
At Oyu Tolgoi, mined copper production for 2015 was 36 per cent higher than 2014, attributable to higher
grades and throughput, with the mine operating at record levels. These additional volumes, along with
cash cost reductions, improved cost efficiencies and a reduction in trade working capital, resulted in Oyu
Tolgoi contributing over half a billion dollars of free cash flow during the year.
Operations – Coal Hard coking coal production was 11 per cent higher than 2014 following improved production rates at
Kestrel. Semi-soft coking coal production was 14 per cent higher than 2014 reflecting mine production
sequencing at Hunter Valley Operations. Thermal coal production was broadly in line with 2014. Despite
lower prices, the Coal operations’ contribution to free cash flow in 2015 was higher than in 2014, with
further cost savings delivered and monetisation of working capital. All operations were free cash flow
positive in 2015.
On 30 September 2015, Rio Tinto reached a binding agreement for the sale of its interest in the Bengalla Joint Venture to New Hope Corporation Limited for $606 million. The sale is expected to close in the first quarter of 2016.
On 27 January 2016, Rio Tinto announced that it had reached a binding agreement for the sale of its
Mount Pleasant thermal coal assets to MACH Energy Australia Pty Ltd for $224 million plus royalties. The
sale is subject to certain conditions precedent being met and is expected to close in the second quarter of
2016.
New projects and growth options On 18 May 2015, the Government of Mongolia, Turquoise Hill Resources and Rio Tinto signed the
Underground Mine Development and Financing Plan, which addressed outstanding shareholder matters
and provided a pathway to restart underground development at Oyu Tolgoi.
On 14 December 2015, the development of the Oyu Tolgoi underground mine took an important step
forward with the signing of a US$4.4 billion project financing agreement. Next steps include securing all
necessary permits for development of the underground mine, and consideration of approval of the project
by the various boards.
At Escondida, the new 152 thousand tonne per day Organic Growth Project 1 (OGP1) concentrator
achieved mechanical completion in the first half of 2015. The ramp-up of OGP1 progresses ahead of plan
and is expected to reach full capacity during 2016.
2016 production guidance In 2016, Rio Tinto expects its share of mined copper production to increase to between 575 and 625
thousand tonnes, with higher production at Kennecott, and including an expected share of joint venture
production at Grasberg. Refined copper production is expected to be between 220 and 250 thousand
tonnes.
For coal, Rio Tinto’s share of production is expected to be 7 to 8 million tonnes of hard coking coal,
3.3 to 3.9 million tonnes of semi-soft coking coal and 16 to 17 million tonnes of thermal coal. Thermal coal
guidance includes a contribution from Bengalla up to the expected date of divestment during the first
quarter of 2016.
Page 21 of 45
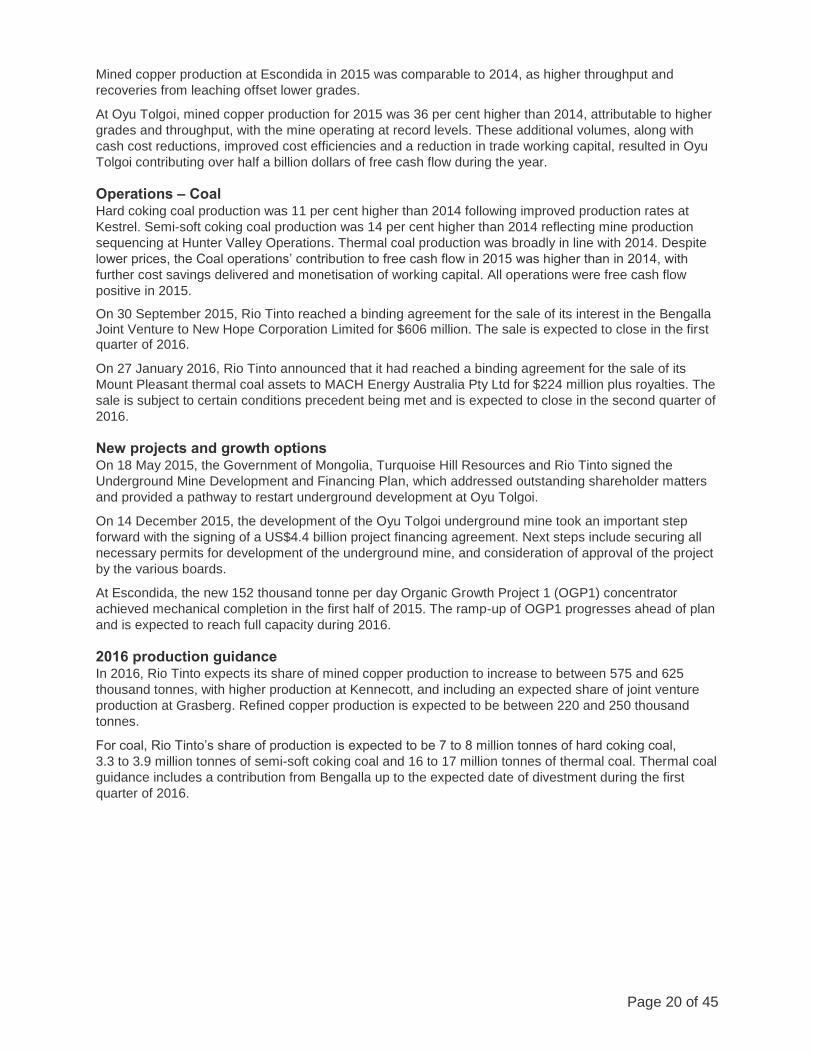
Diamonds & Minerals
2015 2014 Change
Production (Rio Tinto share)
Titanium dioxide (000 tonnes) 1,089 1,443 -25%
Borates (000 tonnes) 476 508 -6%
Diamonds (000 carats) 17,392 13,872 +25%
Salt (000 tonnes) 5,539 6,793 -18%
Uranium (000 lbs) 4,907 4,089 +20%
Gross sales revenue (US$ millions) 3,674 4,783 -23%
Underlying EBITDA (US$ millions) 833 1,045 -20%
Underlying earnings (US$ millions) 189 269 -30%
Underlying earnings pre-Simandou (US$ millions) 230 324 -29%
Net cash generated from operating activities (US$ millions) 1,010 1,184 -15%
Capital expenditure (US$ millions) 446 562 -21%
The Simandou iron ore project is reported within Diamonds & Minerals, reflecting management responsibility.
Performance The Diamonds & Minerals group’s underlying earnings of $189 million were 30 per cent lower than 2014,
primarily driven by lower prices and a reduction in sales volumes. Weaker exchange rates boosted
earnings by $266 million, which offset lower pricing across most products. Sales volumes were driven
lower by softer markets, most notably in titanium dioxide feedstocks. The Group aligned production
accordingly with market demand. This in turn impacted cash cost savings, which are calculated on a unit
cash cost of production. In absolute terms, 2015 cash operating costs were $832 million lower than 2014
following further cost reduction initiatives during the year. The year-on-year cash operating cost variance
included a $342 million benefit from exchange rate movements.
Net cash generated from operating activities of $1,010 million was 15 per cent lower than 2014 due to
lower prices and sales volumes, partly mitigated by further reductions in working capital.
Capital expenditure declined by $116 million, or 21 per cent, to $446 million, following the completion of
the modified direct dissolving of kernite (MDDK) process plant at Boron in 2014 and lower expenditure on
the Argyle underground project, together with continued capital discipline across the product group.
Markets Titanium dioxide feedstock demand remained weak throughout 2015 and prices remained under pressure as the industry continued to absorb inventories. The market for zircon remained stable.
Demand for borates has been stable globally, with increased demand in Asia offset by reduced demand
in Europe.
Industry rough diamond prices were weaker, driven by lower demand from India and China, higher rough
and polished diamond inventory, and lower trade manufacturing margins.
The uranium market continues to suffer from high inventory levels throughout the supply chain, keeping
uranium prices under pressure during the year.
Operations Titanium dioxide slag production was 25 per cent lower in 2015 as Rio Tinto Iron & Titanium continues to
optimise production in light of weaker demand. Two of nine furnaces at Rio Tinto Fer et Titane and one of
four furnaces at Richards Bay Minerals (RBM) are currently idled, reflecting lower demand for high grade
feedstocks.
Borates production in 2015 was six per cent lower than in 2014, driven primarily by lower market demand.
Page 22 of 45
Diamonds production increased 25 per cent year-on-year, with higher volumes at Argyle from the
continued ramp-up of production from the underground mine offsetting lower carats recovered at Diavik,
attributable to processing plant pauses in the fourth quarter and the absence of stockpiled ore which was
processed in the first half of 2014.
In June 2015, Rio Tinto completed the sale of its interest in the Murowa diamond mine in Zimbabwe.
Salt production in 2015 was 18 per cent lower than in 2014 as a result of weaker demand.
Uranium production was 20 per cent higher than 2014, with lower grades and recoveries at Rössing more
than offset by a full year of production at ERA in 2015 compared with a complete shutdown of processing
facilities in the first half of 2014 following the failure of a leach tank in December 2013.
New projects and growth options Work continues on the feasibility study for the Zulti South development at RBM, which is expected to
maintain the low cost RBM smelter capacity once completed.
The Jadar project in Serbia is a potentially world-class lithium-borate deposit discovered by Rio Tinto in
2004. Findings so far are encouraging and pre-feasibility assessments are ongoing to confirm the
economic business case.
On 11 June 2015, Rio Tinto announced that it supported ERA’s decision not to progress any further study
or development of Ranger 3 Deeps, due to the project’s economic challenges and, as indicated at the
time of the announcement, has recognised a non-cash impairment of $262 million (net of non-controlling
interests and tax) relating to its shareholding in ERA.
In late 2015, Rio Tinto completed an Order of Magnitude study on the Roughrider uranium project in
Canada. This led to the Group recognising a post-tax impairment charge of $199 million relating to
goodwill and exploration and evaluation intangible assets.
The development of the A21 kimberlite pipe at Diavik is advancing as planned and will provide an
important source of incremental production to maintain current volume levels up to the end of mine life.
A21 is estimated to cost US$350 million (Rio Tinto share US$210 million), with first production expected
in 2018.
On 26 May 2014, Rio Tinto and its Simandou project partners signed an Investment Framework with the
Government of Guinea which provided the legal and commercial foundation for the project and formally
separated the infrastructure and mine development plan. The Simandou project partners are currently
finalising an integrated Bankable Feasibility Study (BFS) for the mine, port and infrastructure elements of
the project, which is scheduled to be submitted to the Government of Guinea in May 2016. Given the
uncertainties associated with funding the infrastructure, coupled with the volatility of the current and near-
term outlook for commodity prices, the Group has undertaken a review of the carrying value of the asset
and determined a non-cash impairment charge of $1,118 million (net of non-controlling interests and tax).
Rio Tinto is finalising the integrated BFS and will maintain a dialogue with potential infrastructure
investors, in order to preserve the potential of this world class ore body.
2016 production guidance Rio Tinto’s expected share of titanium dioxide slag, boric oxide equivalent production, uranium and
diamond production in 2016 is one million tonnes, 0.5 million tonnes, five to six million pounds and
21 million carats, respectively.
Page 23 of 45
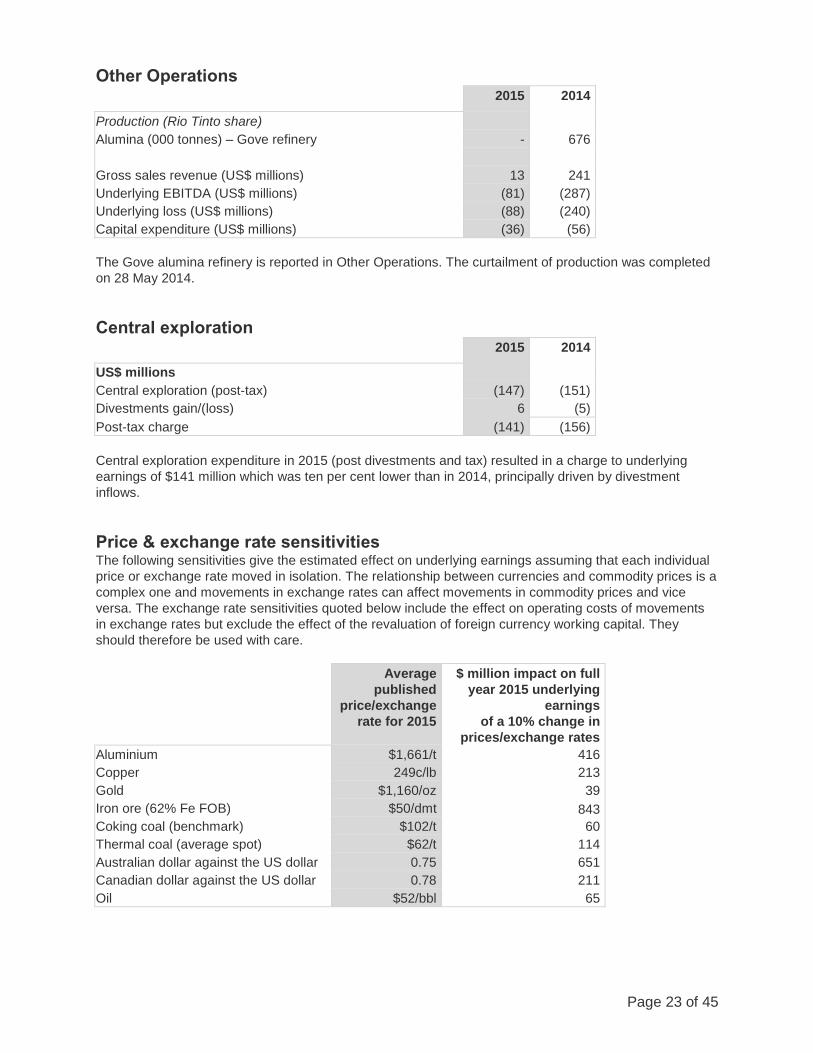
Other Operations
2015 2014
Production (Rio Tinto share)
Alumina (000 tonnes) – Gove refinery - 676
Gross sales revenue (US$ millions) 13 241
Underlying EBITDA (US$ millions) (81) (287)
Underlying loss (US$ millions) (88) (240)
Capital expenditure (US$ millions) (36) (56)
The Gove alumina refinery is reported in Other Operations. The curtailment of production was completed
on 28 May 2014.
Central exploration
2015 2014
US$ millions
Central exploration (post-tax) (147) (151)
Divestments gain/(loss) 6 (5)
Post-tax charge (141) (156)
Central exploration expenditure in 2015 (post divestments and tax) resulted in a charge to underlying
earnings of $141 million which was ten per cent lower than in 2014, principally driven by divestment
inflows.
Price & exchange rate sensitivities The following sensitivities give the estimated effect on underlying earnings assuming that each individual
price or exchange rate moved in isolation. The relationship between currencies and commodity prices is a
complex one and movements in exchange rates can affect movements in commodity prices and vice
versa. The exchange rate sensitivities quoted below include the effect on operating costs of movements
in exchange rates but exclude the effect of the revaluation of foreign currency working capital. They
should therefore be used with care.
Average
published
price/exchange
rate for 2015
$ million impact on full
year 2015 underlying
earnings
of a 10% change in
prices/exchange rates
Aluminium $1,661/t 416
Copper 249c/lb 213
Gold $1,160/oz 39
Iron ore (62% Fe FOB) $50/dmt 843
Coking coal (benchmark) $102/t 60
Thermal coal (average spot) $62/t 114
Australian dollar against the US dollar 0.75 651
Canadian dollar against the US dollar 0.78 211
Oil $52/bbl 65
Page 24 of 45
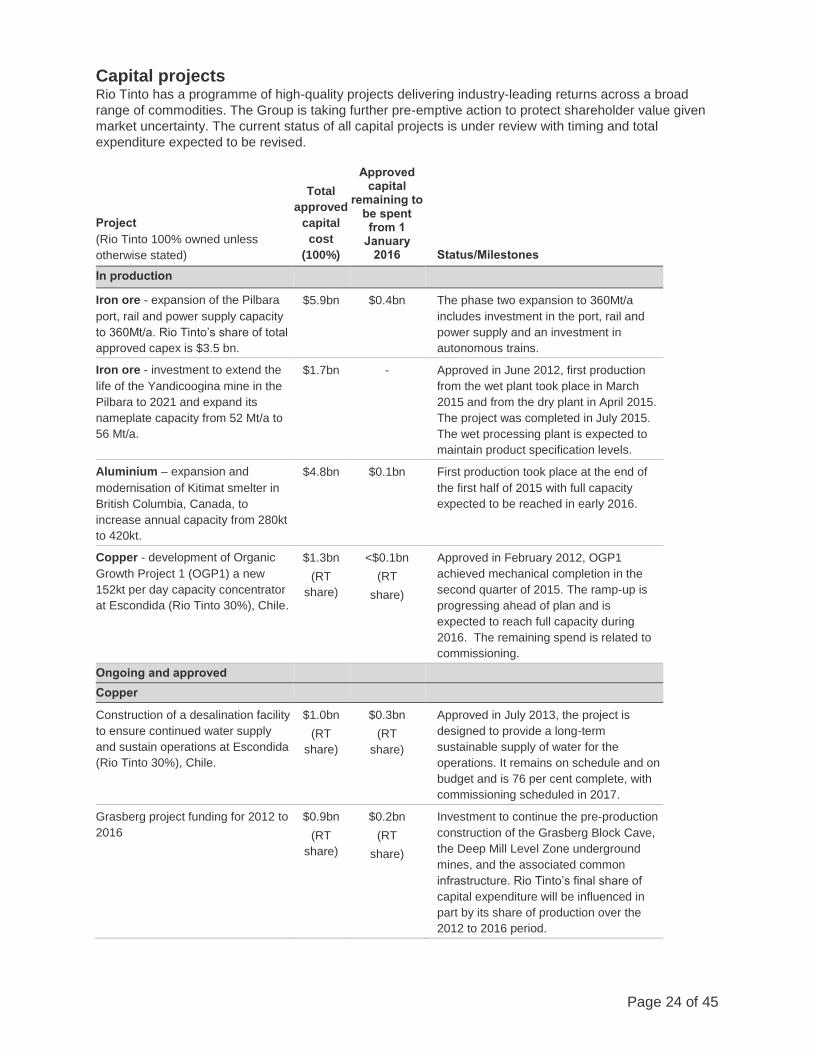
Capital projects Rio Tinto has a programme of high-quality projects delivering industry-leading returns across a broad
range of commodities. The Group is taking further pre-emptive action to protect shareholder value given
market uncertainty. The current status of all capital projects is under review with timing and total
expenditure expected to be revised.
Project
(Rio Tinto 100% owned unless
otherwise stated)
Total
approved
capital
cost
(100%)
Approved capital
remaining to be spent from 1
January 2016 Status/Milestones
In production
Iron ore - expansion of the Pilbara
port, rail and power supply capacity
to 360Mt/a. Rio Tinto’s share of total
approved capex is $3.5 bn.
$5.9bn $0.4bn The phase two expansion to 360Mt/a
includes investment in the port, rail and
power supply and an investment in
autonomous trains.
Iron ore - investment to extend the
life of the Yandicoogina mine in the
Pilbara to 2021 and expand its
nameplate capacity from 52 Mt/a to
56 Mt/a.
$1.7bn - Approved in June 2012, first production
from the wet plant took place in March
2015 and from the dry plant in April 2015.
The project was completed in July 2015.
The wet processing plant is expected to
maintain product specification levels.
Aluminium – expansion and
modernisation of Kitimat smelter in
British Columbia, Canada, to
increase annual capacity from 280kt
to 420kt.
$4.8bn $0.1bn First production took place at the end of
the first half of 2015 with full capacity
expected to be reached in early 2016.
Copper - development of Organic
Growth Project 1 (OGP1) a new
152kt per day capacity concentrator
at Escondida (Rio Tinto 30%), Chile.
$1.3bn
(RT
share)
<$0.1bn
(RT
share)
Approved in February 2012, OGP1
achieved mechanical completion in the
second quarter of 2015. The ramp-up is
progressing ahead of plan and is
expected to reach full capacity during
2016. The remaining spend is related to
commissioning.
Ongoing and approved
Copper
Construction of a desalination facility
to ensure continued water supply
and sustain operations at Escondida
(Rio Tinto 30%), Chile.
$1.0bn
(RT
share)
$0.3bn
(RT
share)
Approved in July 2013, the project is
designed to provide a long-term
sustainable supply of water for the
operations. It remains on schedule and on
budget and is 76 per cent complete, with
commissioning scheduled in 2017.
Grasberg project funding for 2012 to
2016
$0.9bn
(RT
share)
$0.2bn
(RT
share)
Investment to continue the pre-production
construction of the Grasberg Block Cave,
the Deep Mill Level Zone underground
mines, and the associated common
infrastructure. Rio Tinto’s final share of
capital expenditure will be influenced in
part by its share of production over the
2012 to 2016 period.
Page 25 of 45
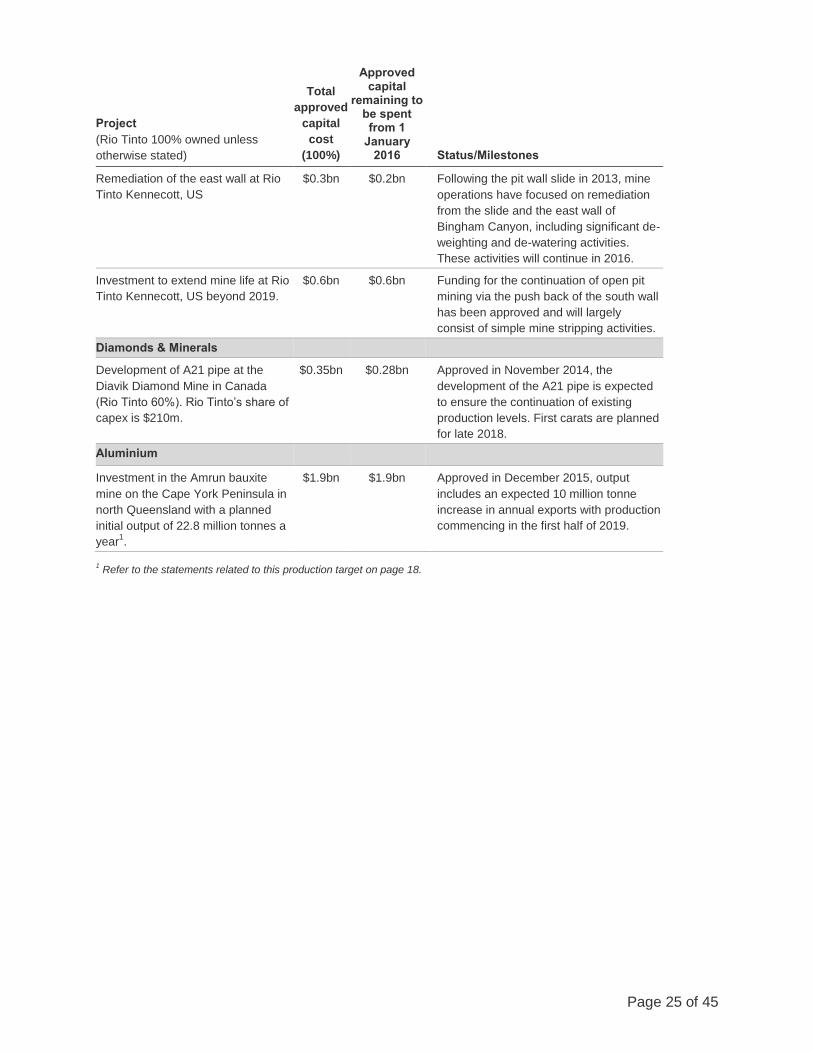
Project
(Rio Tinto 100% owned unless
otherwise stated)
Total
approved
capital
cost
(100%)
Approved capital
remaining to be spent from 1
January 2016 Status/Milestones
Remediation of the east wall at Rio
Tinto Kennecott, US
$0.3bn $0.2bn Following the pit wall slide in 2013, mine
operations have focused on remediation
from the slide and the east wall of
Bingham Canyon, including significant de-
weighting and de-watering activities.
These activities will continue in 2016.
Investment to extend mine life at Rio
Tinto Kennecott, US beyond 2019.
$0.6bn $0.6bn Funding for the continuation of open pit
mining via the push back of the south wall
has been approved and will largely
consist of simple mine stripping activities.
Diamonds & Minerals
Development of A21 pipe at the
Diavik Diamond Mine in Canada
(Rio Tinto 60%). Rio Tinto’s share of
capex is $210m.
$0.35bn
$0.28bn Approved in November 2014, the
development of the A21 pipe is expected
to ensure the continuation of existing
production levels. First carats are planned
for late 2018.
Aluminium
Investment in the Amrun bauxite
mine on the Cape York Peninsula in
north Queensland with a planned
initial output of 22.8 million tonnes a
year1.
$1.9bn $1.9bn Approved in December 2015, output
includes an expected 10 million tonne
increase in annual exports with production
commencing in the first half of 2019.
1 Refer to the statements related to this production target on page 18.

Page 26 of 45
About Rio Tinto Rio Tinto is a leading international mining group headquartered in the UK, combining Rio Tinto plc, a
London and New York Stock Exchange listed company, and Rio Tinto Limited, which is listed on the
Australian Securities Exchange.
Rio Tinto's business is finding, mining, and processing mineral resources. Major products are aluminium,
copper, diamonds, gold, industrial minerals (borates, titanium dioxide and salt), iron ore, thermal and
metallurgical coal and uranium. Activities span the world and are strongly represented in Australia and
North America, with significant businesses in Asia, Europe, Africa and South America.
Forward-looking statements This announcement includes "forward-looking statements" within the meaning of the Private Securities
Litigation Reform Act of 1995. All statements other than statements of historical facts included in this
announcement, including, without limitation, those regarding Rio Tinto’s financial position, business
strategy, plans and objectives of management for future operations (including development plans and
objectives relating to Rio Tinto’s products, production forecasts and reserve and resource positions), are
forward-looking statements. The words “intend”, “aim”, “project”, “anticipate”, “estimate”, “plan”, “believes”,
“expects”, “may”, “should”, “will”, “target”, “set to” or similar expressions, commonly identify such forward-
looking statements.
Such forward-looking statements involve known and unknown risks, uncertainties and other factors which
may cause the actual results, performance or achievements of Rio Tinto, or industry results, to be
materially different from any future results, performance or achievements expressed or implied by such
forward-looking statements. Such forward-looking statements are based on numerous assumptions
regarding Rio Tinto’s present and future business strategies and the environment in which Rio Tinto will
operate in the future. Among the important factors that could cause Rio Tinto’s actual results,
performance or achievements to differ materially from those in the forward-looking statements are levels
of actual production during any period, levels of demand and market prices, the ability to produce and
transport products profitably, the impact of foreign currency exchange rates on market prices and
operating costs, operational problems, political uncertainty and economic conditions in relevant areas of
the world, the actions of competitors, activities by governmental authorities such as changes in taxation or
regulation and such other risk factors identified in Rio Tinto's most recent Annual Report and Accounts in
Australia and the United Kingdom and the most recent Annual Report on Form 20-F filed with the United
States Securities and Exchange Commission (the "SEC") or Form 6-Ks furnished to, or filed with, the
SEC. Forward-looking statements should, therefore, be construed in light of such risk factors and undue
reliance should not be placed on forward-looking statements. These forward-looking statements speak
only as of the date of this announcement. Rio Tinto expressly disclaims any obligation or undertaking
(except as required by applicable law, the UK Listing Rules, the Disclosure and Transparency Rules of
the Financial Conduct Authority and the Listing Rules of the Australian Securities Exchange) to release
publicly any updates or revisions to any forward-looking statement contained herein to reflect any change
in Rio Tinto’s expectations with regard thereto or any change in events, conditions or circumstances on
which any such statement is based.
Nothing in this announcement should be interpreted to mean that future earnings per share of Rio Tinto
plc or Rio Tinto Limited will necessarily match or exceed its historical published earnings per share.
Page 27 of 45
Contacts
www.riotinto.com
Follow @riotinto on Twitter
Media Relations, EMEA/Americas
Illtud Harri
T +44 20 7781 1152
M +44 7920 503 600
David Outhwaite
T +44 20 7781 1623
M +44 7787 597 493
David Luff
T + 44 20 7781 1177
M + 44 7780 226 422
Investor Relations, EMEA/Americas
John Smelt
T +44 20 7781 1654
M +44 7879 642 675
David Ovington
T +44 20 7781 2051
M +44 7920 010 978
Grant Donald
T +44 20 7781 1262
M +44 7920 587 805
Media Relations, Australia/Asia
Ben Mitchell
T +61 3 9283 3620
M +61 419 850 212
Bruce Tobin
T +61 3 9283 3612
M +61 419 103 454
Matt Klar
T + 61 7 3625 4244
M + 61 457 525 578
Investor Relations, Australia/Asia
Natalie Worley
T +61 3 9283 3063
M +61 409 210 462
Rachel Storrs
T +61 3 9283 3628
M +61 417 401 018
Rio Tinto plc
6 St James’s Square
London SW1Y 4AD
United Kingdom
T +44 20 7781 2000
Registered in England
No. 719885
Rio Tinto Limited
120 Collins Street
Melbourne 3000
Australia
T +61 3 9283 3333
Registered in Australia
ABN 96 004 458 404
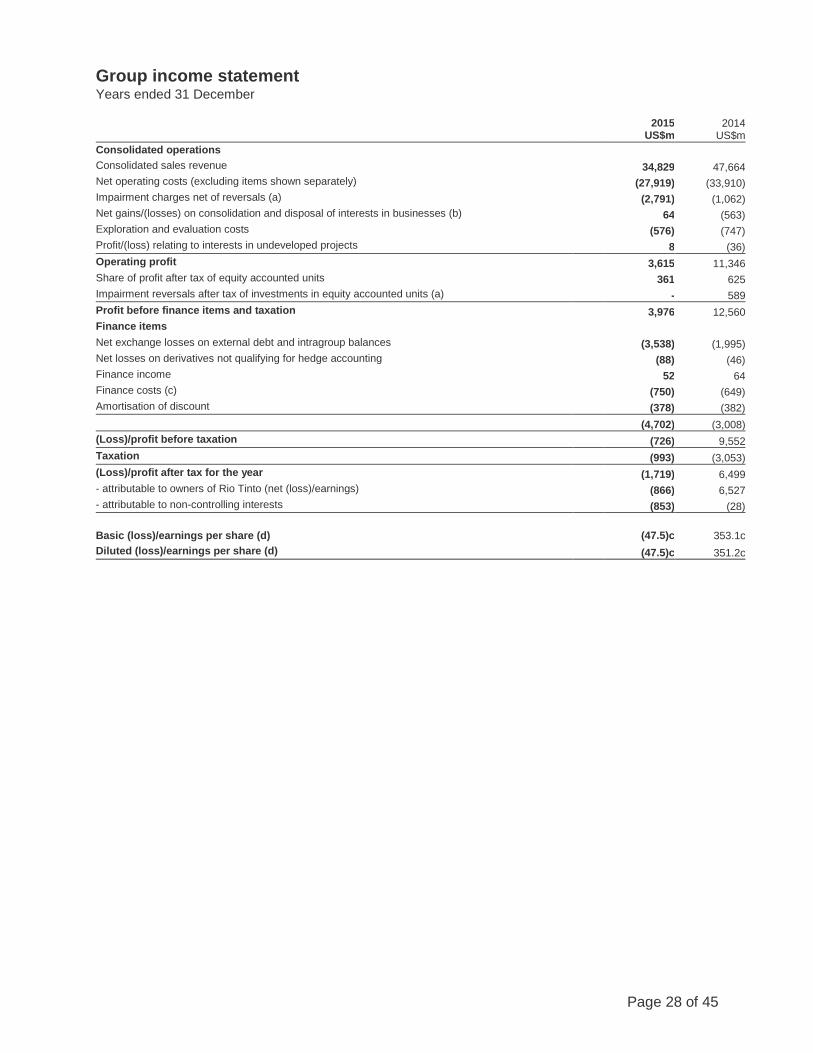
Page 28 of 45
Group income statement Years ended 31 December
2015
US$m 2014
US$m
Consolidated operations
Consolidated sales revenue 34,829 47,664
Net operating costs (excluding items shown separately) (27,919) (33,910)
Impairment charges net of reversals (a) (2,791) (1,062)
Net gains/(losses) on consolidation and disposal of interests in businesses (b) 64 (563)
Exploration and evaluation costs (576) (747)
Profit/(loss) relating to interests in undeveloped projects 8 (36)
Operating profit 3,615 11,346
Share of profit after tax of equity accounted units 361 625
Impairment reversals after tax of investments in equity accounted units (a) - 589
Profit before finance items and taxation 3,976 12,560
Finance items
Net exchange losses on external debt and intragroup balances (3,538) (1,995)
Net losses on derivatives not qualifying for hedge accounting (88) (46)
Finance income 52 64
Finance costs (c) (750) (649)
Amortisation of discount (378) (382)
(4,702) (3,008)
(Loss)/profit before taxation (726) 9,552
Taxation (993) (3,053)
(Loss)/profit after tax for the year (1,719) 6,499
- attributable to owners of Rio Tinto (net (loss)/earnings) (866) 6,527
- attributable to non-controlling interests (853) (28)
Basic (loss)/earnings per share (d) (47.5)c 353.1c
Diluted (loss)/earnings per share (d) (47.5)c 351.2c
Page 29 of 45
Status of financial information
This preliminary announcement does not constitute the Group's full financial statements for 2015. This
report is based on accounts which are in the process of being audited and will be approved by the Board
and subsequently filed with the Registrar of Companies in the United Kingdom and the Australian
Securities and Investments Commission. Accordingly, the financial information for 2015 is unaudited and
is not statutory accounts within the meaning of Section 434 of the United Kingdom Companies Act 2006.
Financial information for the year to 31 December 2014 has been extracted from the full financial
statements for that year prepared under the historical cost convention, as modified by the revaluation of
certain derivative contracts and financial assets, the impact of fair value hedge accounting on the hedged
items and the accounting for post retirement assets and obligations, as filed with the Registrar of
Companies.
The Auditors' report on the full financial statements for the year to 31 December 2014 was unqualified
and did not contain a statement under section 498 (2) (regarding adequacy of accounting records and
returns), or under section 498 (3) (regarding provision of necessary information and explanations) of the
United Kingdom Companies Act 2006.
Page 30 of 45
Notes to the Group income statement (a) The carrying value of the Simandou project in Guinea has been affected by the current market
conditions and uncertainty over infrastructure ownership and funding. As a result, the Group has decided that it would be appropriate to record a pre-tax impairment charge of US$1,655 million to exploration and evaluation intangible assets and a pre-tax impairment charge of US$194 million to property, plant and equipment to fully write-down the long-term assets of the project and a charge of US$7 million in relation to inventories. A further pre-tax charge of US$183 million has been recognised as a financial liability for contractual arrangements made in relation to the development of the project. The Group will expense the cost of further studies as incurred.
During the year, the carrying value of Energy Resources of Australia Ltd (ERA) was impaired, following a Rio Tinto Board decision to support ERA’s decision not to progress any future study or development of Ranger 3 Deeps. The cash inflows from processing low grade stockpile ore are not expected to be sufficient to meet the cost of rehabilitation and therefore the property, plant and equipment and intangible assets of ERA have been fully impaired, resulting in a US$260 million pre-tax charge.
The Roughrider uranium project completed an Order of Magnitude study in late 2015 which provided an updated view of the development concept and geological model. The cash-generating unit is tested annually for impairment as it contains goodwill. The impairment test resulted in a pre-tax impairment charge of US$116 million to fully write off goodwill and a pre-tax impairment charge of US$113 million to exploration and evaluation intangible assets, which were capitalised as a result of the Hathor Exploration acquisition in 2012.
Other impairment charges during the year reflect challenging economic conditions at business units in the Group’s Aluminium and Copper and Coal product groups.
In 2014 the Group incurred a pre-tax impairment charge (net of reversals) of US$1,062 million related to an impairment charge in relation to Molybdenum Autoclave Process in the Group’s Copper and Coal product group (US$559 million) and impairment charge net of reversals of US$503 million related to certain Aluminium product group assets.
Rio Tinto also recorded a post-tax impairment reversal of investments in equity accounted units of US$589 million in its Aluminium product group.
(b) Net gains on disposal and consolidation of interests in businesses in 2015 related mainly to the reduction in shareholding of SouthGobi Resources Ltd during 2015, the sale of the Group’s interest in Murowa Diamonds and Sengwa Colliery on 17 June 2015 and the Aluminium product group divestments of ECL on 9 July 2015 and Alesa on 24 November 2015. Refer to ‘Acquisitions and disposals’ on page 41.
Net losses on disposal and consolidation of interests in businesses during 2014 related mainly to the disposal of the Clermont Joint Venture on 29 May 2014 and of Rio Tinto Coal Mozambique on 7 October 2014.
(c) Finance costs in the income statement are net of amounts capitalised of US$254 million (2014: US$470 million).
(d) For the purposes of calculating basic earnings per share, the weighted average number of Rio Tinto plc and Rio Tinto Limited shares outstanding during the year was 1,824.7 million (2014: 1,848.4 million), being the weighted average number of Rio Tinto plc shares outstanding of 1,398.1 million (2014: 1,413.0 million) and the weighted average number of Rio Tinto Limited shares of 426.6 million (2014: 435.4 million). In 2015, no Rio Tinto Limited shares were held by Rio Tinto plc (2014: nil). The profit and loss figures used in the calculation of basic and diluted earnings per share are based on the profits and losses for the year attributable to owners of Rio Tinto.
For the purposes of calculating diluted earnings per share, the effect of dilutive securities is added to the weighted average number of shares. This effect is calculated using the treasury stock method. The effect of dilutive securities has not been taken into account when calculating diluted loss per share for the year ended 31 December 2015.
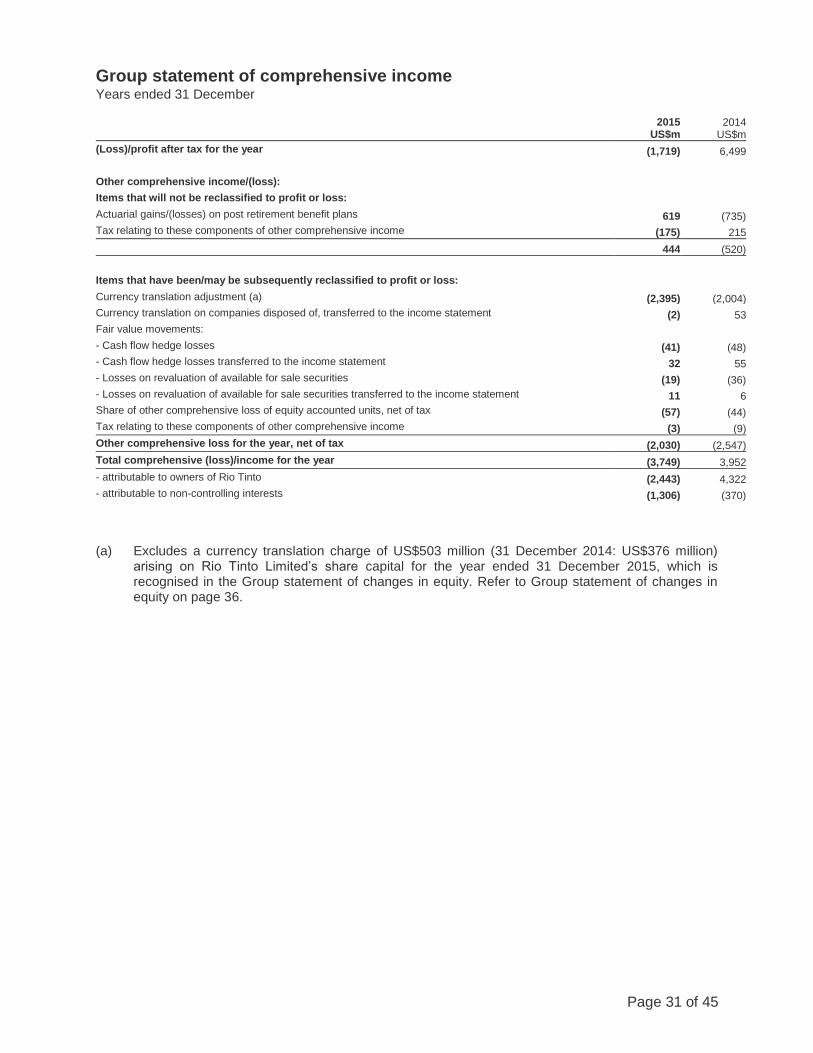
Page 31 of 45
Group statement of comprehensive income Years ended 31 December
2015
US$m 2014
US$m
(Loss)/profit after tax for the year (1,719) 6,499
Other comprehensive income/(loss):
Items that will not be reclassified to profit or loss:
Actuarial gains/(losses) on post retirement benefit plans 619 (735)
Tax relating to these components of other comprehensive income (175) 215
444 (520)
Items that have been/may be subsequently reclassified to profit or loss:
Currency translation adjustment (a) (2,395) (2,004)
Currency translation on companies disposed of, transferred to the income statement (2) 53
Fair value movements:
- Cash flow hedge losses (41) (48)
- Cash flow hedge losses transferred to the income statement 32 55
- Losses on revaluation of available for sale securities (19) (36)
- Losses on revaluation of available for sale securities transferred to the income statement 11 6
Share of other comprehensive loss of equity accounted units, net of tax (57) (44)
Tax relating to these components of other comprehensive income (3) (9)
Other comprehensive loss for the year, net of tax (2,030) (2,547)
Total comprehensive (loss)/income for the year (3,749) 3,952
- attributable to owners of Rio Tinto (2,443) 4,322
- attributable to non-controlling interests (1,306) (370)
(a) Excludes a currency translation charge of US$503 million (31 December 2014: US$376 million)
arising on Rio Tinto Limited’s share capital for the year ended 31 December 2015, which is recognised in the Group statement of changes in equity. Refer to Group statement of changes in equity on page 36.
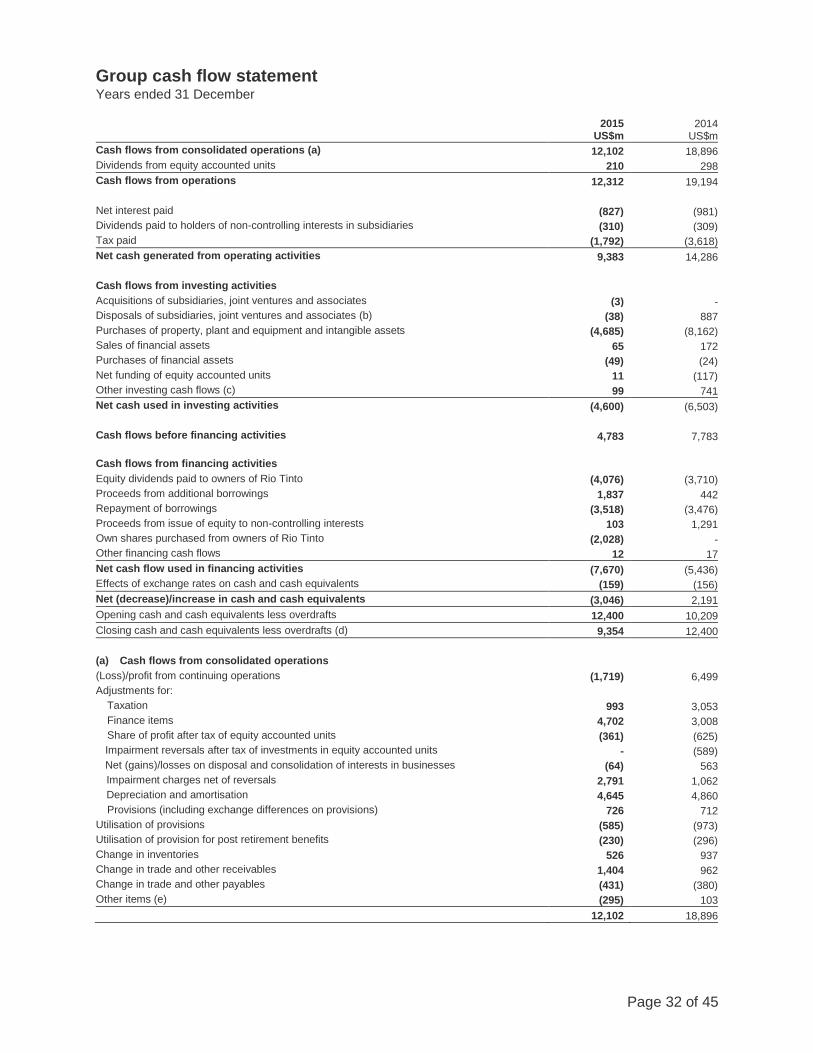
Page 32 of 45
Group cash flow statement Years ended 31 December
2015
US$m 2014
US$m
Cash flows from consolidated operations (a) 12,102 18,896
Dividends from equity accounted units 210 298
Cash flows from operations 12,312 19,194
Net interest paid (827) (981)
Dividends paid to holders of non-controlling interests in subsidiaries (310) (309)
Tax paid (1,792) (3,618)
Net cash generated from operating activities 9,383 14,286
Cash flows from investing activities
Acquisitions of subsidiaries, joint ventures and associates (3) -
Disposals of subsidiaries, joint ventures and associates (b) (38) 887
Purchases of property, plant and equipment and intangible assets (4,685) (8,162)
Sales of financial assets 65 172
Purchases of financial assets (49) (24)
Net funding of equity accounted units 11 (117)
Other investing cash flows (c) 99 741
Net cash used in investing activities (4,600) (6,503)
Cash flows before financing activities 4,783 7,783
Cash flows from financing activities
Equity dividends paid to owners of Rio Tinto (4,076) (3,710)
Proceeds from additional borrowings 1,837 442
Repayment of borrowings (3,518) (3,476)
Proceeds from issue of equity to non-controlling interests 103 1,291
Own shares purchased from owners of Rio Tinto (2,028) -
Other financing cash flows 12 17
Net cash flow used in financing activities (7,670) (5,436)
Effects of exchange rates on cash and cash equivalents (159) (156)
Net (decrease)/increase in cash and cash equivalents (3,046) 2,191
Opening cash and cash equivalents less overdrafts 12,400 10,209
Closing cash and cash equivalents less overdrafts (d) 9,354 12,400
(a) Cash flows from consolidated operations
(Loss)/profit from continuing operations (1,719) 6,499
Adjustments for:
Taxation 993 3,053
Finance items 4,702 3,008
Share of profit after tax of equity accounted units (361) (625)
Impairment reversals after tax of investments in equity accounted units - (589)
Net (gains)/losses on disposal and consolidation of interests in businesses (64) 563
Impairment charges net of reversals 2,791 1,062
Depreciation and amortisation 4,645 4,860
Provisions (including exchange differences on provisions) 726 712
Utilisation of provisions (585) (973)
Utilisation of provision for post retirement benefits (230) (296)
Change in inventories 526 937
Change in trade and other receivables 1,404 962
Change in trade and other payables (431) (380)
Other items (e) (295) 103
12,102 18,896
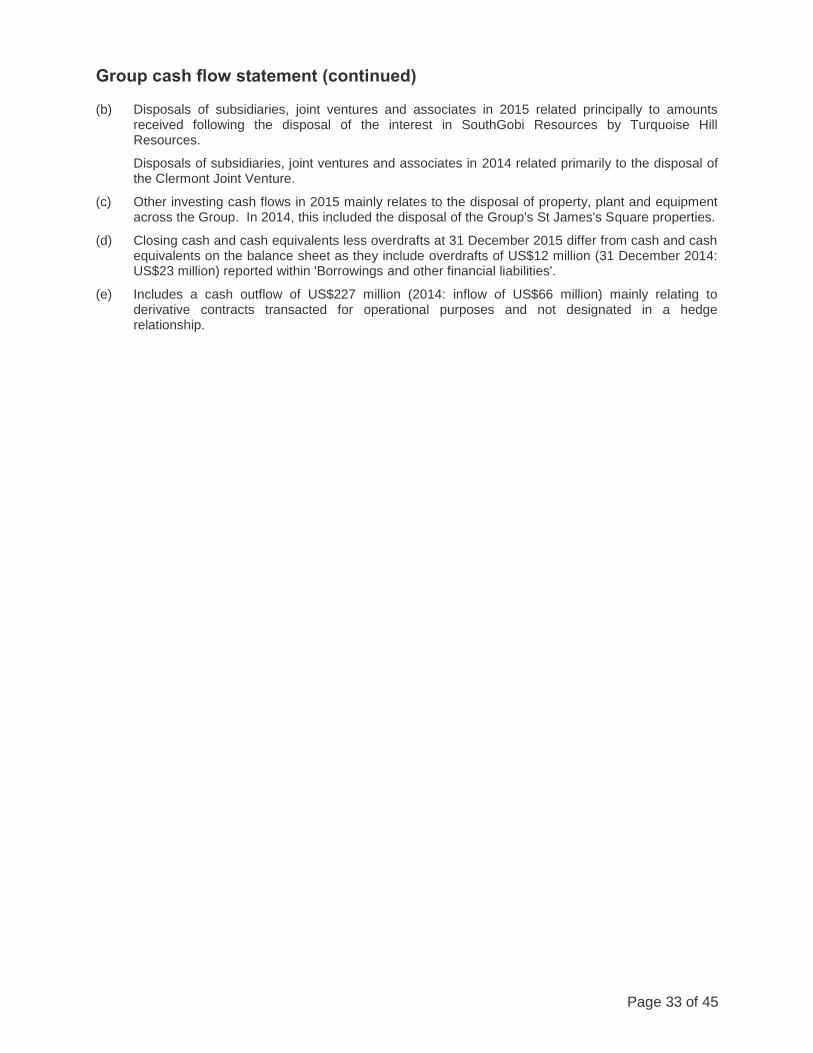
Page 33 of 45
Group cash flow statement (continued) (b) Disposals of subsidiaries, joint ventures and associates in 2015 related principally to amounts
received following the disposal of the interest in SouthGobi Resources by Turquoise Hill Resources.
Disposals of subsidiaries, joint ventures and associates in 2014 related primarily to the disposal of the Clermont Joint Venture.
(c) Other investing cash flows in 2015 mainly relates to the disposal of property, plant and equipment across the Group. In 2014, this included the disposal of the Group's St James's Square properties.
(d) Closing cash and cash equivalents less overdrafts at 31 December 2015 differ from cash and cash equivalents on the balance sheet as they include overdrafts of US$12 million (31 December 2014: US$23 million) reported within 'Borrowings and other financial liabilities'.
(e) Includes a cash outflow of US$227 million (2014: inflow of US$66 million) mainly relating to derivative contracts transacted for operational purposes and not designated in a hedge relationship.
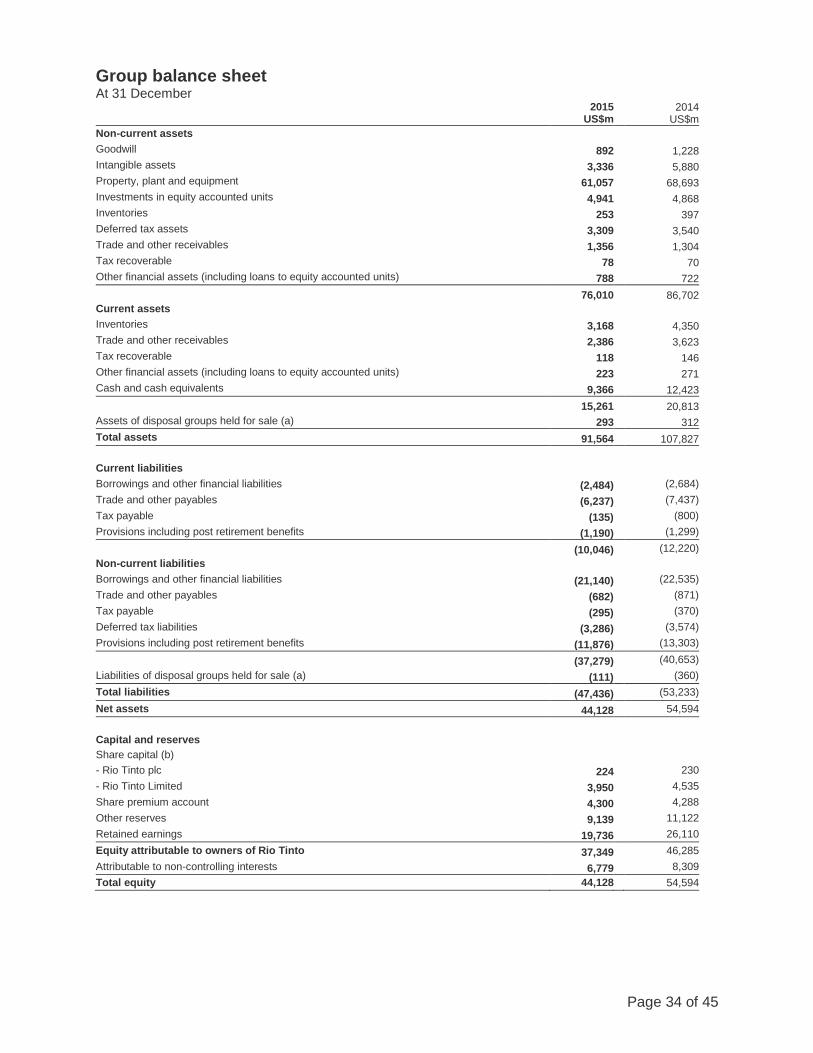
Page 34 of 45
Group balance sheet
At 31 December
2015
US$m 2014
US$m
Non-current assets
Goodwill 892 1,228
Intangible assets 3,336 5,880
Property, plant and equipment 61,057 68,693
Investments in equity accounted units 4,941 4,868
Inventories 253 397
Deferred tax assets 3,309 3,540
Trade and other receivables 1,356 1,304
Tax recoverable 78 70
Other financial assets (including loans to equity accounted units) 788 722
76,010 86,702
Current assets
Inventories 3,168 4,350
Trade and other receivables 2,386 3,623
Tax recoverable 118 146
Other financial assets (including loans to equity accounted units) 223 271
Cash and cash equivalents 9,366 12,423
15,261 20,813
Assets of disposal groups held for sale (a) 293 312
Total assets 91,564 107,827
Current liabilities
Borrowings and other financial liabilities (2,484) (2,684)
Trade and other payables (6,237) (7,437)
Tax payable (135) (800)
Provisions including post retirement benefits (1,190) (1,299)
(10,046) (12,220)
Non-current liabilities
Borrowings and other financial liabilities (21,140) (22,535)
Trade and other payables (682) (871)
Tax payable (295) (370)
Deferred tax liabilities (3,286) (3,574)
Provisions including post retirement benefits (11,876) (13,303)
(37,279) (40,653)
Liabilities of disposal groups held for sale (a) (111) (360)
Total liabilities (47,436) (53,233)
Net assets 44,128 54,594
Capital and reserves
Share capital (b)
- Rio Tinto plc 224 230
- Rio Tinto Limited 3,950 4,535
Share premium account 4,300 4,288
Other reserves 9,139 11,122
Retained earnings 19,736 26,110
Equity attributable to owners of Rio Tinto 37,349 46,285
Attributable to non-controlling interests 6,779 8,309
Total equity 44,128 54,594
Page 35 of 45
Group balance sheet (continued)
(a) Assets and liabilities held for sale at 31 December 2015 comprise Rio Tinto’s interests in the Blair
Athol coal project, Carbone Savoie, Bengalla, and Molybdenum Autoclave Process.
Assets and liabilities held for sale as at 31 December 2014 comprised Rio Tinto's interests in the Blair Athol coal project and SouthGobi Resources Ltd.
(b) At 31 December 2015, Rio Tinto plc had 1,374.0 million ordinary shares on issue and held by the public, and Rio Tinto Limited had 424.2 million shares on issue and held by the public. No shares in Rio Tinto Limited were held by Rio Tinto plc at 31 December 2015 (31 December 2014: nil). As required to be disclosed under the ASX Listing Rules, the net tangible assets per share amounted to US$18.42 (31 December 2014: US$21.18).
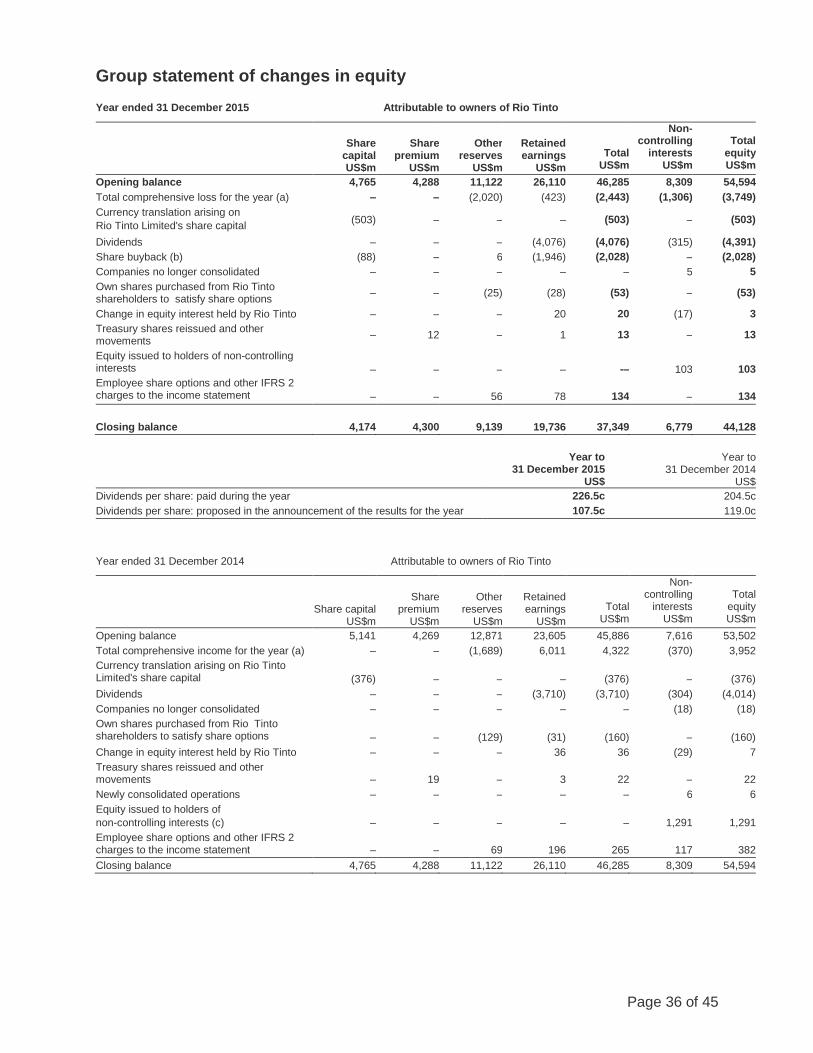
Page 36 of 45
Group statement of changes in equity Year ended 31 December 2015 Attributable to owners of Rio Tinto
Share capital US$m
Share premium
US$m
Other reserves
US$m
Retained earnings
US$m
Total US$m
Non-controlling
interests US$m
Total equity US$m
Opening balance 4,765 4,288 11,122 26,110 46,285 8,309 54,594
Total comprehensive loss for the year (a) – – (2,020) (423) (2,443) (1,306) (3,749)
Currency translation arising on
Rio Tinto Limited's share capital (503) – – – (503) – (503)
Dividends – – – (4,076) (4,076) (315) (4,391)
Share buyback (b) (88) – 6 (1,946) (2,028) – (2,028)
Companies no longer consolidated – – – – – 5 5
Own shares purchased from Rio Tinto shareholders to satisfy share options
– – (25) (28) (53) – (53)
Change in equity interest held by Rio Tinto – – – 20 20 (17) 3
Treasury shares reissued and other movements
– 12 – 1 13 – 13
Equity issued to holders of non-controlling interests
–
–
–
–
-–
103
103
Employee share options and other IFRS 2 charges to the income statement
–
– 56 78 134 – 134
Closing balance 4,174 4,300 9,139 19,736 37,349 6,779 44,128
Year to 31 December 2015
US$
Year to 31 December 2014
US$
Dividends per share: paid during the year 226.5c 204.5c
Dividends per share: proposed in the announcement of the results for the year 107.5c 119.0c
Year ended 31 December 2014 Attributable to owners of Rio Tinto
Share capital US$m
Share premium
US$m
Other reserves
US$m
Retained earnings
US$m
Total US$m
Non-controlling
interests US$m
Total equity US$m
Opening balance 5,141 4,269 12,871 23,605 45,886 7,616 53,502
Total comprehensive income for the year (a) – – (1,689) 6,011 4,322 (370) 3,952
Currency translation arising on Rio Tinto Limited's share capital
(376)
–
–
–
(376)
–
(376)
Dividends – – – (3,710) (3,710) (304) (4,014)
Companies no longer consolidated – – – – – (18) (18)
Own shares purchased from Rio Tinto shareholders to satisfy share options
–
–
(129)
(31)
(160)
–
(160)
Change in equity interest held by Rio Tinto – – – 36 36 (29) 7
Treasury shares reissued and other movements – 19 – 3 22 – 22
Newly consolidated operations – – – – – 6 6
Equity issued to holders of
non-controlling interests (c)
–
–
– –
–
1,291
1,291
Employee share options and other IFRS 2 charges to the income statement – – 69 196 265 117 382
Closing balance 4,765 4,288 11,122 26,110 46,285 8,309 54,594
Page 37 of 45
Group statement of changes in equity (continued)
(a) Refer to the Group statement of comprehensive income for further details. Adjustments to other reserves include currency translation attributable to owners of Rio Tinto, other than that arising on Rio Tinto Limited share capital.
(b) Total amount of US$2,028 million includes own shares purchased from owners of Rio Tinto as part of the share buy-back programme.
(c) Equity issued to holders of non-controlling interests during 2014 included US$1.2 billion of proceeds from a rights issue to Turquoise Hill Resources in January 2014.
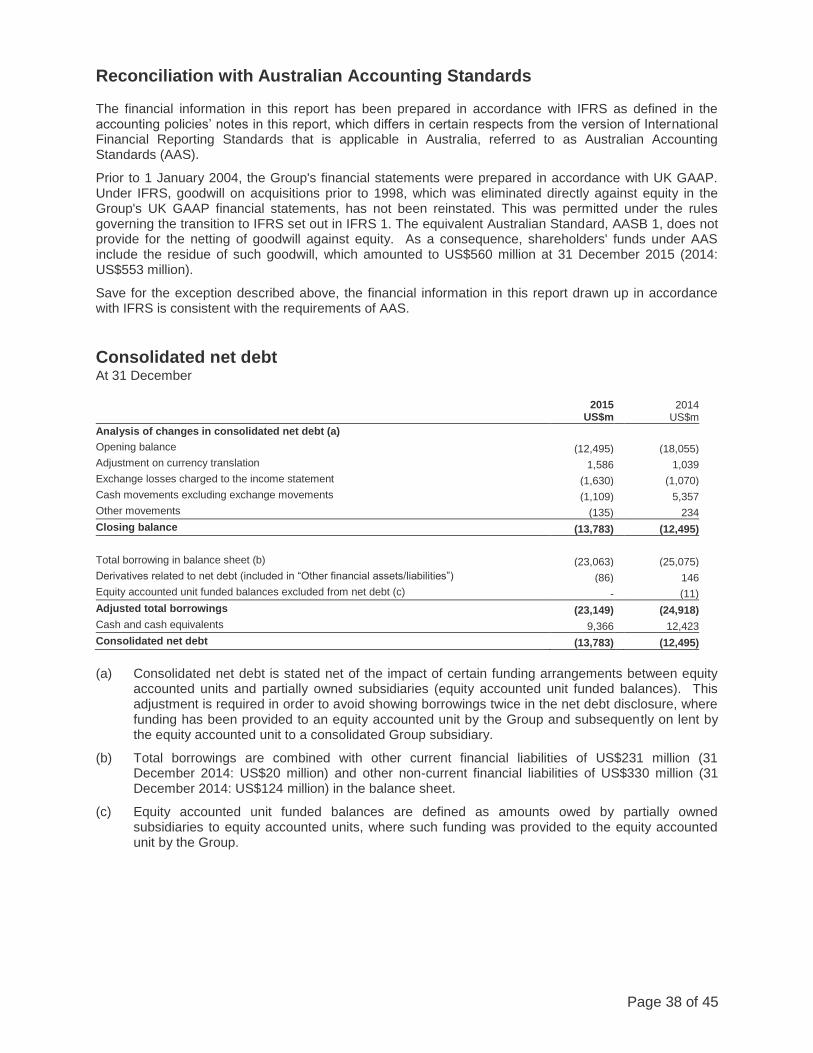
Page 38 of 45
Reconciliation with Australian Accounting Standards The financial information in this report has been prepared in accordance with IFRS as defined in the accounting policies’ notes in this report, which differs in certain respects from the version of International Financial Reporting Standards that is applicable in Australia, referred to as Australian Accounting Standards (AAS).
Prior to 1 January 2004, the Group's financial statements were prepared in accordance with UK GAAP. Under IFRS, goodwill on acquisitions prior to 1998, which was eliminated directly against equity in the Group's UK GAAP financial statements, has not been reinstated. This was permitted under the rules governing the transition to IFRS set out in IFRS 1. The equivalent Australian Standard, AASB 1, does not provide for the netting of goodwill against equity. As a consequence, shareholders' funds under AAS include the residue of such goodwill, which amounted to US$560 million at 31 December 2015 (2014: US$553 million).
Save for the exception described above, the financial information in this report drawn up in accordance with IFRS is consistent with the requirements of AAS.
Consolidated net debt At 31 December
2015
US$m 2014
US$m
Analysis of changes in consolidated net debt (a)
Opening balance (12,495) (18,055)
Adjustment on currency translation 1,586 1,039
Exchange losses charged to the income statement (1,630) (1,070)
Cash movements excluding exchange movements (1,109) 5,357
Other movements (135) 234
Closing balance (13,783) (12,495)
Total borrowing in balance sheet (b) (23,063) (25,075)
Derivatives related to net debt (included in “Other financial assets/liabilities”) (86) 146
Equity accounted unit funded balances excluded from net debt (c) - (11)
Adjusted total borrowings (23,149) (24,918)
Cash and cash equivalents 9,366 12,423
Consolidated net debt (13,783) (12,495)
(a) Consolidated net debt is stated net of the impact of certain funding arrangements between equity
accounted units and partially owned subsidiaries (equity accounted unit funded balances). This adjustment is required in order to avoid showing borrowings twice in the net debt disclosure, where funding has been provided to an equity accounted unit by the Group and subsequently on lent by the equity accounted unit to a consolidated Group subsidiary.
(b) Total borrowings are combined with other current financial liabilities of US$231 million (31 December 2014: US$20 million) and other non-current financial liabilities of US$330 million (31 December 2014: US$124 million) in the balance sheet.
(c) Equity accounted unit funded balances are defined as amounts owed by partially owned subsidiaries to equity accounted units, where such funding was provided to the equity accounted unit by the Group.
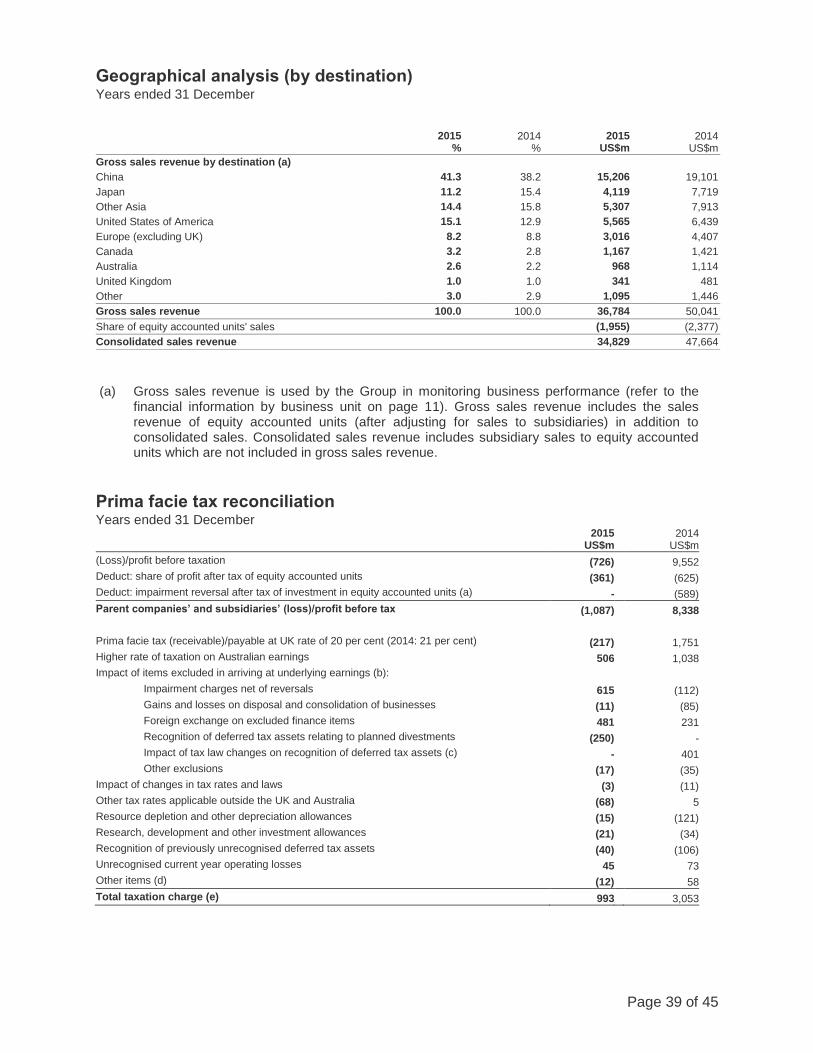
Page 39 of 45
Geographical analysis (by destination) Years ended 31 December
2015
%
2014 %
2015
US$m
2014 US$m
Gross sales revenue by destination (a)
China 41.3 38.2 15,206 19,101
Japan 11.2 15.4 4,119 7,719
Other Asia 14.4 15.8 5,307 7,913
United States of America 15.1 12.9 5,565 6,439
Europe (excluding UK) 8.2 8.8 3,016 4,407
Canada 3.2 2.8 1,167 1,421
Australia 2.6 2.2 968 1,114
United Kingdom 1.0 1.0 341 481
Other 3.0 2.9 1,095 1,446
Gross sales revenue 100.0 100.0 36,784 50,041
Share of equity accounted units' sales (1,955) (2,377)
Consolidated sales revenue 34,829 47,664
(a) Gross sales revenue is used by the Group in monitoring business performance (refer to the
financial information by business unit on page 11). Gross sales revenue includes the sales revenue of equity accounted units (after adjusting for sales to subsidiaries) in addition to consolidated sales. Consolidated sales revenue includes subsidiary sales to equity accounted units which are not included in gross sales revenue.
Prima facie tax reconciliation
Years ended 31 December
2015
US$m 2014
US$m
(Loss)/profit before taxation (726) 9,552
Deduct: share of profit after tax of equity accounted units (361) (625)
Deduct: impairment reversal after tax of investment in equity accounted units (a) - (589)
Parent companies’ and subsidiaries’ (loss)/profit before tax (1,087) 8,338
Prima facie tax (receivable)/payable at UK rate of 20 per cent (2014: 21 per cent) (217) 1,751
Higher rate of taxation on Australian earnings 506 1,038
Impact of items excluded in arriving at underlying earnings (b):
Impairment charges net of reversals 615 (112)
Gains and losses on disposal and consolidation of businesses (11) (85)
Foreign exchange on excluded finance items 481 231
Recognition of deferred tax assets relating to planned divestments (250) -
Impact of tax law changes on recognition of deferred tax assets (c) - 401
Other exclusions (17) (35)
Impact of changes in tax rates and laws (3) (11)
Other tax rates applicable outside the UK and Australia (68) 5
Resource depletion and other depreciation allowances (15) (121)
Research, development and other investment allowances (21) (34)
Recognition of previously unrecognised deferred tax assets (40) (106)
Unrecognised current year operating losses 45 73
Other items (d) (12) 58
Total taxation charge (e) 993 3,053
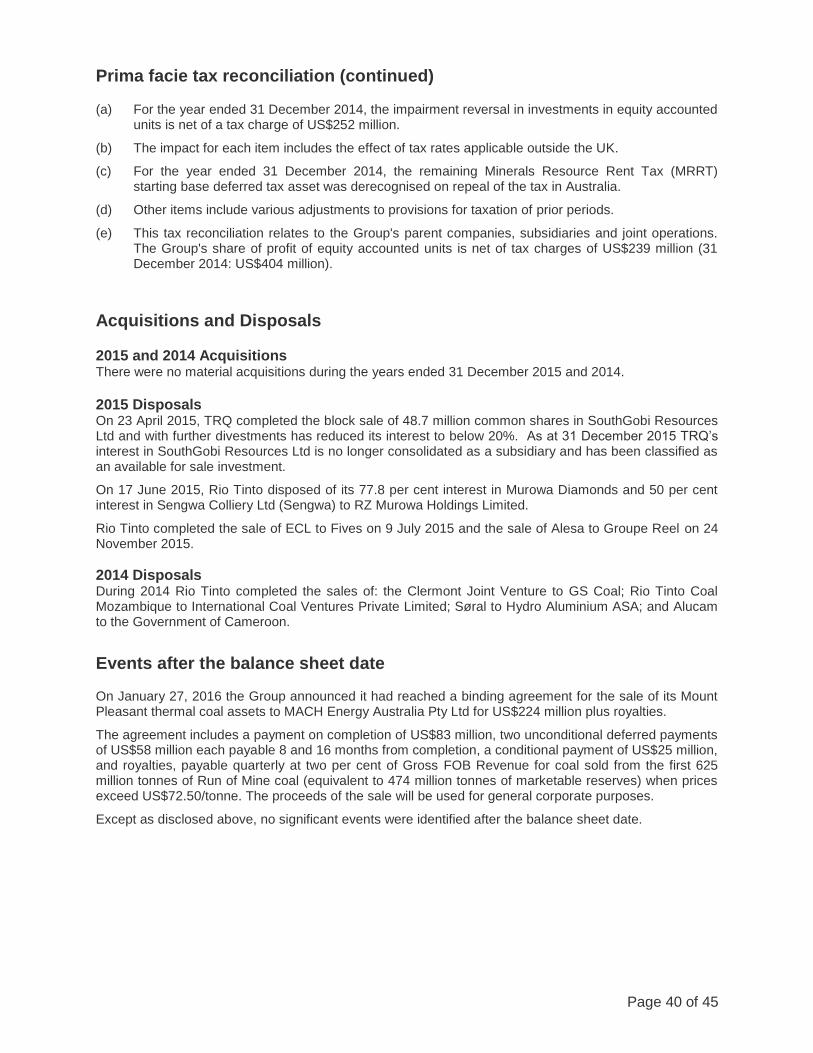
Page 40 of 45
Prima facie tax reconciliation (continued) (a) For the year ended 31 December 2014, the impairment reversal in investments in equity accounted
units is net of a tax charge of US$252 million.
(b) The impact for each item includes the effect of tax rates applicable outside the UK.
(c) For the year ended 31 December 2014, the remaining Minerals Resource Rent Tax (MRRT) starting base deferred tax asset was derecognised on repeal of the tax in Australia.
(d) Other items include various adjustments to provisions for taxation of prior periods.
(e) This tax reconciliation relates to the Group's parent companies, subsidiaries and joint operations. The Group's share of profit of equity accounted units is net of tax charges of US$239 million (31 December 2014: US$404 million).
Acquisitions and Disposals 2015 and 2014 Acquisitions There were no material acquisitions during the years ended 31 December 2015 and 2014.
2015 Disposals On 23 April 2015, TRQ completed the block sale of 48.7 million common shares in SouthGobi Resources Ltd and with further divestments has reduced its interest to below 20%. As at 31 December 2015 TRQ’s interest in SouthGobi Resources Ltd is no longer consolidated as a subsidiary and has been classified as an available for sale investment.
On 17 June 2015, Rio Tinto disposed of its 77.8 per cent interest in Murowa Diamonds and 50 per cent interest in Sengwa Colliery Ltd (Sengwa) to RZ Murowa Holdings Limited.
Rio Tinto completed the sale of ECL to Fives on 9 July 2015 and the sale of Alesa to Groupe Reel on 24 November 2015.
2014 Disposals During 2014 Rio Tinto completed the sales of: the Clermont Joint Venture to GS Coal; Rio Tinto Coal Mozambique to International Coal Ventures Private Limited; Søral to Hydro Aluminium ASA; and Alucam to the Government of Cameroon.
Events after the balance sheet date On January 27, 2016 the Group announced it had reached a binding agreement for the sale of its Mount Pleasant thermal coal assets to MACH Energy Australia Pty Ltd for US$224 million plus royalties.
The agreement includes a payment on completion of US$83 million, two unconditional deferred payments of US$58 million each payable 8 and 16 months from completion, a conditional payment of US$25 million, and royalties, payable quarterly at two per cent of Gross FOB Revenue for coal sold from the first 625 million tonnes of Run of Mine coal (equivalent to 474 million tonnes of marketable reserves) when prices exceed US$72.50/tonne. The proceeds of the sale will be used for general corporate purposes.
Except as disclosed above, no significant events were identified after the balance sheet date.
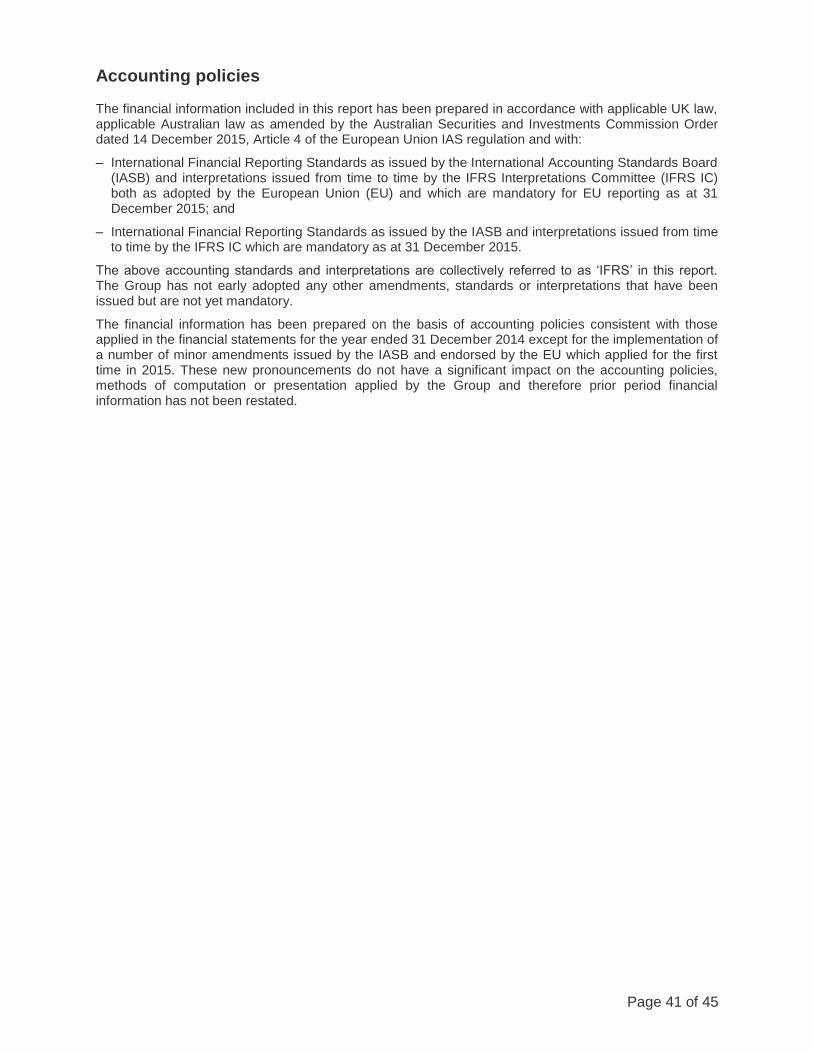
Page 41 of 45
Accounting policies The financial information included in this report has been prepared in accordance with applicable UK law, applicable Australian law as amended by the Australian Securities and Investments Commission Order dated 14 December 2015, Article 4 of the European Union IAS regulation and with:
– International Financial Reporting Standards as issued by the International Accounting Standards Board (IASB) and interpretations issued from time to time by the IFRS Interpretations Committee (IFRS IC) both as adopted by the European Union (EU) and which are mandatory for EU reporting as at 31 December 2015; and
– International Financial Reporting Standards as issued by the IASB and interpretations issued from time to time by the IFRS IC which are mandatory as at 31 December 2015.
The above accounting standards and interpretations are collectively referred to as ‘IFRS’ in this report. The Group has not early adopted any other amendments, standards or interpretations that have been issued but are not yet mandatory.
The financial information has been prepared on the basis of accounting policies consistent with those applied in the financial statements for the year ended 31 December 2014 except for the implementation of a number of minor amendments issued by the IASB and endorsed by the EU which applied for the first time in 2015. These new pronouncements do not have a significant impact on the accounting policies, methods of computation or presentation applied by the Group and therefore prior period financial information has not been restated.
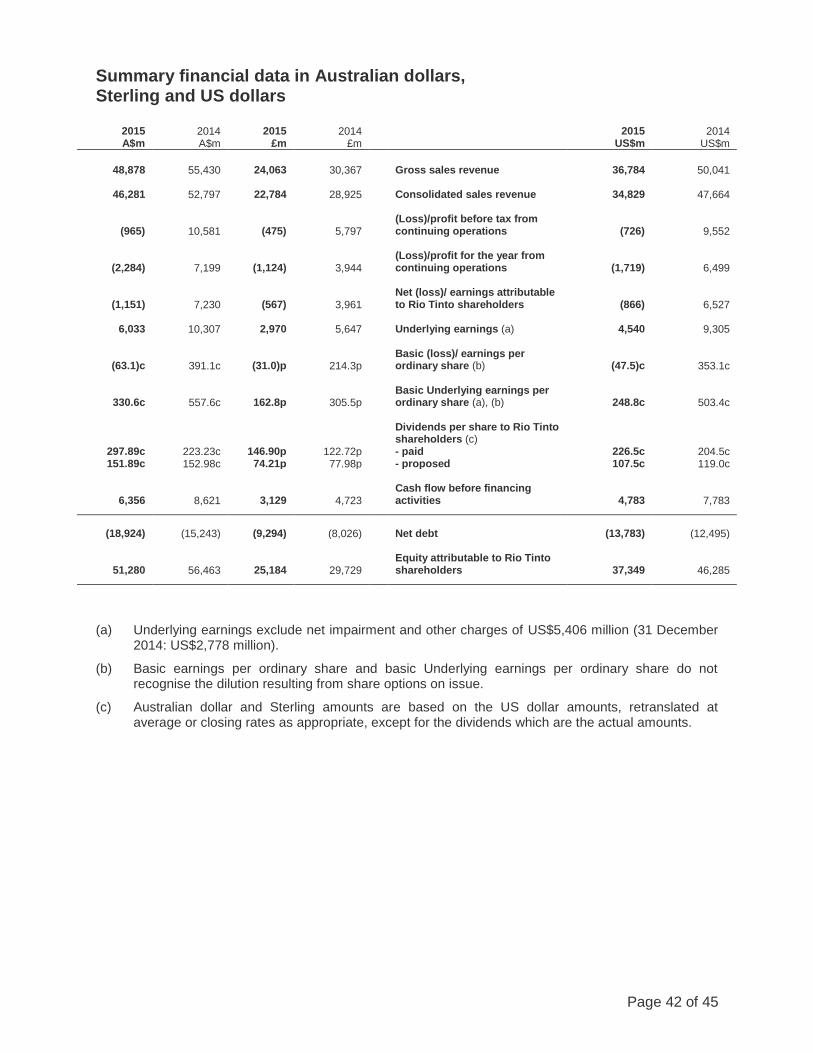
Page 42 of 45
Summary financial data in Australian dollars, Sterling and US dollars
2015 A$m
2014 A$m
2015 £m
2014 £m
2015 US$m
2014 US$m
48,878 55,430 24,063 30,367 Gross sales revenue 36,784 50,041
46,281 52,797 22,784 28,925 Consolidated sales revenue 34,829 47,664
(965) 10,581 (475) 5,797 (Loss)/profit before tax from continuing operations (726) 9,552
(2,284) 7,199 (1,124) 3,944 (Loss)/profit for the year from continuing operations (1,719) 6,499
(1,151) 7,230 (567) 3,961 Net (loss)/ earnings attributable to Rio Tinto shareholders (866) 6,527
6,033 10,307 2,970 5,647 Underlying earnings (a) 4,540 9,305
(63.1)c 391.1c (31.0)p 214.3p Basic (loss)/ earnings per ordinary share (b) (47.5)c 353.1c
330.6c 557.6c 162.8p 305.5p Basic Underlying earnings per ordinary share (a), (b) 248.8c 503.4c
Dividends per share to Rio Tinto shareholders (c)
297.89c 223.23c 146.90p 122.72p - paid 226.5c 204.5c 151.89c 152.98c 74.21p 77.98p - proposed 107.5c 119.0c
6,356 8,621 3,129 4,723 Cash flow before financing activities 4,783 7,783
(18,924) (15,243) (9,294) (8,026) Net debt (13,783) (12,495)
51,280 56,463 25,184 29,729 Equity attributable to Rio Tinto shareholders 37,349 46,285
(a) Underlying earnings exclude net impairment and other charges of US$5,406 million (31 December 2014: US$2,778 million).
(b) Basic earnings per ordinary share and basic Underlying earnings per ordinary share do not recognise the dilution resulting from share options on issue.
(c) Australian dollar and Sterling amounts are based on the US dollar amounts, retranslated at average or closing rates as appropriate, except for the dividends which are the actual amounts.
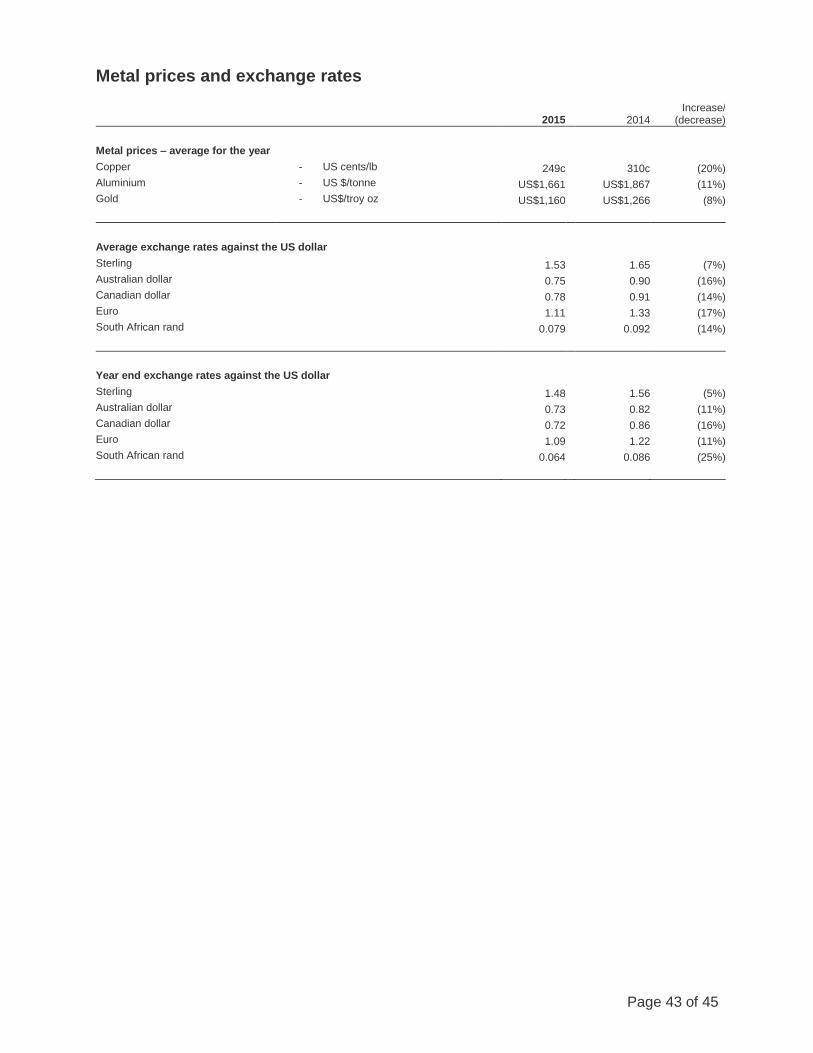
Page 43 of 45
Metal prices and exchange rates
2015 2014 Increase/
(decrease)
Metal prices – average for the year
Copper - US cents/lb 249c 310c (20%)
Aluminium - US $/tonne US$1,661 US$1,867 (11%)
Gold - US$/troy oz US$1,160 US$1,266 (8%)
Average exchange rates against the US dollar
Sterling 1.53 1.65 (7%)
Australian dollar 0.75 0.90 (16%)
Canadian dollar 0.78 0.91 (14%)
Euro 1.11 1.33 (17%)
South African rand 0.079 0.092 (14%)
Year end exchange rates against the US dollar
Sterling 1.48 1.56 (5%)
Australian dollar 0.73 0.82 (11%)
Canadian dollar 0.72 0.86 (16%)
Euro 1.09 1.22 (11%)
South African rand 0.064 0.086 (25%)
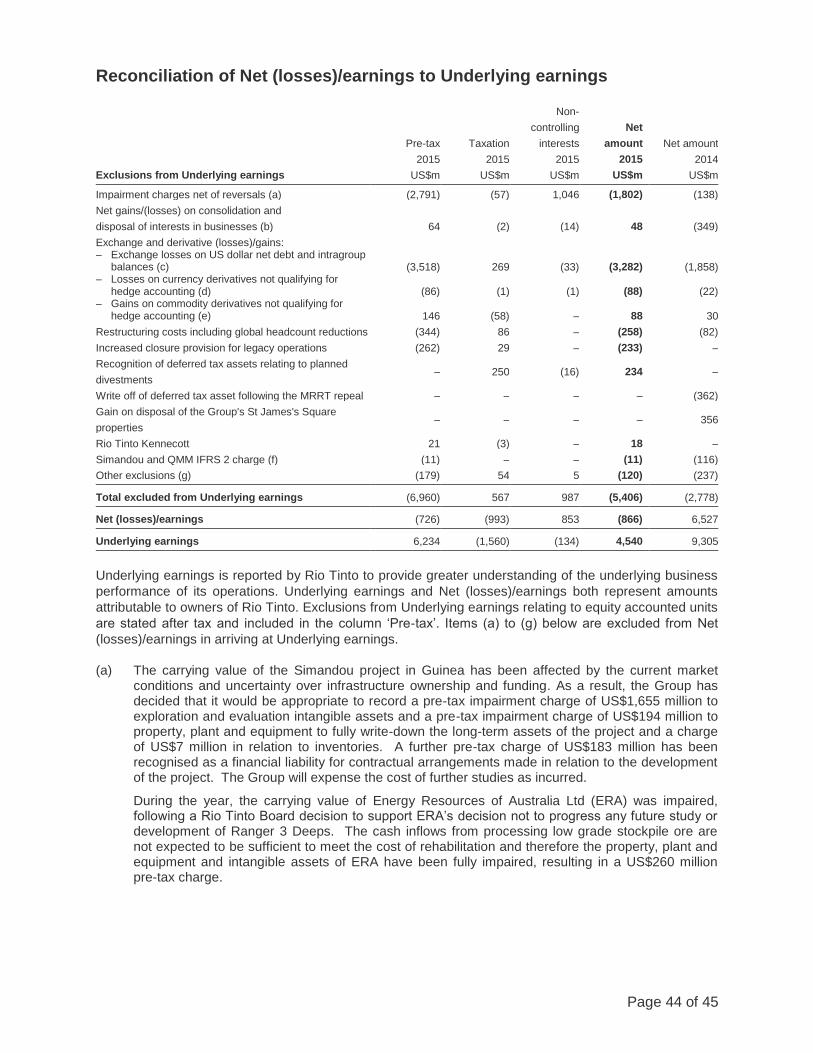
Page 44 of 45
Reconciliation of Net (losses)/earnings to Underlying earnings
Exclusions from Underlying earnings
Pre-tax
2015
US$m
Taxation
2015
US$m
Non-
controlling
interests
2015
US$m
Net
amount
2015
US$m
Net amount
2014
US$m
Impairment charges net of reversals (a) (2,791) (57) 1,046 (1,802) (138)
Net gains/(losses) on consolidation and
disposal of interests in businesses (b) 64 (2) (14) 48 (349)
Exchange and derivative (losses)/gains: – Exchange losses on US dollar net debt and intragroup
balances (c) (3,518) 269 (33) (3,282) (1,858) – Losses on currency derivatives not qualifying for
hedge accounting (d) (86) (1) (1) (88) (22) – Gains on commodity derivatives not qualifying for
hedge accounting (e) 146 (58) – 88 30
Restructuring costs including global headcount reductions (344) 86 – (258) (82)
Increased closure provision for legacy operations (262) 29 – (233) –
Recognition of deferred tax assets relating to planned
divestments – 250 (16) 234 –
Write off of deferred tax asset following the MRRT repeal – – – – (362)
Gain on disposal of the Group's St James's Square
properties – – – – 356
Rio Tinto Kennecott 21 (3) – 18 –
Simandou and QMM IFRS 2 charge (f) (11) – – (11) (116)
Other exclusions (g) (179) 54 5 (120) (237)
Total excluded from Underlying earnings (6,960) 567 987 (5,406) (2,778)
Net (losses)/earnings (726) (993) 853 (866) 6,527
Underlying earnings 6,234 (1,560) (134) 4,540 9,305
Underlying earnings is reported by Rio Tinto to provide greater understanding of the underlying business
performance of its operations. Underlying earnings and Net (losses)/earnings both represent amounts
attributable to owners of Rio Tinto. Exclusions from Underlying earnings relating to equity accounted units
are stated after tax and included in the column ‘Pre-tax’. Items (a) to (g) below are excluded from Net
(losses)/earnings in arriving at Underlying earnings.
(a) The carrying value of the Simandou project in Guinea has been affected by the current market
conditions and uncertainty over infrastructure ownership and funding. As a result, the Group has decided that it would be appropriate to record a pre-tax impairment charge of US$1,655 million to exploration and evaluation intangible assets and a pre-tax impairment charge of US$194 million to property, plant and equipment to fully write-down the long-term assets of the project and a charge of US$7 million in relation to inventories. A further pre-tax charge of US$183 million has been recognised as a financial liability for contractual arrangements made in relation to the development of the project. The Group will expense the cost of further studies as incurred.
During the year, the carrying value of Energy Resources of Australia Ltd (ERA) was impaired, following a Rio Tinto Board decision to support ERA’s decision not to progress any future study or development of Ranger 3 Deeps. The cash inflows from processing low grade stockpile ore are not expected to be sufficient to meet the cost of rehabilitation and therefore the property, plant and equipment and intangible assets of ERA have been fully impaired, resulting in a US$260 million pre-tax charge.
Page 45 of 45
Reconciliation of Net (losses)/earnings to Underlying earnings (continued)
The Roughrider uranium project completed an Order of Magnitude study in late 2015 which provided an updated view of the development concept and geological model. The cash-generating unit is tested annually for impairment as it contains goodwill. The impairment test resulted in a pre-tax impairment charge of US$116 million to fully write off goodwill and a pre-tax impairment charge of US$113 million to exploration and evaluation intangible assets, which were capitalised as a result of the Hathor Exploration acquisition in 2012.
Other impairment charges during the year reflect challenging economic conditions at business units reclassified to assets held for sale during the period in the Group’s Aluminium and Copper and Coal product groups.
In 2014 the Group incurred pre-tax impairment charge (net of reversals) of US$1,062 million related to impairment charge at Molybdenum Autoclave Process in the Group’s Copper and Coal product group (US$559 million) and impairment charge net of reversals of US$503 million related to certain Aluminium product group assets.
Rio Tinto also incurred a post-tax impairment reversal of investments in equity accounted units of US$589 million in its Aluminium product group.
(b) Net gains on disposal and consolidation of interests in businesses in 2015 related mainly to the reduction in shareholding of SouthGobi Resources, the sale of the Group’s interest in Murowa Diamonds and Sengwa Colliery on 17 June 2015 and in the Aluminium product group’s divestment of ECL on 9 July 2015 and Alesa on 24 November 2015.
Net losses on disposal and consolidation of interests in businesses during 2014 related mainly to the disposal of the Clermont Joint Venture on 29 May 2014 and of Rio Tinto Coal Mozambique on 7 October 2014
(c) Net exchange losses in 2015 comprise post-tax foreign exchange losses of US$1,197 million on US dollar denominated net debt in non-US dollar functional currency companies (on borrowings of approximately US$23.1 billion), and US$2,085 million losses on intragroup balances, as the Australian dollar, Canadian dollar and the Euro all weakened against the US dollar.
(d) Valuation changes on currency and interest rate derivatives, which are ineligible for hedge accounting, other than those embedded in commercial contracts, and the currency revaluation of embedded US dollar derivatives contained in contracts held by entities whose functional currency is not the US dollar.
(e) Valuation changes on commodity derivatives, including those embedded in commercial contracts, that are ineligible for hedge accounting, but for which there will be an offsetting change in future Group earnings.
(f) In 2014, the charge of US$116 million (after non-controlling interests and tax), calculated in accordance with IFRS 2 'Share-based Payment', reflects the discount to an estimate of fair value at which shares are transferrable to the Government of Guinea under the Investment Framework ratified on 26 May 2014.
(g) Other credits and charges that, individually, or in aggregate, if of similar type, are of a nature or size to require exclusion in order to provide additional insight into underlying business performance.
Availability of this report This report is available on the Rio Tinto website (www.riotinto.com).


