Solar and Gas Powered Long-Endurance Unmanned Aircraft ... · Solar and Gas Powered Long-Endurance...
14
Solar and Gas Powered Long-Endurance Unmanned Aircraft Sizing via Geometric Programming Michael Burton ∗ and Warren Hoburg † Massachusetts Institute of Technology, Cambridge, Massachusetts 02139 DOI: 10.2514/1.C034405 Fueled by telecommunication needs and opportunities, there has been a recent push to develop aircraft that can provide long-endurance (days to weeks) persistent aerial coverage. These aircraft present a complicated systems engineering problem because of the multifaceted interaction between aerodynamics, structures, environmental effects, and engine, battery, and other component performance. Using geometric programming, models capturing the interaction between disciplines are used to analyze the feasible limits of solar-electric and gas-powered, long- endurance aircraft in seconds to a level of detail and speed not previously achieved in initial aircraft sizing and design. The results show that long-endurance, gas-powered aircraft are generally more robust to higher wind speeds than solar-powered aircraft but are limited in their endurance by the amount of fuel that they can carry. Although solar- electric-powered aircraft can theoretically fly for months, they are operationally limited by reduced solar flux during the winter and wind speeds at higher latitudes. A detailed trade study between gas-powered and solar-powered aircraft is performed to discover which architecture is best suited to meet a given set of requirements and what is the optimum size and endurance of that platform. Nomenclature A = wing aspect ratio A = nondimensional cross-sectional area BSFC = brake specific fuel consumption BSFC 100% = brake specific fuel consumption at full throttle b = wing span C D = aircraft drag coefficient C d 0 = nonwing drag coefficient C f = skin friction coefficient C L = lift coefficient C L max = maximum lift coefficient c = wing chord c d p = wing profile drag coefficient c l α = lift slope coefficient D boom = tail boom drag DOY = day of the year d = tail boom diameter e = span efficiency factor E = Young’ s modulus E batt = energy stored in battery E sun = total solar energy available E∕S day = daily required solar energy E∕S sun = available solar energy E∕S twilight = twilight solar energy f solar = planform area fraction covered in solar cells f structural = fractional structural weight g = gravitational constant h = flight altitude h batt = battery specific energy h cap = spar cap separation _ h min = minimum climb rate I = cap spar moment of inertia I 0 = tail boom root moment of inertia K q = wing loading constant k = tail boom taper index L h = horizontal tail lift l fuse = fuselage length l h = horizontal tail moment arm l v = vertical tail moment arm M = wing bending moment m = tail boom mass m 0 = local wing mass m fac = weight margin factor m motor = electric motor mass N = number of flight segments N max = safety load factor n = number of wing segments P avionics = avionics power P oper = aircraft operating power P shaft = engine/motor shaft power P sun = useable solar power per unit area P sun surface = power emitted at the sun’ s surface P 0 = magnitude of available solar power P∕S min = minimum operational solar power p wind = percentile wind speed R = aircraft range R earth orbit = distance from Earth to sun R fuse = fuselage radius R spec = specific gas constant R sun = radius of the sun r 0 = average distance from Earth to sun q = distributed wing loading q = normalized distributed wing loading Re = aircraft Reynolds number Re boom = tail boom Reynolds number S = wing planform area S = shear force S fuse = fuselage wetted surface area S h = horizontal tail planform area S solar = solar cell area S v = vertical tail planform area T = aircraft thrust t = flight time t cap = spar cap thickness t day = hours of daylight t night = hours of darkness t sunrise = time of sunrise t sunset = time of sunset Presented as Paper 2017-4147 at the 18th AIAA/ISSMO Multidisciplinary Analysis and Optimization Conference, Denver, CO, 5–9 June 2017; received 2 February 2017; revision received 16 May 2017; accepted for publication 1 July 2017; published online 25 August 2017. Copyright © 2017 by the American Institute of Aeronautics and Astronautics, Inc. All rights reserved. All requests for copying and permission to reprint should be submitted to CCC at www.copyright.com; employ the ISSN 0021-8669 (print) or 1533-3868 (online) to initiate your request. See also AIAA Rights and Permissions www.aiaa.org/randp. *Ph.D. Candidate, Department of Aeronautics and Astronautics Engineering; [email protected]. Student AIAA. † Assistant Professor, Department of Aeronautics and Astronautics Engineering; [email protected]. Member AIAA. Article in Advance / 1 JOURNAL OF AIRCRAFT
Transcript of Solar and Gas Powered Long-Endurance Unmanned Aircraft ... · Solar and Gas Powered Long-Endurance...

Solar and Gas Powered Long-Endurance Unmanned AircraftSizing via Geometric Programming
Michael Burton∗ and Warren Hoburg†
Massachusetts Institute of Technology, Cambridge, Massachusetts 02139
DOI: 10.2514/1.C034405
Fueled by telecommunication needs and opportunities, there has been a recent push to develop aircraft that can
provide long-endurance (days to weeks) persistent aerial coverage. These aircraft present a complicated systems
engineering problem because of the multifaceted interaction between aerodynamics, structures, environmental
effects, and engine, battery, and other component performance.Using geometric programming,models capturing the
interaction between disciplines are used to analyze the feasible limits of solar-electric and gas-powered, long-
endurance aircraft in seconds to a level of detail and speed not previously achieved in initial aircraft sizing and design.
The results show that long-endurance, gas-powered aircraft are generally more robust to higher wind speeds than
solar-powered aircraft but are limited in their endurance by the amount of fuel that they can carry. Although solar-
electric-powered aircraft can theoretically fly formonths, they are operationally limited by reduced solar flux during
the winter and wind speeds at higher latitudes. A detailed trade study between gas-powered and solar-powered
aircraft is performed to discover which architecture is best suited to meet a given set of requirements and what is the
optimum size and endurance of that platform.
Nomenclature
A = wing aspect ratio�A = nondimensional cross-sectional areaBSFC = brake specific fuel consumptionBSFC100% = brake specific fuel consumption at full throttleb = wing spanCD = aircraft drag coefficientCd0 = nonwing drag coefficientCf = skin friction coefficientCL = lift coefficientCLmax
= maximum lift coefficientc = wing chordcdp = wing profile drag coefficientclα = lift slope coefficientDboom = tail boom dragDOY = day of the yeard = tail boom diametere = span efficiency factorE = Young’s modulusEbatt = energy stored in batteryEsun = total solar energy available�E∕S�day = daily required solar energy�E∕S�sun = available solar energy�E∕S�twilight = twilight solar energyfsolar = planform area fraction covered in solar cellsfstructural = fractional structural weightg = gravitational constanth = flight altitudehbatt = battery specific energyhcap = spar cap separation_hmin = minimum climb rateI = cap spar moment of inertia
I0 = tail boom root moment of inertiaKq = wing loading constantk = tail boom taper indexLh = horizontal tail liftlfuse = fuselage lengthlh = horizontal tail moment armlv = vertical tail moment armM = wing bending momentm = tail boom massm 0 = local wing massmfac = weight margin factormmotor = electric motor massN = number of flight segmentsNmax = safety load factorn = number of wing segmentsPavionics = avionics powerPoper = aircraft operating powerPshaft = engine/motor shaft powerPsun = useable solar power per unit areaPsun surface = power emitted at the sun’s surfaceP0 = magnitude of available solar power�P∕S�min = minimum operational solar powerpwind = percentile wind speedR = aircraft rangeRearth orbit = distance from Earth to sunRfuse = fuselage radiusRspec = specific gas constantRsun = radius of the sunr0 = average distance from Earth to sunq = distributed wing loading�q = normalized distributed wing loadingRe = aircraft Reynolds numberReboom = tail boom Reynolds numberS = wing planform areaS = shear forceSfuse = fuselage wetted surface areaSh = horizontal tail planform areaSsolar = solar cell areaSv = vertical tail planform areaT = aircraft thrustt = flight timetcap = spar cap thicknesstday = hours of daylighttnight = hours of darknesstsunrise = time of sunrisetsunset = time of sunset
Presented as Paper 2017-4147 at the 18th AIAA/ISSMOMultidisciplinaryAnalysis andOptimization Conference, Denver, CO, 5–9 June 2017; received2 February 2017; revision received 16 May 2017; accepted for publication 1July 2017; published online 25 August 2017. Copyright © 2017 by theAmerican Institute of Aeronautics and Astronautics, Inc. All rights reserved.All requests for copying and permission to reprint should be submitted toCCCat www.copyright.com; employ the ISSN 0021-8669 (print) or 1533-3868(online) to initiate your request. See also AIAA Rights and Permissionswww.aiaa.org/randp.
*Ph.D. Candidate, Department of Aeronautics and AstronauticsEngineering; [email protected]. Student AIAA.
†Assistant Professor, Department of Aeronautics and AstronauticsEngineering; [email protected]. Member AIAA.
Article in Advance / 1
JOURNAL OF AIRCRAFT
t0 = tail boom root wall thicknessV = true airspeedVfuse = fuselage volumeVgust = gust velocityVh = horizontal tail lift coefficientVref = reference wind airspeedVwind = wind speedVv = vertical tail lift coefficientW = aircraft weightWave = average weight over a flight segmentWbatt = battery weightWcent = center of aircraft weightWemp = empennage weightWengine = engine weightWfadd = additional wing structural weightWfinal = end of flight segment aircraft weightWfuel = fuel weightWfuselage = fuselage weightWh = horizontal tail weightWinitial = start of flight segment aircraft weightWMTO = max takeoff weightWpayload = payload weightWskin = wing skin weightWsolar = solar cell weightWspar = wing spar weightWstructural = structural weightWv = vertical tail weightWwing = wing weightw = wing deflectionwcap = spar cap widthwmax = maximum deflection limity = distance from wing root along spanzbre = Breguet range helper variableα = angle of attackαgust = local angle of attack from gust velocitiesΔ = solar declination angleΔW = wing section weightΔy = wing section lengthΘ = wing bending deflection angleθ = angle normal to surfaceθboom = tail boom deflection angleηcharge = battery charging efficiencyηdischarge = battery discharging efficiencyηmotor = electric motor efficiencyηprop = propulsive efficiencyηsolar = solar cell efficiencyρ = air densityρAcfrp
= area density of carbon fiberρcfrp = density of carbon fiberρfoam = density of foamρsolar = solar cell densityσcfrp = maximum carbon-fiber stressτh = horizontal tail thickness-to-chord ratioτt = wing thickness-to-chord ratioτv = vertical tail thickness-to-chord ratioτw = cap spar width-to-chord ratioϕ = latitude
I. Introduction
L ONG-ENDURANCE station-keeping aircraft are potentialsolutions to providing internet, communication, and persistent
aerial coverage. Recently, technology companies such as Google [1]and Facebook [2] have explored the possibility of using solar-electric-powered aircraft to provide internet to parts of the worldwhere 4G or 3G network is not available. Engineering firms likeAurora Flight Sciences [3] and Vanilla Aircraft [4] have developedgas-powered long-endurance platforms as a means of providingcontinual surveillance for days at a time. Sizing of such long-endurance aircraft is complicated because of the multifacetedinteraction between aerodynamics, structural weight, solar energy,
wind speed, and other disciplines and environmental models. The
complexity of sizing these kinds of aircraft makes the tradeoffs
between gas-powered and solar-powered architectures potentially
nonintuitive.
This paper presents a physics-based optimization model that uses
geometric programming as a systematic and rapid approach to
evaluate tradeoffs between the two architectures for a given mission.
Geometric programming, a form of convex optimization, is chosen as
a means of evaluating the design space because of its rapid solve time
and guaranteed convergence to a global optimum [5]. Models and
equations representing the interaction of the various disciplines are
expressed in a geometric programming form and are then combined
to form an optimization model. The optimization can be solved in a
fraction of a second and is used quantify to the feasible limits of the
solar-electric and gas-powered long-endurance aircraft.
The driving requirement that sizes solar-electric-powered aircraft
is the ability to operate atmultiple locations and during all seasons. To
fly multiple days, solar-electric-powered aircraft must carry enough
solar cells and batteries to fly during the day while storing enough
energy to fly through the night [6]. If this condition can be achieved
during thewinter solstice, when the solar flux is at a minimum, then a
solar-electric-powered aircraft can theoretically fly during any time
of the year for long durations [6]. This becomes more difficult to
achieve at higher latitudes as solar flux during the winter solstice
decreases. Additionally, to station keep, the aircraft must fly faster
than the local wind speeds. Wind speeds are a function of latitude,
altitude, and season and tend to increase at higher latitudes and during
winter months. Therefore, a key sizing study of solar-electric-
powered aircraft is the effect of latitude on aircraft size.
The key driving requirement for a gas-powered aircraft is
endurance. Because gas-powered aircraft are endurance-limited by
the amount of fuel that they can carry, longer endurance requiresmore
fuel and hence a larger aircraft. Because gas-powered aircraft are not
affected by the solar flux, their station-keeping ability at different
latitudes only depends on the local wind speed. If a gas-powered
aircraft can fly at the latitude with the worst wind speed, it can
theoretically fly anywhere else in the world.
Using this geometric programming methodology, tradeoffs
between different aircraft configurations, power sources, and
requirements can be calculated in seconds. The results show that
gas-powered aircraft can generally be built lighter and can fly faster
and can therefore fly at higher latitudes and in higher percentile
wind speeds. Solar-powered aircraft have greater endurance but are
limited operationally by their ability to reach higher speeds. The
presented optimization methodology can quantify the difference in
weight and endurance between and gas and solar-electric-powered
aircraft for the same set of requirements. Varying mission
requirements reveals how the best architecture changes depending
on the requirements.
II. Mission Requirements
A comparison of the gas and solar-electric-powered aircraft is
achieved by comparing their respective capabilities at satisfying a
common set of requirements shown in Table 1. These requirements
can and will be changed in Sec. VI to observe which architecture is
best suited to meet various sets of requirements. A discussion of each
requirement is included in this section.
Table 1 Mission requirements
Requirement Value
Payload 10 lbStation keeping 90% windsEndurance >5 daysSeason all seasonsAltitude >4600 mLatitude �30°
2 Article in Advance / BURTONAND HOBURG

A. Station Keeping
To station keep, an aircraft must fly at least as fast as thewind speed:
V ≥ Vwind (1)
Distributions ofwind-speed data [7] indicate that it is impractical for
long-endurance unmanned aerial vehicles to station keep in 100
percentile wind speeds. Therefore, the station keeping requirement is
parameterized by a percentile wind speed pwind, above which the
aircraft is allowed to drift off station. Thewind speed at a station is also
a function of latitude, altitude, season, or day of the year:
Vwind � f�ϕ; h;DOY; pwind� (2)
Wind-speed data were collected from the ERA Interim atmospheric
datasets for the years 2005–2015 [7]. It is assumed that thewind-speed
distribution is independent of longitude.To meet the season requirement, the solar-electric aircraft must be
able to fly a full day/night cycle on thewinter solstice. If it can do so, it
automatically exceeds the endurance requirement. To achieve this
design constraint, the aircraft must be able to fly with limited solar
energy, discussed in Sec. V.B, and with higher than average wind
speeds as shown in Fig. 1For long-endurance gas-powered aircraft, the endurance require-
ment is the amount of time the aircraft needs to remain in the air
without refueling. This is expected to be mostly independent of
season, except insofar as the wind speeds depend on season.Because wind speeds are greatest during the winter solstice for
both theNorthern and SouthernHemispheres, onlywind speeds from
December and June, respectively,will be used for the both the gas and
solar-electric-powered aircraft sizing and performance analysis.
B. Altitude
One altitude requirement is a minimum height required to meet a
certain coverage footprint:
h ≥ hmin (3)
Long-endurance aircraft tend to fly at low speeds, which based on
Fig. 2 means there are two possible operating altitude regiems: at or
around the minimum height requirement of 4600 m or at high
altitudes between 16,700 and 20,000 m. Gas-powered aircraft
generally fly in the lower altitude regime of 4600m because naturally
aspirated engines lose powerwith increased altitude and are unable to
reach altitudes higher than about 13,500 m. Solar-electric-powered
aircraft, which do not have naturally aspirated engines, will fly
around 18,000 m to avoid cloud coverage.
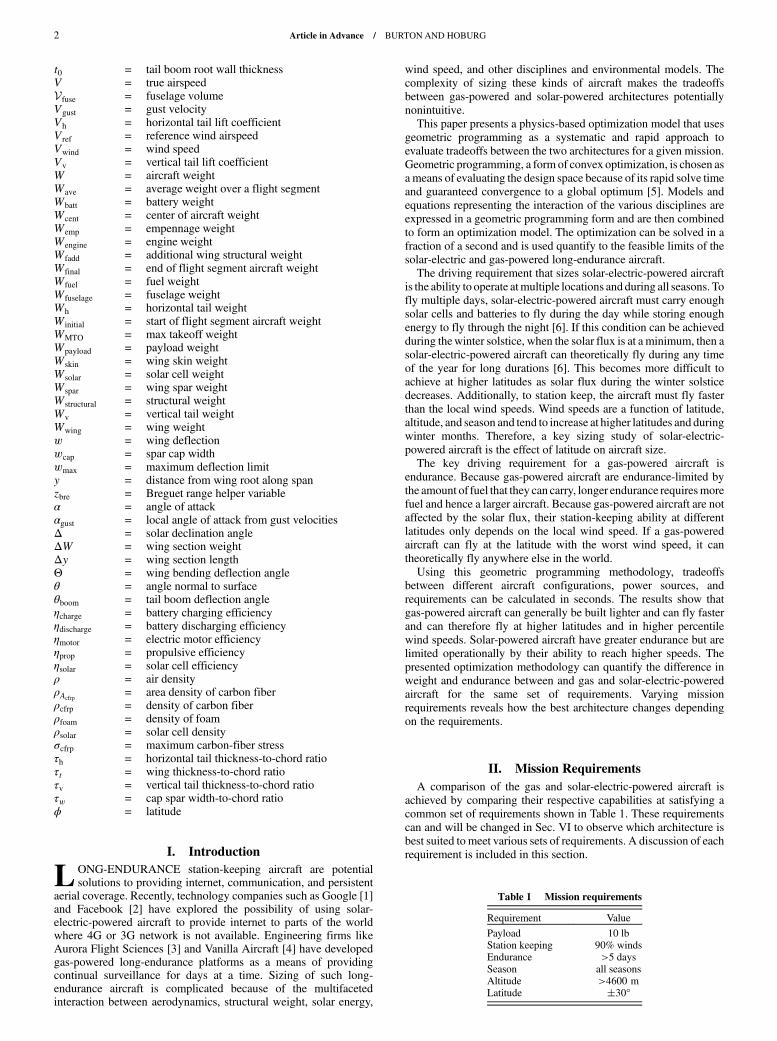
C. Latitude
It is assumed that long-endurance aircraft will have a requirementto be capable of operating anywhere within a band of latitudes. Forexample, an aircraft designed or optimized for the 35th latitudewouldbe able to operate at any latitude between�35°. Latitude affects boththe solar-electric and the gas-powered aircraft because wind speedvaries with latitude. Figure 3 shows how the wind speed varies withlatitude in the Northern Hemisphere in December.Latitude additionally affects the solar-electric-powered aircraft
because, at higher latitudes, there is less daylight and therefore lesssolar energy during the winter months. This is further discussed inSec. V.B.
III. Geometric Programming
Sizing long-endurance aircraft for the stated requirements wasaccomplished using geometric programming. Geometric programs(GPs) are a mathematical optimization problem characterized by theconvexity of the objective and constraint functions [5]. GPs have theform
minimize f0�x�subject to fi�x� ≤ 1; i � 1; : : : ; m (4)
gi�x� � 1; i � 1; : : : ; p (5)
a) +30° latitude b) -30° latitudeFig. 1 Winds peak at the winter solstice in Southern and Northern Hemispheres [7].
Fig. 2 Aircraftmust fly abovehmin tomeet altitude requirement. Bandsrepresent 80th, 90th, and 95th percentiles [7].
Article in Advance / BURTONAND HOBURG 3
where the functionsgimust bemonomial functions, and the functionsfi must be posynomial functions.Monomials and posynomials havethe forms
g�x� � cxa11 xa22 ; : : : ; xann (6)
f�x� �XKk�1
ckxa1k1 x
a2k2 ; : : : ; x
ankn (7)
The properties of a geometric program allow solution algorithmsto guarantee convergence to a global optimum, provided that thereexists a feasible solution to the set of constraint functions.Additionally, geometric programs can be solved rapidlywith existingalgorithms.Using state-of-the-art, standard interior-point algorithms,GPs with 1000 variables and 10,000 constraints converge to asolution in tens of seconds [5].To evaluate the gas and solar-electric-powered design space, the
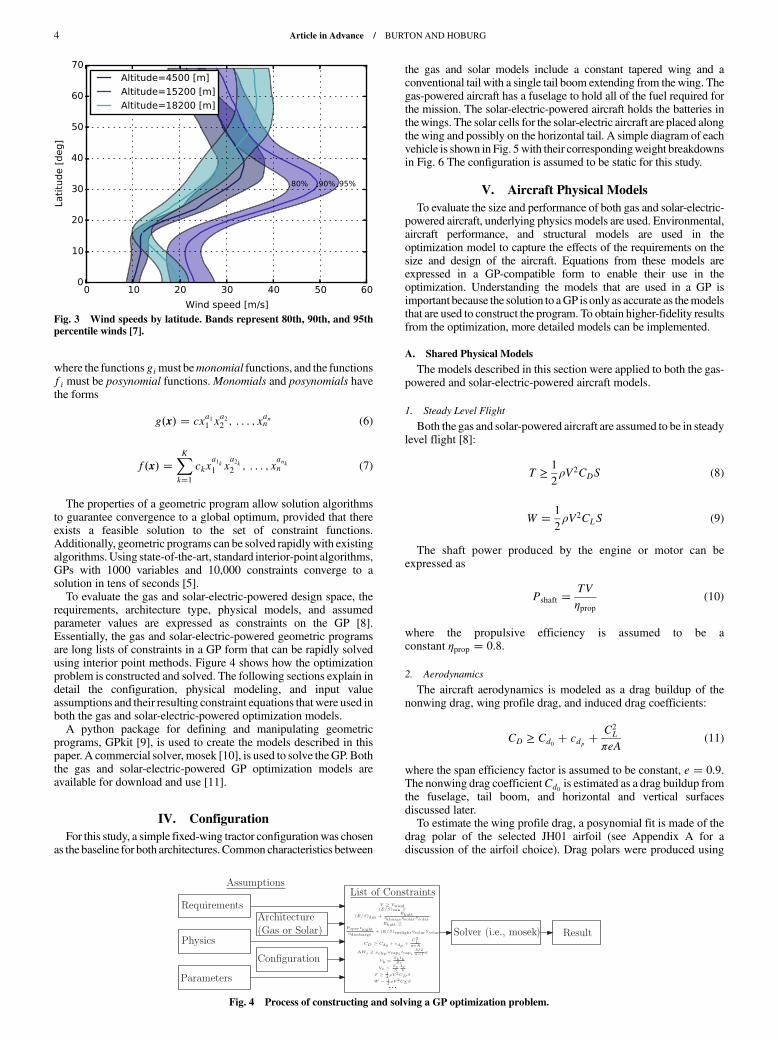
requirements, architecture type, physical models, and assumedparameter values are expressed as constraints on the GP [8].Essentially, the gas and solar-electric-powered geometric programsare long lists of constraints in a GP form that can be rapidly solvedusing interior point methods. Figure 4 shows how the optimizationproblem is constructed and solved. The following sections explain indetail the configuration, physical modeling, and input valueassumptions and their resulting constraint equations that were used inboth the gas and solar-electric-powered optimization models.A python package for defining and manipulating geometric
programs, GPkit [9], is used to create the models described in thispaper. A commercial solver, mosek [10], is used to solve theGP. Boththe gas and solar-electric-powered GP optimization models areavailable for download and use [11].
IV. Configuration
For this study, a simple fixed-wing tractor configurationwas chosenas the baseline for both architectures. Common characteristics between
the gas and solar models include a constant tapered wing and aconventional tail with a single tail boom extending from thewing. Thegas-powered aircraft has a fuselage to hold all of the fuel required forthe mission. The solar-electric-powered aircraft holds the batteries inthewings. The solar cells for the solar-electric aircraft are placed alongthe wing and possibly on the horizontal tail. A simple diagram of eachvehicle is shown in Fig. 5with their correspondingweight breakdownsin Fig. 6 The configuration is assumed to be static for this study.
V. Aircraft Physical Models
To evaluate the size and performance of both gas and solar-electric-powered aircraft, underlying physics models are used. Environmental,aircraft performance, and structural models are used in theoptimization model to capture the effects of the requirements on thesize and design of the aircraft. Equations from these models areexpressed in a GP-compatible form to enable their use in theoptimization. Understanding the models that are used in a GP isimportant because the solution to aGP is only as accurate as themodelsthat are used to construct the program. To obtain higher-fidelity resultsfrom the optimization, more detailed models can be implemented.
A. Shared Physical Models
The models described in this section were applied to both the gas-powered and solar-electric-powered aircraft models.
1. Steady Level Flight
Both the gas and solar-powered aircraft are assumed to be in steadylevel flight [8]:
T ≥1
2ρV2CDS (8)
W � 1
2ρV2CLS (9)
The shaft power produced by the engine or motor can beexpressed as
Pshaft �TV
ηprop(10)
where the propulsive efficiency is assumed to be aconstant ηprop � 0.8.
2. Aerodynamics
The aircraft aerodynamics is modeled as a drag buildup of thenonwing drag, wing profile drag, and induced drag coefficients:
CD ≥ Cd0 � cdp �C2L
πeA(11)
where the span efficiency factor is assumed to be constant, e � 0.9.The nonwing drag coefficientCd0 is estimated as a drag buildup fromthe fuselage, tail boom, and horizontal and vertical surfacesdiscussed later.To estimate the wing profile drag, a posynomial fit is made of the
drag polar of the selected JH01 airfoil (see Appendix A for adiscussion of the airfoil choice). Drag polars were produced using
Fig. 4 Process of constructing and solving a GP optimization problem.
Fig. 3 Wind speeds by latitude. Bands represent 80th, 90th, and 95thpercentile winds [7].
4 Article in Advance / BURTONAND HOBURG

XFOIL [12] at various Reynolds numbers, and the data were then fitto a posynomial equation (see Appendix B). The XFOIL drag polardata are compared to the posynomial fit in Fig. 7
3. Wing Spar Model
A wing spar is one of the primary structural elements of bothaircraft. A conservative approach to calculating the size of the spar isto assume that the spar carries all of the bending loads caused by thelifting loads andweight of the aircraft. It is assumed that there are twoout-of-plane bending cases to which both the gas-powered and thesolar-electric-powered aircraft are subject: standard wing bendingand gust loads.
a. StandardWing Bending Case. The distributed load along thewingis a combination of the lifting and weight distributions along the
wing. The wing loading distribution q�y� can be approximated as a
scaling of the local chord [13]:
q�y� ≈ Kqc�y� (12)
where y is the distance from the root wing location. The loadingconstant Kq [13] is defined as
Kq � NmaxWcent
S(13)
whereWcent is the sum of loads acting at the center of the aircraft, andthe safety load factor is an inputNmax � 5 (Nmax � 1 corresponds tosteady level flight). Using the equation for the local chord of a
Fig. 5 Configurations for the solar-electric and gas architectures.
Fig. 6 Representative weight breakdown of both aircraft optimization models.
Article in Advance / BURTONAND HOBURG 5

constant tapered wing [13] with a taper ratio λ � 0.5, the
precomputed distributed load
�q�y� ≡ q�y�bNmaxWcent
� 2
1� λ
�1� �λ − 1� 2y
b
�(14)
is input into a standard beam model to predict the bending moments
and deflections. The center weight Wcent for the gas-powered
aircraft is
Wcent ≥ Wfuel �Wfuselage �Wengine �Wpayload �Wemp (15)
The center weight for the solar-powered aircraft is
Wcent ≥ Wpayload �Wmotor �Wemp (16)
b. Gust Loading Case. Because long-endurance aircraft typicallyhave high-aspect-ratiowings, they are considered flexible aircraft. To
account for this flexibility and size a structural wing spar with
sufficient rigidity, a distributed gust lifting load is added to the steady
level flight loading distribution:
q�y� � NmaxWcent
b�c�y� � clααgust
1
2ρV2
S
b�c�y� (17)
�q�y� � q�y�bWcentNmax
≥ �c�y��1� clα
CL
αgust�y��1�Wwing
Wcent
��(18)
where �c�y� is precomputed before the optimization solve for a taper
ratio λ � 0.5. The safety load factor isNmax � 2 for the gust loadingcase. The weight of the wing for the gas-powered aircraft is assumed
to be the weight of the spar cap plus the weight of the skin:
Wwing ≥ Wspar �Wskin (19)
For the solar-electric-powered aircraft, the batteries and solar cells
are also included in the wing weight:
Wwing ≥ Wspar �Wskin �Wbatt �Wsolar (20)
The gust velocity is assumed to be vertical to the flight path such
that the local angle of attack is approximated by
αgust�y� � tan−1�Vgust�y�
V
�(21)
Because the arctan function is not GP-compatible, a monomial
approximation was calculated using techniques described by Hoburg
et al. [14]:
αgust�y� � 0.946
�Vgust�y�
V
�0.996
(22)
And it has an rms log-space error of 0.039 for Vgust∕V ∈ �0; 0.7�. Thegust velocity has an assumed profile along the wing [15]:
Vgust�y� � Vref
�1 − cos
�2y
b
π
2
��(23)
where the reference velocity is an assumed conservative value [15],
Vref � 10 m∕s. The gust velocity profile is computed before solve to
preserve GP compatibility.
c. Discretized Beam Model. Using a standard Bernoulli–Eulerdiscretized beam model with n � 5 nodes [13], the shear forces,
moments, angles, and deflections can be expressed in a GP-
compatible form using the distributed loads q�y� as an input:
Si�1 ≥ Si �qi�1 � qi
2Δy (24)
Mi�1 ≥ Mi �Si�1 � Si
2Δy (25)
Θi ≥ Θi�1 �1
2
�Mi
EIi�Mi−1
EIi−1
�Δy (26)
wi ≥ wi�1 �1
2
�Θi � Θi−1
2
�Δy (27)
where Young’s modulus of carbon fiber is E � 20 MPa. Boundaryconditions are zero shear forces and moments at the wing tips and
zero angle and deflection at the wing root [13].
d. Cap Spar for Bending Loads. A cap spar is considered for thesolar-electric and gas-powered aircraft. A cap spar has two carbon-
fiber caps separated by a foam core, as seen in Fig. 8.A thin shearweb
is wrapped around the caps and foam to prevent shearing and
buckling.The moment of inertia of the cap spar is modeled by only
considering the spar caps, not the foam interior. This conservative
assumption ismade because the contribution of the foamcore ismuch
less than that of the spar caps. The equation for the moment of inertia
[13] of a cap spar is
Fig. 7 Posynomial fit (solid lines) to XFOIL data (circles). Log-spacerms error � 0.00489.
Fig. 8 Cross-sectional view of a cap spar.
6 Article in Advance / BURTONAND HOBURG

I � wcapt3cap
6� 2wcaptcap
�hcap2
� tcap2
�2
(28)
This equation is not GP compatible. However, using a first-order
conservative approximation, the moment of inertia can be simplified
to be written in a GP-compatible form:
I ≤ 2wcaptcap
�hcap2
�2
(29)
There are also geometric constraints imposed on the width and
thickness. The total spar cap thickness cannot be greater than the
thickness of the airfoil cross section τt � 0.115. Thewidth of the sparcap is assumed no greater than 30% of chord τw � 0.3:
c�y�τt ≥ hcap � 2tcap (30)
c�y�τw ≥ wcap (31)
To match the discretized beam model, the spar cross section can
also be written in a discretized form such that each section has a
unique width and thickness:
Ii ≤ 2wcapitcapi
�hcapi2
�2
(32)
c�y�τt ≥ hcapi � 2tcapi (33)
c�y�τw ≥ wcapi(34)
The wing spar at each section root must be strong enough to
withstand the bending moment and stiff enough to not exceed some
deflection limit. Both constraints are imposed in the optimization
model as
σcfrp ≥ Mi
hcapi � tcapiIi
(35)
wn ≤ wmax (36)
where the ultimate tensile strength for unidirectional carbon fiber is
σcfrp � 1700 MPa [16]. The tip deflection is constrained to be less
than 20% of the half-span, wmax∕�b∕2� � 0.2.Finally, the weight of the spar cap is computed as
ΔWi ≥ ρcfrpwcapitcapi
b∕2n − 1
g (37)
Wspar ≥ 2Xn−11
ΔWi (38)
where ρcfrp � 1.6 g∕cm3 [17].
4. Additional Wing Weight
It is assumed that thewing skin is made of carbon fiber. Theweight
of the wing skin is
Wskin ≥ 2ρAcfrpSg (39)
where ρAcfrp� 0.049 g∕cm2, or approximately the area density of
one ply of carbon fiber [17]. The wing skin is assumed not to
contribute to the bending stiffness.
Additional wing weight Wfadd accounts for additional structural
weight (ribs, rear spar, actuators, etc.):
Wfadd ≥ �Wspar �Wskin�mfac (40)
where mfac � 1.2.
5. Empennage
An empennage model is added to both the solar-electric and gas-
powered aircraft models. The empennage model consists of a single
tail boom, horizontal tail, and vertical tail. The empennage adds both
weight and drag to each aircraft.The tail boom has an optimized diameter d, root wall thickness t0,
root moment of inertia I0, modulus E � 150 GPa [16], density
ρcfrp � 1.6 g∕cm3 [16], and length lh. The total mass and root
bending inertia are imposed in the optimization model as
m ≥ πρcfrpt0dlh
�1 −
1
2k
�(41)
I0 ≤ πt0d3∕8 (42)
where the index k � 0 corresponds to a uniform wall thickness and
stiffness, and k � 1 corresponds to a linear drop-off to zero. For boththe solar-electric and gas-powered aircraft, k � 0.8 is assumed.
When the tail boom is loaded at the end point x � lh, by the
horizontal tail lift Lh, the end deflection angle follows from standard
beam analysis:
θ ≥Lhl
2h
EI0
1� k
2(43)
Lh �1
2CLh
ρV2Sh (44)
The horizontal tail is sized to satisfy a horizontal tail volume
coefficient condition Vh � 0.45 [18]:
Vh �ShlhSc
(45)
The vertical tail is sized to meet a conservative tail volume
coefficient Vv � 0.04 [18]:
Vv �SvS
lvb
(46)
where lv is the vertical tail moment arm, assumed to be equal to the
horizontal tail moment arm, lv � lh.Both the horizontal and vertical tails are assumed to have a carbon-
fiber skin and solid foam interior, where their respective densities are
ρAcfrp� 0.049 g∕cm2, ρfoam � 1.5 lbf∕ft3. The weight of the tails is
W�v;h�∕mfac � ρfoamS2�v;h�b�v;h�
�A� gρAcfrpS�v;h� (47)
where bh and bv are the spans of the horizontal and vertical tails,
respectively, and �A is the cross-sectional area of the NACA 0008
airfoil. The margin factor mfac � 1.1 is included to account for
control surfaces, attachment joints, actuators, etc.The drag of the empennage was modeled as three separate parts
with no interference drag. The drag of the tail boom is calculated
using a turbulent flat-plate model:
Dboom ≥1
2CfρV
2lhπd (48)
Article in Advance / BURTONAND HOBURG 7

Cf ≥0.445
Re0.3boom
(49)
Reboom � Vρlhμ
(50)
The drag of the horizontal and vertical tails is computed using a
GP-compatible fit of XFOIL data for a range of Reynolds numbers
andNACAairfoil thicknesses, where the selected airfoil is theNACA
0008 for both the horizontal and vertical tails (i.e., τ�v;h� � 0.08). TheXFOIL data were generated for a zero angle of attack, based upon
steady level flight where neither surface is generating lift.
B. Solar-Electric Aircraft Physical Models
1. Wind Speeds
There exists an optimum flight altitude for solar-electric-powered
aircraft. The local minimum in wind speed around 19,000 m and the
variation of air density with altitude suggest that the altitude should
be an output of the optimization. To accomplish this, constraints
relating wind speed to altitude are imposed. This approach assumes
that the solar-electric-powered aircraft will not be confined to fly at a
single altitude but will fly at the altitude where conditions are most
favorable.Because wind speeds do not increase monotonically with latitude,
it is possible that the design for a given latitude is constrained by
winds at a latitude inside the required latitude band. To handle this, a
multipoint set of latitude constraints is imposed. Thewind-speed data
used to generate these equations includeDecember wind speeds from
the Northern Hemisphere and June wind speeds from the Southern
Hemisphere for the years 2005–2015. In total, 41 wind-speed
constraints were generated to represent �20–60° each with a log-
space RMS error of less than 5% (see Appendix B).For the gas-powered aircraft, the altitude is not optimized. Gas-
powered aircraft, which are naturally aspirated, will be less efficient
at higher altitudes. Additionally, wind speeds increasemonotonically
from sea level up to ∼9100 m. Therefore, the altitude for gas-
powered aircraft is determined as the minimum altitude necessary for
the payload to be effective [3]. For this sizing study, the altitude
requirement for the gas-powered aircraft is hmin � 4500 m,
corresponding to a 100-km-diam footprint with a 5 deg lookup angle.
2. Solar-Electric Power
At a given time of year DOY and latitude ϕ, there exists an
available solar irradiated energy �E∕S�sun per unit area during one
day:
�E∕S�sun � f�ϕ;DOY� (51)
To operate continually for multiple days, the total available solar
energy �E∕S�sun must be greater than the required preconversion-
efficiency solar energy per unit area to power the aircraft during the
day �E∕S�day and the energy required to power the aircraft during thenight via batteries Ebatt [6]:
�E∕S�sun ≥ �E∕S�day �Ebatt
ηchargeηsolarSsolar(52)
Ebattηdischarge ≥ Popertnight � �E∕S�twilightηsolarSsolar (53)
where the charge, discharge, and solar cell efficiencies are assumed to
be ηcharge � ηdischarge � 0.98 and ηsolar � 0.22. An additional energyterm �E∕S�twilight is included in Eq. (53) to account for hours of lowsolar irradiance, during mornings and evenings, when the aircraft
must continue to fly on partial battery power. Equations (52) and (53)
are graphically represented in Fig. 9, which represents the solar
energy at 30° latitude.
In order for the aircraft to begin charging batteries, there must be a
minimum solar irradiance power:
�P∕S�min �Poper
ηsolarSsolar(54)
ηmotorPoper ≥ Pshaft � Pavionics (55)
where ηmotor � 0.95. Thus, for a given latitude and day, and thereforetotal solar energy �E∕S�sun, both �E∕S�day and �E∕S�twilight are
functions of �P∕S�min. The total solar energy available �E∕S�sun is
computed before the optimization solve and is used to generate
monomial approximations for �E∕S�day and �E∕S�twilight as functions�P∕S�min, one for each degree of latitude between 20 and 60° latitude.
�E∕S�sun, �E∕S�day, �E∕S�twilight, and tnight are precomputed using the
formulas in Appendix C to generate the fitted equations.For the purposes of this design study, it is assumed that the solar
cells are placed on the wing and the horizontal tail but not on the
vertical tail. The fractional solar cell area index fsolar is 1 when the
solar cells completely cover the main wing and greater than 1 if solar
cells are also placed on the horizontal tail:
Ssolar ≤ fsolarS (56)
3. Motor Weight
The solar-electric-powered aircraft has a motor whose weight is
based on the approximation [19]
Pmax � BPMmmotor (57)
where mmotor is the motor mass, Pmax ≥ Poper is the maximum
operating power, and the assumed power-to-mass ratio
is BPM � 4140.8 W∕kg.
C. Gas-Powered Aircraft Physical Models
1. Breguet Endurance
Akey sizing equation for a long-endurance gas-powered aircraft is
the Breguet range equation. For GP compatibility and to optimize
endurance, not range, a variation of the Breguet range equation is
used:
t � Wave
PshaftBSFCgln�W initial
Wfinal
�(58)
This version comes from assuming that BSFC and the power-to-
weight ratio �Pshaft∕W� are constant during the considered flight
Fig. 9 Solar power on 21 December at 30° north. Twenty-four-houroperationality achieved when �E∕S�sun area exceeds area under�P∕S�min.
8 Article in Advance / BURTONAND HOBURG

segment. One way to obtain a constant power-to-weight ratio is a
constant velocity and constant lift coefficient [20]. The segment
weight Wave is assumed to be the geometric mean, defined as
Wave ��������������������������W initialWfinal
p(59)
To make Eq. (58) GP-compatible, a Taylor expansion is used [8]:
zbre ≥PshafttBSFCg
W(60)
Wfuel
Wfinal
≥ zbre �z2bre2
� z3bre6
� z4bre24
� : : : (61)
Equations (60) and (61) are monomial and posynomial,
respectively, and therefore GP-compatible. For long-endurance
aircraft, missions can last days, causing the power-to-weight ratio
�Pshaft∕W� to vary significantly during the course of the flight.
Equations (9), (60) and (61) can be discretized to account for this:
�����������������WiWi�1
p � 1
2ρiV
2i CLi
S (62)
zbrei ≥Pshafti
tiBSFCg�����������������WiWi�1
p (63)
Wfueli
Wi�1
≥ zbrei �z2brei2
� z3brei6
� z3brei24
(64)
For evaluation of long-endurance, gas-powered aircraft, a
discretization of N � 5 was used.
2. Elliptical Fuselage
For the gas-powered aircraft, it is assumed that the fuel is carried in
an elliptically shaped fuselage. The fuselage will increase the overall
weight and drag of the aircraft. The solar-electric-powered aircraft is
assumed to carry the batteries in the wings and will therefore have a
small fuselage whose effects will be ignored.The driving constraint for the size of the fuselage is to ensure that
all of the fuel required for the mission can fit inside the fuselage:
Vfuse ≥Wfuel
ρfuel(65)
where the fuel is assumed to have a density ρfuel � 6.01 lbf∕gal. Thedimensions of the fuselage are constrained by
Vfuse ≤4
3πlfuse2
R2fuse (66)
where lfuse is the length of the fuselage, and Rfuse is the radius. Using
the length and radius, the surface area can be calculated using
Thomsen’s approximation [21]:
3
�Sfuseπ
�1.6075
≥ 2�2lfuseRfuse�1.6075 � �4R2fuse�1.6075 (67)
The weight of the fuselage is constrained by
Wfuse ≥ SfuseρAcfrpg (68)
where ρAcfrp� 0.0975 g∕cm2, or the area density of two plies of
carbon fiber [17]. The surface area is also used to calculate the drag
assuming a skin-friction-based drag model:
Dfuse ≥ Cfkfuse1
2ρV2Sfuse (69)
Cf ≥0.455
Re0.3(70)
where kfuse is the form factor approximated by [22]
kfuse ≥ 1� 60
�lfuse∕2Rfuse�3� �lfuse∕2Rfuse�
400(71)
3. Engine Weight
The engine weight of the gas-powered aircraft is governed by a
simple power law derived from existing two-stroke and four-stroke
engines [23]:
Wengine
Wengine-ref
� 1.27847
�PSL-max
Pref
�0.772392
(72)
where Wengine-ref � 10 lbs and Pref � 10 hp. Equation (72) is
compared to the data in Fig. 10.
4. Gas-Powered Engine Performance
Two characteristics of gas engines affect the performance of long-
endurance aircraft. The first is brake specific fuel consumption
(BSFC); a lower BSFC will result in increased endurance. The
Fig. 10 Power law fit to University of North Dakota engine weight data[23] (log-space rms error � 0.34).
Fig. 11 Representative engine performance fit based on RCV EngineLtd data (log-space rms error � 0.007).
Article in Advance / BURTONAND HOBURG 9

second is the lapse rate. Assuming a propeller driven aircraft and anaturally aspirated engine, as the aircraft reaches higher altitudes, theenginewill have decreased available power. To account for these twoeffects, a two-stroke, double-cylinder engine, the DF70 from RCVEngines Ltd, England, was selected as a representative engine. RCVEngines Ltd provided manufacturing data that were used to generaterepresentative performance curves.‡ It is assumed that engines of asimilar size will perform similarly to the DF70 engine. This engineperformance model is only valid for internal combustion engines.To capture throttling effects as aircraft weight decreases, a GP-
compatible curve was generated from the DF70 data to relate BSFCand shaft power (Fig. 11). Using this approximation, the requiredshaft power determines the BSFC. A comparison of the DF70 dataprovided by RCVEngine Ltd in Fig. 11 to theBSFC to power curvesin Goering et al. [25] verifies that this performance curve isrepresentative of engines of similar sizes.The lapse rate Leng�h� ≤ 1 is assumed to affect the maximum
power output:
Leng�h� ≡Pmax
PSL-max
(73)
The lapse is calculated from the required flight altitude h �4500 m before the optimization solve using an approximate engineloss rate for normally aspirated engines of 3.5% hp per 300 m [26]:
Leng�h� � 1 −0.035
300 mh (74)
5. Climb Constraints
Because the gas engine is naturally aspirated, as the aircraft climbs,there will be less available power. The climb constraint ultimatelysizes the engine because, at the top of climb,when the least amount ofpower is available, the engine must provide the necessary power tomeet a minimum climb rate,
_hmin ≥ 30 m∕min (75)
The climb rate affects the required thrust and therefore the requiredpower during climb:
T ≥1
2CDρV
2S�W_hmin
V(76)
where W is the weight of the aircraft during climb.
VI. Results
The gas and solar-electric-powered aircraft optimization modelswere solved by minimizing the takeoff weight for the requirementslisted in Table 1 and the assumptions and key design parametersdescribed herein. The solar-electric-powered optimization model
Table 2 Solar-electric-powered aircraft design variables
25° latitude 30° latitude 25° latitude 30° latitude
Variable 85th percentile winds 85th percentile winds 90th percentile winds 90th percentile winds
WMTO, lbf 81.7 88.8 143 195b, ft 46.6 48.6 62.2 71.4A 28.9 28.8 27.6 26.9Wwing, lbf 20.2 22.1 38.4 52.5Wbatt, lbf 36.1 39.5 61.4 83Wsolar, lbf 4.14 4.53 7.75 10.5CL 1.19 1.19 1.12 1.09CD 0.0396 0.039 0.0344 0.032h, m 1.68e� 04 1.7e� 04 1.72e� 04 1.75e� 04
Table 3 Gas-powered aircraft design variables
VariableFive-dayendurance
Seven-dayendurance
Nine-dayendurance
WMTO, lbf 72.3 118 288b, ft 14.5 18.6 28.8A 24.6 24.7 24.7Wfuel, lbf 37.6 74.3 210Wwing, lbf 4.24 7.96 25Wengine, lbf 8.68 11.7 20.6
BSFC, kg∕h-kW 0.318 0.321 0.331CL 0.812 0.767 0.738CD 0.0305 0.027 0.0226
Fig. 12 Gas architecture feasible for all latitudes. Next integer latitude
for each solar-electric curve is infeasible.
Fig. 13 Endurance and size trade study for gas-powered architecture.
‡“RCVDF35. 20 × 8Zinger Prop. StaticOperation,”RCVEngines, privatecommunication, April 2016.
10 Article in Advance / BURTONAND HOBURG

had 375 unknowns and was solved in 0.164 s for a maximumtakeoff weight of 194.7 lbs. The gas-powered aircraft optimizationmodel had 552 unknowns and was solved in 0.144 s for a max
takeoff weight of 72.3 lbs. Key design variables for both
architectures are listed in Tables 2 and 3 for various mission
requirements. The rest of this section explores how these result mayvary for different requirements, input parameter values, and physics
modeling assumptions.
A. Changing Requirements
Important tradeoffs between the gas-powered and solar-electric-
powered architectures are highlighted and quantified by changing thelatitude and endurance requirements. Both optimizationmodels were
solved byminimizing themax takeoff weight across different latitude
requirements. Figure 12 shows this result evaluated at the 80th, 90th,
and 95th percentile wind speeds. The gas-poweredmodel was solved63 times in 5.6178 s total, and the solar-electric-powered model was
solved 31 times in 2.5529 s total to produce Fig. 12One way to interpret Fig. 12 is that a solar-powered aircraft
weighing 190 lb is able to operate between �28° latitude in 90thpercentile wind speeds. This analysis shows that gas-powered
architectures are able to operate in more locations than solar-electric-
powered aircraft. On the other hand, solar-electric-powered aircraft
design becomes infeasible at higher latitudes because, even though
wind speeds peak around 42° latitude at 18,300m, the combination oflower solar flux and higher wind speeds makes it difficult to reach
latitude bands greater than�30°.
Fig. 14 Contours of latitude. Reaching higher latitudes requires bettersolar cells and batteries.
a) 35th Latitude, pwind = 0.80
d) 30th Latitude, pwind = 0.80
g) 25th Latitude, pwind = 0.80 h) 25th Latitude, pwind = 0.85 i) 25th Latitude, pwind = 0.90
e) 30th Latitude, pwind = 0.85 f) 30th Latitude, pwind = 0.90
b) 35th Latitude, pwind = 0.85 c) 35th Latitude, pwind = 0.90
Fig. 15 Matrix of minimum wing span solar-electric aircraft designs. Values of assumed constants are given throughout the text.
Article in Advance / BURTONAND HOBURG 11

Although the solar-electric-powered aircraft may be limited
operationally by higher latitudes, it is not limited in endurance as is
the gas-powered aircraft. Solving the gas-powered optimization
model for different endurance requirements shows where the gas-
powered architecture becomes less feasible. Figure 13 shows the
endurance versus size analysis for a gas-powered aircraft by
minimizing maximum takeoff weight for an aircraft capable of flying
at any latitude. Figure 13 was generated using 29 separate
optimization solutions that took a total of 2.403 s to solve.
B. Changing Parameter Values
The previous results are dependent on the assumed input valuesand parameters. Changing parameter values can help showwhere the
designs becomes infeasible. As one example, two input values thatare especially important to the solar aircraft are the solar cellefficiency and battery specific energy. By solving the model fordifferent assumed solar cell efficiency and battery specific energyvalues, a broader picture of the design space is achieved. Figure 14shows contours of latitude for a given solar cell efficiency and batteryenergy density. Put another way, this plot shows how good the solarcells and batteries must be to reach a given latitude. Figure 14 wasproduced using 157 separate optimization solutions that took a totalof 14.379 s to solve.Figure 15 shows a matrix contour map of the solar-electric-
powered aircraft wing spans for multiple solar cell efficiencies,battery energy densities, latitudes, and percentile wind speeds. Eachpoint in Fig. 15 is a unique design for minimum wing span. Theinfeasible regions and contour shapes would change for differentassumed constant values.
C. Changing Physical Modeling Assumptions
Insight into the design space can also be gained by changing thephysical modeling assumptions. For example, by altering the aircraftstructural model, it can be observed how air density trades for wingweight. It might be assumed that because the wind speeds are lowestat 20,400 m at 29° latitude, the aircraft will always fly at 20,400 m. Ifit is assumed that the structural weight of the aircraft can be modeledas a fraction of the total weight
Wstructural ≥ WMTOfstructural (77)
where fstructural � 0.35, then the optimized flight altitude is almostexactly 67,000 ft, as shown in Fig. 16. However, if the structuralweight is represented by the more detailed model as explained inSec. V, larger wings have a weight penalty, and the optimizationtrades air density for wing weight. Therefore, by adding a structuralmodel, the optimization seeks a smaller wing to save weight andoperates at a lower altitude to increase density.Another interesting result is the operating lift-to-drag ratio for the
gas-powered aircraft. The optimum lift-to-drag ratio to maximizeendurance for gas-powered aircraft is at the maximumC1.5
L ∕CD [20].However, while station keeping, the aircraft will maintain a constant
Fig. 16 Comparison of simplified and detailed structural modelshighlights trade between wing weight and air density.
Fig. 17 Wind-speed constraint moves lift-to-drag ratio off maximum�C1.5
L ∕CD� point (plus signs). Solid lines are drag polars.
Table 4 Solar-electric-powered aircraft sensitivities
25° latitude 30° latitude 25° latitude 30° latitude
Variable 85th percentile winds 85th percentile winds 90th percentile winds 90th percentile winds
ηprop −4.03 −4.42 −8.45 −14.4ηdischarge −3.36 −3.68 −6.88 −11.6tnight 3.16 3.46 6.5 11hbatt −2.59 −2.81 −4.79 −7.88ηsolar −1.43 −1.59 −3.63 −6.45�E∕S�sun −1.26 −1.41 −3.34 −5.97pwind 1.17 1.97 3.49 8.59ηcharge −0.774 −0.866 −2.09 −3.73Wpay 0.732 0.727 0.798 0.974ρsolar 0.297 0.323 0.605 0.995
Table 5 Gas-powered aircraft sensitivities (90th percentile winds)
VariableFive-dayendurance
Seven-dayendurance
Nine-dayendurance
Vwind 1.31 2 3.6ηprop −1.23 −1.89 −3.61BSFC100% 1.19 1.84 3.51tloiter 1.17 1.82 3.49Wpay 0.294 0.235 0.164Nmax 0.0788 0.131 0.31
12 Article in Advance / BURTONAND HOBURG

velocity during high wind speeds. At a constant velocity or constantReynolds number, the lift-to-drag ratio will not be at the maximumC1.5L ∕CD. If it is assumed that wind speeds are negligible or that
station keeping is not important, then velocity will be optimized suchthat the lift-to-drag ratio is at the maximum C1.5
L ∕CD, as shownin Fig. 17
D. Sensitivities
When a GP is solved, the sensitivity of the optimal objective valuewith respect to each constraint is also returned. From thisinformation, the sensitivity of the optimal objective value to eachfixed variable can be extracted [8]. Although sensitivities are localand therefore only exact for small changes, they provide usefulinformation about the relative importance of various designvariables.For example, if the objective function wereWMTO and the sensitivityto battery specific energywere 0.5, then a 1% increase in the solar cellefficiency would result in a 0.5% increase in weight. Tables 4 and 5show the variables with the highest sensitivities for the solar-electricand gas-powered architectures, respectively, where the objective wasmax takeoff weight.For the solar-electric aircraft, it is interesting to note that the battery
discharge efficiency sensitivity is higher than the battery chargeefficiency sensitivity. This occurs because the discharge efficiencydirectly affects the required battery size, whereas the chargeefficiency only does so indirectly.
VII. Conclusions
Using geometric programming, the feasibility limits of solar-electric and gas-powered aircraft were analyzed to a level of detailand speed not previously achieved in conceptual sizing studies.Based on the assumptions included herein, the gas-powered aircraft ismore capable of meeting high latitude and station-keepingrequirements. The solar-electric-powered aircraft sizing does notconverge at latitude requirements above 31° latitude. However, solar-electric-powered aircraft can meet high endurance and altituderequirements. The effects of key design parameters on the size of eacharchitecture were also quantified. Using higher-energy-densitybatteries can result in significant weight and performance savings forthe solar-electric-powered aircraft.
Appendix A: Discussion on the Use of the JH01 Airfoil
The sd7032 airfoil was redesigned to prevent drag creep byweakening the pressure spike associatedwith premature separation athigher Reynolds numbers. Figure A1 shows the pressuredistributions generated in XFOIL of the JH01 airfoil at CL � 0.0and CL � 1.35 with Re � 3 × 10⁵. The redesigned airfoil wasnamed JH01. We would like to thank Mark Drela for the redesign.
Appendix B: Convex Fitted Functions
Some constraints in this optimization study are convex equationsthat approximate data or other functions. These equations includewind speed versus air density, airfoil drag polar, tail drag polar, BSFCto throttle mapping, and arctan equations. Each of these equationswas generated using the fitting techniques described by Hoburg et al.[14]. All fitted equations are either max-affine or softmax-affinefunctions:
fMA�x� � maxk�1; : : : ;K
�bk � xTKx� (B1)
fSMA�x� �1
αlog
XKk�1
exp�α�bk � aTk x�� (B2)
The log-space rms error,
RMS error ≡
���������������������������������������1
m
Xmi�1
�f�xi� − yi�2s
(B3)
is given throughout the paper for each equation, where m is thenumber of data points.Bounds are imposed inside the optimization to ensure that the
optimizer does not find a solution that exceeds the range over whichthe data were fitted. In the case of the wing and tail drag polar fittedequations, a postsolve process runs XFOIL and verifies that theoptimized drag for a given lift coefficient and Reynolds number iswithin 5% of the XFOIL computed drag.
Appendix C: Solar Energy Calculations
The total available solar energy per day is an integral of theavailable solar power during the course of the day:
�E∕S�sun �Z
tsunset
tsunrise
�P∕S�sun dt (C1)
For simplicity, energy and powerwill refer to energy and power perunit area throughout the rest of this section, i.e., �P∕S� � P. Thesolar irradiated power Psun is a function of θ, the angle between thenormal to the flat surface, or aircraft wing, and the sun beam [27]:
Psun � P0 cos θ (C2)
The angle θ depends on the time of day t, latitude ϕ, anddeclination angle Δ [27]:
a) CL = 0.0 b) CL = 1.35
Fig. A1 Pressure coefficient plots at the minimum and maximum expected CL at Reynolds number Re � 3 × 10⁵.
Article in Advance / BURTONAND HOBURG 13

cos θ � sinΔ sinϕ� cosΔ cosϕ cos 2πt∕24 (C3)
The declination angle Δ can be found using the relation [27]
Δ� 0.006918− 0.399912cosβ� 0.070257sinβ− 0.006758cos2β
� 0.000907sin2β− 0.002697cos3β� 0.00148sin3β (C4)
where β � 2π�DOY − 1�∕365. The time of day tday and the time ofnight tnight can be calculated using a derivation of Eq. (C3) [27]:
cos�πtsunrise∕12� � − tanΔ tanϕ (C5)
tsunrise � −tsunset (C6)
tday � 2tsunrise (C7)
tnight � 24 − tday (C8)
where noon is t � 0. Both tday and tnight affect the battery size asdefined in Eqs. (52 and 53). The solar power available, assuming noinclination angle P0, is found using the eccentricity of the Earth’sorbit:
P0 � Psun surface
R2sun
R2earth orbit
(C9)
Rearth orbit � r0
�1� 0.017 sin
�2π
DOY − 93
365
��(C10)
where Psun surface is the power emitted at the sun’s surface, Rsun is theradius of the sun,Rearth orbit is the distance from the Earth to the sun, r0is the average distance from the Earth to the sun, and 0.017 is theeccentricity of the Earth–sun orbit.Using a trapezoidal integration of Eq. (C1), the total available solar
energy per unit area can be obtained for a given latitude and day of theyear. Because the equations in this appendix are not GP compatible,the total solar energy per unit area per day, the length of the day,and the length of the night are calculated from the latitude and the dayof the year before an optimization solve.
References
[1] Barr, A., and Albergotti, R., “Google to Buy Titan Aerospace as WebGiants Battle for Air Superiority,” Wall Street Journal, 2014.
[2] Zuckerberg, M., “The Technology Behind Aquila,” July 2016, https://www.facebook.com/notes/mark-zuckerberg/the-technology-behind-aquila/10153916136506634 [retrieved 3 Nov. 2016].
[3] “Orion:Medium-Altitude Long-EnduranceUnmannedAircraft,” http://www.aurora.aero/orion/ [retrieved 3 Nov. 2016].
[4] Hatfield, D., Bale, P., and Barnes, P., “The VA001 Aircraft,” VanillaAircraft, LLC, 2016, http://www.vanillaaircraft.com/VA001.html[retrieved 3 Nov. 2016].
[5] Boyd, S., Kim, S.-J., Vandenberghe, L., and Hassibi, A., “ATutorial onGeometric Programming,”Optimization andEngineering, Vol. 8, No. 1,2007, pp. 67–127.doi:10.1007/s11081-007-9001-7
[6] Abbe, G., and Smith, H., “Technological Development Trends inSolarpowered Aircraft Systems,” Renewable and Sustainable Energy
Reviews, Vol. 60, July 2016, pp. 770–783.
doi:10.1016/j.rser.2016.01.053[7] Dee,D., Uppala, S., Simmons,A., Berrisford, P., and Poli, P., et al., “The
ERA-Interim Reanalysis: Configuration and Performance of the DataAssimilation System,” Quarterly Journal of the Royal Meteorological
Society, Vol. 137, No. 656, John Wiley & Sons, Ltd., Hoboken, NJ,2011, pp. 553–597.doi:10.1002/qj.828
[8] Hoburg, W., “Aircraft Design Optimization as a Geometric Program,”Ph.D. Thesis, Univ. of California, Berkeley, CA, 2013.
[9] Burnell, E., and Hoburg, W., “GPkit Software for GeometricProgramming,” Software Package, Ver. 0.5.2, 2017, https://github.com/hoburg/gpkit [retrieved 7 Sept. 2016].
[10] “The MOSEK C Optimizer API Manual,” Ver. 7.1, Rev. 41, MOSEKApS, 2015.
[11] Burton, M., “Gas/Solar Trade,” April 2017, https://github.com/hoburg/gas_solar_trade [retrieved 30 Sept. 2016].
[12] Drela, M., XFOIL: An Analysis and Design System for Low Reynolds
Number Airfoils, Springer, Berlin, 1989, pp. 1–12.[13] Drela, M., “Wing Bending Calculations,” Massachusetts Inst. of
Technology, https://ocw.mit.edu/courses/aeronautics-and-astronautics/
16-01-unified-engineering-i-ii-iii-iv-fall-2005-spring-2006/systems-
labs-06/spl10.pdf [retrieved 4 Oct. 2016].[14] Hoburg,W., Kirschen, P., and Abbeel, P., “Data Fitting with Geometric-
Programming-Compatible Softmax Functions,” Optimization and
Engineering, Springer, New York, 2016, pp. 897–918.[15] Duven, J. E., “Dynamic Gust Loads,” U.S. Dept. of Transportation,
Advisory Circular 25.341-1, Washington, D.C., Dec. 2014.[16] “Properties of Carbon Fiber,” Clearwater Composites, 2017,
http://www.clearwatercomposites.com/resources/Properties-of-carbon-fiber [retrieved 6 April 2017].
[17] “Carbon andKevlar Fabrics,”Fiberglass Supply,May2016, http://www.fiberglasssupply.com/Product_Catalog/Reinforcements/Carbon_and_
Kevlar/carbon_and_kevlar.html [retrieved 6 April 2017].[18] Drela, M., “Basic Aircraft Design Rules,” Massachusetts Inst. of
Technology, April 2006, https://ocw.mit.edu/courses/aeronautics-and-
astronautics/16-01-unified-engineering-i-ii-iii-iv-fall-2005-spring-2006/
systems-labs-06/spl8.pdf [retrieved 20 Nov. 2016].[19] Mauro Gatti, F. G., “Preliminary Design Analysis Methodology for
Electric Multirotor,” Proceedings of the 2nd IFAC Workshop on
Research, Education and Development of Unmanned Aerial Systems,
Vol. 46, Elsevier B.V., Amsterdam, The Netherlands, Nov. 2013,
pp. 58–63.[20] Lutze, F. H., “AOE 3104 Vehicle Performance,” Department of
Aerospace and Ocean Engineering, Virginia Polytechnic Instituteand State Univ., http://www.dept.aoe.vt.edu/~lutze/AOE3104/range&endurance.pdf [retrieved 10 Dec. 2016].
[21] Heckman, K., “Ellipsoid–SurfaceArea,”Nov. 2016, https://www.vcalc.com/wiki/vCalc/Ellipsoid+-+Surface+Area.
[22] Raymer,D. P.,Aircraft Design: AConceptual Approach, 4th ed., AIAA,Reston, VA, 2006, pp. 117–152.
[23] “Engine Reference,” Univ. of North Dakota, Feb. 2016, http://media.aero.und.edu/uasresearch.org/documents/195-197_Reference-Section_Engines.pdf [retrieved 4 May 2016].
[25] Goering, C. E., Stone, M. L., Smith, D. W., and Turnquist, P. K., Off-RoadVehicle Engineering Principles, American Society ofAgriculturalEngineers, St. Joseph, Mich., 2003, Chap. 2.
[26] Hoover, A. L., “Density Altitude and Aircraft Performance,” YakimaChapter—Washington Pilots Association, https://yakimawpa.files.
wordpress.com/2011/01/density-altitude-and-aircraft-performance-
handout.pdf [retrieved 19 Oct. 2016].[27] McMordie,R.K., SolarEnergyFundamentals, Fairmont PrintingPress,
Fairfield, OH, 2012, pp. 1–27.
14 Article in Advance / BURTONAND HOBURG