Social Europe The EU approach Measuring poverty and social exclusion in support of policy making.
48
Social Europe The EU approach Measuring poverty and social exclusion in support of policy making
-
Upload
christopher-cole -
Category
Documents
-
view
222 -
download
0
Transcript of Social Europe The EU approach Measuring poverty and social exclusion in support of policy making.
Social Europe
The EU approach
Measuring poverty and social exclusion in support of policy making
Social Europe
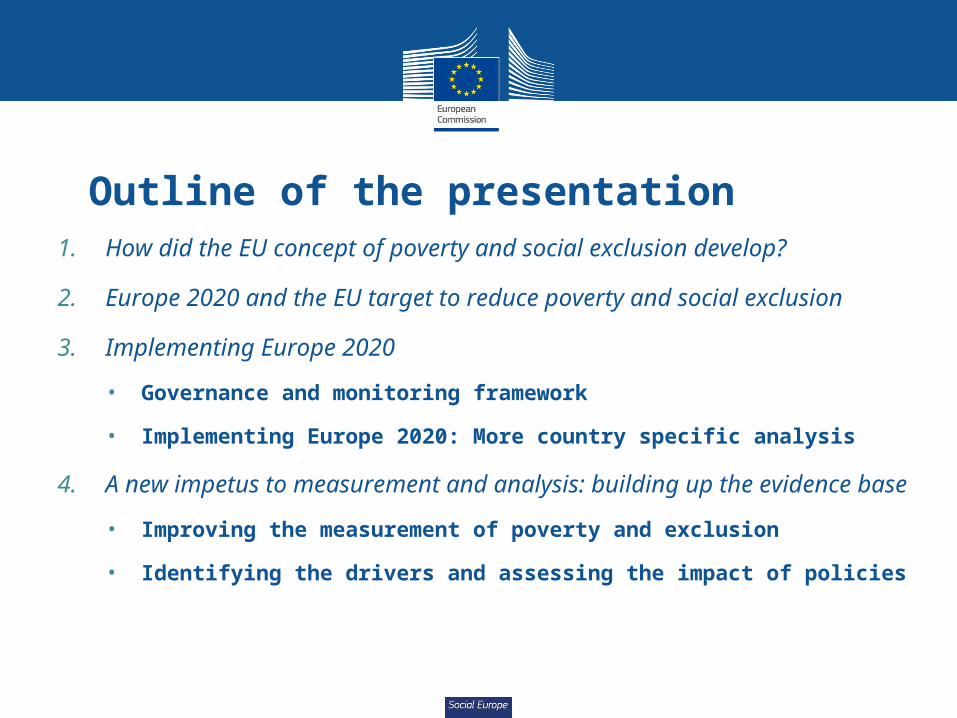
Outline of the presentation1. How did the EU concept of poverty and social exclusion develop?
2. Europe 2020 and the EU target to reduce poverty and social exclusion
3. Implementing Europe 2020
• Governance and monitoring framework
• Implementing Europe 2020: More country specific analysis
4. A new impetus to measurement and analysis: building up the evidence base
• Improving the measurement of poverty and exclusion
• Identifying the drivers and assessing the impact of policies
Social Europe
1. How did the EU concept of poverty and social exclusion develop?
Social Europe
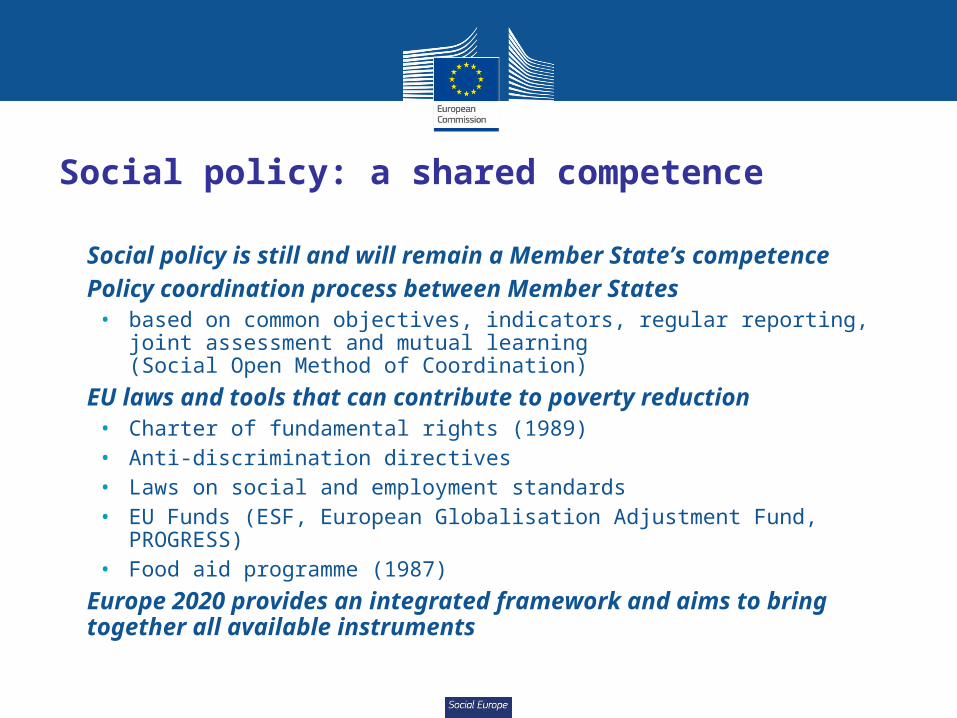
Social policy: a shared competence
• Social policy is still and will remain a Member State’s competence
• Policy coordination process between Member States• based on common objectives, indicators, regular reporting, joint
assessment and mutual learning (Social Open Method of Coordination)
• EU laws and tools that can contribute to poverty reduction • Charter of fundamental rights (1989)• Anti-discrimination directives• Laws on social and employment standards• EU Funds (ESF, European Globalisation Adjustment Fund, PROGRESS)• Food aid programme (1987)
• Europe 2020 provides an integrated framework and aims to bring together all available instruments
Social Europe
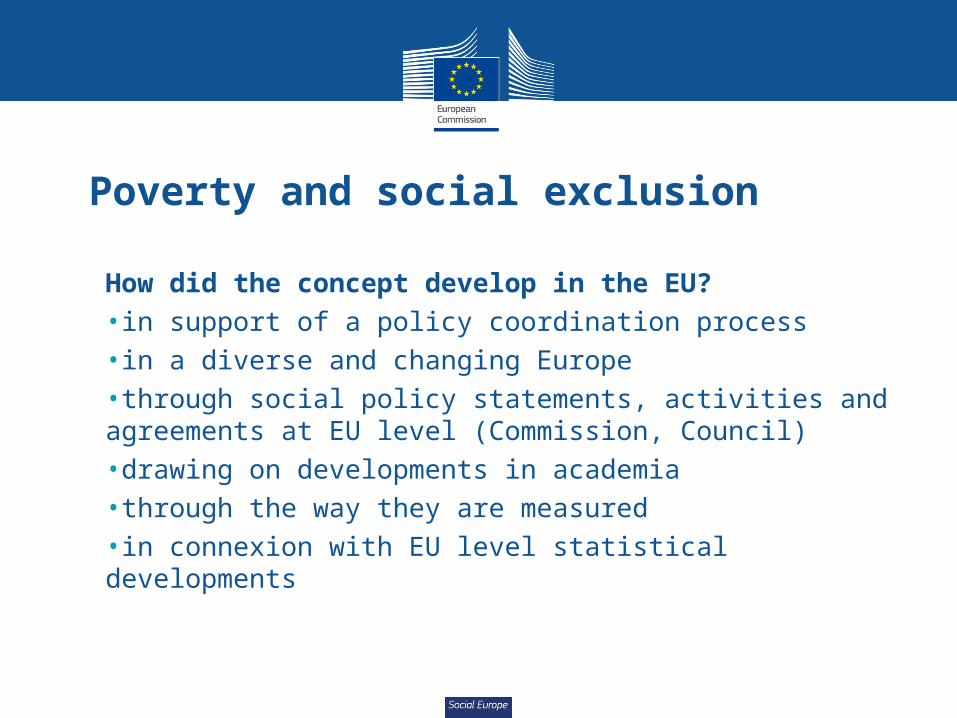
Poverty and social exclusion
How did the concept develop in the EU?•in support of a policy coordination process•in a diverse and changing Europe•through social policy statements, activities and agreements at EU level (Commission, Council)•drawing on developments in academia•through the way they are measured•in connexion with EU level statistical developments
Social Europe
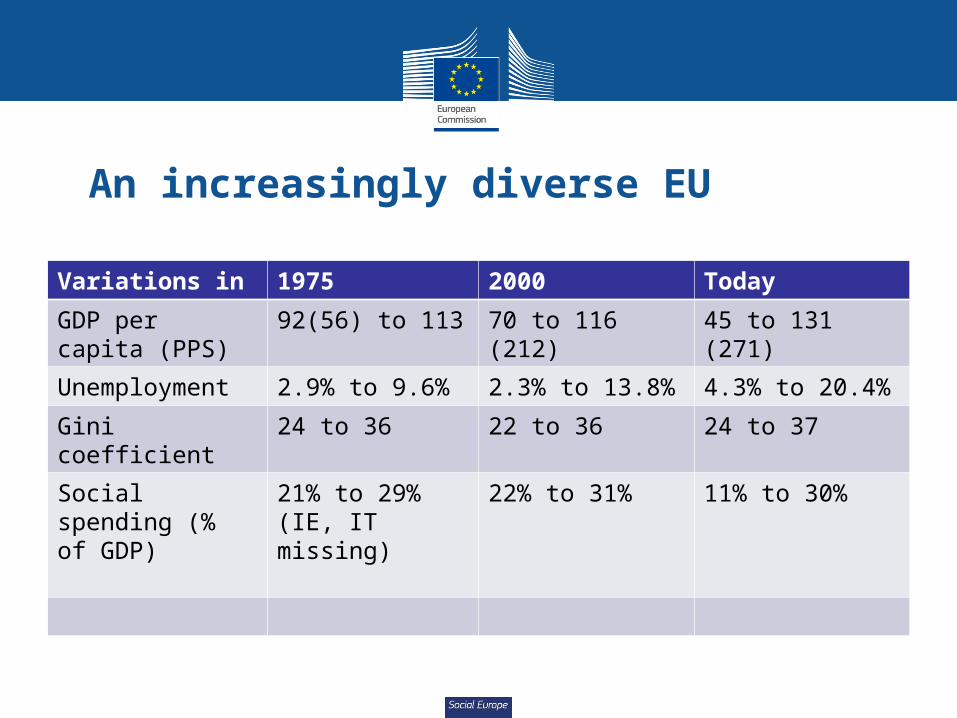
An increasingly diverse EU
Variations in 1975 2000 Today
GDP per capita (PPS)
92(56) to 113 70 to 116 (212) 45 to 131 (271)
Unemployment 2.9% to 9.6% 2.3% to 13.8% 4.3% to 20.4%
Gini coefficient 24 to 36 22 to 36 24 to 37
Social spending (% of GDP)
21% to 29% (IE, IT missing)
22% to 31% 11% to 30%
Social Europe
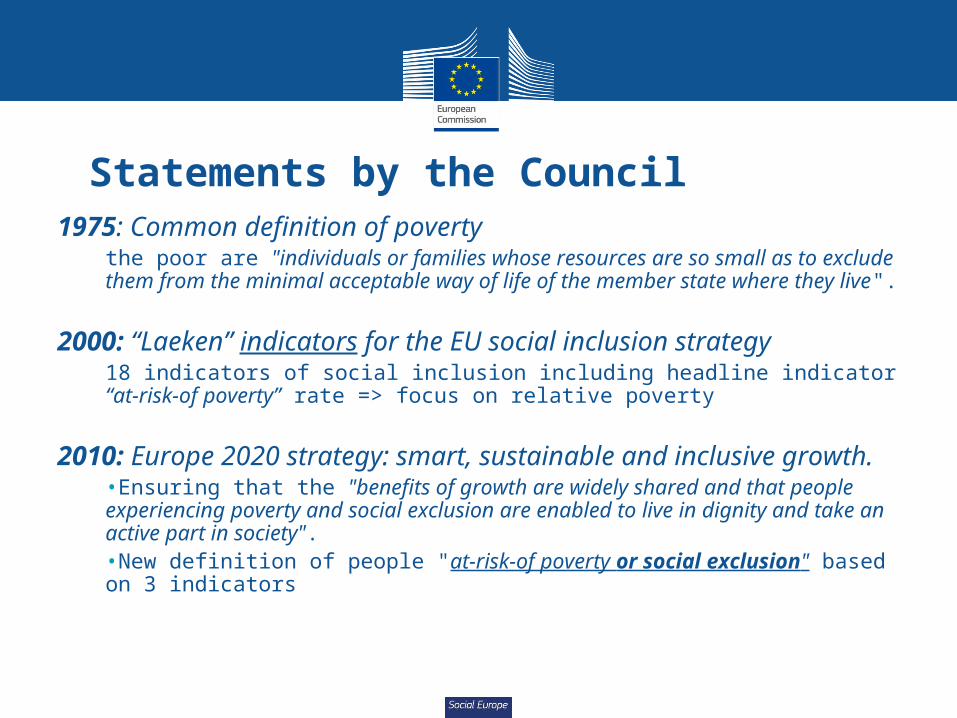
Statements by the Council1975: Common definition of poverty
the poor are "individuals or families whose resources are so small as to exclude them from the minimal acceptable way of life of the member state where they live".
2000: “Laeken” indicators for the EU social inclusion strategy18 indicators of social inclusion including headline indicator “at-risk-of poverty” rate => focus on relative poverty
2010: Europe 2020 strategy: smart, sustainable and inclusive growth.
•Ensuring that the "benefits of growth are widely shared and that people experiencing poverty and social exclusion are enabled to live in dignity and take an active part in society".•New definition of people "at-risk-of poverty or social exclusion" based on 3 indicators
Social Europe
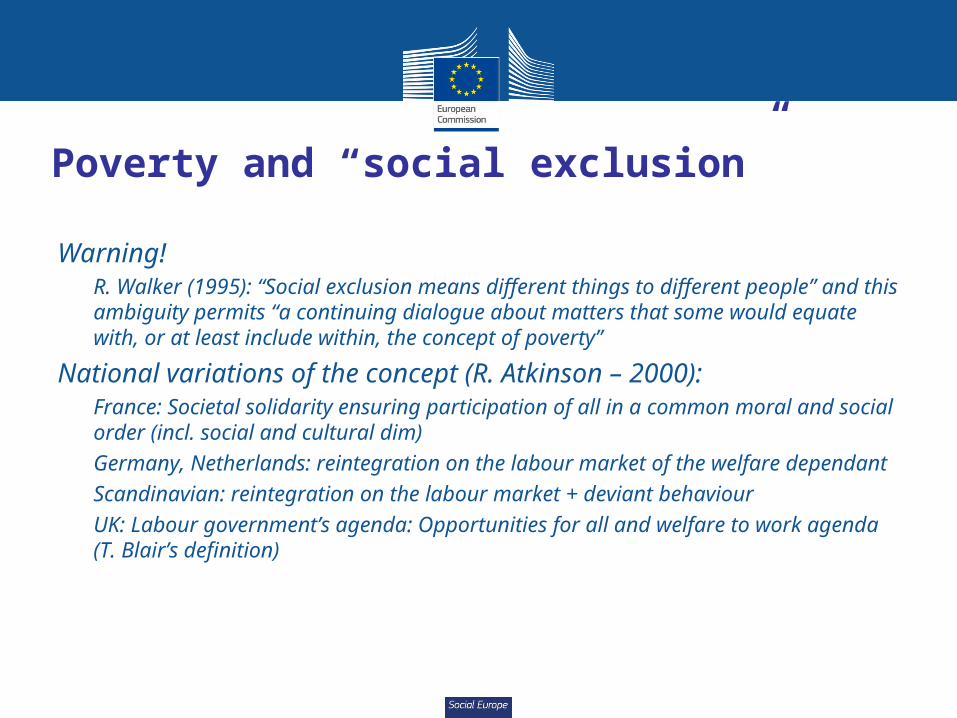
Poverty and “social exclusion”
Warning!• R. Walker (1995): “Social exclusion means different things to different
people” and this ambiguity permits “a continuing dialogue about matters that some would equate with, or at least include within, the concept of poverty”
National variations of the concept (R. Atkinson – 2000):• France: Societal solidarity ensuring participation of all in a common moral
and social order (incl. social and cultural dim)• Germany, Netherlands: reintegration on the labour market of the welfare
dependant• Scandinavian: reintegration on the labour market + deviant behaviour• UK: Labour government’s agenda: Opportunities for all and welfare to work
agenda (T. Blair’s definition)
Social Europe
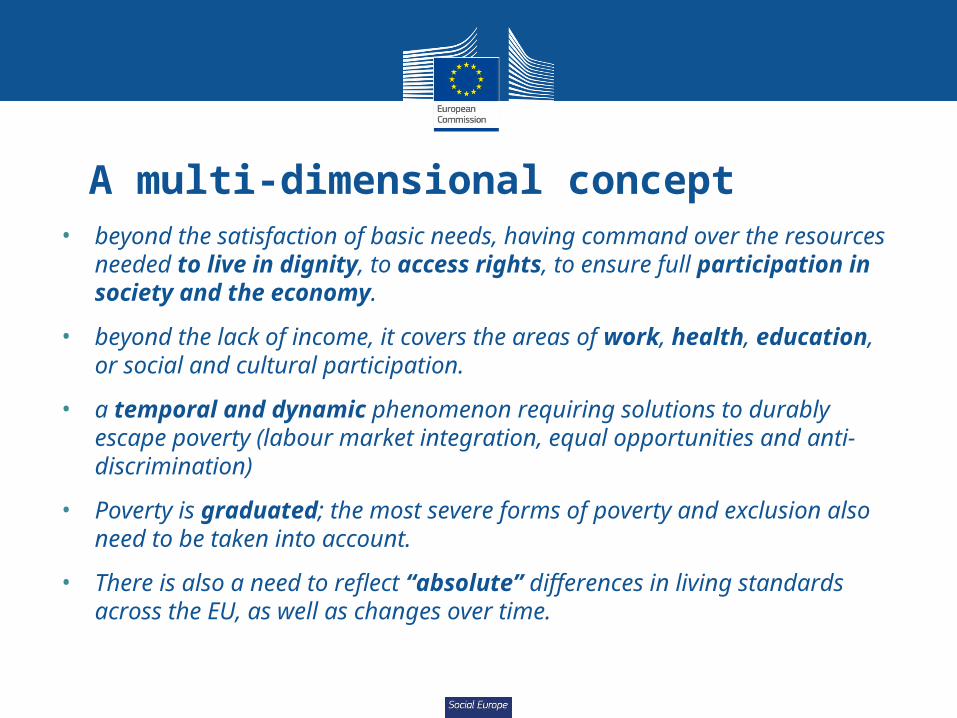
A multi-dimensional concept• beyond the satisfaction of basic needs, having command over the
resources needed to live in dignity, to access rights, to ensure full participation in society and the economy.
• beyond the lack of income, it covers the areas of work, health, education, or social and cultural participation.
• a temporal and dynamic phenomenon requiring solutions to durably escape poverty (labour market integration, equal opportunities and anti-discrimination)
• Poverty is graduated; the most severe forms of poverty and exclusion also need to be taken into account.
• There is also a need to reflect “absolute” differences in living standards across the EU, as well as changes over time.
Social Europe
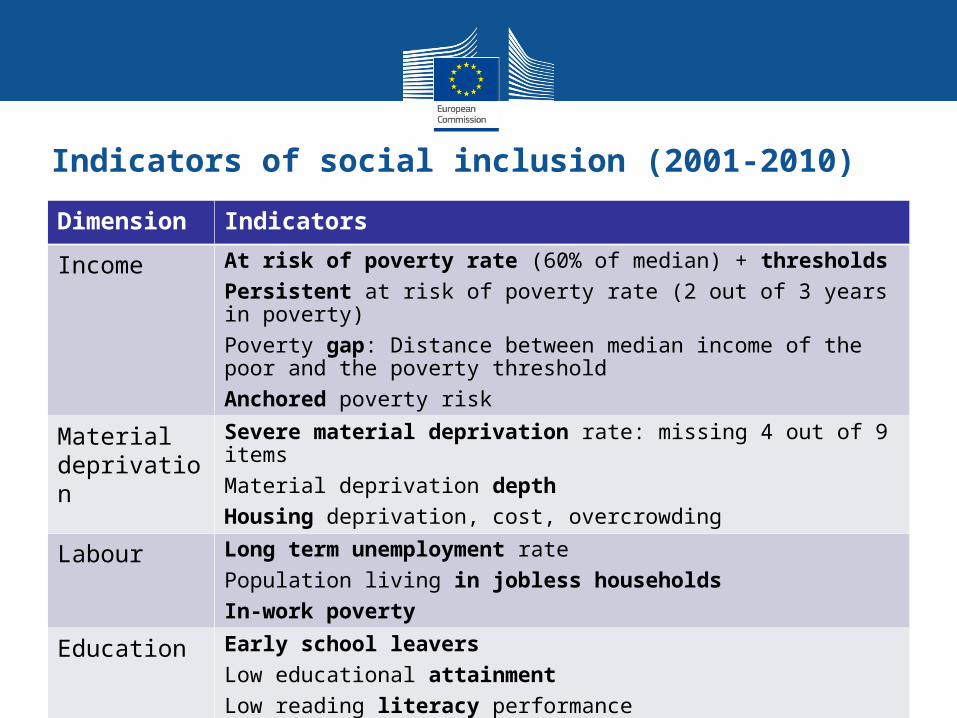
Indicators of social inclusion (2001-2010)
Dimension Indicators
Income At risk of poverty rate (60% of median) + thresholds
Persistent at risk of poverty rate (2 out of 3 years in poverty)
Poverty gap: Distance between median income of the poor and the poverty threshold
Anchored poverty risk
Material deprivation
Severe material deprivation rate: missing 4 out of 9 items
Material deprivation depth
Housing deprivation, cost, overcrowding
Labour Long term unemployment rate
Population living in jobless households
In-work poverty
Education Early school leavers
Low educational attainment
Low reading literacy performance
Social Europe
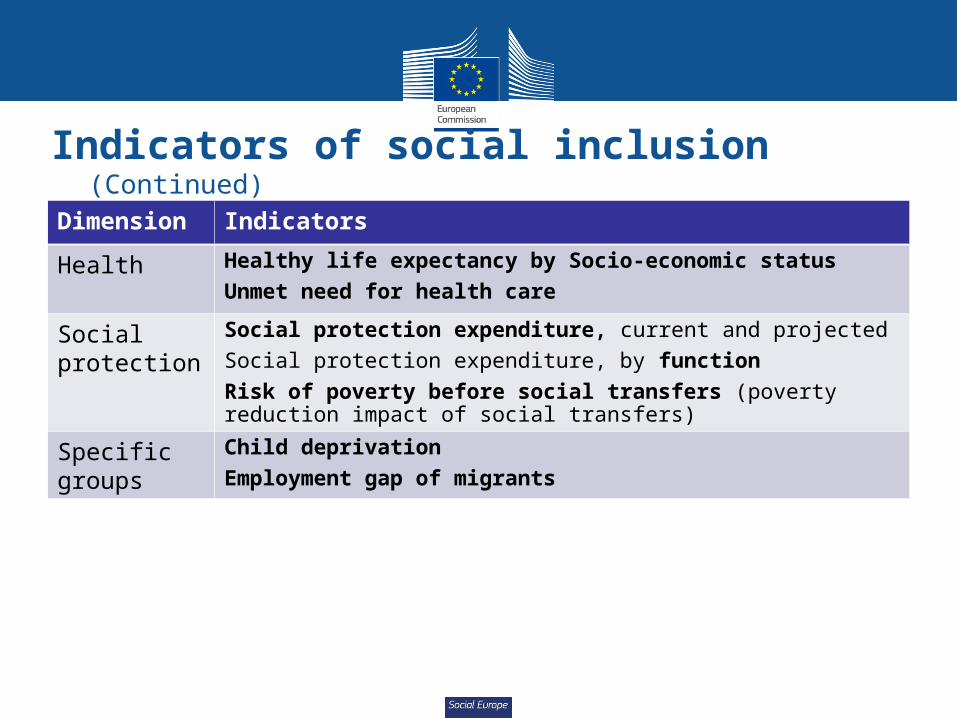
Indicators of social inclusion (Continued)
Dimension Indicators
Health Healthy life expectancy by Socio-economic status
Unmet need for health care
Social protection
Social protection expenditure, current and projected
Social protection expenditure, by function
Risk of poverty before social transfers (poverty reduction impact of social transfers)
Specific groups
Child deprivation
Employment gap of migrants
Social Europe
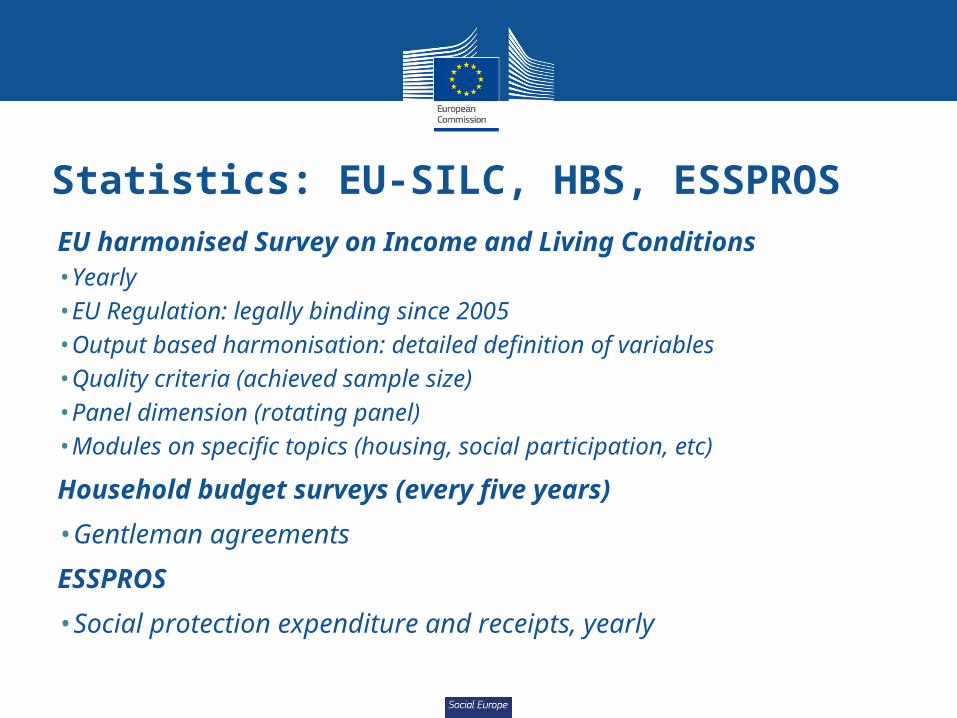
Statistics: EU-SILC, HBS, ESSPROSEU harmonised Survey on Income and Living Conditions•Yearly•EU Regulation: legally binding since 2005•Output based harmonisation: detailed definition of variables•Quality criteria (achieved sample size) •Panel dimension (rotating panel)•Modules on specific topics (housing, social participation, etc)
Household budget surveys (every five years)
•Gentleman agreements
ESSPROS
•Social protection expenditure and receipts, yearly
Social Europe
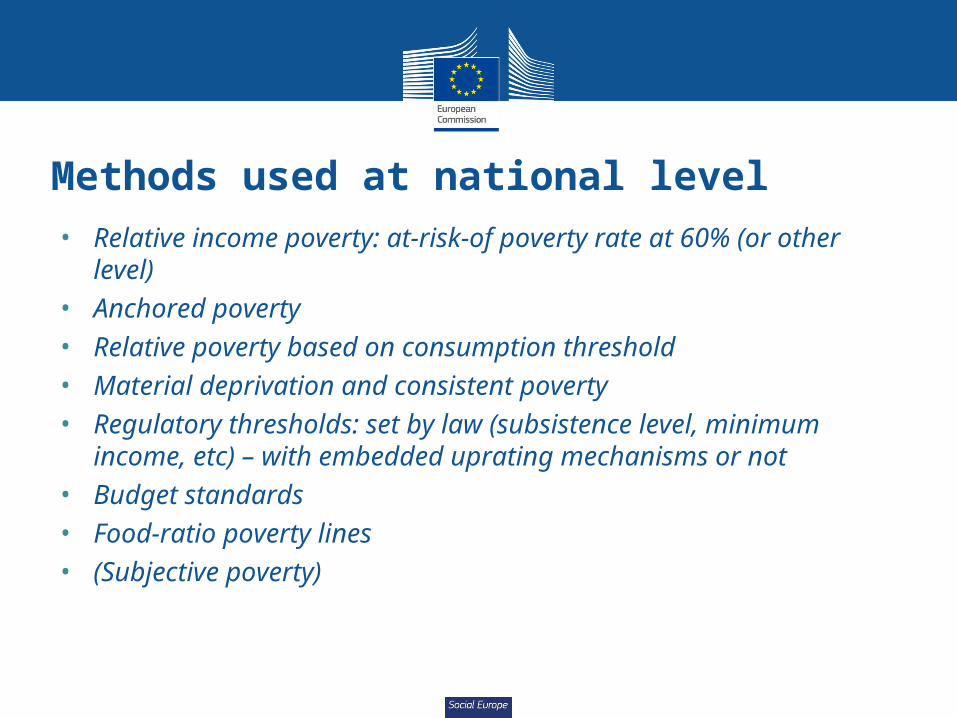
Methods used at national level• Relative income poverty: at-risk-of poverty rate at 60% (or
other level)• Anchored poverty• Relative poverty based on consumption threshold• Material deprivation and consistent poverty• Regulatory thresholds: set by law (subsistence level,
minimum income, etc) – with embedded uprating mechanisms or not
• Budget standards• Food-ratio poverty lines• (Subjective poverty)
Social Europe
2. Europe 2020 and the EU target to reduce poverty and social exclusion
Social Europe
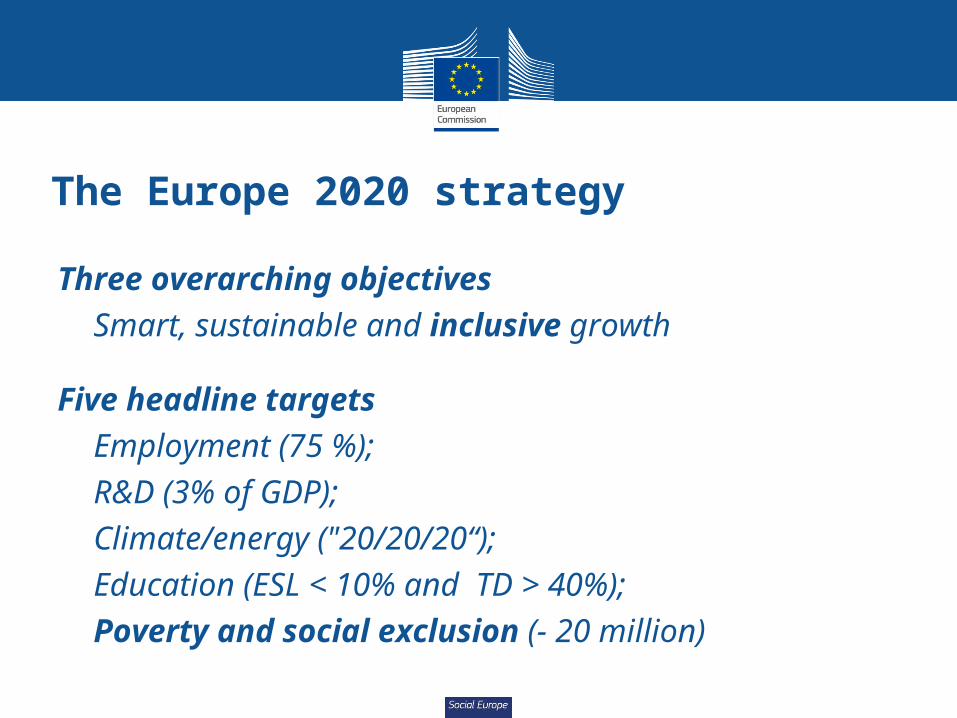
The Europe 2020 strategy
Three overarching objectives- Smart, sustainable and inclusive growth
Five headline targets - Employment (75 %); - R&D (3% of GDP); - Climate/energy ("20/20/20“); - Education (ESL < 10% and TD > 40%); - Poverty and social exclusion (- 20 million)
Social Europe
16
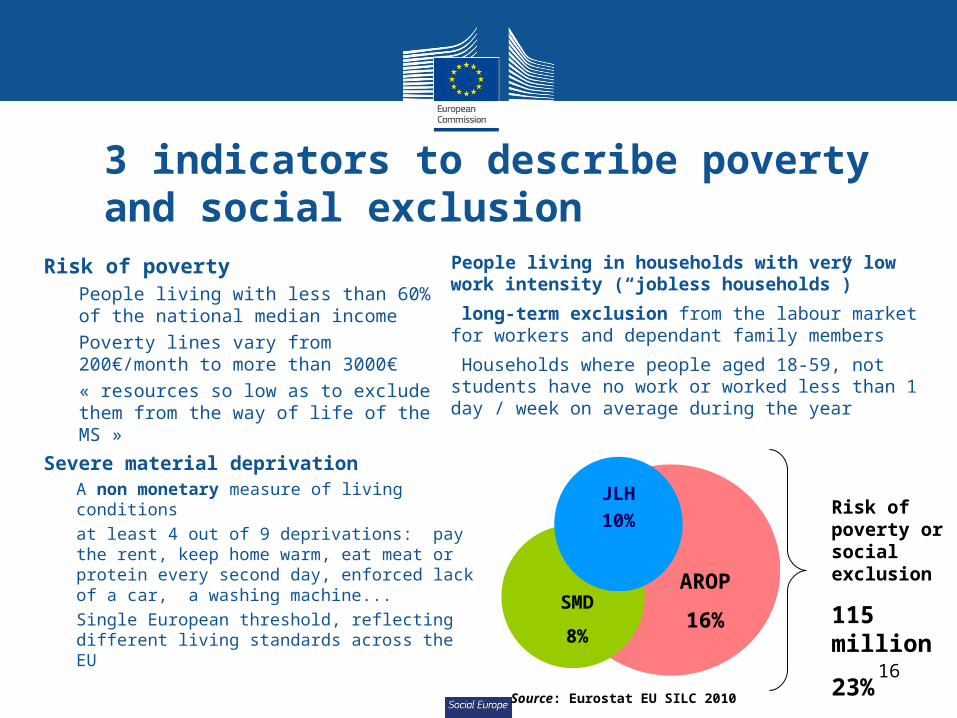
3 indicators to describe poverty and social exclusion
Risk of poverty
• People living with less than 60% of the national median income
• Poverty lines vary from 200€/month to more than 3000€
• « resources so low as to exclude them from the way of life of the MS »
People living in households with very low work intensity (“jobless households”)
•long-term exclusion from the labour market for workers and dependant family members
•Households where people aged 18-59, not students have no work or worked less than 1 day / week on average during the year
Severe material deprivation • A non monetary measure of living
conditions• at least 4 out of 9 deprivations: pay the
rent, keep home warm, eat meat or protein every second day, enforced lack of a car, a washing machine...
• Single European threshold, reflecting different living standards across the EU
Risk of poverty or social exclusion
115 million
23%
Source: Eurostat EU SILC 2010
AROP
16%SMD
8%
JLH
10%
Social Europe
17
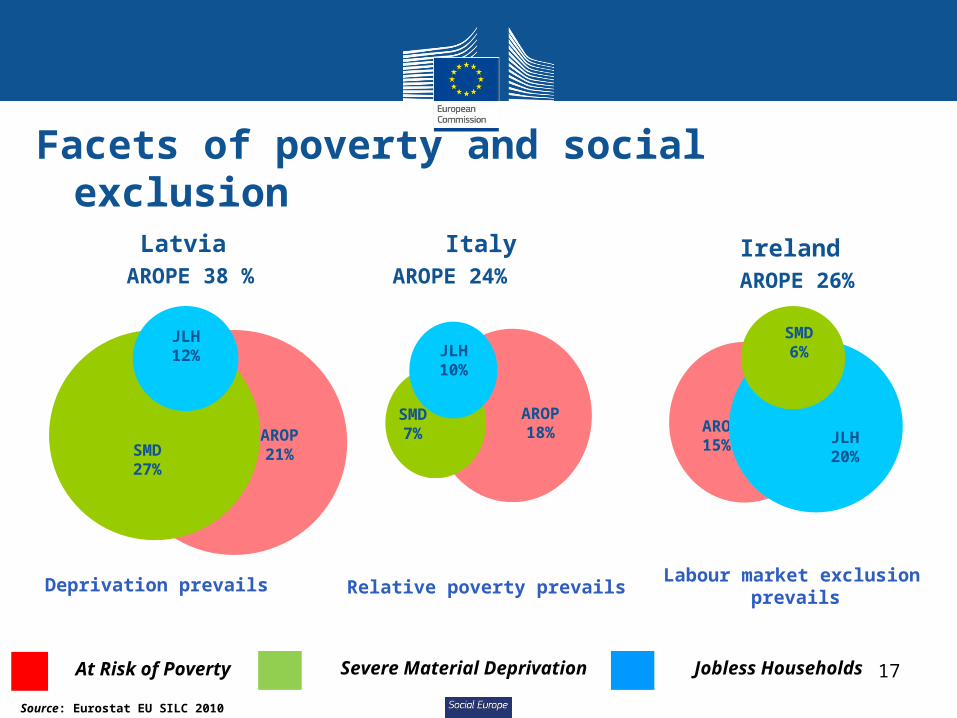
Facets of poverty and social exclusion
17
Latvia AROPE 38 %
At Risk of Poverty Severe Material Deprivation Jobless Households
Italy AROPE 24%
Ireland AROPE 26%
Deprivation prevails
Relative poverty prevails
Labour market exclusion prevails
AROP21%SMD
27%
JLH12%
AROP18%
SMD7%
JLH10%
AROP15% JLH
20%
SMD6%
Source: Eurostat EU SILC 2010
Social Europe
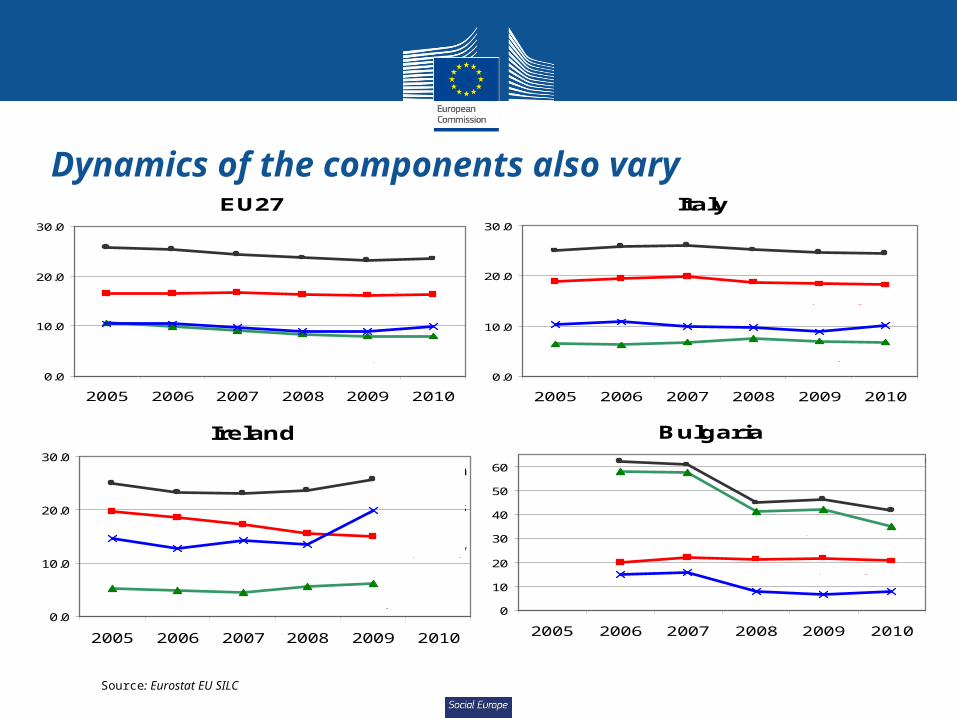
Dynamics of the components also vary
Source: Eurostat EU SILC
EU27
0.0
10.0
20.0
30.0
2005 2006 2007 2008 2009 2010
Risk of poverty
Severe material deprivation
Risk of poverty or social exclusion
Jobless households
Italy
0.0
10.0
20.0
30.0
2005 2006 2007 2008 2009 2010
Risk of poverty
Severe material deprivation
Risk of poverty or social exclusion
Jobless households
Ireland
0.0
10.0
20.0
30.0
2005 2006 2007 2008 2009 2010
Risk of poverty
Severe material deprivation
Risk of poverty or social exclusion
Jobless households
Bulgaria
0
10
20
30
40
50
60
2005 2006 2007 2008 2009 2010
Risk of poverty
Severe material deprivation
Risk of poverty or social exclusion
Jobless households
Social Europe
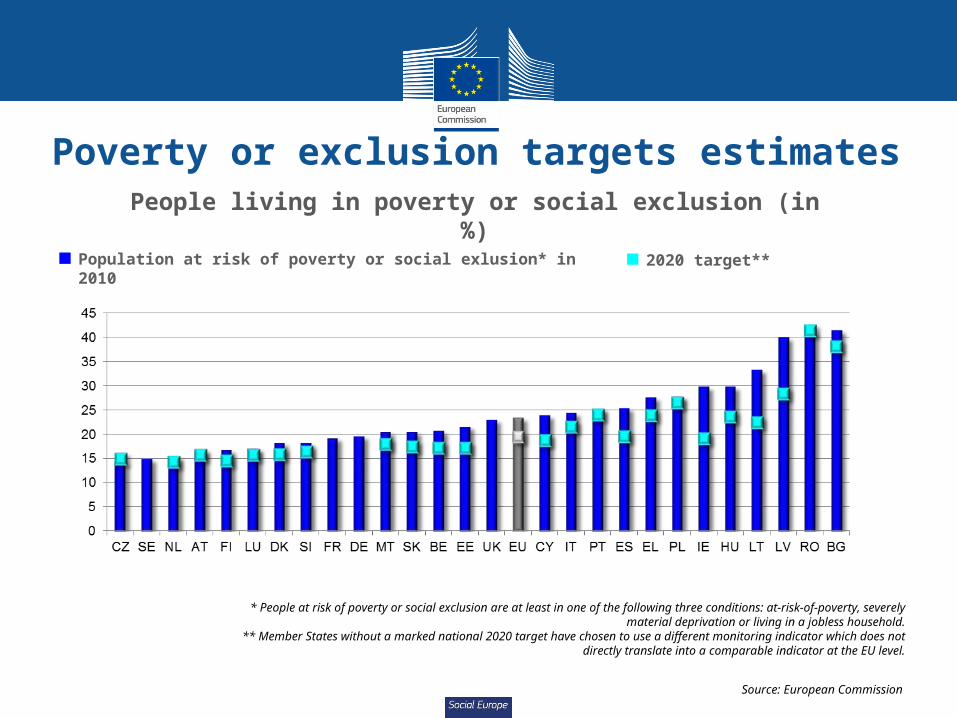
Poverty or exclusion targets estimatesPeople living in poverty or social exclusion (in %)
* People at risk of poverty or social exclusion are at least in one of the following three conditions: at-risk-of-poverty, severely material deprivation or living in a jobless household.
** Member States without a marked national 2020 target have chosen to use a different monitoring indicator which does not directly translate into a comparable indicator at the EU level.
Population at risk of poverty or social exlusion* in 2010 2020 target**
Source: European Commission

Social Europe
3. Implementing Europe 2020
3a. Governance and monitoring framework
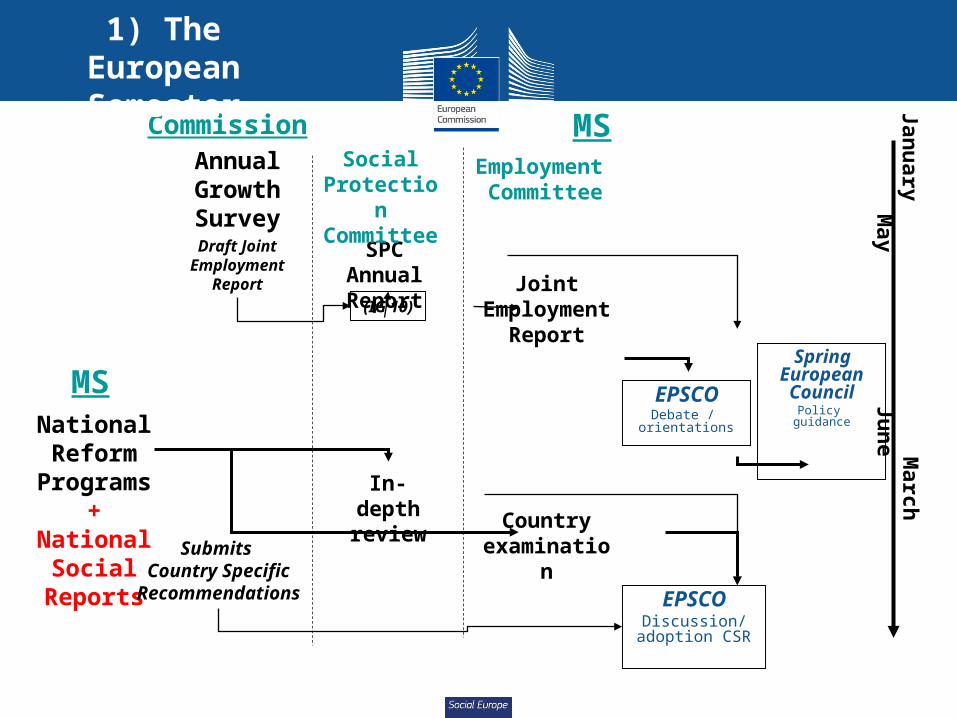
Social Europe
EPSCODebate /
orientations
SPC Annual Report Joint
Employment Report
(IG 10)
National Reform
Programs+ National
Social Reports
In-depth review
Janu
ary March
May Ju
ne
Annual Growth SurveyDraft Joint
Employment Report
Spring European Council
Policy guidance
Country examination
EPSCODiscussion/
adoption CSR
Social Protection Committee
Submits Country Specific
Recommendations
MSCommission
MS
Employment Committee
1) The European Semester
Social Europe
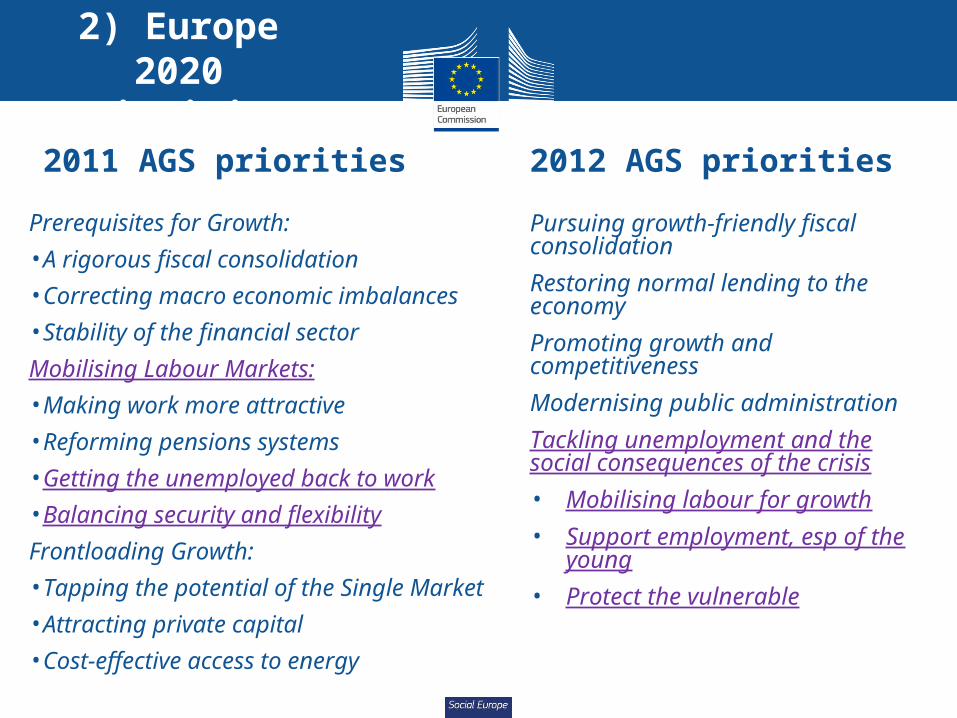
22
2011 AGS priorities
Prerequisites for Growth:
•A rigorous fiscal consolidation
•Correcting macro economic imbalances
•Stability of the financial sector
Mobilising Labour Markets:
•Making work more attractive
•Reforming pensions systems
•Getting the unemployed back to work
•Balancing security and flexibility
Frontloading Growth:
•Tapping the potential of the Single Market
•Attracting private capital
•Cost-effective access to energy
2012 AGS priorities
Pursuing growth-friendly fiscal consolidation
Restoring normal lending to the economy
Promoting growth and competitiveness
Modernising public administration
Tackling unemployment and the social consequences of the crisis
• Mobilising labour for growth
• Support employment, esp of the young
• Protect the vulnerable
2) Europe 2020 priorities
Social Europe
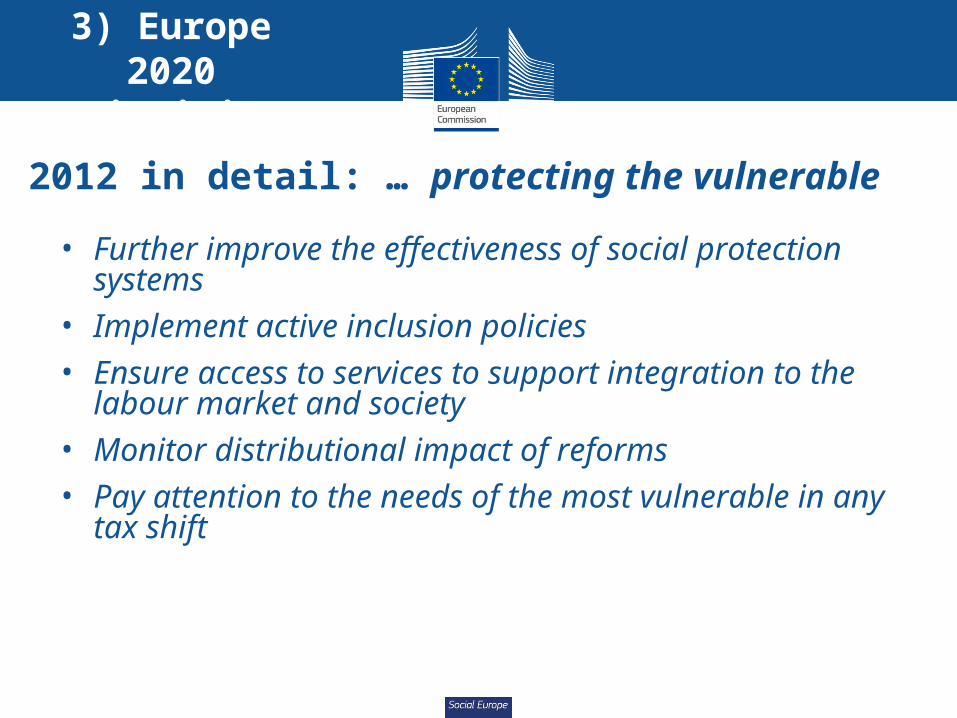
2012 in detail: … protecting the vulnerable
• Further improve the effectiveness of social protection systems
• Implement active inclusion policies• Ensure access to services to support integration
to the labour market and society• Monitor distributional impact of reforms• Pay attention to the needs of the most vulnerable
in any tax shift
3) Europe 2020 priorities
Social Europe
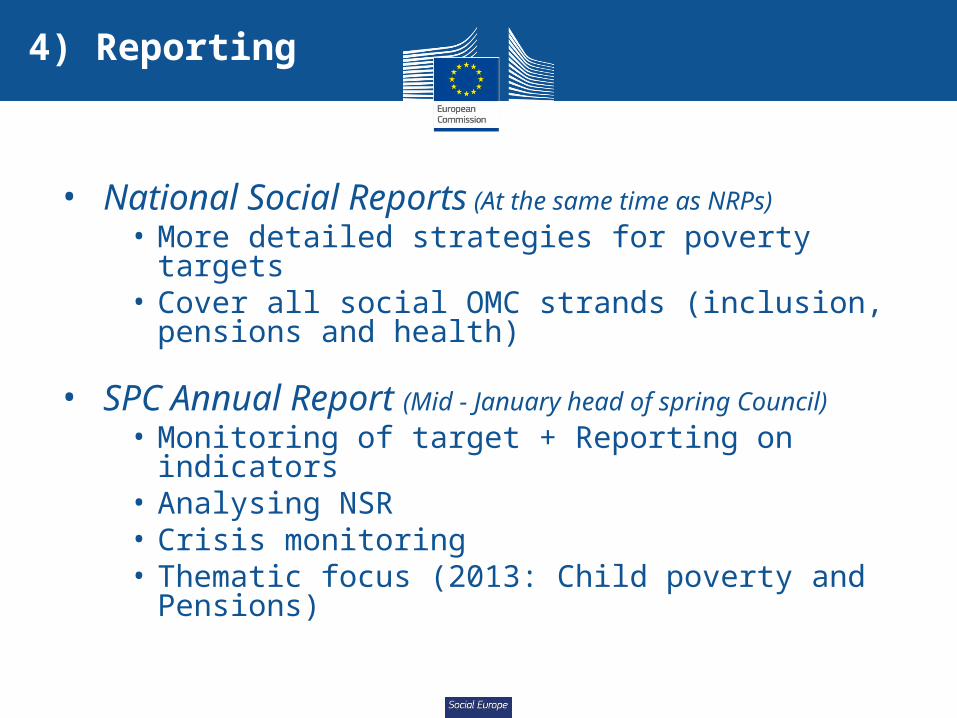
• National Social Reports (At the same time as NRPs)• More detailed strategies for poverty targets• Cover all social OMC strands (inclusion,
pensions and health)
• SPC Annual Report (Mid - January head of spring Council)
• Monitoring of target + Reporting on indicators• Analysing NSR• Crisis monitoring• Thematic focus (2013: Child poverty and
Pensions)
4) Reporting
Social Europe
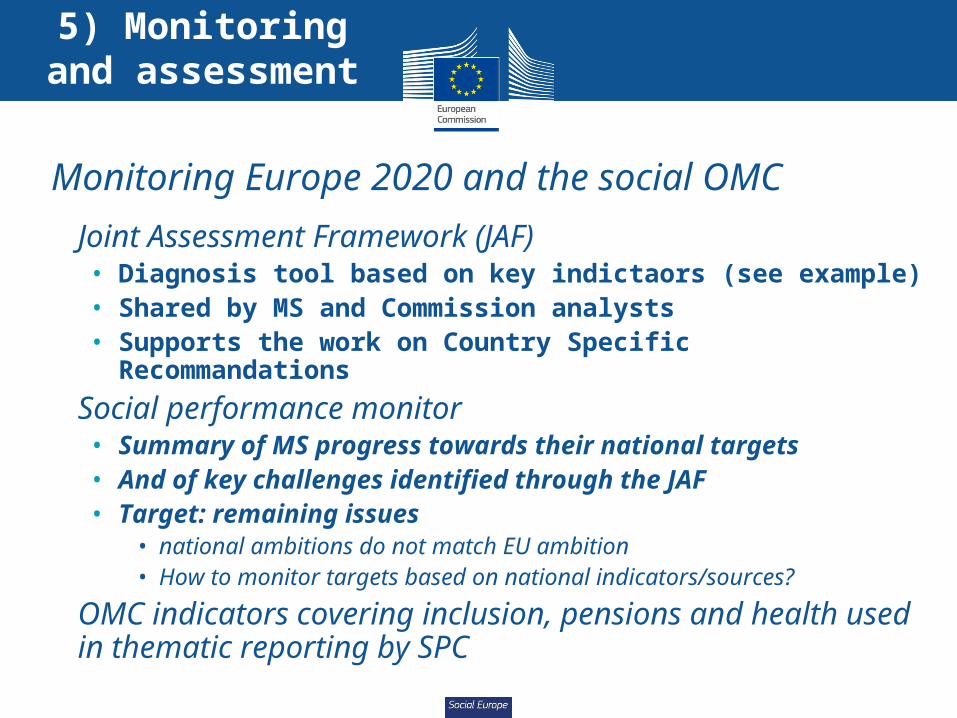
Monitoring Europe 2020 and the social OMC
• Joint Assessment Framework (JAF)• Diagnosis tool based on key indictaors (see example)• Shared by MS and Commission analysts• Supports the work on Country Specific
Recommandations
• Social performance monitor• Summary of MS progress towards their national
targets• And of key challenges identified through the JAF• Target: remaining issues
• national ambitions do not match EU ambition• How to monitor targets based on national indicators/sources?
• OMC indicators covering inclusion, pensions and health used in thematic reporting by SPC
5) Monitoring and assessment
Social Europe
3. Implementing Europe 2020
3b. More country specific analysis
Social Europe
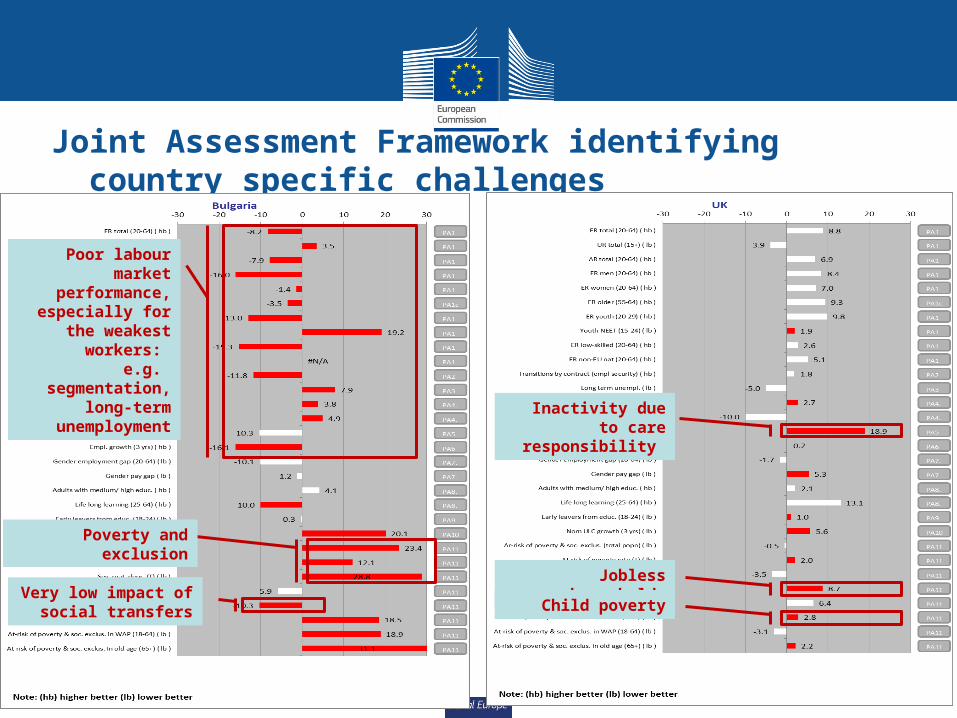
Joint Assessment Framework identifying country specific challenges
Inactivity due to care responsibility
Jobless households
Child poverty
Poverty and exclusion
Very low impact of social transfers
Poor labour market performance,
especially for the weakest workers:
e.g. segmentation, long-term
unemployment
Social Europe
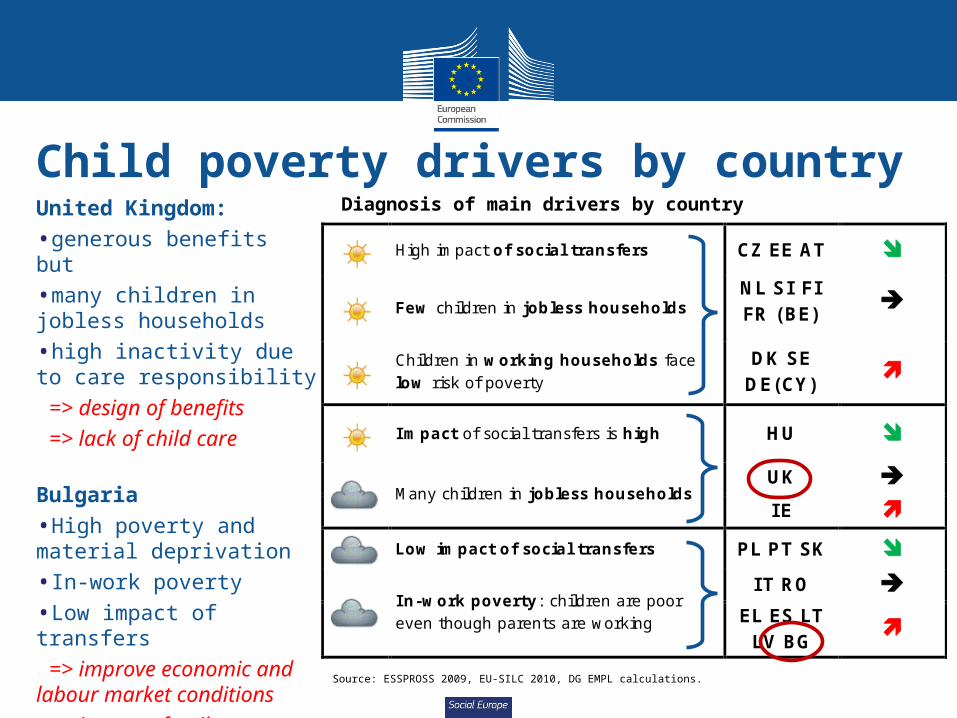
High impact of social transfers CZ EE AT
Few children in jobless households
NL SI FI FR (BE)
Children in working households face low risk of poverty
DK SE DE(CY)
I mpact of social transfers is high HU
Many children in jobless households
UK I E
Low impact of social transfers PL PT SK
I n-work poverty: children are poor even though parents are working
I T RO EL ES LT
LV BG
Child poverty drivers by countryUnited Kingdom:
•generous benefits but
•many children in jobless households
•high inactivity due to care responsibility-=> design of benefits-=> lack of child care
Bulgaria
•High poverty and material deprivation
•In-work poverty
•Low impact of transfers-=> improve economic and labour market conditions-=> improve family support
Diagnosis of main drivers by country
Source: ESSPROSS 2009, EU-SILC 2010, DG EMPL calculations.
Social Europe
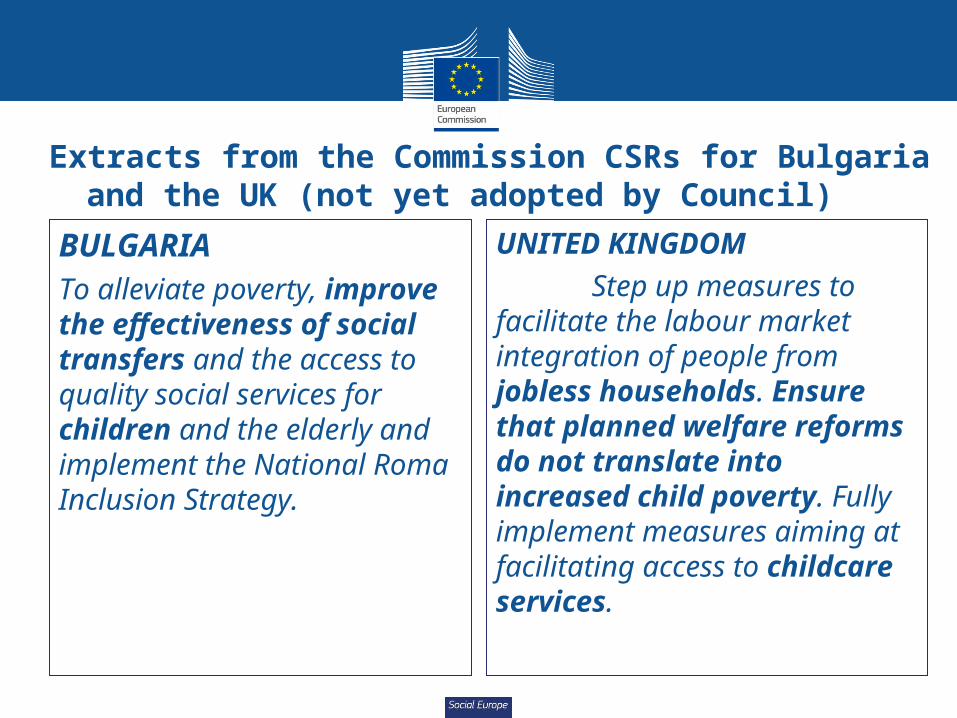
Extracts from the Commission CSRs for Bulgaria and the UK (not yet adopted by Council)
BULGARIATo alleviate poverty, improve the effectiveness of social transfers and the access to quality social services for children and the elderly and implement the National Roma Inclusion Strategy.
UNITED KINGDOMStep up measures to
facilitate the labour market integration of people from jobless households. Ensure that planned welfare reforms do not translate into increased child poverty. Fully implement measures aiming at facilitating access to childcare services.
Social Europe
4. A new impetus to measurement and analysis: building up the evidence base
Social Europe
Building up the evidence basePoverty and social exclusion• measurement of POVERTY AND SOCIAL EXCLUSION:
material deprivation, « extreme » poverty (homelessness, Roma), regional dimension (Poverty maps and Roma with World Bank and FRA)
• DYNAMICS of poverty and exclusion (longitudinal component)• Mid-term review of targets in 2015 (e.g. mat. dep. Comp.)• TIMELINESS
Poverty drivers and impact of policies• Do growth and jobs help reducing poverty and exclusion?• REDISTRIBUTIVE IMPACT OF SOCIAL SPENDING, (incl. in-kind
benefits) – identify efficiency gains• What is the impact of fiscal consolidation?
Social spending vs. Economic efficiency• Illustrating the working of automatic stabilizers
Social Europe
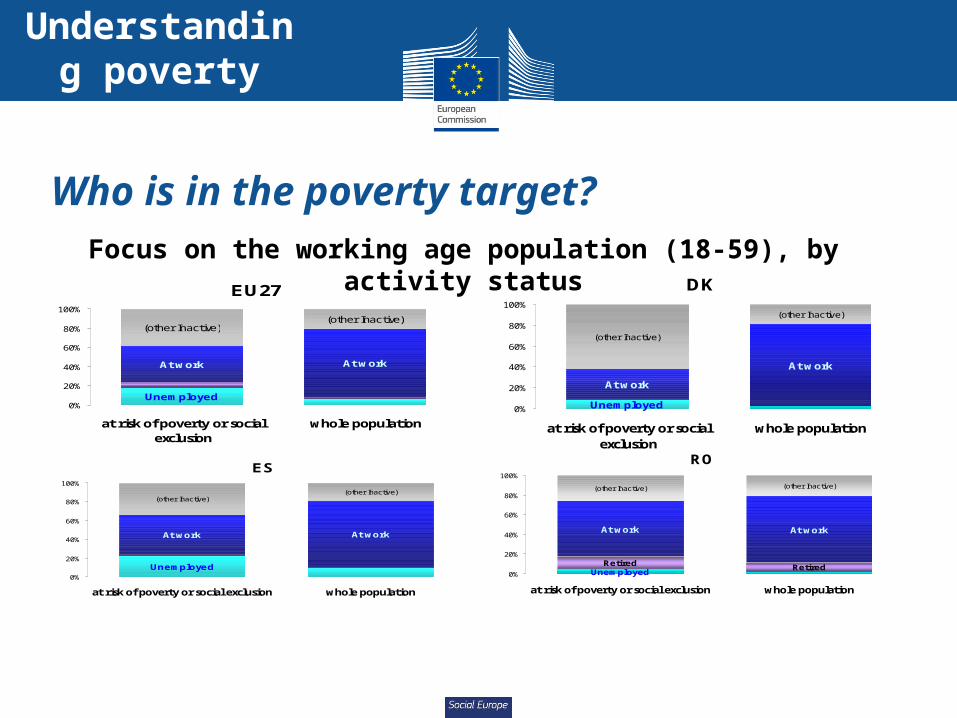
Who is in the poverty target?
Sources: DG EMPL calculation from EU-SILC (2009) -
EU27
Unemployed
At work At work
(other Inactive)(other Inactive)
0%
20%
40%
60%
80%
100%
at risk of poverty or socialexclusion
whole population
DK
Unemployed
At work
At work
(other Inactive)
(other Inactive)
0%
20%
40%
60%
80%
100%
at risk of poverty or socialexclusion
whole population
ES
Unemployed
At work At work
(other Inactive)(other Inactive)
0%
20%
40%
60%
80%
100%
at risk of poverty or social exclusion whole population
RO
UnemployedRetired Retired
At work At work
(other Inactive) (other Inactive)
0%
20%
40%
60%
80%
100%
at risk of poverty or social exclusion whole population
Focus on the working age population (18-59), by activity status
Understanding poverty
Social Europe
0
5
10
15
20
25
30
35
poorest 2nd 3rd 4th richest
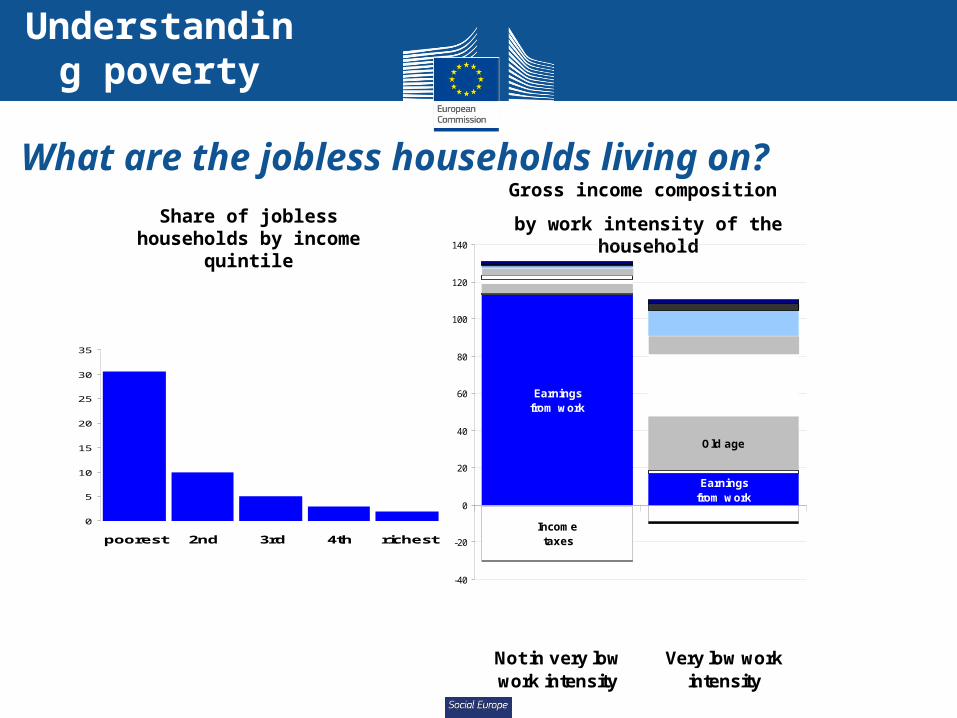
What are the jobless households living on?
Sources: DG EMPL calculation from EU-SILC (2009)
Gross income composition
by work intensity of the householdShare of jobless households by income quintile
Earnings from work
Income taxes
Earnings from work
Old age
-40
-20
0
20
40
60
80
100
120
140
Not in very lowwork intensity
Very low workintensity
Social exclusion / housing
Family and education
Social exclusion/ housing
Unemployment benefits
Understanding poverty
Social Europe
New indicator of material deprivation for mid-term review of EU target
Items being discussed (not adopted yet) being able to afford: •some new clothes, •two pairs of shoes, •a meal with meat, chicken or fish every second day, •to keep home adequately warm, •to pay for arrears (mortgage/rent, utility bills, hire purchase instalments), •to face unexpected expenses, •a personal car if needed, •a computer with an internet connection, •to replace worn-out furniture, •some money for oneself, •regular leisure activity, •getting-together with friends/relatives for a drink/meal monthly, •one week annual holiday away from home.
Understanding poverty
Social Europe
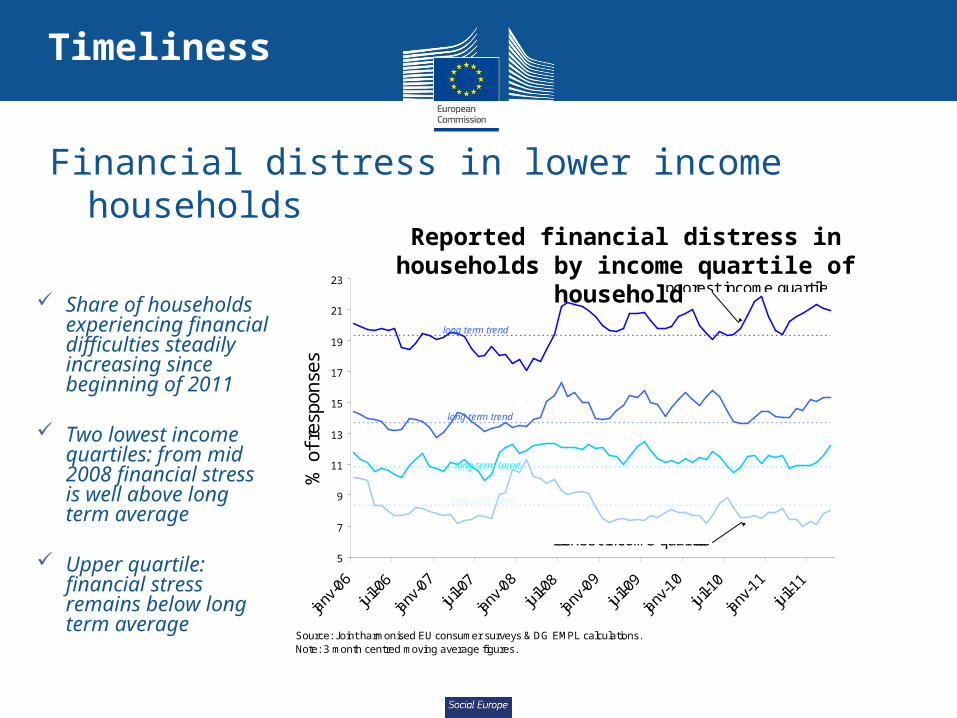
Financial distress in lower income households
Share of households experiencing financial difficulties steadily increasing since beginning of 2011
Two lowest income quartiles: from mid 2008 financial stress is well above long term average
Upper quartile: financial stress remains below long term average
Reported financial distress in households by income quartile of household
5
7
9
11
13
15
17
19
21
23
janv
-06
juil-0
6
janv
-07
juil-0
7
janv
-08
juil-0
8
janv
-09
juil-0
9
janv
-10
juil-1
0
janv
-11
juil-1
1
Source: Joint harmonised EU consumer surveys & DG EMPL calculations. Note: 3 month centred moving average figures.
% o
f res
pons
es
richest income quartile
poorest income quartile
long term trend
long term trend
long term trend
long term trend
Timeliness
Social Europe
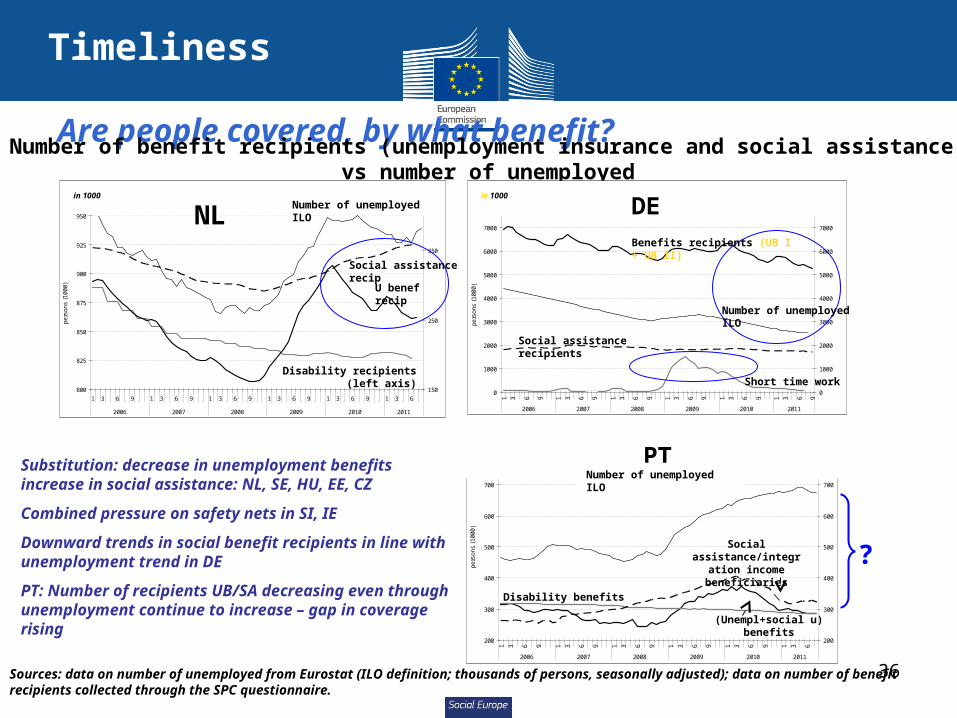
36
Are people covered, by what benefit?Number of benefit recipients (unemployment insurance and social assistance) vs number of unemployed
800
825
850
875
900
925
950
1 3 6 9 1 3 6 9 1 3 6 9 1 3 6 9 1 3 6 9 1 3 6
2006 2007 2008 2009 2010 2011
pers
ons
(100
0)
150
250
350
NL Disability benefits Recipients (left axis) NL Number of unemployed ILO (1000)
NL U Benefits recipients (WW) NL Social Assistance Recipients
Sources: data on number of unemployed from Eurostat (ILO definition; thousands of persons, seasonally adjusted); data on number of benefit recipients collected through the SPC questionnaire.
0
1000
2000
3000
4000
5000
6000
7000
1 3 6 9 1 3 6 9 1 3 6 9 1 3 6 9 1 3 6 9 1 3 6 9
2006 2007 2008 2009 2010 2011
pers
ons
(100
0)
0
1000
2000
3000
4000
5000
6000
7000
DE Number of unemployed ILO (1000) DE Benefit recipients (UB I + UB II)
DE short term w ork DE Social Assistance recipients
NL DE
Substitution: decrease in unemployment benefits increase in social assistance: NL, SE, HU, EE, CZ
Combined pressure on safety nets in SI, IE
Downward trends in social benefit recipients in line with unemployment trend in DE
PT: Number of recipients UB/SA decreasing even through unemployment continue to increase – gap in coverage rising
in 1000 in 1000
in 1000
U benef recip
Social assistance recip
Number of unemployed ILO
Disability recipients (left axis)
Number of unemployed ILO
Short time work
Benefits recipients (UB I + UB II)
Social assistance recipients
200
300
400
500
600
700
800
1 3 6 9 1 3 6 9 1 3 6 9 1 3 6 9 1 3 6 9 1 3 6
2006 2007 2008 2009 2010 2011
pers
ons
(100
0)
200
300
400
500
600
700
800
PT Number of unemployed ILO (1000) PT (Unemployment + social unemployment) benefits
PT Disability (social + pension) benefits PT Social (assistance/integration income) beneficiaries
PTNumber of unemployed ILO
Social assistance/integr
ation income beneficiaries
(Unempl+social u) benefits
Disability benefits
?
Timeliness
Social Europe
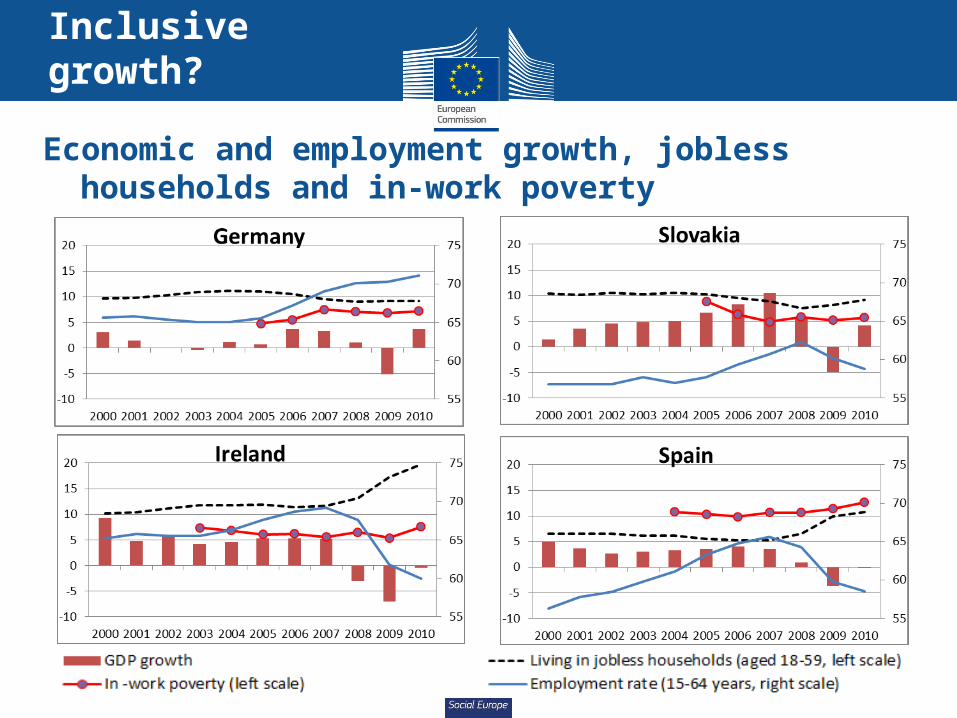
Economic and employment growth, jobless households and in-work poverty
Inclusive growth?
Social Europe
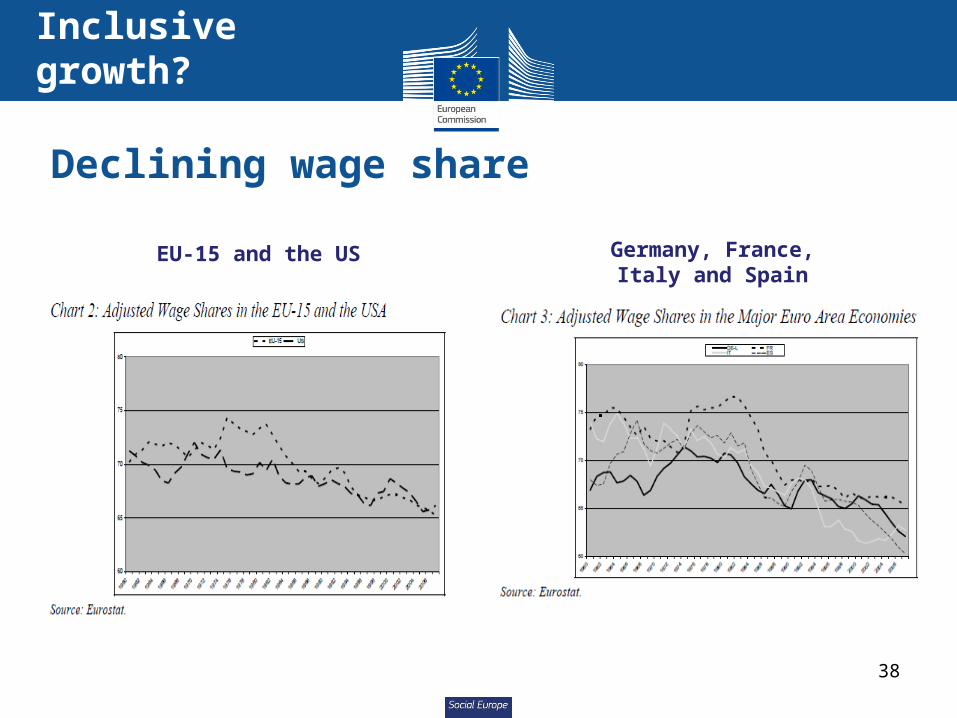
Declining wage share
38
EU-15 and the US Germany, France, Italy and Spain
Inclusive growth?

Social Europe
Labour market polarisation
Before the crisis
More jobs created in low and high wages segments
During the crisis
More jobs lost in the middle wages segments
Source: Eurostat EU LFS, Fernández-Macías (2010) Source: Eurostat EU LFS, Fernández-Macías (2010)
Net job creation 1998-2007
0
1000
2000
3000
4000
5000
6000
7000
8000
9000
Lowwages
Highwages
Net job creation 2008q2-2010q2
-3000
-2000
-1000
0
1000
2000
3000
4000
5000
6000
Lowwages
Highwages
Source: Eurofound, ESDE
Inclusive labour market?
Social Europe
40
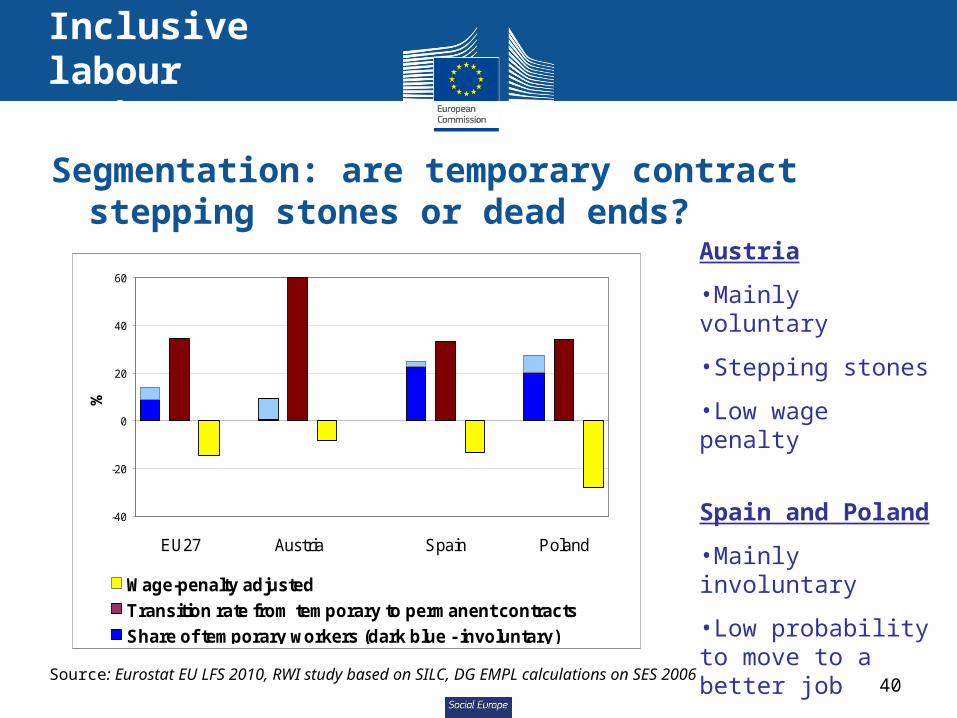
Segmentation: are temporary contract stepping stones or dead ends?
-40
-20
0
20
40
60
EU27 Austria Spain Poland
%
Wage-penalty adjusted
Transition rate from temporary to permanent contracts
Share of temporary workers (dark blue - involuntary)
Austria
•Mainly voluntary
•Stepping stones
•Low wage penalty
Spain and Poland
•Mainly involuntary
•Low probability to move to a better job
•High wage penalty
Source: Eurostat EU LFS 2010, RWI study based on SILC, DG EMPL calculations on SES 2006
Inclusive labour market?
Social Europe
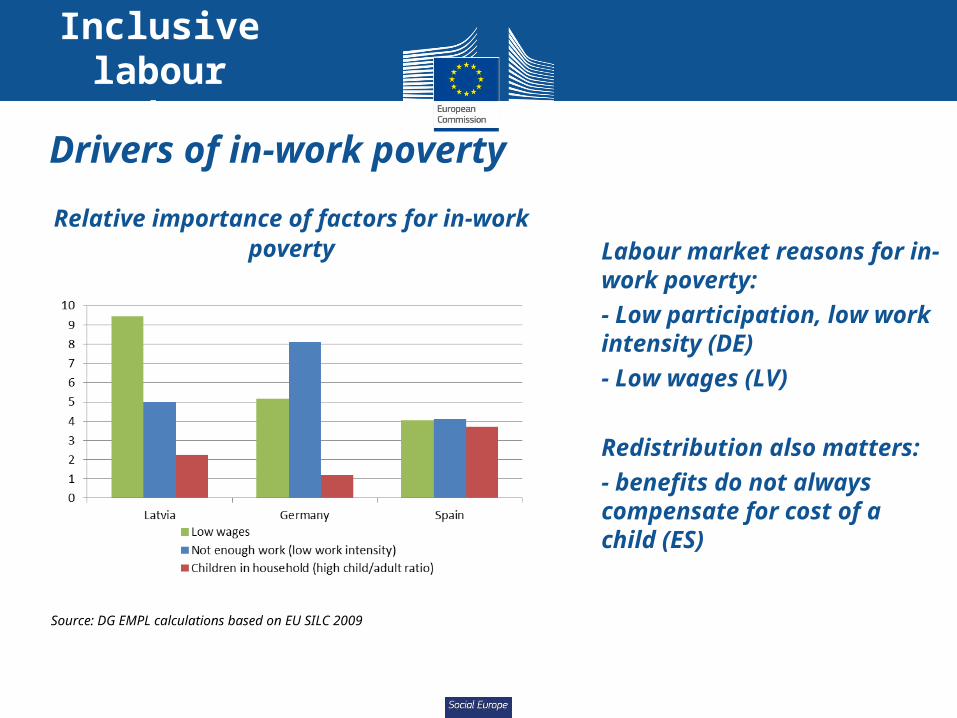
Drivers of in-work poverty
Source: DG EMPL calculations based on EU SILC 2009
Labour market reasons for in-work poverty:- Low participation, low work intensity (DE)- Low wages (LV)
Redistribution also matters:- benefits do not always compensate for cost of a child (ES)
Relative importance of factors for in-work poverty
Inclusive labour market?
Social Europe
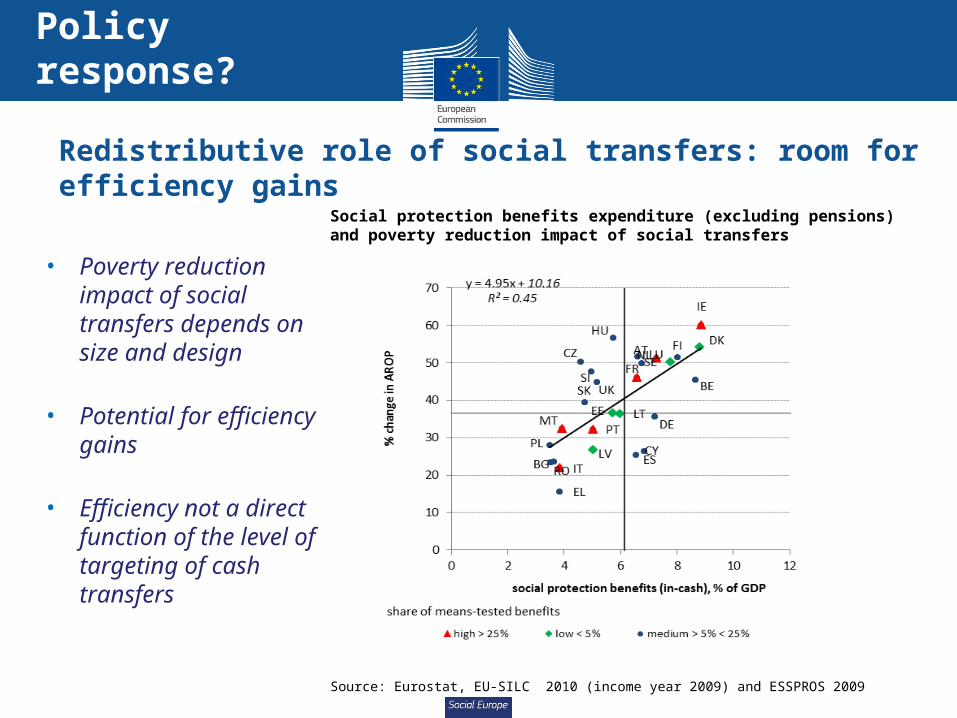
Redistributive role of social transfers: room for efficiency gains
• Poverty reduction impact of social transfers depends on size and design
• Potential for efficiency gains
• Efficiency not a direct function of the level of targeting of cash transfers
Social protection benefits expenditure (excluding pensions) and poverty reduction impact of social transfers
Source: Eurostat, EU-SILC 2010 (income year 2009) and ESSPROS 2009
Policy response?
Social Europe
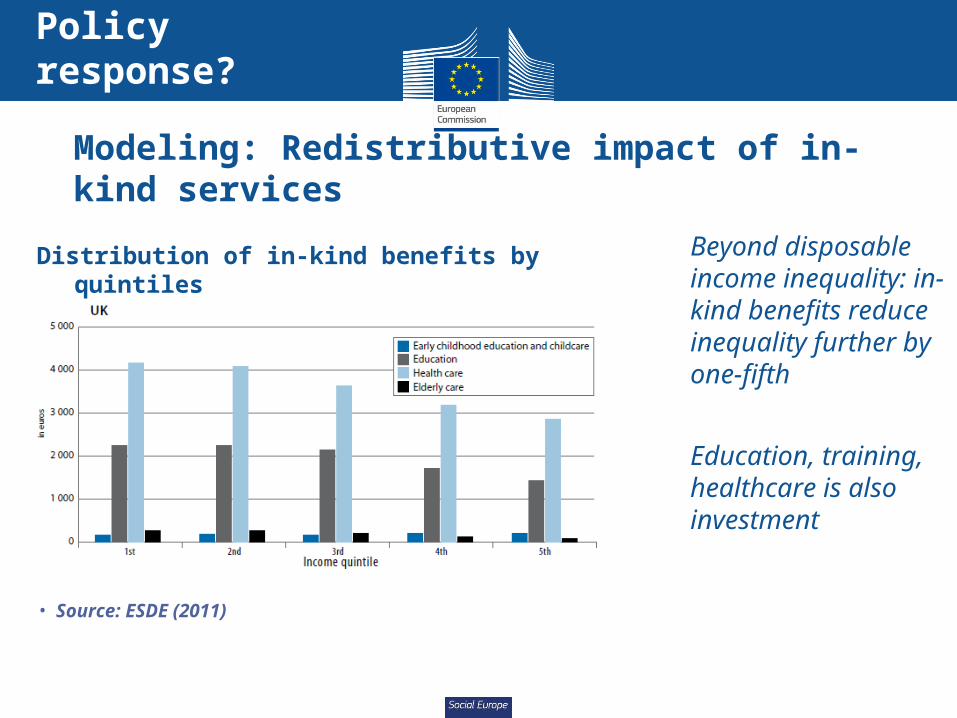
Modeling: Redistributive impact of in-kind services
• Beyond disposable income inequality: in-kind benefits reduce inequality further by one-fifth
• Education, training, healthcare is also investment
• Source: ESDE (2011)
Distribution of in-kind benefits by quintiles
Policy response?
Social Europe
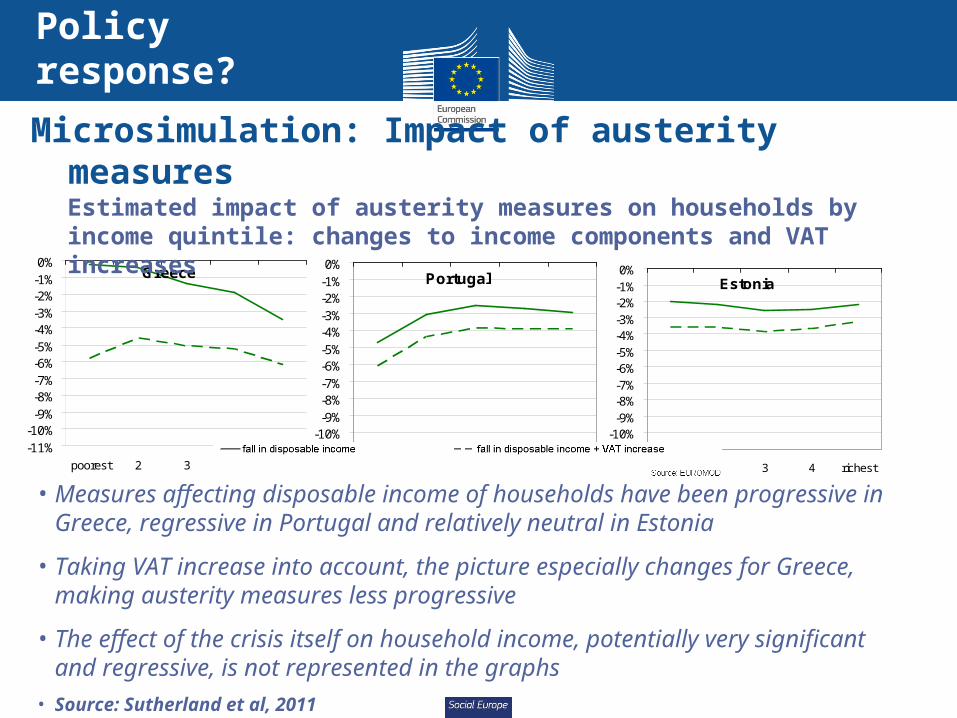
Microsimulation: Impact of austerity measures
Greece
-11%-10%
-9%-8%-7%-6%-5%-4%-3%-2%-1%0%
poorest 2 3 4 richest
Portugal
-11%-10%
-9%-8%-7%-6%-5%-4%-3%-2%-1%0%
poorest 2 3 4 richest
Estonia
-11%-10%
-9%-8%-7%-6%-5%-4%-3%-2%-1%0%
poorest 2 3 4 richest
Estimated impact of austerity measures on households by income quintile: changes to income components and VAT increases
• Measures affecting disposable income of households have been progressive in Greece, regressive in Portugal and relatively neutral in Estonia
• Taking VAT increase into account, the picture especially changes for Greece, making austerity measures less progressive
• The effect of the crisis itself on household income, potentially very significant and regressive, is not represented in the graphs
• Source: Sutherland et al, 2011
Policy response?
Social Europe
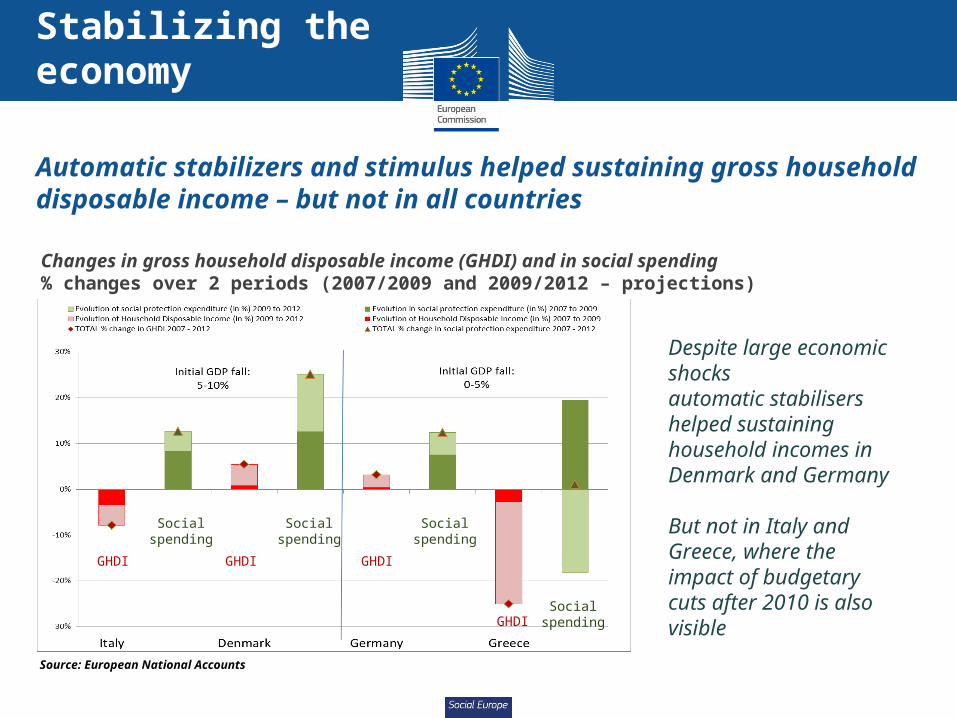
Automatic stabilizers and stimulus helped sustaining gross household disposable income – but not in all countries
Changes in gross household disposable income (GHDI) and in social spending% changes over 2 periods (2007/2009 and 2009/2012 – projections)
Source: European National Accounts
Despite large economic shocksautomatic stabilisers helped sustaining household incomes in Denmark and Germany
But not in Italy and Greece, where the impact of budgetary cuts after 2010 is also visible
GHDI GHDI GHDI
GHDI
Social spending
Social spending
Social spending
Social spending
Stabilizing the economy
Social Europe
46
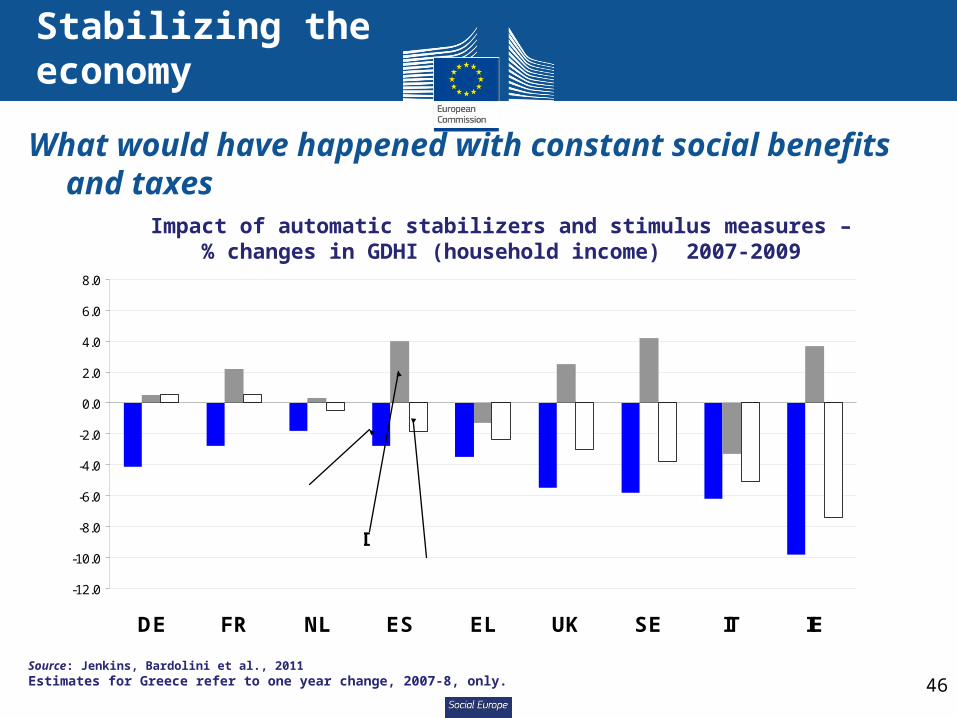
What would have happened with constant social benefits and taxes
Source: Jenkins, Bardolini et al., 2011Estimates for Greece refer to one year change, 2007-8, only.
Impact of automatic stabilizers and stimulus measures –% changes in GDHI (household income) 2007-2009
-12.0
-10.0
-8.0
-6.0
-4.0
-2.0
0.0
2.0
4.0
6.0
8.0
DE FR NL ES EL UK SE IT IE
GDP
GHDI
GHDI holding social benefits + taxes at 2007 value
Stabilizing the economy

Social Europe
Employment vs. size of the welfare state
Countries with relatively high social protection expenditure are not necessarily those with the lowest employment rates (data: average 1995 – 2010)
47Source: Eurostat
Social spending vs. Economic efficiency?
Social Europe
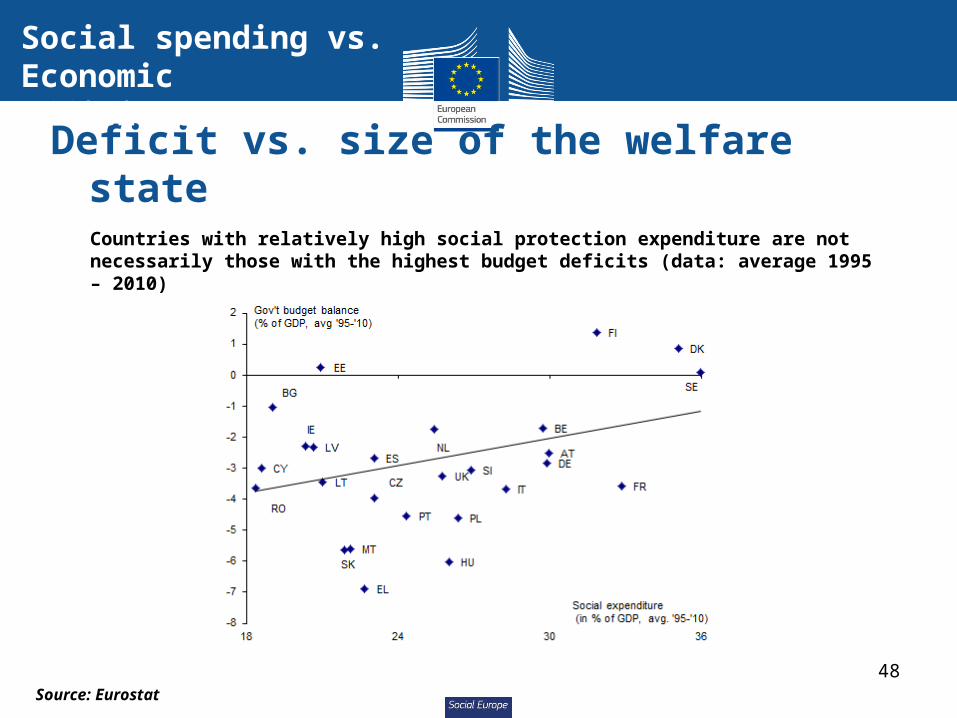
Deficit vs. size of the welfare state
Countries with relatively high social protection expenditure are not necessarily those with the highest budget deficits (data: average 1995 – 2010)
48Source: Eurostat
Social spending vs. Economic efficiency?