Poverty and Social Exclusion in the UK
56
Poverty and Social Exclusion in the UK David Gordon Professor of Social Justice Townsend Centre for International Poverty Research University of Bristol Centre for Analysis of Social Exclusion (CASE) London School of Economics and Political Science 32 Lincoln's Inn Fields, London 8 th May 2013
Transcript of Poverty and Social Exclusion in the UK

Poverty and Social Exclusion in the UK
David Gordon Professor of Social Justice
Townsend Centre for International Poverty Research University of Bristol
Centre for Analysis of Social Exclusion (CASE) London School of Economics and Political Science
32 Lincoln's Inn Fields, London 8th May 2013
Web Site http://www.bristol.ac.uk/poverty
Web Site http://www.poverty.ac.uk

Poverty in the UK

• Relative low income: proportion of children living in households where income is less than 60% of median household income before housing costs for the financial year. Target: less than 10% by 2020-21.
• Absolute low income: proportion of children living in households where income is less than 60% of median household income before housing costs in 2010-11 adjusted for prices. Target: less than 5% by 2020-21.
• Low income and material deprivation: proportion of children who experience material deprivation and live in households where income is less than 70% of median household income before housing costs for the financial year. Target: less than 5% by 2020-21.
• Persistent poverty - proportion of children living in households where income is less than 60% of median household income before housing costs for the financial year in at least 3 out of the previous 4 years. The target is to be defined in regulations by 2015.
• Severe low income & deprivation In 2009/10 the government published a new severe income and deprivation measure (income less than 50% of the median and deprived).
Child Poverty Act 2010 targets
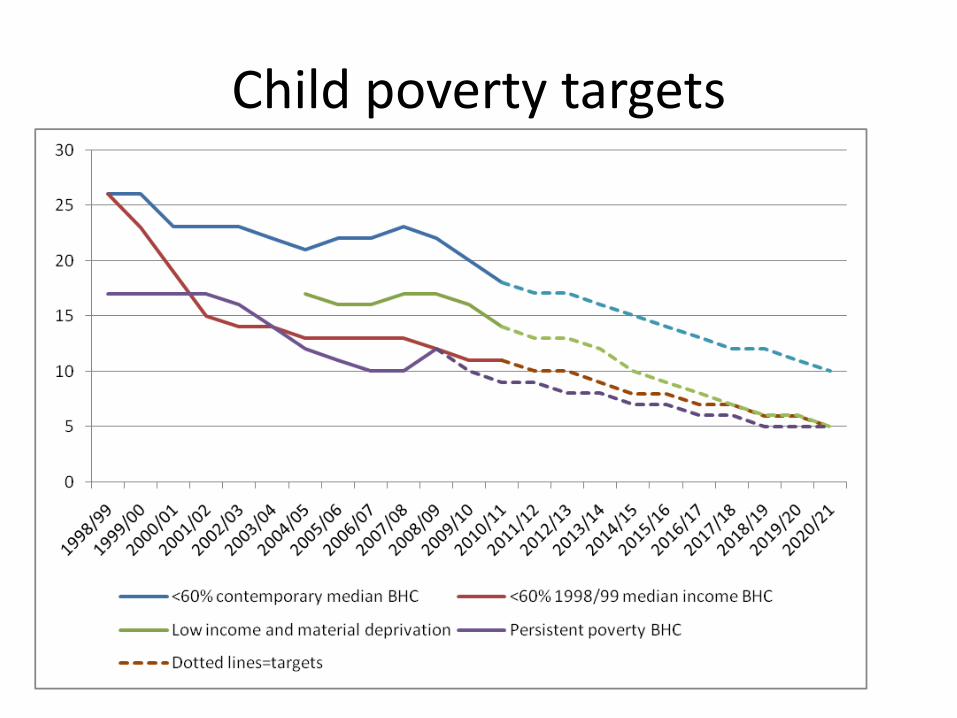
Child poverty targets

Estimated Cost of Child Poverty in the UK

The persistence of ‘area’ poverty
‘The Ghost of Christmas Past’

Low Income Households 1961 -2010 (At Risk of Poverty)
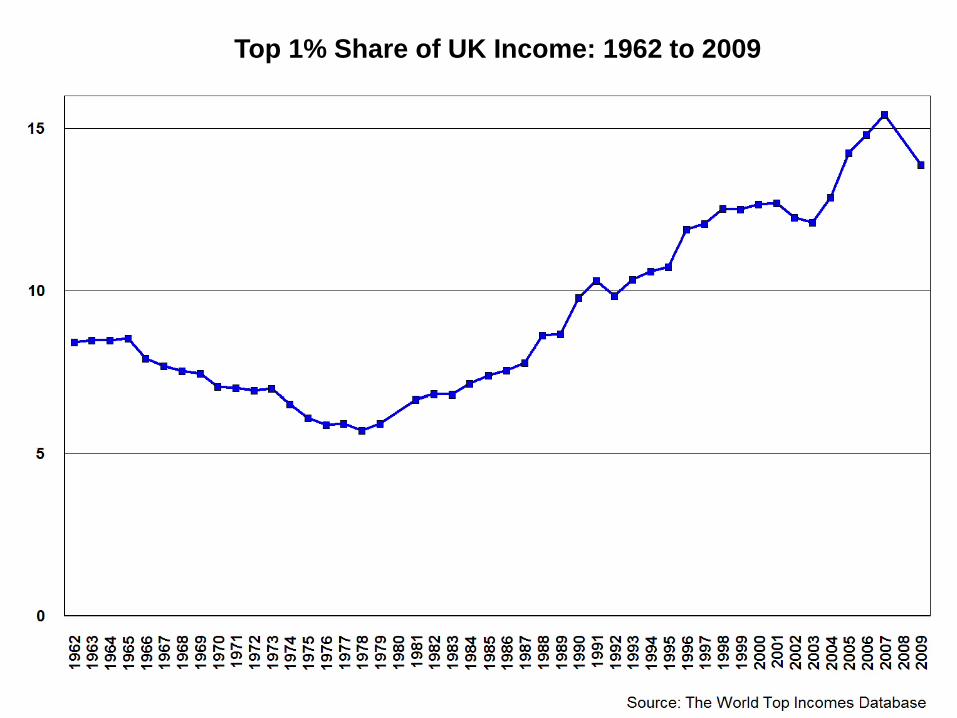
Top 1% Share of UK Income: 1962 to 2009

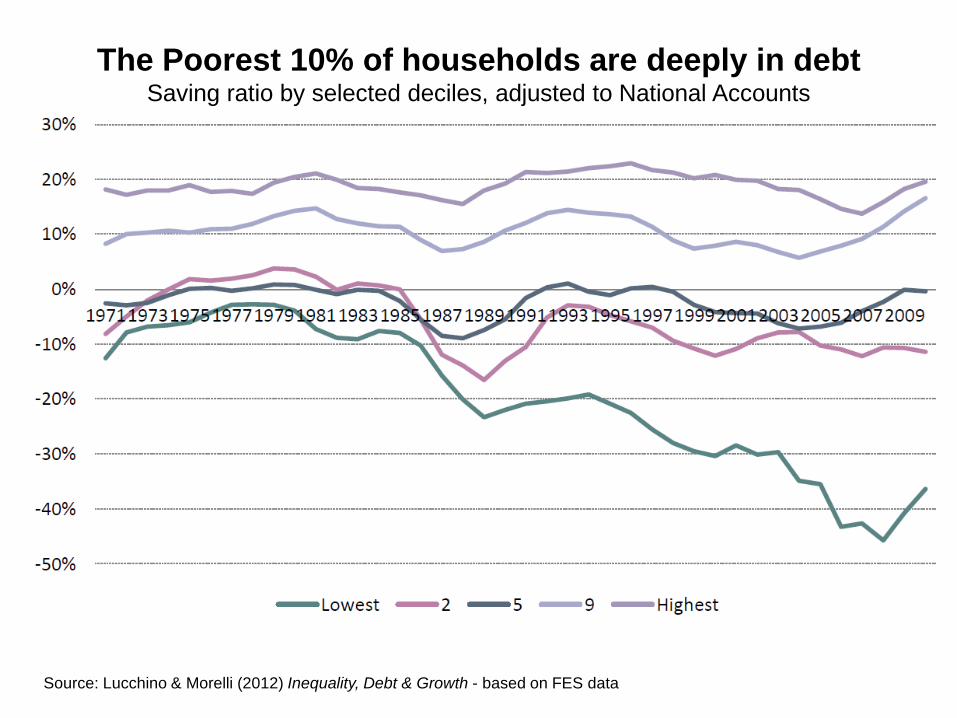
The Poorest 10% of households are deeply in debt Saving ratio by selected deciles, adjusted to National Accounts
Source: Lucchino & Morelli (2012) Inequality, Debt & Growth - based on FES data

The research grant
• Funded by the ESRC • The UK’s largest ever research project on
poverty, social exclusion and living standards
• Start April 2010 • End October 2013

The Research team • University of Bristol • Heriot-Watt University • National Centre for Social Research • Northern Ireland Statistics & Research Agency
(NISRA • The Open University • Queen's University Belfast • University of Glasgow • University of York

The research aims 1.To improve the measurement of poverty,
deprivation, social exclusion and standard of living.
2.To measure the change in the nature and extent of poverty and social exclusion over the past ten years.
3.To produce policy-relevant results about the causes and outcomes of poverty and social exclusion.

Background
Every decade since the late 1960s, UK social scientists have attempted to carry out an independent poverty survey to test out new ideas and incorporate current state of the art methods into UK poverty research.
•1968-69 Poverty in the UK survey (Peter Townsend and colleagues),
•1983 Poor Britain survey (Joanna Mack, Stewart Lansley)
•1990 Breadline Britain survey (Joanna Mack, Stewart Lansley)
•1999 Poverty and Social Exclusion Survey (Jonathan Bradshaw and colleagues) and its 2002 counterpart in Northern Ireland (Paddy Hillyard and colleagues)
•2012 Poverty and Social Exclusion in the UK
Survey Data
Omnibus Survey: Necessities of Life – A systematic random achieved sample of adults (16+) of over 1,900 interviews in Britain and Northern Ireland.
Main Survey: Poverty & Social Exclusion – A follow-up survey to the 2010/11 Family Resources Survey (circa 47,000 households). The main survey in Britain has an achieved sample of over 4,000 households and 9,500 individuals – with approximately 1,000 households in the ‘ethnic’ strata and 1,000 households in Scotland. In Northern Ireland, the achieved sample was just under be 1,000 households and over 2,000 individuals.
The survey was divided into a household questionnaire which was answered by the Household Reference Person (HRP) and an individual questionnaire which will be answered by all adult household members (aged 18 and over).

Qualitative Data
British Impoverishment Survey, a qualitative survey of over 70 respondents to explore the ‘life stories’ of participants experiencing poverty, in order to understand poverty persistence and the significance of key ‘life events’ in shaping current circumstances and prospects.
Northern Ireland Family Solidarity Survey, a qualitative survey of 50 parents to explore the role of family in coping with poverty.
In Northern Ireland, the nature of the social divisions were such that there was a high degree of reliance on family. Northern Ireland therefore presents an opportunity to explore the continuing role of family in the transmission of poverty and in coping with it.
The study has a material focus – examining the extent to which resources are transferred among family members (both nuclear and extended) - and it also explores family cultures and relationships as factors affecting poverty and social exclusion. This helps to understand the extent and limits of family solidarity
Dissemination
A major new website – www.poverty.ac.uk Full results of the 2012 Survey
Comparisons with the earlier surveys in 1983, 1990 and 1999
Development of new graphic visualisation tools enabling access to more complex datasets and richer comparisons between datasets across time
Video clips of what it means to live in poverty for key groups in 2012 (e.g. young, elderly, unemployed, disabled) and comparisons from the two broadcast documentary series accompanying the 1983 and 1990 surveys (Breadline Britain and Breadline Britain in the 1990s) to illustrate changing circumstances and attitudes
Survey Development
Rigorous qualitative & quantitative methods were used in developing and analysing the quality of the survey questionnaire;
1)Systematic literature reviews
2)Focus groups
3)Expert review
4)Cognitive interviews
5)Survey pilots
6)Behaviour coding
As far as possible comparability was maintained with UK & EU official poverty measures.
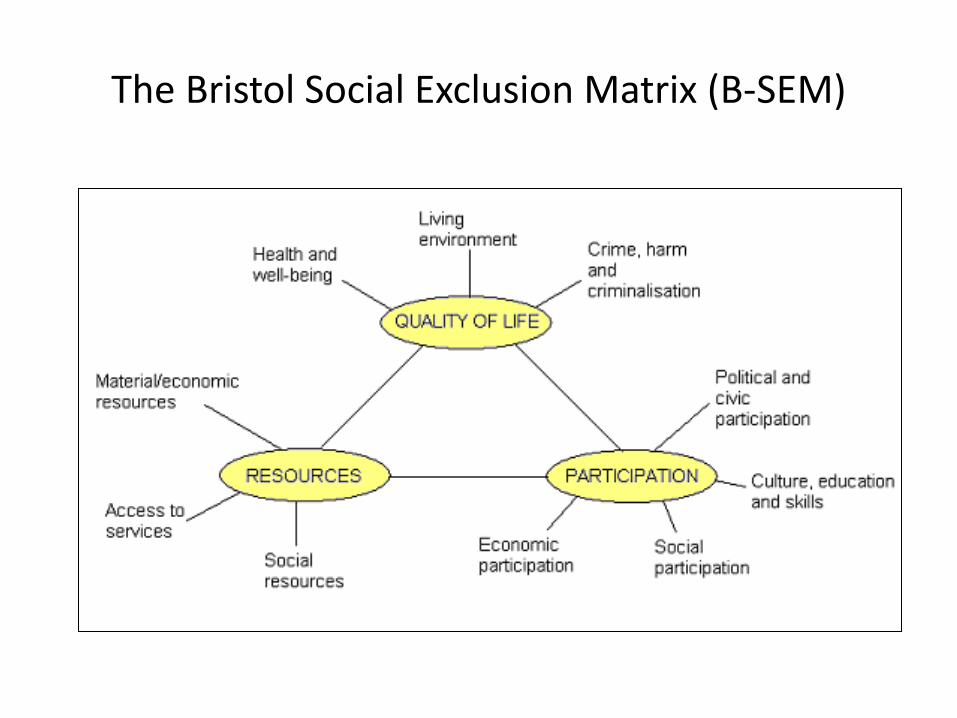
The Bristol Social Exclusion Matrix (B-SEM)
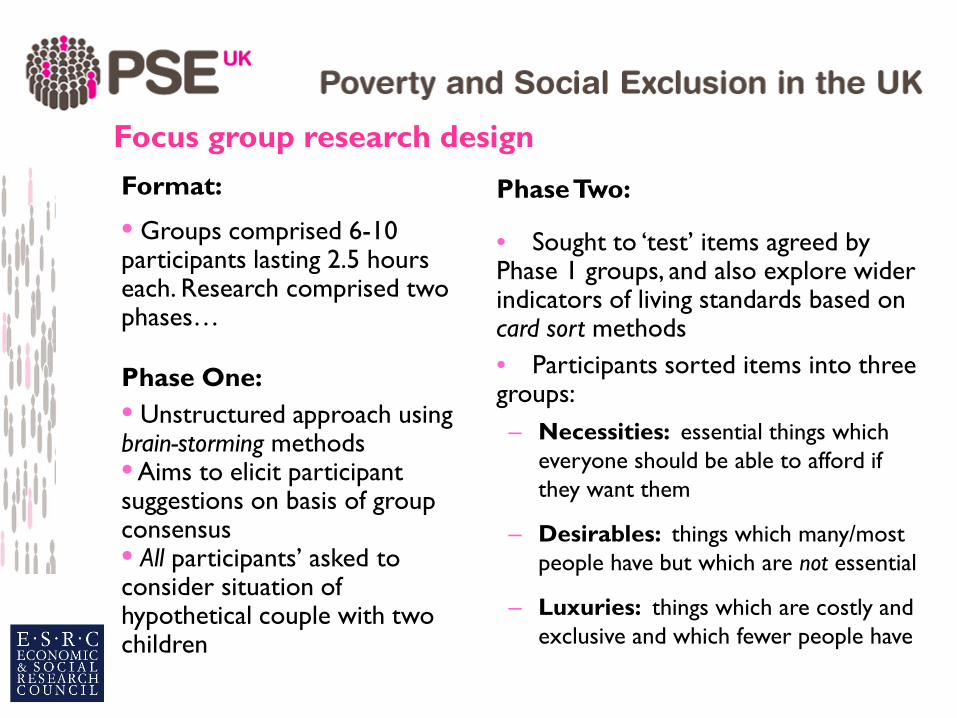
Format:
• Groups comprised 6-10 participants lasting 2.5 hours each. Research comprised two phases… Phase One: • Unstructured approach using brain-storming methods • Aims to elicit participant suggestions on basis of group consensus • All participants’ asked to consider situation of hypothetical couple with two children
Phase Two:
• Sought to ‘test’ items agreed by Phase 1 groups, and also explore wider indicators of living standards based on card sort methods • Participants sorted items into three groups: – Necessities: essential things which
everyone should be able to afford if they want them
– Desirables: things which many/most people have but which are not essential
– Luxuries: things which are costly and exclusive and which fewer people have
Focus group research design

The necessities of life items: Phase 1 groups
Funded by the UK Economic and Social Research Council (Ref: RES-060-25-0052)
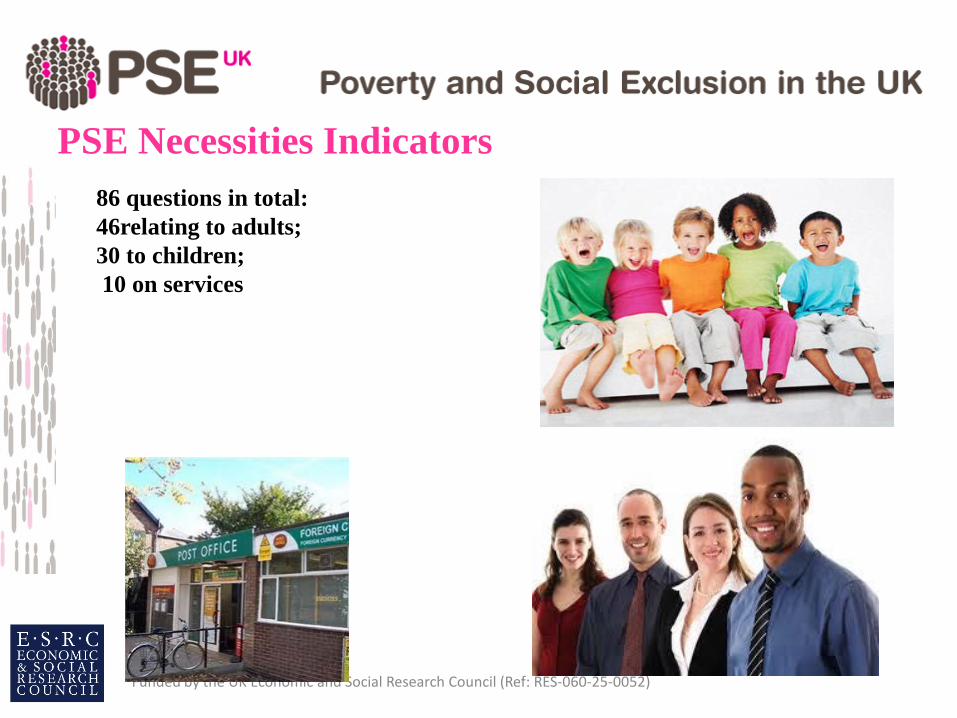
PSE Necessities Indicators 86 questions in total: 46relating to adults; 30 to children; 10 on services

Method used to operationalise ‘consensual poverty’
Two stages:
Survey 1 – Defining necessities (majority vote)
Survey 2 – Determine who experiences an enforced lack of socially perceived necessities
– Define the household income level at which people run the greatest risk of not being able to afford the socially perceived necessities
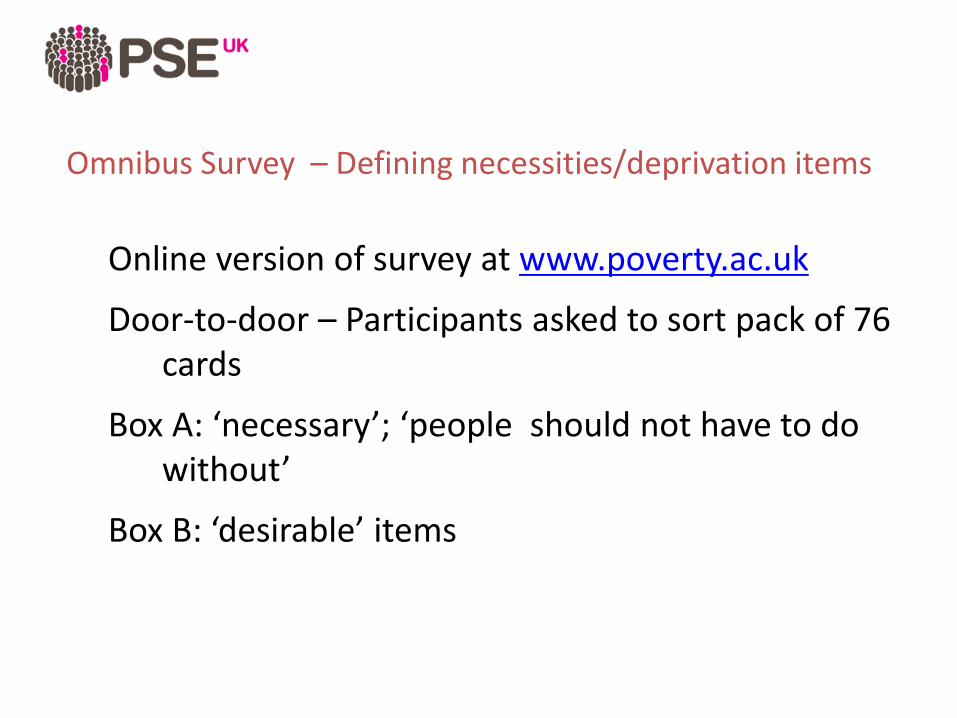
Omnibus Survey – Defining necessities/deprivation items
Online version of survey at www.poverty.ac.uk
Door-to-door – Participants asked to sort pack of 76 cards
Box A: ‘necessary’; ‘people should not have to do without’
Box B: ‘desirable’ items
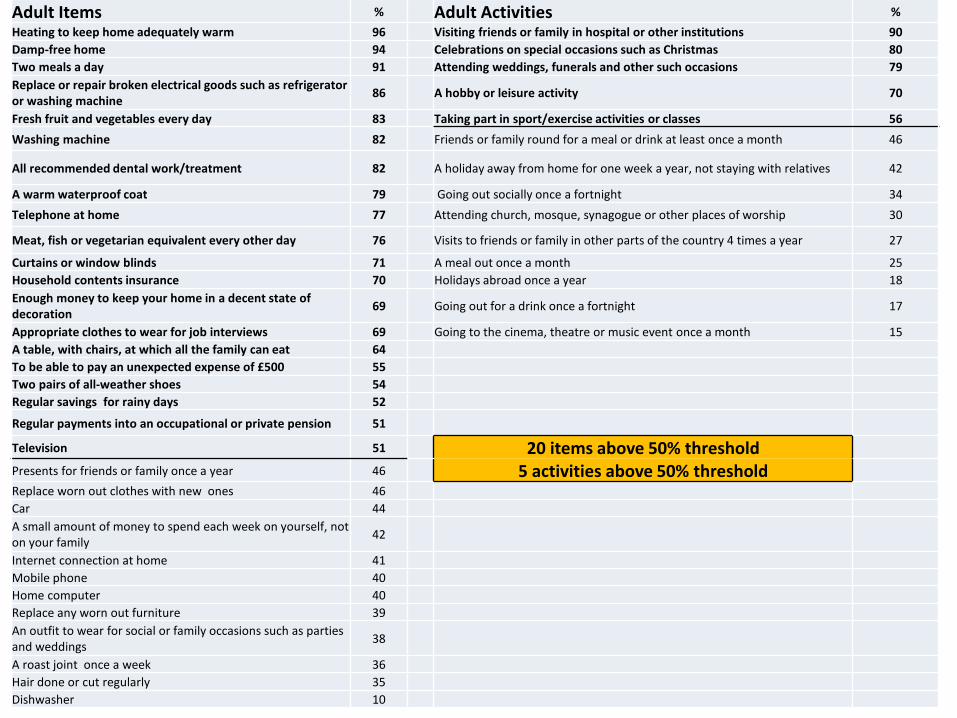
Adult Items % Adult Activities % Heating to keep home adequately warm 96 Visiting friends or family in hospital or other institutions 90 Damp-free home 94 Celebrations on special occasions such as Christmas 80 Two meals a day 91 Attending weddings, funerals and other such occasions 79 Replace or repair broken electrical goods such as refrigerator or washing machine 86 A hobby or leisure activity 70
Fresh fruit and vegetables every day 83 Taking part in sport/exercise activities or classes 56 Washing machine 82 Friends or family round for a meal or drink at least once a month 46
All recommended dental work/treatment 82 A holiday away from home for one week a year, not staying with relatives 42
A warm waterproof coat 79 Going out socially once a fortnight 34 Telephone at home 77 Attending church, mosque, synagogue or other places of worship 30
Meat, fish or vegetarian equivalent every other day 76 Visits to friends or family in other parts of the country 4 times a year 27
Curtains or window blinds 71 A meal out once a month 25 Household contents insurance 70 Holidays abroad once a year 18 Enough money to keep your home in a decent state of decoration 69 Going out for a drink once a fortnight 17
Appropriate clothes to wear for job interviews 69 Going to the cinema, theatre or music event once a month 15 A table, with chairs, at which all the family can eat 64 To be able to pay an unexpected expense of £500 55 Two pairs of all-weather shoes 54 Regular savings for rainy days 52
Regular payments into an occupational or private pension 51
Television 51 20 items above 50% threshold Presents for friends or family once a year 46 5 activities above 50% threshold Replace worn out clothes with new ones 46 Car 44 A small amount of money to spend each week on yourself, not on your family 42
Internet connection at home 41 Mobile phone 40 Home computer 40 Replace any worn out furniture 39 An outfit to wear for social or family occasions such as parties and weddings 38
A roast joint once a week 36 Hair done or cut regularly 35 Dishwasher 10
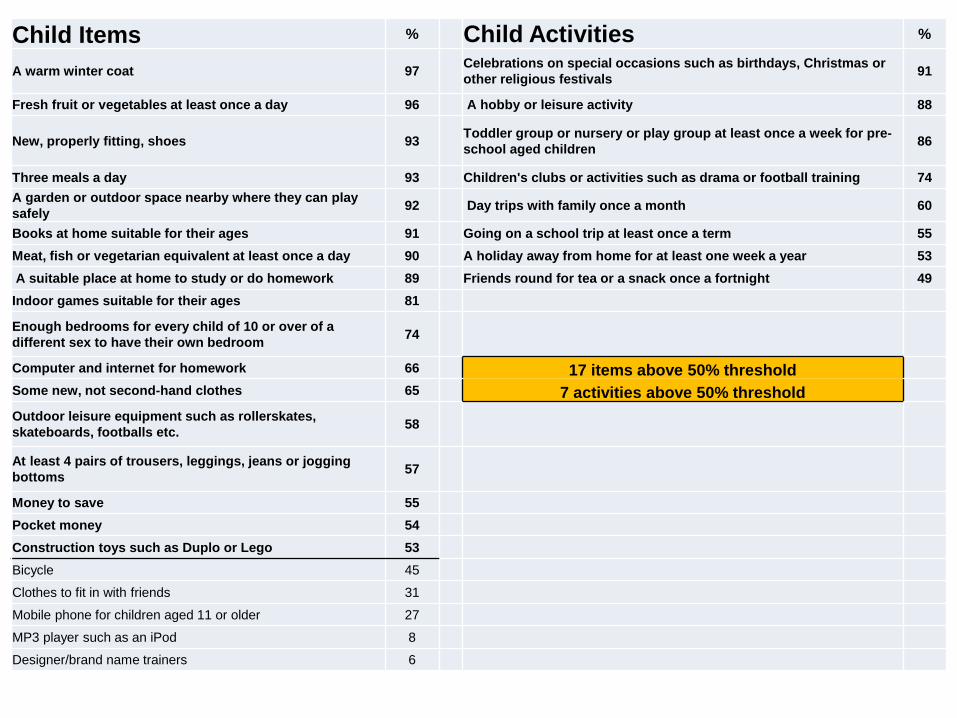
Child Items % Child Activities %
A warm winter coat 97 Celebrations on special occasions such as birthdays, Christmas or other religious festivals 91
Fresh fruit or vegetables at least once a day 96 A hobby or leisure activity 88
New, properly fitting, shoes 93 Toddler group or nursery or play group at least once a week for pre-school aged children 86
Three meals a day 93 Children's clubs or activities such as drama or football training 74 A garden or outdoor space nearby where they can play safely 92 Day trips with family once a month 60
Books at home suitable for their ages 91 Going on a school trip at least once a term 55 Meat, fish or vegetarian equivalent at least once a day 90 A holiday away from home for at least one week a year 53 A suitable place at home to study or do homework 89 Friends round for tea or a snack once a fortnight 49 Indoor games suitable for their ages 81
Enough bedrooms for every child of 10 or over of a different sex to have their own bedroom 74
Computer and internet for homework 66 17 items above 50% threshold Some new, not second-hand clothes 65 7 activities above 50% threshold Outdoor leisure equipment such as rollerskates, skateboards, footballs etc. 58
At least 4 pairs of trousers, leggings, jeans or jogging bottoms 57
Money to save 55 Pocket money 54 Construction toys such as Duplo or Lego 53 Bicycle 45
Clothes to fit in with friends 31
Mobile phone for children aged 11 or older 27
MP3 player such as an iPod 8
Designer/brand name trainers 6

The Impoverishment of Expectations in the UK
The current long recession and austerity measures have taken their toll and people in the UK now consider many things which in the past were viewed as essential to no longer be necessities of life. Less than 50% of the population currently believes these items are necessities 1.Presents for friends or family once a year 2.Replace worn out clothes with some new ones 3.A small amount of money to spend each week on yourself, not on your family 4.Friends or family round for a meal or drink at least once a month 5.A holiday away from home for one week a year, not staying with relatives 6.Replace worn out furniture 7.An outfit to wear for social or family occasions such as parties and weddings 8.Children’s friends round for tea or a snack once a fortnight

Demonstrating Consensus (or, a series of the world’s most boring graphs)

Consensus between GB & NI – Adult necessities
Relative risk ratios computed for each item; no statistically significant differences found between GB and NI for items; only one significant difference for activities – attending a place of worship.
GB - 20 items and 5 activities above the 50% threshold NI - 17 items and 6 activities above the 50% threshold
Attending a place of worship

SOCIAL CLASS OF RESPONDENT
(Prof/Managerial vs Routine/Semi-routine)
SOCIAL CLASS OF RESPONDENT (Manual
vs Non-Manual)
Equivalised HH Income quintiles
Educational qualification obtained Tenure Political party
supported
Adult Items Managerial
and professional occupations
Semi-routine and
routine occupations
NON-MANUAL
ROUTINE/MANUAL
Poorest quintile
Richest quintile
Degree or higher
No qualifications Owner Social
Renter Cons-Lib Labour
Heating to keep home adequately warm 97% 95% 97% 95% 93% 97% 98% 94% 96% 96% 97% 96% Damp-free home 97% 93% 97% 93% 94% 96% 98% 92% 96% 93% 96% 95% Two meals a day 91% 93% 91% 92% 92% 90% 95% 89% 90% 91% 89% 91% Replace or repair broken electrical goods 85% 89% 85% 88% 87% 87% 89% 85% 86% 88% 86% 88% Fresh fruit and vegetables every day 88% 76% 88% 76% 73% 88% 90% 78% 85% 74% 87% 84% Washing machine 79% 84% 79% 85% 82% 79% 76% 85% 81% 85% 81% 85% All recommended dental treatment 81% 82% 81% 81% 84% 80% 84% 80% 81% 82% 85% 80% Warm waterproof coat 85% 76% 85% 76% 69% 86% 89% 78% 82% 77% 85% 79% Telephone 78% 76% 78% 76% 77% 71% 78% 84% 80% 70% 81% 78% Meat, fish or vegetarian equivalent every other day 84% 66% 84% 68% 72% 81% 87% 68% 79% 65% 81% 76% Curtains or window blinds 72% 72% 72% 71% 72% 70% 71% 74% 72% 69% 73% 74% Enough money to keep your home in a decent state of decoration 68% 71% 68% 72% 64% 61% 66% 82% 71% 73% 70% 75%
Appropriate clothes for job interviews 74% 66% 74% 66% 71% 77% 77% 59% 70% 66% 69% 71% Household contents insurance 70% 66% 70% 68% 57% 72% 68% 75% 79% 52% 79% 67% Table and chairs at which all the family can eat 72% 57% 72% 58% 58% 66% 71% 68% 69% 54% 72% 64% To be able to pay unexpected costs of £500 61% 52% 61% 53% 46% 50% 55% 59% 60% 47% 60% 55% Two pairs of all weather shoes 54% 57% 54% 55% 52% 51% 58% 63% 54% 57% 55% 55% Regular savings (of at least £20 a month) for rainy days 55% 53% 55% 53% 52% 56% 53% 55% 54% 47% 56% 49% Television 45% 57% 45% 56% 42% 38% 42% 70% 50% 59% 53% 56% Regular payments to an occupational or private pension 57% 47% 57% 48% 51% 60% 56% 42% 55% 39% 53% 54% Presents for family or friends once a year 44% 49% 44% 49% 49% 40% 42% 56% 47% 53% 47% 49% Replace worn out clothes with new not second hand clothes 43% 51% 43% 51% 53% 42% 45% 50% 47% 50% 45% 50% A small amount of money to spend each week on yourself, not on your family 45% 42% 45% 43% 43% 32% 38% 50% 42% 42% 43% 43%
Car 45% 42% 45% 42% 35% 40% 35% 48% 48% 36% 49% 44% Mobile phone 34% 47% 34% 45% 54% 33% 35% 44% 37% 43% 37% 41% Internet connection at home 47% 38% 47% 37% 49% 46% 48% 29% 41% 33% 41% 44% Home computer 45% 38% 45% 35% 46% 45% 48% 30% 41% 33% 39% 42% Replace any worn out furniture 32% 49% 32% 47% 46% 28% 31% 51% 38% 45% 33% 41% An outfit to wear for social or family occasions such as parties, weddings etc 37% 39% 37% 40% 38% 31% 35% 47% 39% 40% 37% 41%
Roast joint or equivalent once a week 32% 42% 32% 42% 31% 29% 22% 49% 37% 44% 36% 36% Hair done or cut regularly 34% 34% 34% 35% 34% 34% 33% 45% 37% 39% 41% 32% Dishwasher 12% 11% 12% 11% 18% 9% 8% 10% 11% 5% 9% 11%

2.0
1.4 1.3 1.3
0.8
0.0
0.5
1.0
1.5
2.0
2.5
3.0
Dishwasher Money to spend onself
Internet at home Some new clothes Shoes
Male vs. Female
1.4 1.3
0.8 0.7
0.0
0.5
1.0
1.5
2.0
2.5
3.0
Going out for a drink oncea fortnight
Going out socially once afortnight
Friends/family round for ameal/drink once a month
Worship
9 significant differences: 5 items, 4 activities Men are more likely to consider the following necessities: Dishwasher; Money to spend on self; Internet at home; Some new clothes; Going out for a drink or socially once a fortnight Women are more likely to consider the following necessities: Two pairs of all weather shoes; Friends/family round for a meal/drink; attending a place of worship
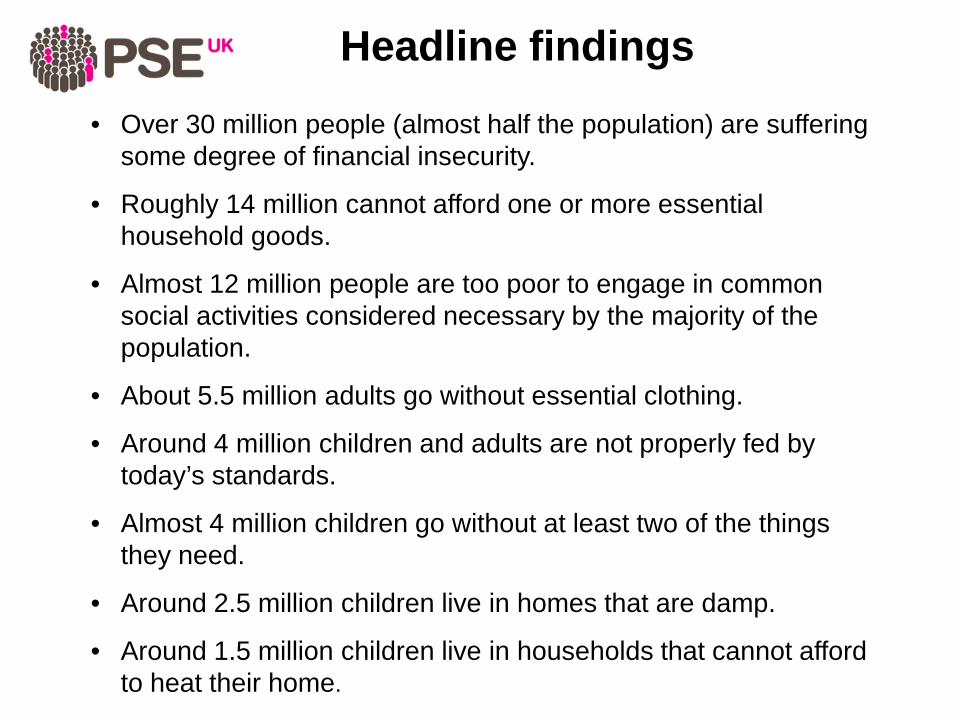
• Over 30 million people (almost half the population) are suffering some degree of financial insecurity.
• Roughly 14 million cannot afford one or more essential household goods.
• Almost 12 million people are too poor to engage in common social activities considered necessary by the majority of the population.
• About 5.5 million adults go without essential clothing.
• Around 4 million children and adults are not properly fed by today’s standards.
• Almost 4 million children go without at least two of the things they need.
• Around 2.5 million children live in homes that are damp.
• Around 1.5 million children live in households that cannot afford to heat their home.
Headline findings

• One in three people could not afford to adequately heat their homes last winter and 29% had to turn the heating down or off or only heat part of their homes The number of households unable to heat the living areas of their homes is at a record high – now 9% compared to 3% in the 1990s and 5% in 1983.
• Overcrowding is as high as it was in 1983: today 9% of households cannot afford enough bedrooms for every child aged 10 or over of a different sex to have their own bedroom (back up from 3% in 1999).
• The number of households unable to afford damp-free homes has also risen since 1983 – from 6% to 10%.
• One in five households can’t keep their home in an adequate state of decoration – up from 15% in the 1990s.
• Overall, across all these aspects of housing, around 13 million people (aged 16 and over) in Britain cannot afford adequate housing conditions, up from 9.5 million in 1999
• The proportion of school age children unable to go on school trips at least once a term has risen from 2% in 1999 to 8% today.
Since 2010 deprivation has increased in the UK

There is widespread public agreement on what constitutes a minimally acceptable diet. Over 90% agree that, for children, this means: three meals a day; fresh fruit and vegetables; and meat, fish or a vegetarian equivalent at least once a day. Yet well over half a million children live in families who cannot afford to feed them properly. ‘I go without for the children so they have proper meals. I can live on one meal a day.’ Jennie, single parent of 3 children Our research shows that, in households where children go without one or more of these basic food necessities: In 93% at least one adult skimp on their own food ‘sometimes’ or ‘often’ to ensure others have enough to eat.
Hunger in the UK

Identifying the Poor

Modal Deprivation by Logarithm of Income as a Percentage of Supplementary Benefit Scale Rates (Townsend, 1979)

Poverty Groups

Time
High
Low
Income andStandard of Living
Poverty Threshold
Income
Standard of Living
0 1 2 3 4 5
Not Poor
Poor
Not Poor
Sinkingintopoverty
Climbingout ofpoverty
Dynamics of poverty

PSE2012 First Estimate of the Poverty Line(s)

Deprivation General Health
Genuinely Poor
MiQ Standard of Living
twomeal 5 13.9 16.8 12.3 meatfish 5.6 14.7 13.7 13.9 vegfruit 5.6 15.7 10.7 10.5 curtains 4.9 13.9 14.3 9.1 presents 3.9 16.2 8.4 10.7 poshfroc 3.6 18.3 8.5 8.7 elec 3.4 13.3 10.3 11 clothes 4.2 12.7 10 10.2
Validity Analyses: Odds of being in poor health or subjectively poor if you are deprived
(TV is the only item which is invalid for one indicator - SoL)

Cronbach's Alpha if Item Deleted
Enough money to keep home in a decent state of decoration .855 Enough money to replace or repair broken electircal goods such as a fridge or washing machine .852 Two pairs of all weather shoes .860 Regular savings (of at least £20) for rainy days .857 A warm waterproof coat .863 Meat, fish or vegetarian equivalent every other day .863 Heating to keep home adequately warm .862 Two meals a day .865 Fresh fruit and vegetables everyday .861 Appropriate clothes for job interviews .860 All recommended dental work/treatment .862 Regular payments into an ocupational or private pension .862 A hobby or leisure activity. .861 Celebrations on special occcasions, such as Christmas .865 Attending weddings, funerals and other such occasions .865 Visiting friends or family in hospital or other institutions .867 Taking part in sport/exercise activities or classes .861 Washing machine .868 Damp-free home .866 Television .869 Telephone .868 Home Insurance .860 Curtains or window blinds .867 Table and chairs at which all the family can eat .865 Could your household afford to pay an unexpected, but necessary, expense of £500? .857 Scale Alpha 0.867
Reliability Results
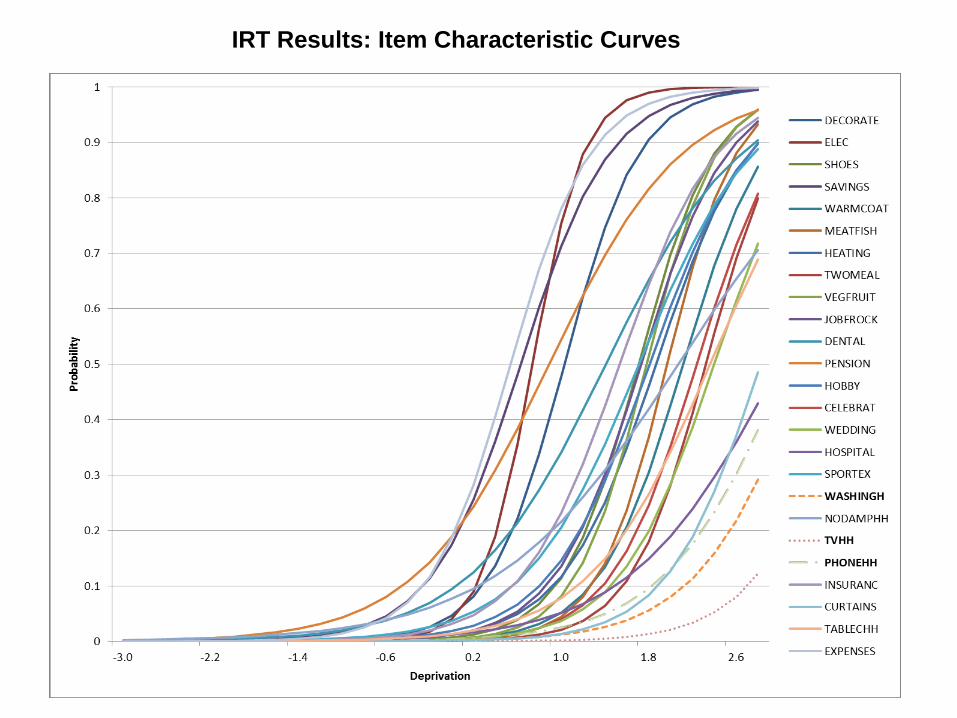
IRT Results: Item Characteristic Curves

Item Severity Loading
Could your household afford to pay an unexpected, but necessary, expense of £500?
0.5 0.8
Regular savings (of at least £20) for rainy days 0.6 0.8 Enough money to replace or repair broken electircal goods such as a fridge or washing machine
0.7 0.9
Regular payments into an ocupational or private pension 0.9 0.7 Enough money to keep home in a decent state of decoration 1.0 0.9 All recommended dental work/treatment 1.4 0.7 Home Insurance 1.5 0.8 Two pairs of all weather shoes 1.7 0.8 Taking part in sport/exercise activities or classes 1.7 0.7 Appropriate clothes for job interviews 1.7 0.8 Fresh fruit and vegetables everyday 1.8 0.9 A hobby or leisure activity. 1.8 0.8 Heating to keep home adequately warm 1.9 0.8 Meat, fish or vegetarian equivalent every other day 2.0 0.9 Damp-free home 2.1 0.6 A warm waterproof coat 2.1 0.8 Celebrations on special occcasions, such as Christmas 2.2 0.8 Two meals a day 2.3 0.8 Table and chairs at which all the family can eat 2.4 0.7 Attending weddings, funerals and other such occasions 2.4 0.8 Curtains or window blinds 2.8 0.8 Visiting friends or family in hospital or other institutions 3.0 0.6 Telephone 3.1 0.7 Washing machine 3.3 0.7 Television 3.6 0.8
IRT Results –Severity & Discrimination of each Deprivation Indicator
0
0.5
1
1.5
2
2.5
-3.0 -2.2 -1.4 -0.6 0.2 1.0 1.8 2.6
Info
rmat
ion
Deprivation
WASHING TV
PHONE EXPENSES
TWOMEAL SHOES
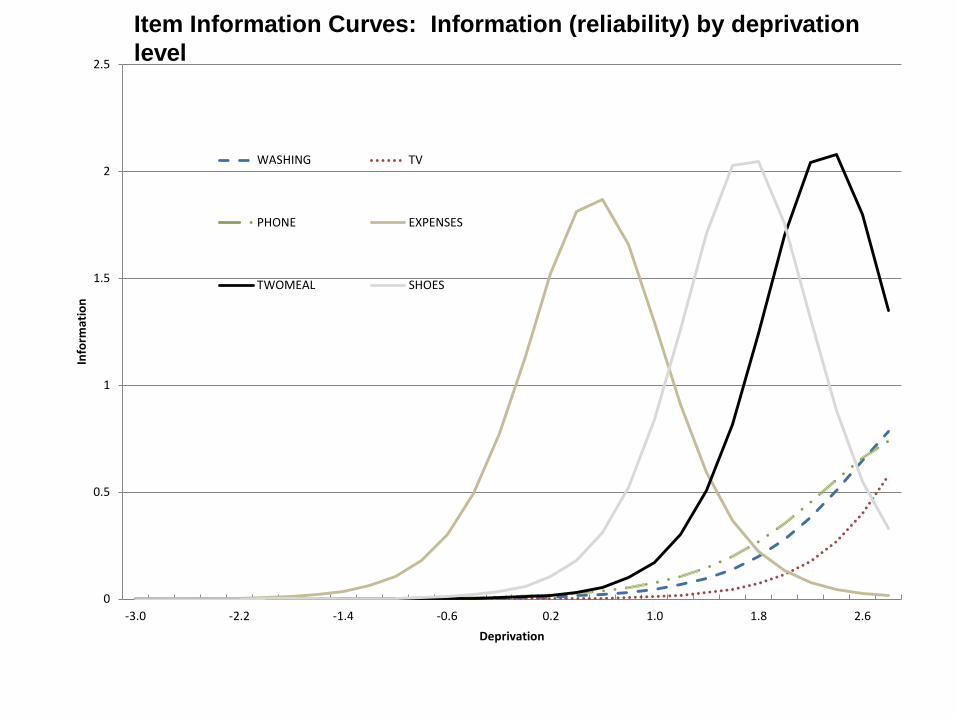
Item Information Curves: Information (reliability) by deprivation level

Example of an Additivity Analysis

HBAI 2011 (HBAI
Weight)
FRS PSE subsample
2011 (PSE Weight)
PSE 2012 (PSE Weight)
PSE 2012 simple proportional
approach (PSE weight)
GROSS Income 513 510 496 496
NET Income 417 415 409 412
UK Households 25,943,841 25,838,054 25,838,054 25,838,054
PSE 2012 Median Household Gross and Net Income compared with the 2010/11 Family Resources Survey
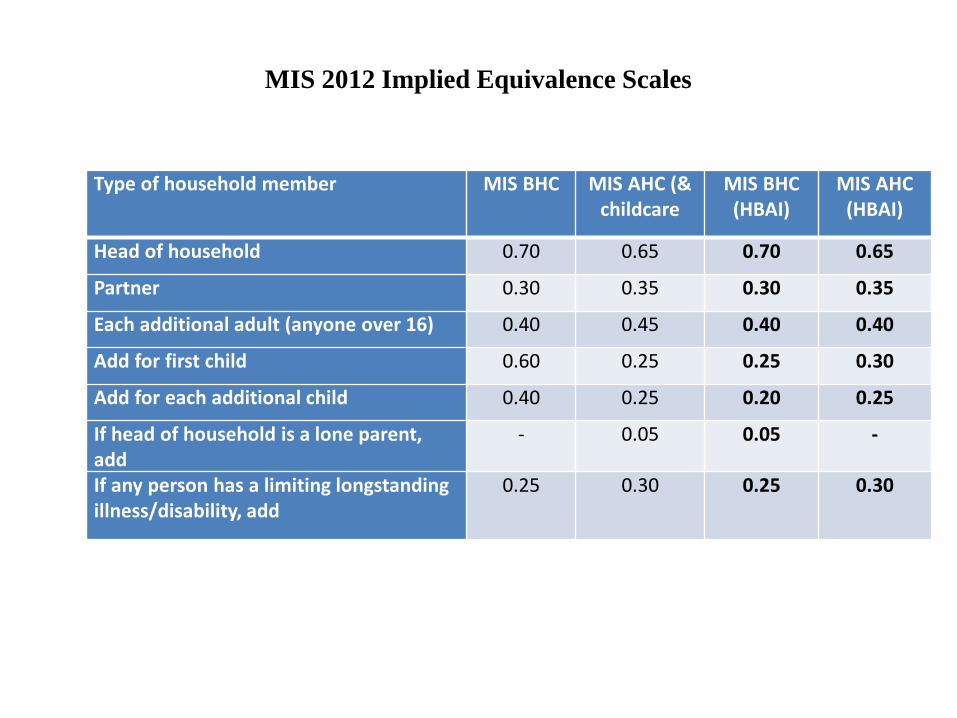
Type of household member MIS BHC MIS AHC (& childcare
MIS BHC (HBAI)
MIS AHC (HBAI)
Head of household 0.70 0.65 0.70 0.65
Partner 0.30 0.35 0.30 0.35
Each additional adult (anyone over 16) 0.40 0.45 0.40 0.40
Add for first child 0.60 0.25 0.25 0.30
Add for each additional child 0.40 0.25 0.20 0.25
If head of household is a lone parent, add
- 0.05 0.05 -
If any person has a limiting longstanding illness/disability, add
0.25 0.30 0.25 0.30
MIS 2012 Implied Equivalence Scales

The Present Day Context

'We are particularly concerned about evidence demonstrating that poverty is transmitted between generations‘
The evidence available indicates that simply increasing household income, though reducing income poverty, will not make a big difference to children's life chances. ‘ (Emphasis in original text)
This is an attempted revival of Cultural Deficit Theory - the 1960s idea that underachievement among poor/working class students was a result of deficiencies with the students, their families and communities. The cultural deficit models argued that since working class/poor parents failed to embrace the educational values of the dominant middle/upper classes, and continued to transmit to their children values which inhibited educational achievement/mobility, then the parents/working class culture are to blame if low educational attainment continues into succeeding generations. The new governments recommended measures largely ignore the structural reasons for educational underachievement (i.e. inadequate school funding in poor areas, social class segregation in the education system, low quality teaching, exclusions, school's failure to prevent bullying, teacher prejudice/bias/lack of respect, etc.).
The Return of Cultural Deficit Theory: Tackling child poverty and improving life chances, consulting on a new approach
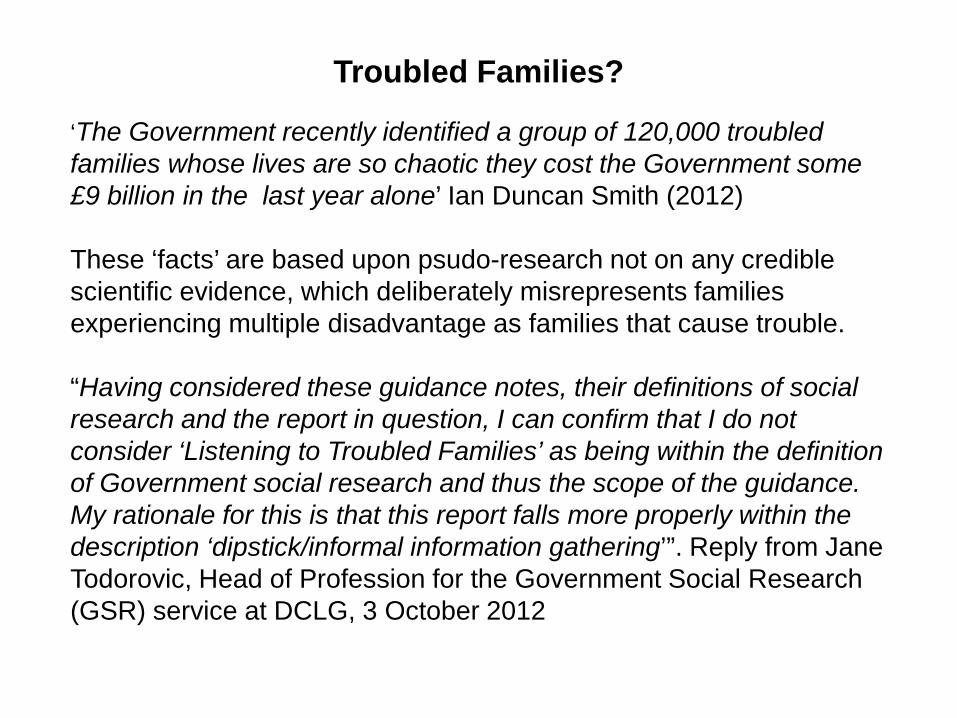
Troubled Families?
‘The Government recently identified a group of 120,000 troubled families whose lives are so chaotic they cost the Government some £9 billion in the last year alone’ Ian Duncan Smith (2012) These ‘facts’ are based upon psudo-research not on any credible scientific evidence, which deliberately misrepresents families experiencing multiple disadvantage as families that cause trouble. “Having considered these guidance notes, their definitions of social research and the report in question, I can confirm that I do not consider ‘Listening to Troubled Families’ as being within the definition of Government social research and thus the scope of the guidance. My rationale for this is that this report falls more properly within the description ‘dipstick/informal information gathering’”. Reply from Jane Todorovic, Head of Profession for the Government Social Research (GSR) service at DCLG, 3 October 2012

The coalition Government’s child poverty strategy will include three main elements: •A stronger focus on ensuring that families who are in work are supported to work themselves out of poverty; families that are unable to work are able to live with dignity and not entrenched in persistent poverty; and that those who can work but are not in work are provided with services that will address their particular needs and help them overcome barriers to work. •A stronger focus on improving children’s future life chances, by intervening early to improve the development and attainment of disadvantaged children and young people throughout their progression to adulthood. •A stronger focus on place and delivering services as close to the family as possible, by empowering local partners and ensuring that local diversity can be recognised and developing strong local accountability frameworks.
UK Government’s Child Poverty Strategy
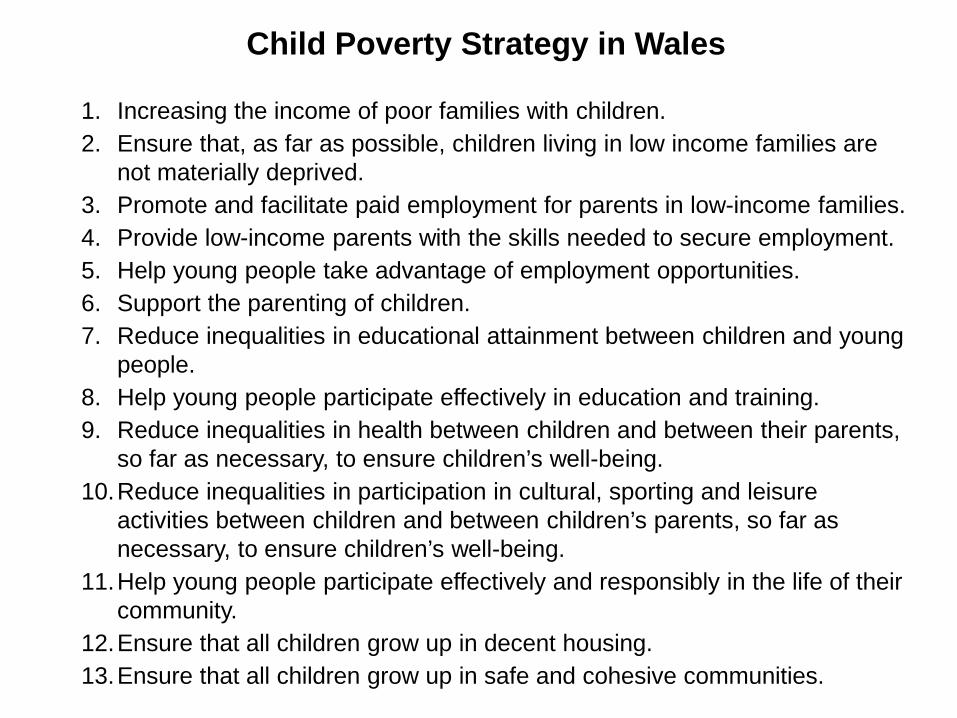
1. Increasing the income of poor families with children. 2. Ensure that, as far as possible, children living in low income families are
not materially deprived. 3. Promote and facilitate paid employment for parents in low-income families. 4. Provide low-income parents with the skills needed to secure employment. 5. Help young people take advantage of employment opportunities. 6. Support the parenting of children. 7. Reduce inequalities in educational attainment between children and young
people. 8. Help young people participate effectively in education and training. 9. Reduce inequalities in health between children and between their parents,
so far as necessary, to ensure children’s well-being. 10.Reduce inequalities in participation in cultural, sporting and leisure
activities between children and between children’s parents, so far as necessary, to ensure children’s well-being.
11.Help young people participate effectively and responsibly in the life of their community.
12.Ensure that all children grow up in decent housing. 13.Ensure that all children grow up in safe and cohesive communities.
Child Poverty Strategy in Wales

The UK Government’s child poverty strategy inadequately addresses seven key areas which are included in the Welsh child poverty strategy and delivery plan. These include: 1. Increasing the incomes of poor families with children. 2. Reducing social and material deprivation of poor children. 3. Improving housing condition of poor children. 4. Improving the health of poor children and reducing health inequalities
amongst children. 5. Improving the educational attainment and reduce educational
inequalities amongst both younger and older children. 6. Improving poor children’s participation in cultural, sporting and leisure
activities and reducing inequalities in these areas amongst children. 7. Facilitating children and young people to participate more fully in their
communities.
UK Child Poverty Strategy: The Problems