Measurement of Poverty and Social Exclusion in Japan
56
Aya K. Abe National Institute of Population and Social Security Research Tokyo, Japan Second Townsend Memorial Conference, Measuring Poverty : The State of Art, 22-23 January 2010
-
Upload
ocean-santos -
Category
Documents
-
view
30 -
download
1
description
Measurement of Poverty and Social Exclusion in Japan. Aya K. Abe National Institute of Population and Social Security Research Tokyo, Japan. Second Townsend Memorial Conference, Measuring Poverty : The State of Art, 22-23 January 2010. Poverty Rates of OECD countries(Mid 2000s). - PowerPoint PPT Presentation
Transcript of Measurement of Poverty and Social Exclusion in Japan

Aya K. AbeNational Institute of Population and Social Security
ResearchTokyo, Japan
Second Townsend Memorial Conference, Measuring Poverty : The State of Art, 22-23 January 2010

Data: OECD(2008) Growing Unequal?
Poverty Rates of OECVD Countries (Mid 2000s) : Income measure

Upto 2008 : Denial stage

Oct. 2009: Announcement of Relative Poverty Rate
Jan. 18, 2011: Social Inclusion Special Team
established under Prime Minister’s Office
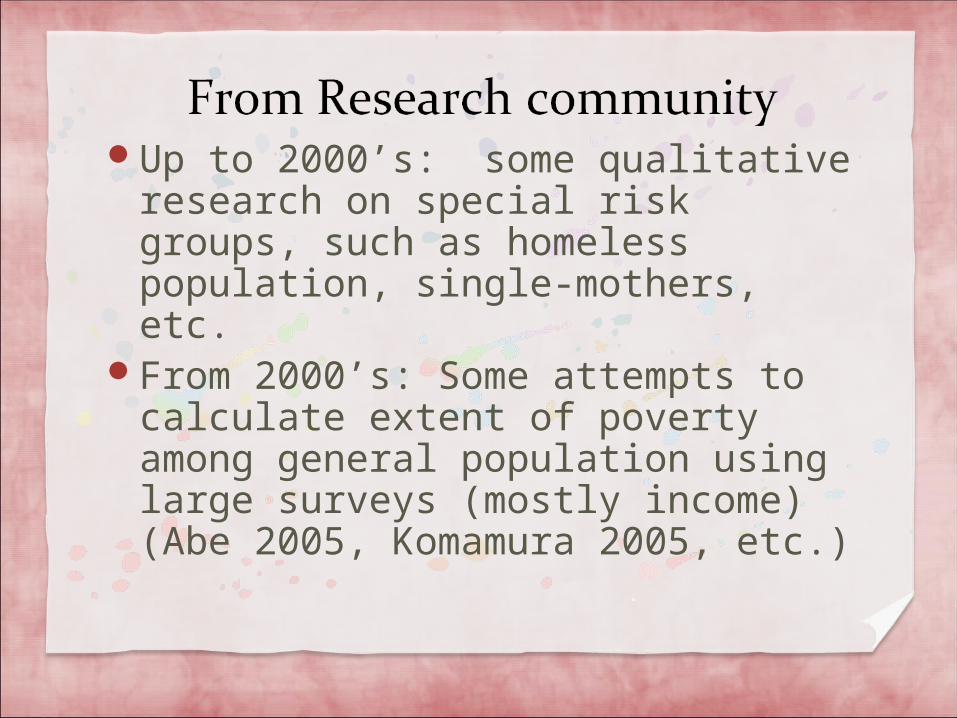
Up to 2000’s: some qualitative research on special risk groups, such as homeless population, single-mothers, etc.
From 2000’s: Some attempts to calculate extent of poverty among general population using large surveys (mostly income) (Abe 2005, Komamura 2005, etc.)
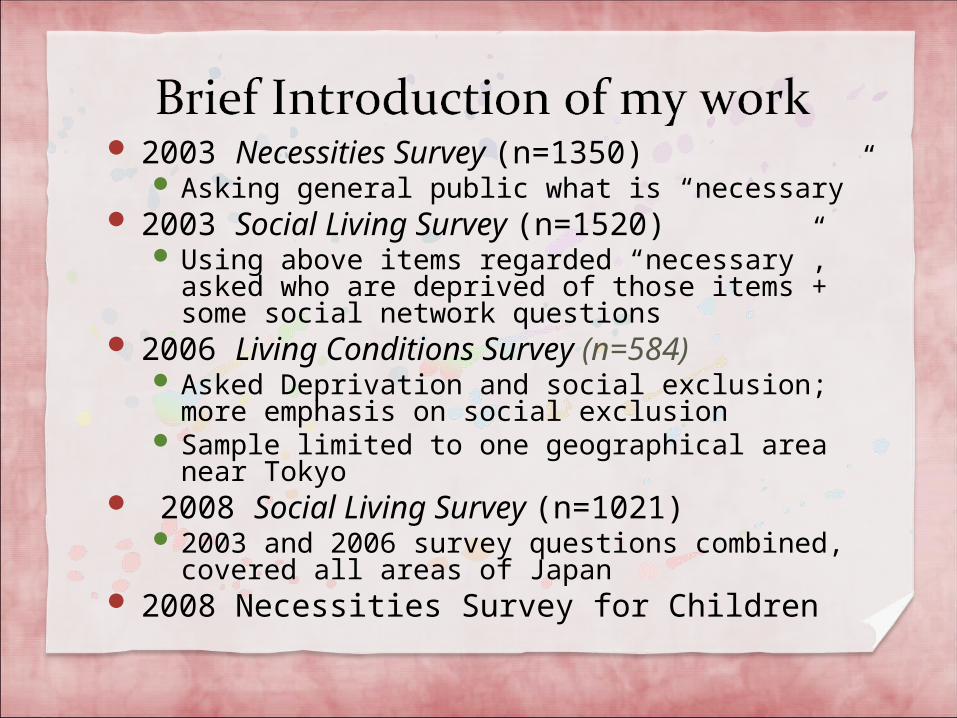
2003 Necessities Survey (n=1350) Asking general public what is “necessary”
2003 Social Living Survey (n=1520) Using above items regarded “necessary”,
asked who are deprived of those items + some social network questions
2006 Living Conditions Survey (n=584) Asked Deprivation and social exclusion; more
emphasis on social exclusion Sample limited to one geographical area near
Tokyo 2008 Social Living Survey (n=1021)
2003 and 2006 survey questions combined, covered all areas of Japan
2008 Necessities Survey for Children

Is it essential? Do you have it?
Do not want it
Yes Yes NoNo
Cannot afford it


Sample of 2000 adults (20 years +), randomly chosen from residents’ register all over Japan
1350 responses (response rate = 67.5%)
For 28 items, asked respondents whether they thought it is “necessary” to live normally in Japan

%answering"Definitely
" wtdItems
1 To be able to see a doctor 88.6%2 To be able to see a dentist 86.8%3 Telephone 86.6%4 Pension premiums to prepare for retirement 74.0%5 Insurance for death, accidents, illness, etc. 71.9%6 Education upto High school level 71.7%7 Family's own bath (inc. shower) 67.1%8 Heaters/ Coolers (air conditioner etc.) 66.9%9 Books, magazines for children 66.8%
10 Family's own toilet 65.8%11 Family's own kitchen 64.9%12 Hot water heater (for kitchen and wash basin) 64.5%13 Attending relative's weddings, funerals, etc.
(including giving gifts) 58.5%14 Micro-wave oven 57.9%15 Transportation cost to see friends, family, relatives. 57.8%16 New underwear at least once a year 57.5%17 Separate bedroom from the living space 56.9%18 Parents participating school event 55.8%19 To be able to save every months even a little 54.4%20 Special suits for occasions (funerals, weddings, etc.) 50.3%21 Suits for work and interviews 49.5%
Items
22 Multiple bedrooms (for families larger than a couple) 48.1%23 Celebrating a birthday 47.2%24 Pocket money 45.8%25 Bicycle (or tricycle) 44.7%26 Mobile phone (incl. PHS) 40.7%27 New Year's celebration(such as Osechi - a special meal for the
new year's day) 35.7%28 Xmas present 33.9%29 Child's own room 33.7%30 Education upto University or J unior university 33.7%31 Fruits at least once a day 33.6%32 Socializing with others through sports, hobbies 33.4%33 Video player 31.5%34 New clothes and shoes every year (not a second- hand)
28.4%35 Toys such as sports equipment and games 26.1%36 Participating neighborhood clubs, child clubs, 23.5%37 Eating out 2,3 times a month 22.6%38 Lessons (hobby, sports, etc.) 21.9%39 Family trip of more than 1 night at least once a year 20.8%40 Access to the internet 18.9%41 J uku (private tutoring classes) 16.2%42 Walkman, CD/ MD Player, etc. 14.7%

Item JAPAN
UK
Toys (that most of other kids have, such as dolls, blocks, soccer ball, baseball etc.)
12.4% 84%*
Bicycle (including second-hand) 20.9% 55%
At least one pair of shoes (not second-hand) 40.2% 94%
Clothes (not second-had) 33.7% 70%
Own books 51.2% 89%
To be able to go to dentists (including check-ups) 86.1%
Australia94.7%*** UK question: “Toys (e.g. dolls, teddies)
** Australia : Community Understanding of Poverty and Social Exclusion Survey 2006 in Saunders et al. (2007)Data: Japan Child Necessity Survey 2008 in Abe (2008), UK Office for National Statistics Omnibus Survey 1999, in Gordon et al. (2000)

Pension
Insurance
Savings
Internet
Family Trip
Family Own Toilet
1st quintile (poorest)
5th
qu
intile
(rich
est)
% saying “Definitely required”: 1st quintile vs. 5th quintile

Junior high school (9 yrs of education)
Colle
ge o
r ab
ove
(12
+
)
00.10.20.30.40.50.60.70.80.9
1
0 0.1 0.2 0.3 0.4 0.5 0.6 0.7 0.8 0.9 1
大卒
中卒
図9 「絶対に必要」とする人の割合:中卒 vs. 大卒
Internet
telephone
Dentist
Neighborhood clubs
MobileSuits
Wedding
% saying “Definitely required”: College grads vs. Mandatory education only

00.10.20.30.40.50.60.70.80.9
1
0 0.1 0.2 0.3 0.4 0.5 0.6 0.7 0.8 0.9 1
女性
男性
図17 「絶対に必要」とする人の割合:男性 vs. 女性
Men
Wom
en
Microwave
Video player
Separate bedroom
fruits
Mobile
% saying “Definitely required”:
men vs. women

00.10.20.30.40.50.60.70.80.9
1
0 0.1 0.2 0.3 0.4 0.5 0.6 0.7 0.8 0.9 1
町村
13大都市
図19 「絶対に必要」とする人の割合:大都市 vs. 町村
町内会などへの参加
複数の寝室
インターネット
ビデオ
寝室と食卓が別 冠婚葬祭
専用浴室
冷房・暖房
家族旅行
Living in Largest 13 cities
Livin
g in
Villa
ge
Neighborhood clubs
Dentist
Internet
Multiple bedrooms
wedding
Family’s own bathroom
Family trip
% saying “Definitely required”: those living in village vs. those living in large cities

00.10.20.30.40.50.60.70.80.9
1
0 0.1 0.2 0.3 0.4 0.5 0.6 0.7 0.8 0.9 1
70歳
以上
30歳未満
図15 「絶対に必要」とする人の割合:30歳未満 vs. 70歳以上
地域社会に参加
果物 正月祝
複数の寝室
冠婚葬祭
電話
インターネットビデオデッキ
携帯電話
医者
スーツ貯金
新しい下着
冷暖房
死亡保険
年金保険
趣味の交流
外食
寝室と食卓別
家族旅行
Below 30 years old
Ab
ove
70
years o
ld
Internet
telephone
Doctor
Neighborhood clubs
MobileVideo
pl.
Wedding
% saying “Definitely required”: Above 70 years old vs. Below 30 years old


Sample of 2000 adults (20 years +), randomly chosen from residents’ register all over Japan
1520 responses (response rate = %)

Table 1 Socially Perceived Necessities and Their Diffusion Rate
Socially Perceived Item Diffusion Rate Deprivation rate
Microwave oven 98.4% 1.6%Heating and cooling equipment (air conditioners, gas or electric heaters,kotatsu, etc.) 99.1% 0.9%
Water heating equipment 96.4% 3.6%Attending family and relative's wedding/ funerals/ etc. (including travel andgift expenses) 97.2% 2.8%
Telephone 97.9% 2.1%Attire for special occasions (reifuku) 97.2% 2.8%New underwear more than once a year 92.2% 7.8%
Being able to go to a doctor when needed 98.2% 1.8%
Being able to go to a dentist when needed 97.2% 2.8%
Being able to enrol in life, disability or sickness insurance 91.9% 8.1%
Being able to save for old age 93.9% 6.1%Being able to save money every month 75.0% 25.0%
Have a toilet for the family's own use (not shared with other dwellings) 98.8% 1.2%
Have a kitchen for the family's own use (not shared with other dwellings) 98.9% 1.1%
Have a bathroom for the family's own use (not shared with other dwellings) 97.8% 2.2%
Have a bedroom different from living (eating) room 95.0% 5.0%
* Deprivation rate = 100% - Diffusion rate
*Diffusion rate = the rate of those possessing the item among the entire sample minus those who do not want topossess the item
HouseholdDurables
SocialActivities
SocialSecurity
HousingConditions

Table 2 Distribution of Deprivation Score
Score (X) n % Accumulative%
% lackingmore than X
items
0 990 65.1% 65.1%1 312 20.5% 85.7% 34.9%2 80 5.3% 90.9% 14.3%3 61 4.0% 94.9% 9.1%4 27 1.8% 96.7% 5.1%5 17 1.1% 97.8% 3.3%6 13 0.9% 98.7% 2.2%7 10 0.7% 99.3% 1.3%8 6 0.4% 99.7% 0.7%9 2 0.1% 99.9% 0.3%
10 1 0.1% 99.9% 0.1%11 1 0.1% 100.0% 0.1%
samle size 1520Average 0.713Std.Dev. 1.403

Table 3 Deprivation rate of Different groups 20s with spouse 54 51.9%20s without spouse 22 54.5% 0.05
n Deprivation rate χ 2 30s with spouse 186 28.5%Entire sample 1520 34.9% 30s without spouse 32 53.1% 7.60 ***
Low- income households (*1) 350 50.3% 47.62 *** 40s with spouse 258 31.4%Age of Household Head 40s without spouse 45 55.6% 9.83 ***
20s 76 52.6% 50s with spouse 297 29.0% 30s 218 32.1% 50s without spouse 61 47.5% 8.02 ***
40s 303 35.0% 60s with spouse 275 28.0% 50s 358 32.1% 60s without spouse 68 45.6% 7.82 ***
60s 343 31.5% Over 70 with spouse 169 39.6% Over 70 222 41.0% 17.87 *** Over 70 without spouse 53 45.3% 0.53Marital Status Single household (*2) 118 56.8% 27.05 ***
With Spouse 1239 31.6% Single female household 74 54.1% 12.03 ***
Without Spouse 281 49.1% 30.79 *** Single male household 44 61.4% 15.16 ***
Female with spouse 401 30.2% Elderly household (*3) 533 34.3% 0.10 Female without spouse 177 49.2% 19.20 *** Single elderly household 55 58.2% 13.66 ***
Male with spouse 832 32.6% Single female elderly household 41 56.1% 7.75 ***
Male without spouse 104 49.0% 11.47 *** Single male elderly household 14 64.3% 5.72 **
Disabled household (*4) 67 61.2% 20.99 ***
Household with children (*5) 435 36.6% 0.76Single- mother household (*6) 19 73.7% 12.76 ***
*1 Households with incomes less than 50% of median income*2 Households with only one person *3 Households with household head aged more than 60 years old*4 Households which has one or more disabled person*5 Households which has one ore more children aged less than 16*6 Households which has one ore more children aged less than 16, andwhose household head is single

0
0.02
0.04
0.06
0.08
0.1
0.12
0.14
0.16
0.18
0.2
0 200 400 600 800 1000 1200 1400 1600 1800 2000
Dep
riva
tion
Inde
x
Income(10,000yen)
Graph 1 Average Relative Deprivation Index by Income Strata

0
0.2
0.4
0.6
0.8
1
1.2
0 200 400 600 800 1000 1200 1400 1600
Dep
rivat
ion
Rat
e
Income (10,000 yen)
Graph 2 Frequency of deprivation: working age vs. elderly
Working Age
Elderly

0
0.05
0.1
0.15
0.2
0.25
0 100 200 300 400 500 600 700 800 900 1000
Ave
rage
dep
rivat
ion
scal
e
Income (10,000 yen)
Graph 3 Depth of Deprivation: Working age vs. Elderly(Average Deprivation scale for those whose Dep.Scale > 0)
Working age
Elderly

Why Deprivation approach? Assumption that most households consist
of nuclear families- Not the case in Japan -> raises questions re: equivalence adjustment
Presence of multi-generational hh Deprivation approach: direct measurement
of living standard, not relying on assumptions on resource sharing within families Slides 25-XX: Saunders, Peter & Abe, Aya. 2009. “Poverty and Deprivation in Young and Old: A Comparative Study of Australia and Japan.” Poverty and Public Policy, Vol.2, Iss.1, Article 5 (2010).

AustraliaCommunity
Understanding of Poverty and Social Exclusion (CUPSE) survey, 2006, Social Policy Research Centre (Saunders, Naidoo and Griffiths, 2007).
N=2,700
JapanThe Social Living
Survey, 2003, NIPSSR (Abe 2006)
N=1,520

Do we use the same list of items?-> how do we account for
differences in what is considered “necessary”?
Do we use the items selected using the same methodology?
What UNIT of comparison do we use?

Table 4: The Overall Incidence of Deprivation (unweighted percentages)
AUSTRALIA JAPAN
Domain/Item Incidence
(%)
Domain/Item Incidence
(%) Health/Basic Needs Health/Basic Needs Medical treatment if needed 2.0 To be able to see a doctor 1.8
Dental treatment if needed 13.9 To be able to see a dentist 2.7
Able to buy prescribed medicines 3.9 New underwear at least once a year 7.4
Warm clothes and bedding 0.2
A substantial daily meal 1.1
Accommodation/Facilities Accommodation/Facilities
A decent and secure home 6.6 Family's own toilet 1.2
Secure locks on doors & windows 5.1 Family's own kitchen 1.1
Roof and gutters that do not leak 4.6 Hot water heater (for kitchen) 3.4
Furniture in reasonable condition 2.6 Family's own bath (inc. shower) 2.2
Heating in at least one room 1.8 Heaters/coolers 0.9
A washing machine 0.8 Micro-wave oven 1.5
Home contents insurance
9.5
Separate bedroom from living space
4.9 Security/Risk Protection Security/Risk Protection
Up to $500 in emergency savings 17.6 Pension premiums for retirement 4.1
Full motor vehicle insurance 8.6 Insurance for death, illness, etc. 7.8
To be able to save every month 25.0
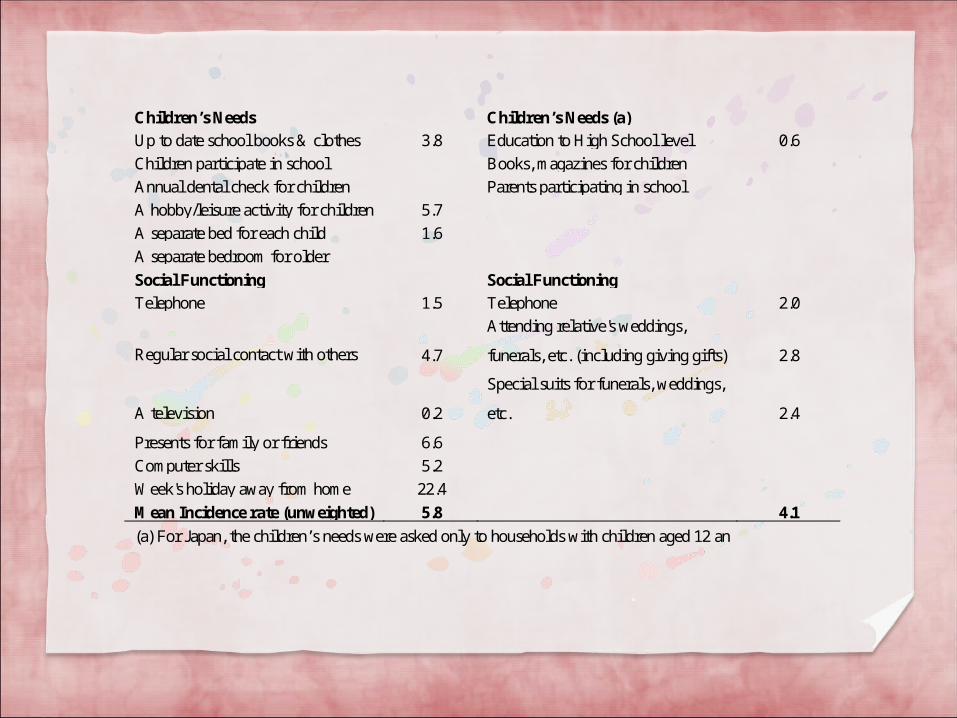
Children’s Needs Children’s Needs (a)
Up to date school books & clothes 3.8 Education to High School level 0.6
Children participate in school
activities and outings
3.5
Books, magazines for children
0.3 Annual dental check for children
9.1
Parents participating in school
events
0.6 A hobby/leisure activity for children 5.7
A separate bed for each child 1.6
A separate bedroom for older
children
6.1
Social Functioning Social Functioning
Telephone 1.5 Telephone 2.0
Regular social contact with others
4.7
Attending relative's weddings,
funerals, etc. (including giving gifts)
2.8
A television
0.2
Special suits for funerals, weddings,
etc.
2.4
Presents for family or friends 6.6
Computer skills 5.2
Week's holiday away from home 22.4
Mean Incidence rate (unweighted) 5.8 4.1
(a) For Japan, the children’s needs were asked only to households with children aged 12 an

Table 1: Household Types and Sample Composition
Household type
Australia Japan
Sample size % Sample size %
Single, working-age (WA; 20-64) 202 8.0 66 4.4
Single, older person (OP; 65+) 158 6.2 43 2.8
Couple and other adults, head is
WA, no children (a)
942 (502) 37.1 692 (463) 45.7
Couple and other adults, head is
OP, no children (a)
390 (309) 15.3 282 (137) 18.6
Couple and other adults, head is
WA, with children (a) (b)
736 (576) 29.0 414 (331) 27.3
Sole parent, WA with children 113 4.4 17 1.1
Total 2,541 100.0 1,514 100.0
Notes: (a) Numbers in brackets refer to couples only (i.e. no other adults living in the household); (b)
This group contains a small number of households (15 in Australia and 6 in Japan) where the head is an
older person.

Table 6: Deprivation Indicators by Household Type
AUSTRALIA JAPAN
Household
type
Mean
score
(MDS)
D = 0
(%)
D ≥ 1
(%)
D ≥ 2
(%)
Mean
score
(MDS)
D = 0
(%)
D ≥ 1
(%)
D ≥ 2
(%)
Single, working-age (WA) 2.1 4.8 5.2 3.9 1.80 3.8 6.2 3.3
Single, older person (OP) 1.3 6.2 3.8 2.7 1.35 4.4 5.6 2.6
Couple and other adults, head
is WA, no children 1.1 6.6 3.4 2.3 0.59 7.1 2.9 1.1
Couple and other adults, head
is OP, no children 0.6 7.5 2.5 1.4 0.58 6.4 3.6 1.1
Couple and other adults, head
is WA, with children 1.4 6.0 4.0 2.7 1.41 6.5 3.5 1.6
Sole parent, WA with
children 3.9 2.6 7.4 5.9 2.65 1.8 8.2 6.5
Total 1.3 6.2 3.9 2.7 0.73 6.5 3.5 1.5
Notes: See Notes to earlier Tables.

The number of items differs between JP and AUS, thus comparison of the absolute values of MDS or % of deprivation do not mean much. Instead, we need to look at patterns and ordering of family types within each country.
Similarities: Sole parents are the most deprived, followed by WA singles, WA with children. Least deprived are older couples, WA couples w/o children, older singles.

① Elderly single vs. WA single ( AUS ) << ( JP ) <<
② Elderly single vs. Elderly couple ( AUS ) >>
( JP ) >>③ WA single vs. WA couple w/o children
( AUS ) >> ( JP ) >>
④ WA couple with children vs. WA couple w/o children ( AUS ) > ( JP ) >>
⑤ WA couple with children vs. Lone parents ( AUS ) << ( JP ) <<

Table 7: Overlap Analysis and Consistent Poverty (percentages)
AUSTRALIA JAPAN Household
type Poverty
rate
(P)
Deprivation
rate (D)
(D ? 2)
P and
D
Neither
P nor
D
Poverty
rate
(P)
Deprivation
rate (D)
(D ? 2)
P and
D
Neither
P nor
D
Single, working-age
(WA)
10.8
39.7
8.2
57.7 17.7 32.3 13.9 62.9
Single, older person
(OP)
11.6 29.5 7.8 66.7 25.7 20.0 11.4 65.7
Couple and other
adults, head is WA,
no children
13.8
23.8
7.7
70.2 11.2 11.2 4.3 81.9
Couple and other
adults, head is OP, no
children
23.1
14.9
7.0
69.0 20.4 11.0 4.5 73.1
Couple and other
adults, head is WA,
with children
11.5
26.0
7.0
69.0 12.3 16.6 6.1 77.3
Sole parent, WA with
children
22.4
57.9
14.0
33.6
47.1
64.7
41.2
29.4
Total 14.5 26.4 7.7 66.8 14.3 14.6 5.9 77.0
Notes: See Notes to earlier Tables.

Le us define Low income & D<=2 to be consistent poverty
Aus: Consistent poverty is spread evenly at around 8% across all households (except sole parent hh).
Jp: the differential is very large across different household types; strikingly high in elderly singles & sold parents

The ranking of poverty as measured by income differs between AUS-JP, but it is very similar if poverty is measured by deprivation. Perhaps deprivation captures the “real”
occurrence of poverty which is shared among countries?
From the overlap analysis, consistent poverty is more concentrated in Japan.


Sample of 1600 adults (20 years +), randomly chosen from the residents’ register in the southern Kawasaki CityKawasaki is located between Tokyo and
Yokohama, a part of industrial belt.The southern part host many factories, and
the city received influx of migrant laborers from rural sections of Japan.
584 responses (response rate = 36.5%)

It should capture economic impoverishment not only by income, but also by material deprivation
It should capture how an individual is excluded (forced out) from various public constructs within a society, e.g. public schemes such as public pension and public health insurance, public services such as transportation and utilities, and public spaces such as libraries and sports facilities
It should capture exclusion from private spheres, e.g. lack of social relations (communication with others, meeting family obligations, doing activities with others) and social networks (support in need)
it should measure degree of individual’s involvement with society, e.g. social participation such as participation in local communities (neighborhood organizations, women’s clubs, PTA, etc.), civic activities (voting, political involvement, etc.), and personal communities (alumni clubs, sports and hobby circles, etc.)
These should enforced lack, rather than preference.
It should not only capture the enforced lack due to economic constraints, but also due to other constraints (health, family, work, social, etc.), and should be able to distinguish them

1. (lack of ) basic human needs, 2. material deprivation,3. exclusion from systems and services, 4. (lack of) leisure and social
participation,5. inadequate housing, 6. (lack of ) social relation, 7. subjective poverty, and 8. income poverty

Almost all items were asked whether they “are wanted but cannot be obtained”, “not wanted (or not interested)” or “are obtained”.
For most of items, the survey also asks “the reason” why that item cannot be obtained : Economic, family, work, health, other reasons.

Very few indicate economic reasons for not being able to participate in social activities
Family/Work reasons is most often cited.
Economic Resons
Familyor workreasons
HealthReasons
Otherreaons
Holiday Less than 1 overnight fami ly trip a year (exludes not interested)35.1% 16.4% 18.4% 5.0% 5.0%
Eating out Less than 1 eating-out a month (exludes not interested)37.4%
Social activitiesCannot participate in more than 1 item among 6below (excludes not interested)
66.1%
Neighborhood groups, PTA, women's or senior groups 38.6% 1.7% 23.4% 5.9% 9.3%
Volunteer and charity activities 49.1% 2.6% 31.0% 7.2% 10.3%
Hobby or sports 26.2% 3.3% 16.5% 5.9% 3.3%
Rel igious groups 6.9% 0.5% 2.2% 1.6% 2.1%
Political groups 12.2% 1.4% 5.0% 3.1% 3.3%
Labor unions 20.6% 1.2% 6.8% 2.6% 9.3%
6.Lack of Social Participation

Threshold for determining those who are "excluded" are decided by the author so that the exclusion rate will be 10 to 20% of the respondents.
Dimensions n # items Average Std. Dev.Threshold(# items)
%
Lack of Basic Needs 584 3 0.106 0.227 1 20.9%Material Deprivation 584 10 0.022 0.095 1 9.9%Exclusion from Systems 584 10 0.141 0.173 4 11.0%Lack of Social Participation 584 9 0.075 0.166 4 10.8%Housing Deprivation 584 6 0.061 0.139 2 11.8%Lack of Social Relations 584 8 0.247 0.210 4 17.6%Subjective Poverty 584 3 0.237 0.310 2 18.0%Income poverty 456 1 479.8 338.457 198 11.6%
Social ExclusionIndexes
(standarized)
Percentage ofRespondents who are
Excluded

Almost none stated economic reasons“Access” is most often cited reason.
Economic Resons
Familyor workreasons
HealthReasons
Otherreaons
1) Voting in Elections"Never""Almost none" (total 16.8%) , except thosewho are not interested (9.6%)
7.2% 4.0% 1.4% 1.9%
2) Pension Insurance Not subscribing to either public nor private pension 9.2%
3) Health InsuranceNot subscribing to either public nor private healthinsurance
4.3%
4) Publ ic Service andfacilities
Cannot use at least 1 of below services and facilities 45.2%Economic Resons
Access orfacili tyreasons
HealthReasons
Otherreaons
Publ ic libraries 25.4% 0.0% 11.6% 2.2% 11.6%Publ ic sports facili ties (public pool, etc.) 32.4% 1.5% 16.1% 4.5% 10.3%
Publ ic offices 7.6% 0.0% 2.6% 1.2% 3.8%
Publ ic health centers 16.5% 0.0% 4.5% 2.1% 9.9%
Community centers, chonaikai centers, etc. 14.2% 0.2% 5.1% 2.2% 6.7%
Publ ic parks 10.7% 0.2% 4.1% 2.1% 4.3%Publ ic transportation (bus, train, etc.) 4.0% 0.2% 0.9% 1.0% 1.9%
5) Public utilities Utilieis (E lectricity, Gas, Water) 7.0% 7.0%
3.Exclusion from Systems

n
Overall 584 0.116 0.209 0.099 0.118 0.180 0.110 0.108 0.176
Men 290 0.117 0.228 0.114 0.114 0.224 ** 0.093 0.152 *** 0.200
Women 294 0.116 0.190 0.085 0.122 0.136 0.126 0.065 0.153
Age Group :(*1)
20-29 113 0.137 0.195 0.097 0.168 * 0.106 * 0.106 0.106 0.097 **
30-39 105 0.082 0.210 0.124 0.095 0.190 0.105 0.076 0.124
40-49 87 0.059 0.149 0.069 0.092 0.241 0.080 0.149 0.126
50-59 100 0.092 0.230 0.110 0.180 * 0.260 ** 0.080 0.260 ** 0.160 *
60-69 96 0.111 0.271 0.104 0.083 0.177 0.083 0.094 0.188
Over 70 83 0.226 *** 0.193 0.084 0.072 0.108 * 0.217 *** 0.289 *** 0.060
Household Type:(*1)
Single Elderly Women 12 0.571 *** 0.250 0.000 0.000 0.083 0.167 0.000 0.083
Single Elderly Men 11 0.000 0.182 0.273 * 0.182 0.273 0.091 0.273 * 0.273
Single Working Age Women 43 0.023 0.093 * 0.163 0.395 *** 0.023 ** 0.163 0.047 0.116
Single Working Age Men 54 0.130 0.407 *** 0.259 *** 0.370 *** 0.222 0.074 0.278 *** 0.222 Households with Children(*2)
121 0.116 0.157 0.083 0.041 *** 0.182 0.083 0.083 0.107 **
Working Status
Working 361 0.069 *** 0.188 0.097 0.122 0.202 * 0.097 0.116 0.158
Not Working (Housewife) 98 0.136 0.214 0.061 0.071 0.102 ** 0.082 0.071 0.133
Not Working (Retired) 36 0.083 0.167 0.056 0.028 * 0.174 0.056 0.000 ** 0.194
Not Working (other) 86 0.295 *** 0.291 ** 0.174 ** 0.186 ** 0.221 0.209 *** 0.151 0.302 ***
E ducation: (*3)
J unior High School 95 0.194 ** 0.326 *** 0.179 *** 0.189 ** 0.253 ** 0.158 * 0.147 0.326 ***
High School 185 0.113 0.238 0.124 0.103 0.200 0.119 0.097 0.168
Specialty school 44 0.086 0.182 0.045 0.045 0.159 0.045 0.114 0.159
J unior College 103 0.092 0.175 0.068 0.107 0.136 0.117 0.117 0.146
College 138 0.092 0.116 *** 0.065 0.123 0.145 0.065 *** 0.094 0.094 ***
Lack of SocialParticipation
Lack of SocialRelations
IncomePoverty
Lack of BasicNeeds
MaterialDeprivation
HousingDeprivation
SubjectivePoverty
Exclusion fromSystems
Share of Respondents Excluded, by key social variables

(Gender) Men show higher rate of exclusion than women
(lack of social participation and subjective poverty) Same as PSE (social participation), but even more
so.(Age Group) The income poverty shows an U shape curve, but
it does not seem to translate directly to Lack of Basic Needs and Material Deprivation.
Those at 50’s seem to be at higher risk of many dimensions of S.E., e.g. Housing, Subjective poverty, Lack of Social Participation, Lack of Social Relations Concurs with the fact that the suicide rate for men
peaks at age 50-59. & 95% of homeless persons are men, a half of which are in their 50s.
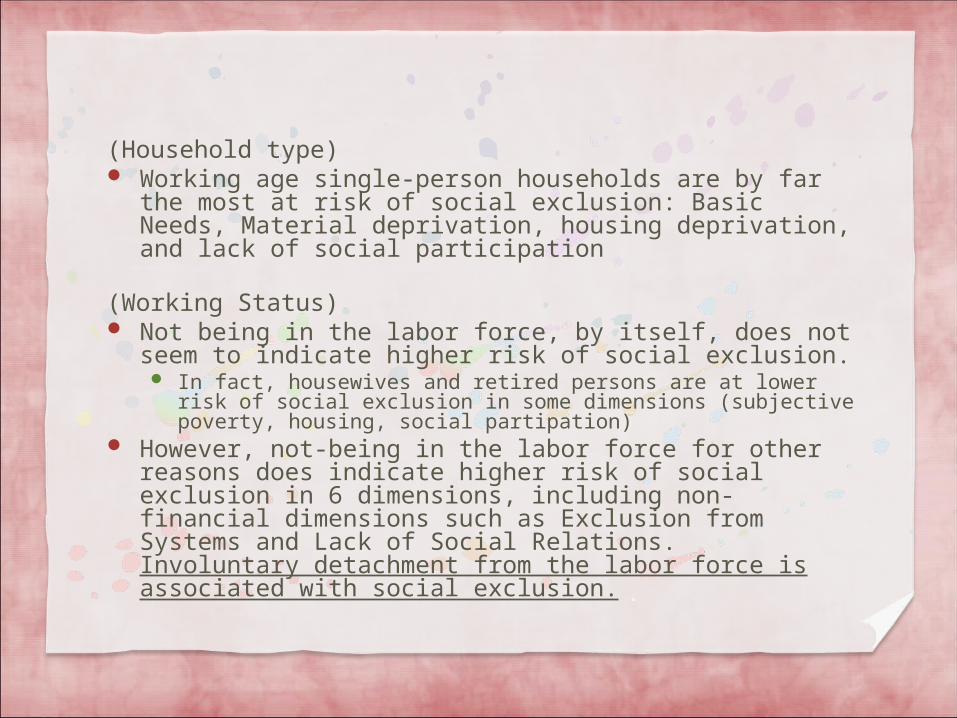
(Household type) Working age single-person households are by far
the most at risk of social exclusion: Basic Needs, Material deprivation, housing deprivation, and lack of social participation
(Working Status) Not being in the labor force, by itself, does not seem
to indicate higher risk of social exclusion. In fact, housewives and retired persons are at lower risk
of social exclusion in some dimensions (subjective poverty, housing, social partipation)
However, not-being in the labor force for other reasons does indicate higher risk of social exclusion in 6 dimensions, including non-financial dimensions such as Exclusion from Systems and Lack of Social Relations. Involuntary detachment from the labor force is associated with social exclusion.

(Education Level) Low education attainment (up to Junior high
school = age 15, the compulsory education in Japan) is a strong link to social exclusion, not only for financial dimensions (income poverty, lack of basic needs, material deprivation, housing deprivation), but also for non-financial dimension s (exclusion from systems, lack of social relations).
High education attainment (college+) is associated with lower risk of social exclusion (systems, and basic needs)

Outside Japan, there are many studies linking childhood poverty to adult outcomes.
However, in Japan, there are very few studies connecting earlier life disadvantages and poverty and/or social exclusion, since there has not been much accumulation of panel data sets. The studies using the Japanese Panel Survey of
Consumers (JPSC) , the only long enough panel data set, has shown those who divert from “standard life course”, such as those who divorce and who do not marry, are more prone to becoming poor (Iwata & Nishizawa 2005). However, JPSC only covers women in a certain cohort.

The survey was designed to capture major disadvantageous events (Independent variables): childhood poverty, divorce, prolonged illness or injury, involuntary lay-off.
Outcome (Dependent) variables include both financial poverty as well as social exclusion.
Control variables are : current income, sex, age class, single-elderly, current household type (has children, single-person household), current working status.

Results of Regression for Social Exclusion Indexes
E quiv.HH Income -0.0212 *** -0.0034 ** -0.0053 * -0.0455 *** -0.0006 -0.0091 * -0.0084 **
Sex (M=1, F=0) 0.0178 -0.0024 -0.0277 ** 0.05808 ** -0.0239 0.02293 0.04411 ***
20-29 yr old (*1) -0.0050 -0.0170 * -0.0079 -0.082 * 0.0122 -0.0219 0.0072
40-49 yr old (*1) -0.0399 -0.0233 ** -0.0190 0.0301 -0.0543 * -0.0538 0.0093
50-59 yr old (*1) -0.0089 -0.0202 * 0.0002 0.0848 * -0.0276 0.0445 0.0163
60-69 yr old (*1) -0.0125 -0.0135 -0.0166 -0.0166 -0.0371 -0.069 * -0.0157
70-79 yr old (*1) 0.0052 0.0089 -0.0008 0.0130 0.0367 0.0747 * 0.0014
Over 80 yrs (*1) -0.0750 -0.0243 -0.0429 -0.0910 0.0602 0.1111 * -0.0809 *
Single-person Household 0.0299 0.0246 ** 0.1034 *** 0.0090 -0.0077 -0.0158 0.0356 *
Single Elderly -0.0395 -0.0289 -0.1164 *** 0.0851 0.0298 0.0397 0.0397
Work Status(Working=1, NW=0)0.0062 0.0098 0.0073 0.0388 0.0429 ** 0.0396 -0.0071
L iving with Children -0.0256 -0.0007 0.0041 -0.0059 0.0213 -0.0132 -0.0154
E xperienced Sickness and I njury-0.0019 0.0013 0.0051 -0.0041 0.0533 *** 0.0097 -0.0050
E xperienced Divorce 0.0727 * -0.0061 0.0616 *** 0.0354 0.0389 0.0343 -0.0295
E xperienced Lay-Off 0.0444 0.0348 *** 0.0686 *** 0.1546 *** 0.0515 ** 0.0844 *** 0.0449 **
L iving status at Age 15 0.1346 *** 0.0082 0.0204 0.0119 -0.0027 0.0453 0.0305
Intercept 0.14645 *** 0.02554 0.05771 *** 0.3003 *** 0.10824 *** 0.22127 *** 0.06733 ***
Adj.R2 0.0815 0.0453 0.1624 0.1115 0.0311 0.0754 0.0423(*) Asterisk represents results of chi-square statistics of the group and all others. :*** statistically significant at 1%, ** at 5%, * at 10%(*1) base 30-39 yr old
Lack of SocialRelations
Exclusionfrom Systems
Lack of BasicNeeds
MaterialDeprivation
HousingSubjectivePoverty
Lack of SocialParticipation

(Lay-off) Having experience of a lay-off has positive and
significant effect on current material deprivation, housing deprivation, lack of social participation, lack of social relations, exclusion from systems and subjective poverty, even after controlling for current income, age, sex, working status, and household type.
(Divorce) Having experience of divorce has positive and
significant effect on basic needs and housing deprivation, even after controlling for current marital status (single-person hh).
(Prolonged illness and injuries) Having experience of prolonged illness and
injuries (which caused one to be out of work or school for more than one month) has positive and significant effect on exclusion from systems.
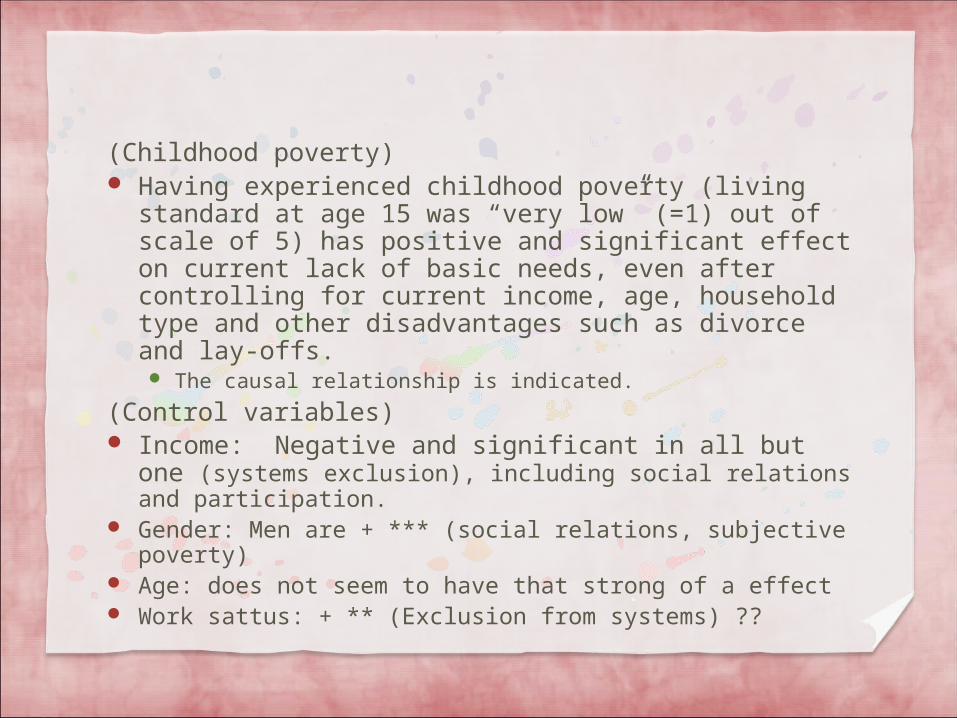
(Childhood poverty) Having experienced childhood poverty (living
standard at age 15 was “very low” (=1) out of scale of 5) has positive and significant effect on current lack of basic needs, even after controlling for current income, age, household type and other disadvantages such as divorce and lay-offs. The causal relationship is indicated.
(Control variables) Income: Negative and significant in all but one
(systems exclusion), including social relations and participation.
Gender: Men are + *** (social relations, subjective poverty)
Age: does not seem to have that strong of a effect Work sattus: + ** (Exclusion from systems) ??

Sections of population most vulnerable to income poverty is not most vulnerable to social exclusion. Possible “new” vulnerable group: men in their
50s. Disadantages in earlier stages of life seem to exhort
influences on some aspects of current social exclusion, even after controlling for current income, work status, household type, etc. The catch-phrase of the former PM Abe “a society
in which one can re-challenge” DOES NOT seem to hold.
Childhood poverty seems to have irrevocable continuing effect on adult well-being not only via education and occupation (and thus income), but by another path.